Abstract
This study systematically analyzed research trends and hot issues in the field of geological hazard prediction using bibliometric analysis methods. A total of 12,123 related articles published from 1976 to 2023 were retrieved from the Web of Science (WOS) and China National Knowledge Infrastructure (CNKI) databases. Co-occurrence analysis and burst detection were conducted on the literature using the VOSviewer and CiteSpace tools to identify the research trends in geological hazard monitoring technologies. The results reveal that “data fusion”, “landslide identification”, “deep learning”, and “risk early warning” are currently the main research hot spots. Additionally, the combined application of Global Navigation Satellite System (GNSS) and Real-Time Kinematic (RTK) technologies, as well as GNSS and Long Short-Term Memory (LSTM) models, were identified as important directions for future research. The bibliometric perspective offers a systematic theoretical framework and technical guidance for future research, thereby facilitating the sustainable advancement of safety, security, and disaster management.
1. Introduction
Geological hazards are among the most complex, severe, and frequent threats in the world [1]. Complex geological conditions, frequent tectonic activities, and abundant rainfall lead to the widespread occurrence of hazards such as collapses, landslides, mudslides, ground fissures, ground subsidence, and ground collapse in both urban and rural areas [2,3]. On average, these hazards result in over 1000 fatalities and direct economic losses amounting to hundreds of millions of yuan each year [4,5]. In particular, in recent years, driven by extreme weather, newly emerging geological hazards have exhibited increasingly random occurrences, higher concealment, and greater destructiveness, often leading to chain reactions of geological hazards that result in significant casualties [6,7]. This poses a particular threat to safety in mountainous villages and engineering projects, further increasing the difficulty of identifying hazards risks and the accuracy of predictions.
The occurrence of geological hazards requires specific formative conditions, and the geological processes that lead to hazards need to be triggered by certain dynamic forces, which can be either natural or anthropogenic [8,9]. Changes in the conditions that induce geological hazards can be accurately monitored, and the effectiveness of geological hazards prevention and control projects must also be assessed through comparative monitoring [10,11]. Therefore, it is essential to adopt real-time monitoring approaches, employing advanced data collection technologies and reliable transmission networks to provide more detailed data for predictions. Consequently, the equipment used for monitoring is crucial for the development of monitoring technologies and methods.
Since the beginning of the 21st century, the growth of multispectral and high-resolution remote sensing satellite imagery, along with field survey data obtained from UAV LiDAR, oblique imagery, and the support of big data technologies, has significantly advanced research in this field [12,13,14,15]. Surface displacement monitoring, underground deformation monitoring, hydrological monitoring, and data collection and alarm devices have been commonly used to monitor the occurrence of geological hazards [16,17,18]. Through dynamic monitoring of geological hazards hazard points, establishing calibration models, and optimizing parameter calculations to identify geological hazards risks [19,20], a threshold range can be established using empirical data. When the dangerous threshold is reached, automatic early warning and forecasting can be initiated, transforming geological hazards prevention from a passive response to an active approach. This provides more time to prevent hazards and achieves significant results in the prevention and control of geological hazards.
The updating of geological hazards monitoring technologies and the accumulation of data are important foundations for scientific research on geological hazards. Analyzing published research findings on geological hazards monitoring worldwide, as well as the current research status and existing technical issues, is of significant importance for clarifying the development trajectory of monitoring methods, obtaining a macro perspective on monitoring results and gaining insights into future research hot spots [21]. Currently, bibliometric and scientometric techniques are well established. In large literature databases, bibliometric visualization analysis methods can quickly organize key information, such as researchers, institutions, and publication volumes, revealing overall research pathways, hot spots, and frontier analyses. These methods have shown diverse perspectives and high credibility in data analysis results, making them useful in various fields, including environmental science [22], architecture [23], biology [24], energy [25] and sociology [26,27]. Therefore, this study used bibliometric analysis results to identify the research hot spots and evolutionary trajectories of geological hazards monitoring since the publication of relevant literature. In conjunction with a further analysis of the literature, this study aimed to systematically outline the evolution trends of research efficiency and academic impact in different regions within this field, providing some references for future research on the prevention and management of geological hazards.
2. Data and Methods
In order to study the current status and development trends of geological hazard monitoring technology, this research utilized two key literature sources in the field of geological hazards research: the China National Knowledge Infrastructure (CNKI) database and the Web of Science (WOS) database. These databases comprehensively cover publicly available academic journals, master’s and doctoral theses, and data from major conferences. Using bibliometric analysis, visual statistics of literature on geological hazard monitoring technologies published between 1976 and 2023 were generated. A professional search was conducted with keywords such as “geological hazard monitoring”, “geological hazard monitoring equipment”, “geological hazard monitoring instruments”, “geological hazard monitoring early warning”, and “geological hazard monitoring forecasting”. The search excluded newspapers, standards, and patents. Table 1 provides the details of the retrieval criteria for geological hazard monitoring literature. To ensure the relevance of the records, each entry from the original databases was screened, resulting in a final dataset of 12,123 articles from both databases, as summarized in Table 1.

Table 1.
Criteria for retrieving geological hazard monitoring literature.
3. Results
3.1. Research Status
3.1.1. Trends in Literature Publication
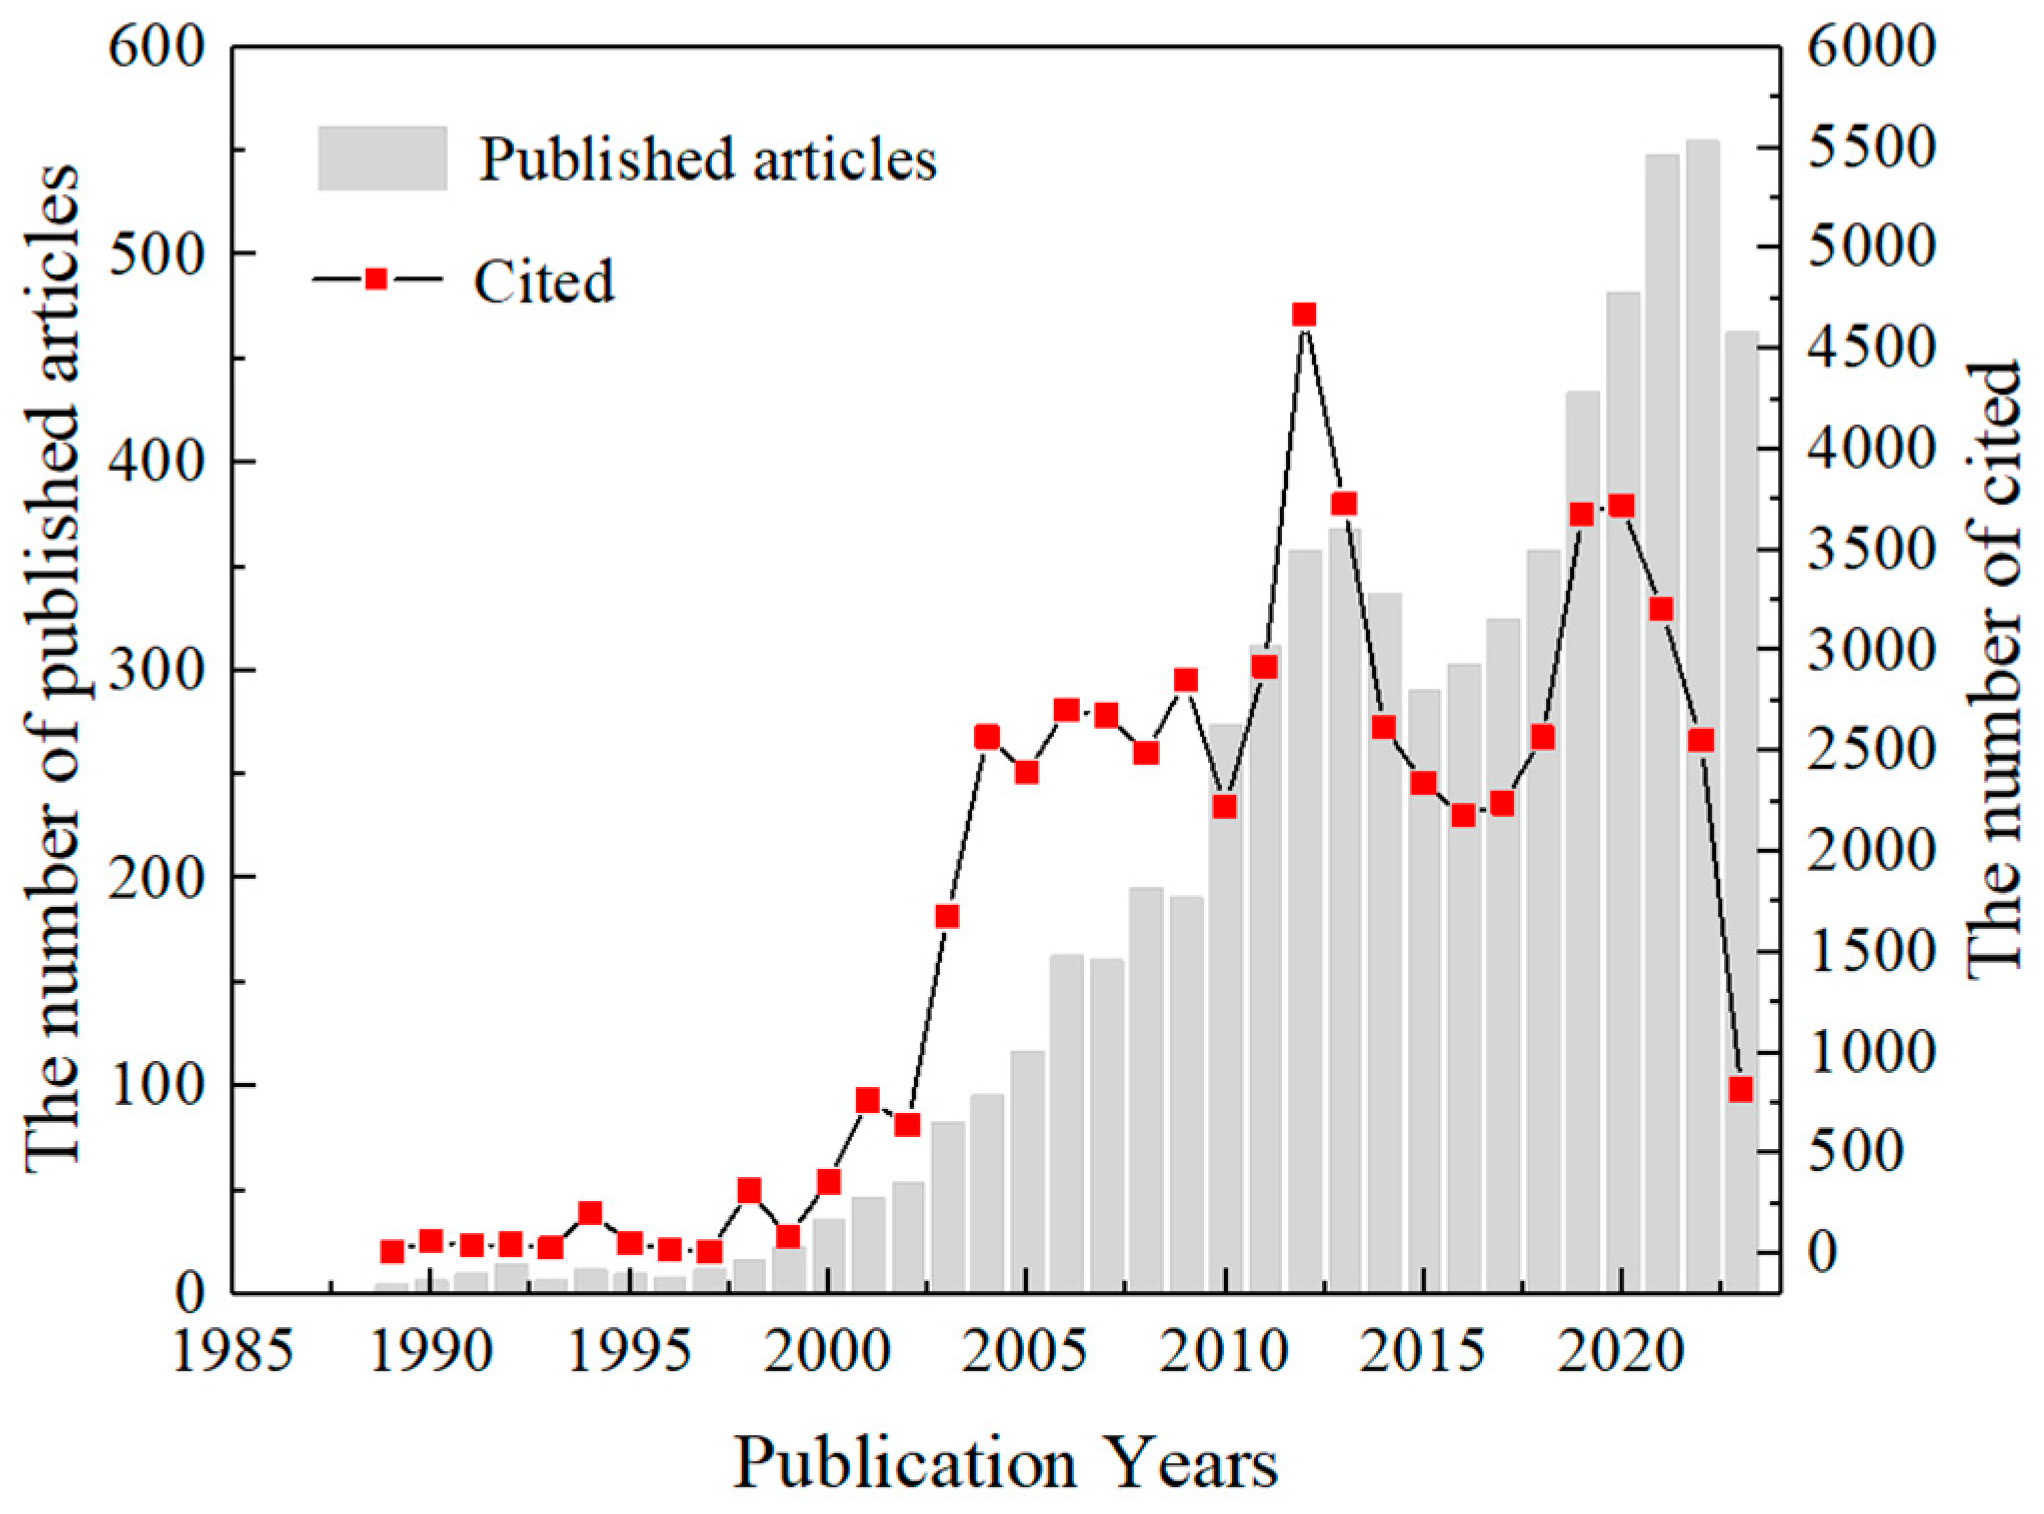
To intuitively showcase the research achievements of geological hazard monitoring technology in hazard prevention and mitigation in China, this study statistically analyzed literature retrieved from CNKI and WOS. The analysis was based on publication volume and average citations per paper from 1976 to 2023, with the resulting trends illustrated in Figure 1.
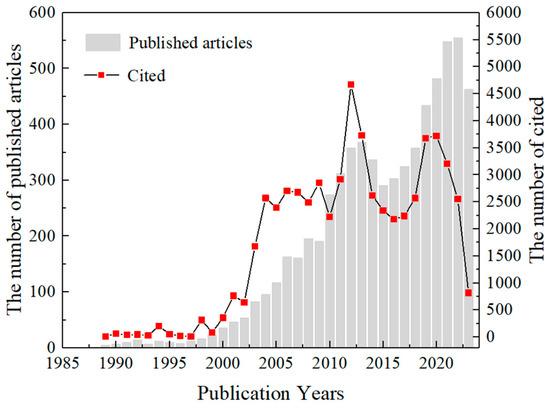
Figure 1.
Distribution of publications and citations in the field of geological hazards detection research from 1976 to 2023.
From the perspective of the number of publications, there is an overall significant upward trend, indicating that researchers and institutions maintain a strong and continuously growing interest in this field. However, two peaks were observed in 2013 and 2022. Since the availability of relevant publications in such databases, research directions have continuously expanded, the research depth has steadily increased, and the focus on geological hazards and studies on prediction technologies has gradually matured. Significant progress has been made in the prevention and mitigation of geological hazards. Since 2013, the frequency of geological hazards in China has significantly decreased, and direct economic losses have been notably reduced. This may have led to a shift in research focus toward other emerging fields, resulting in reduced attention to geological hazard monitoring. From 2015 to 2022, a significant upward trend was again observed, likely due to advancements in remote sensing technology, big data analysis, and increasing policy emphasis on disaster monitoring and response.
The citation frequency of publications largely follows the trend of publication volume. From 2002 to 2004, citations increased significantly, and from 2004 to 2022, the annual citation count remained at a high level of over 2300. This sustained citation activity reflects researchers’ widespread attention to geological hazard monitoring since 2002. Although a significant decline in citation frequency was observed from 2013 to 2016, this may be attributed to numerous innovations in monitoring methods and instruments, as the previous monitoring technologies became less applicable and relevant. From 2017 to 2020, new monitoring technologies gained widespread research attention and application, leading to a rise in citation frequency. Interestingly, after 2019, the number of publications increased, while citation frequency decreased. This could be due to the time lag in publication, as the latest publications of newly cited studies may not yet have been made publicly available.
3.1.2. High-Volume Publication Journals
Between 1976 and 2023, a total of 1288 journals published relevant literature in the field of geological hazard monitoring. Table 2 highlights the top 10 journals based on the number of published articles. Notably, The Chinese Journal of Geological Hazard and Control ranks first with 211 papers, accounting for 4.32% of the total literature. This journal plays a pivotal role as a primary resource for researchers and practitioners in the field. These leading journals not only facilitate the dissemination of knowledge but also promote collaboration among researchers, driving advancements in geological hazard monitoring technologies and methodologies.
Table 2.
Top 10 most active journals in the field of geological hazards detection research from CNKI.
3.2. Main Research Forces
3.2.1. Trends of High-Volume Research Institutions
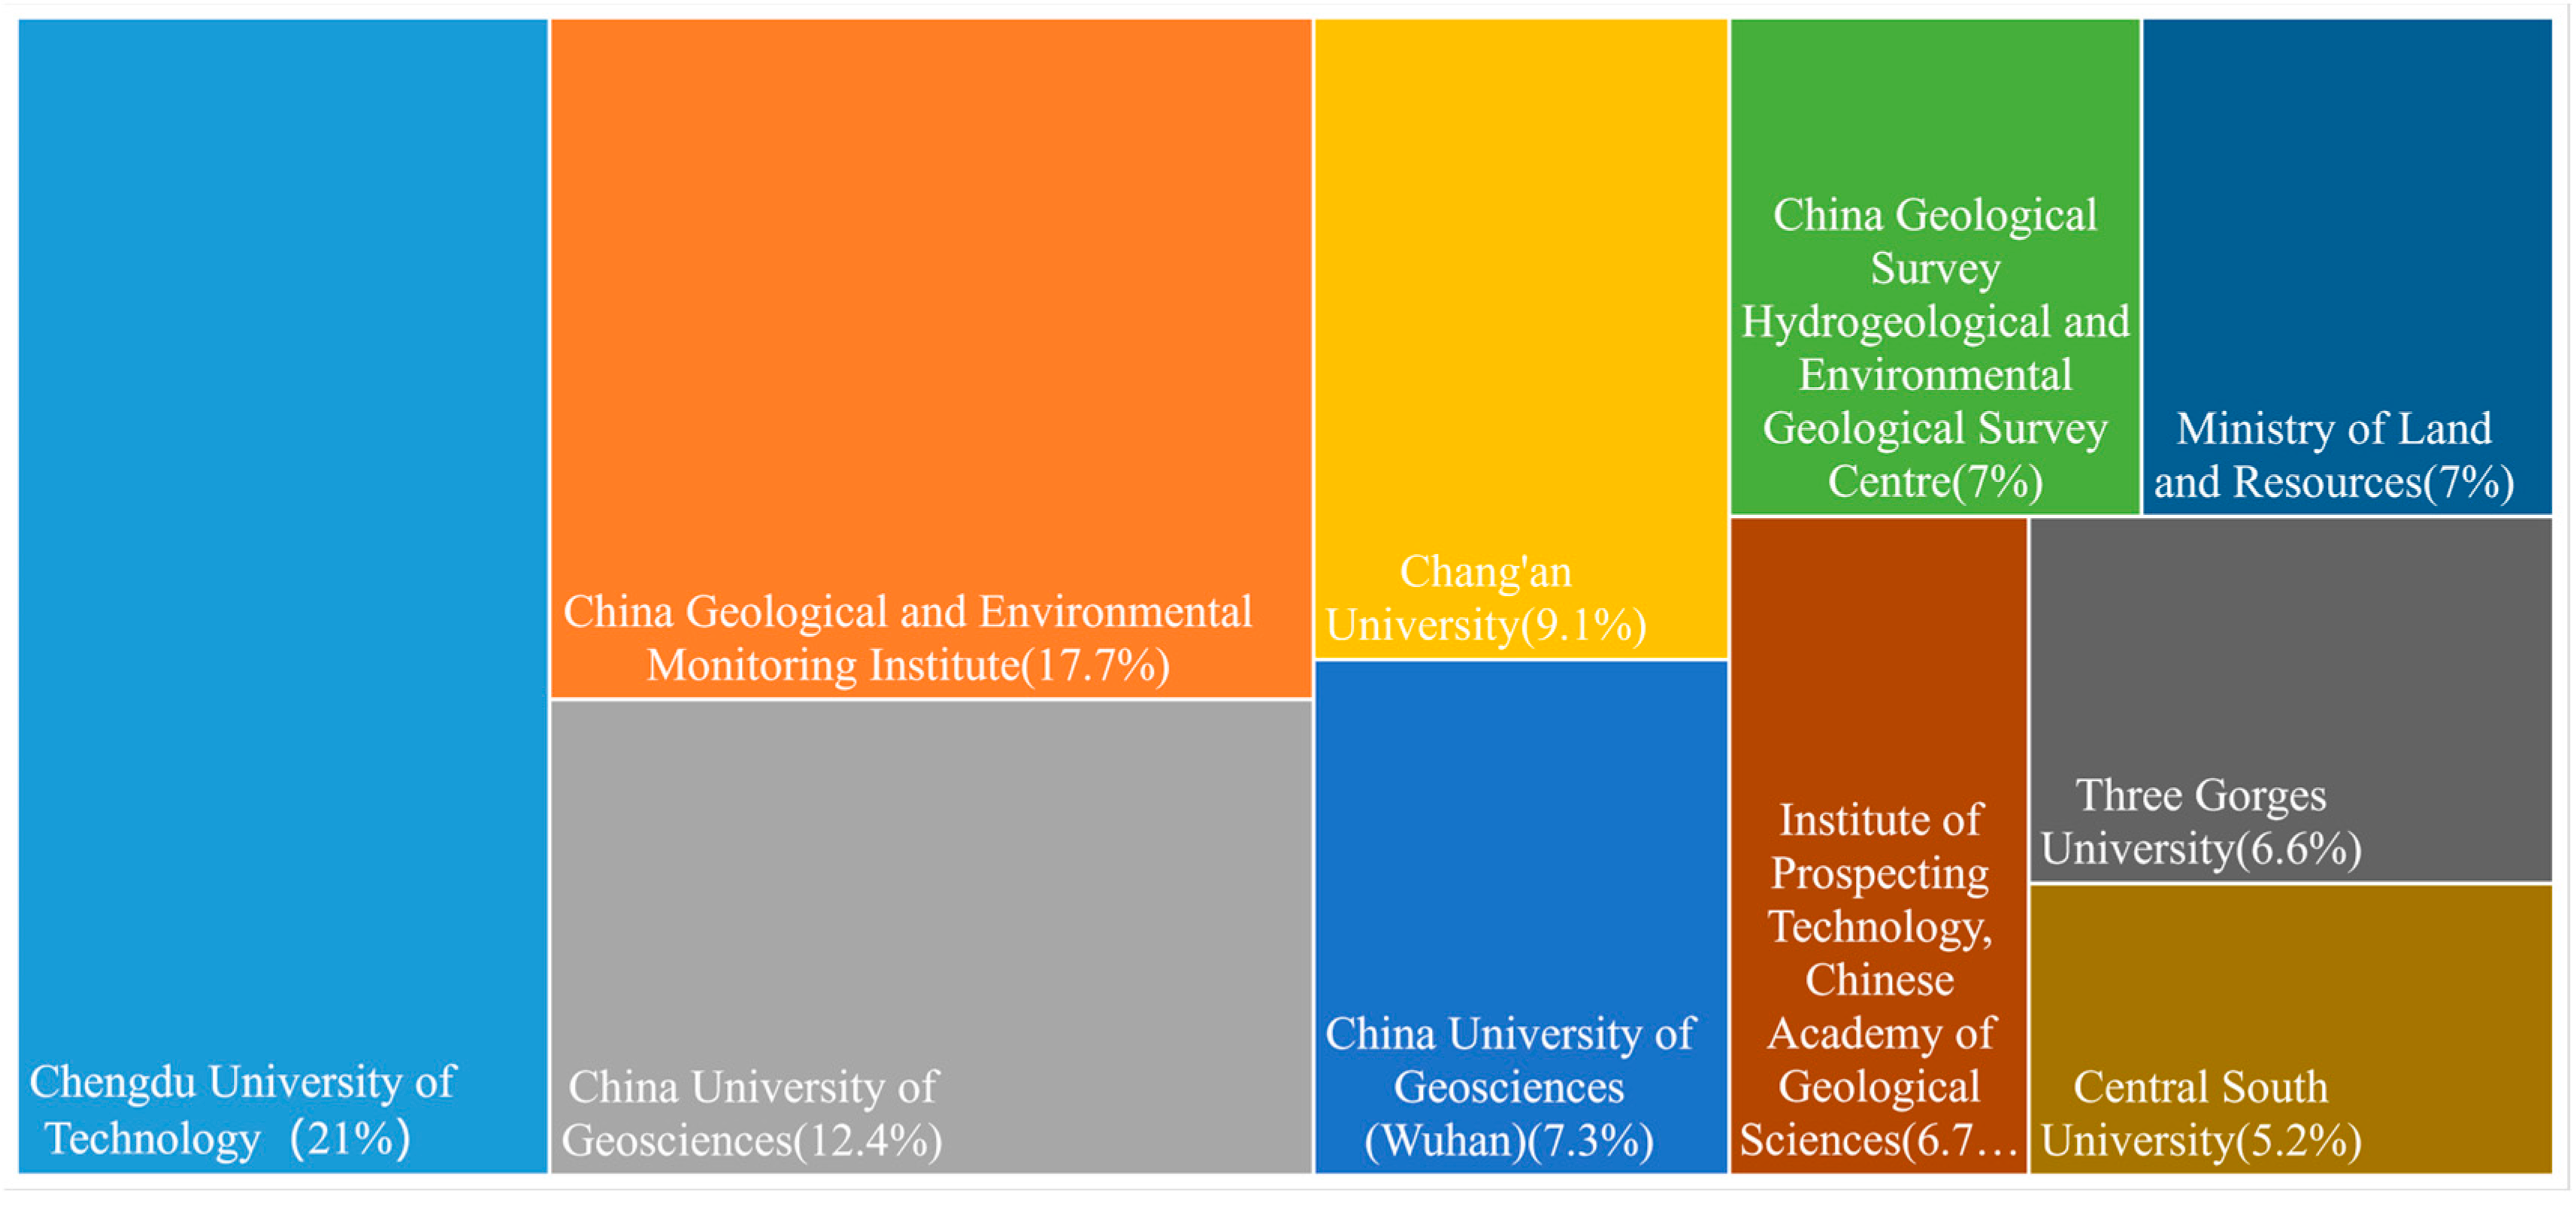
As shown in Figure 2, the top 10 research institutions by publication volume are listed. Among these institutions, Chengdu University of Technology, the China Geological Environment Monitoring Institute, China University of Geosciences, and Chang’an University stand out for their significant contributions to the research into and application of geological hazards remote sensing survey technologies. These institutions are recognized as leading contributors in this field. Over the years, they have made substantial advances in research and have been instrumental in training a large number of researchers and technical professionals. Their efforts have not only strengthened research capacity in the field but also contributed to advances in geohazard monitoring and management.

Figure 2.
The top 10 research institutions by publication volume.
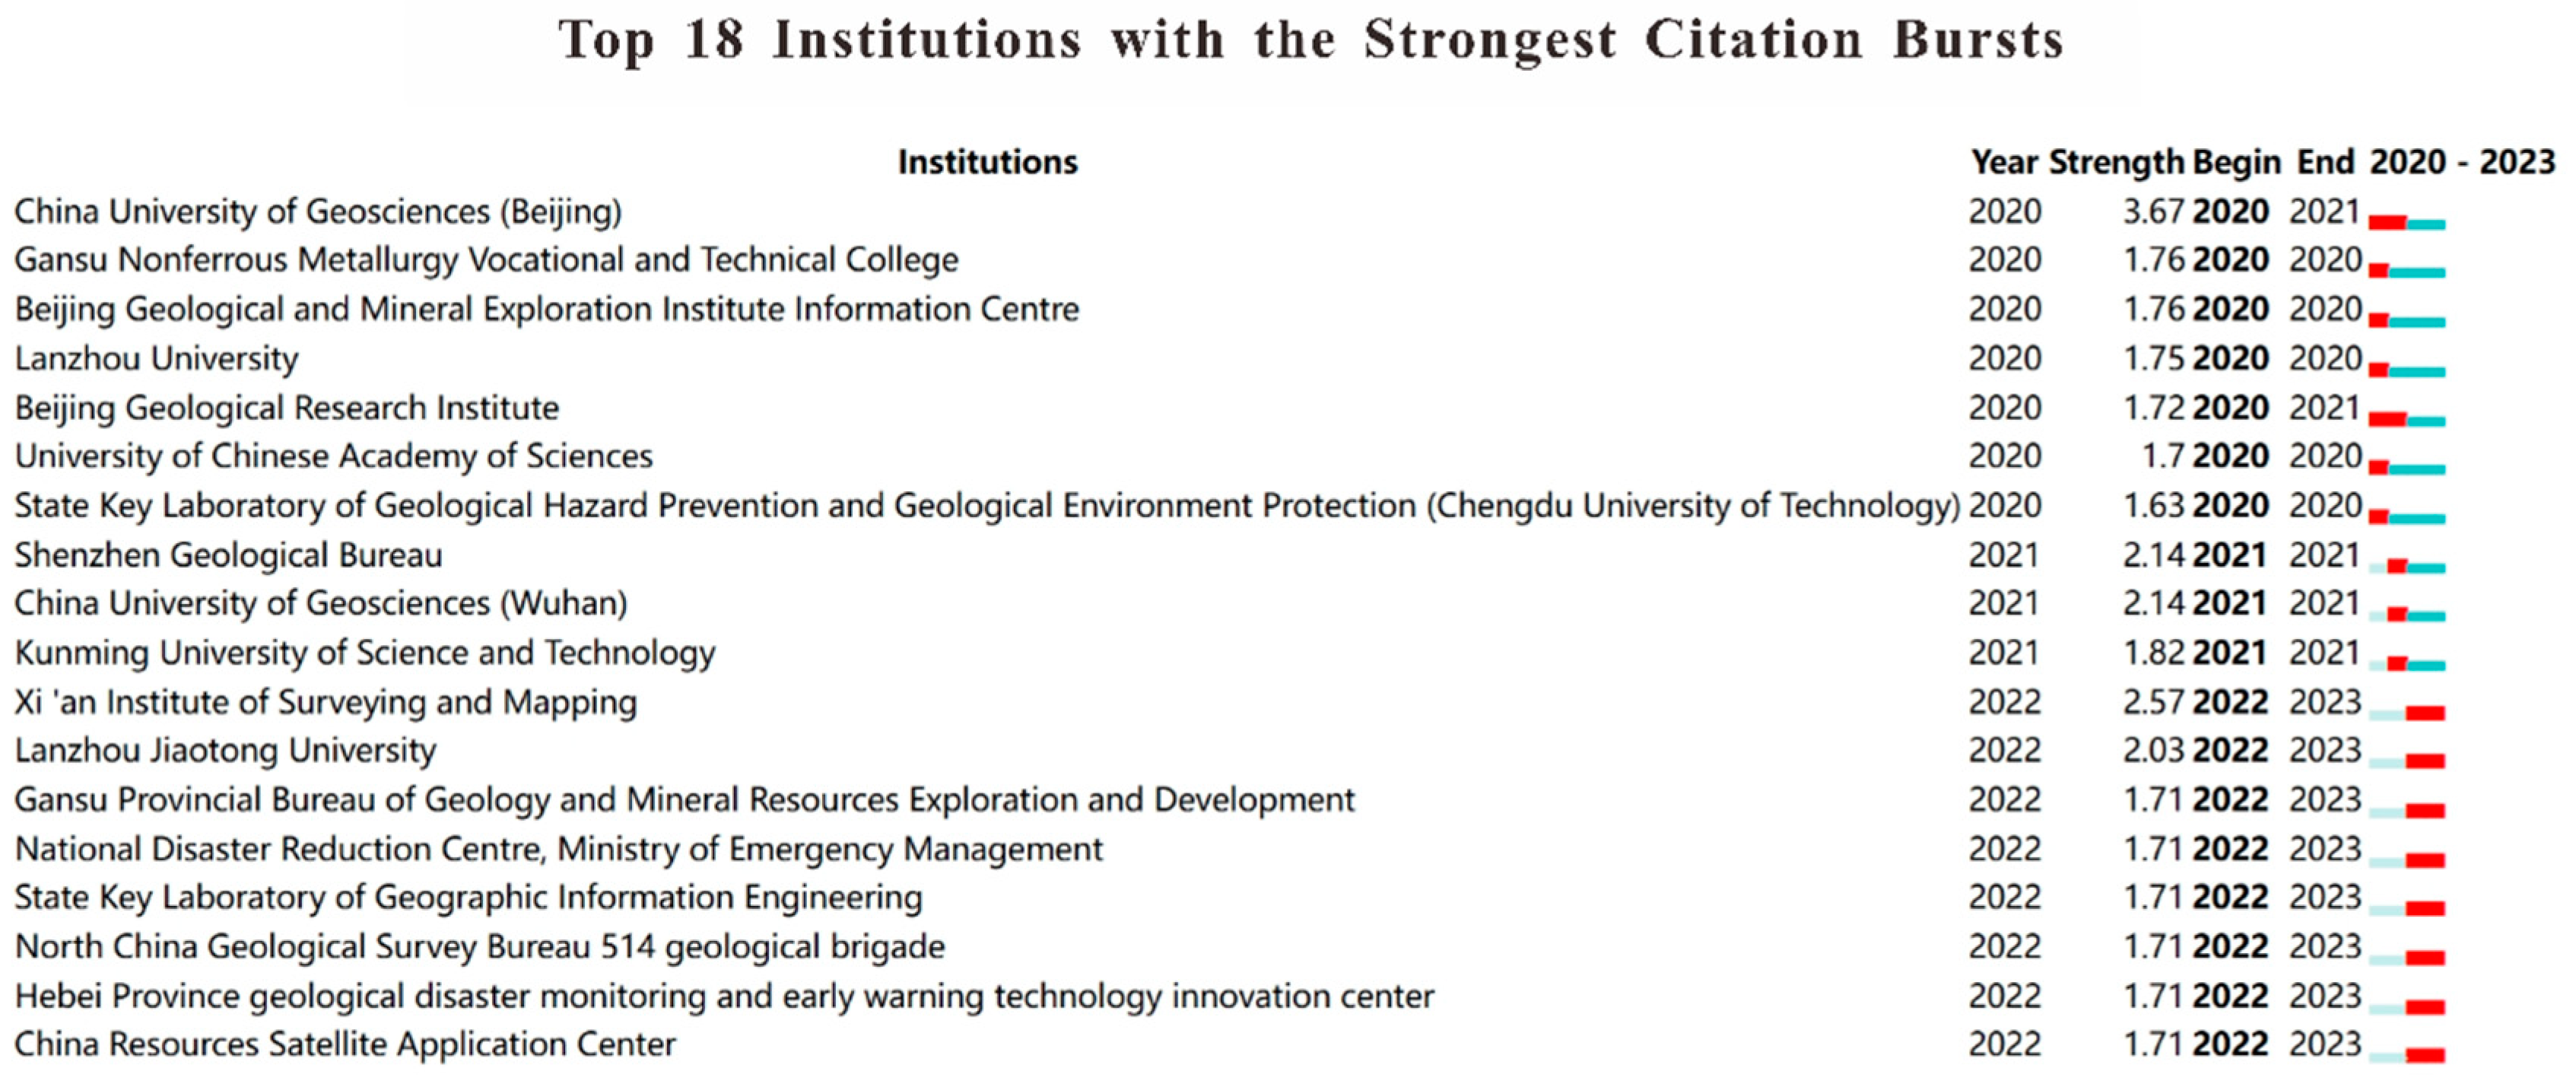
Citespace (6.3.R1), a data analysis software program, was used to analyze the dynamic evolution mechanisms in specific research fields. Figure 3 presents a burst analysis of publishing institutions in the field of geological hazard monitoring from 2020 to 2023 using Citespace. In the figure, the red line represents the duration of the keyword bursts. The analysis reveals that the China University of Geosciences (Beijing) and the Beijing Geological Research Institute began their research in geological hazard monitoring relatively early, maintaining a consistent influence from 2020 to 2021. After 2022, institutions such as the Xi’an Institute of Surveying and Mapping, Lanzhou Jiaotong University, and the Geological Mineral Resources Exploration and Development Bureau of Gansu Province emerged as key contributors in the field of geological hazard monitoring.
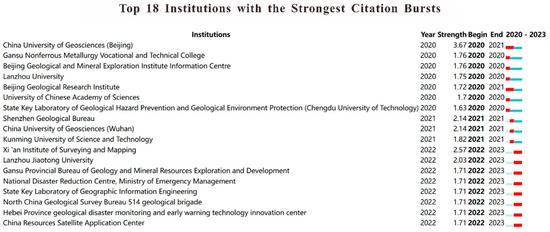
Figure 3.
Burst occurrence analysis of related publishing institutions.
3.2.2. Activity Index (AI) and Attractive Index (AAI)
To evaluate changes in research intensity and academic influence in the field of geological hazard monitoring across different regions over time, this study introduces two indices: the Activity Index (AI) and the Attractive Index (AAI). The Activity Index measures the relative level of research activity a province has invested in this field, while the Attractive Index reflects a province’s academic influence based on citation rates. The methods for calculating and applying AI and AAI are outlined as follows [28]:
where and represent the Activity Index and Attraction Index of province in year , respectively; For the purpose of analyzing research activity and impact in the field of geological hazards monitoring, let represent the total number of publications and the total citations for province in year ; and represent the sum of the number of journal publications and the number of citations in the field of geological hazards monitoring for province over a period of time; and represent the total number of publications and total citations in the country in year ; and represent the total number of publications and total citations for the entire country over the same period of time with and .
and represent the national average level of academic influence in the field of geological hazards monitoring research. or indicate whether the research work of a province is above or below the global average level; or indicates whether the citation frequency of a province is above or below the national citation level.
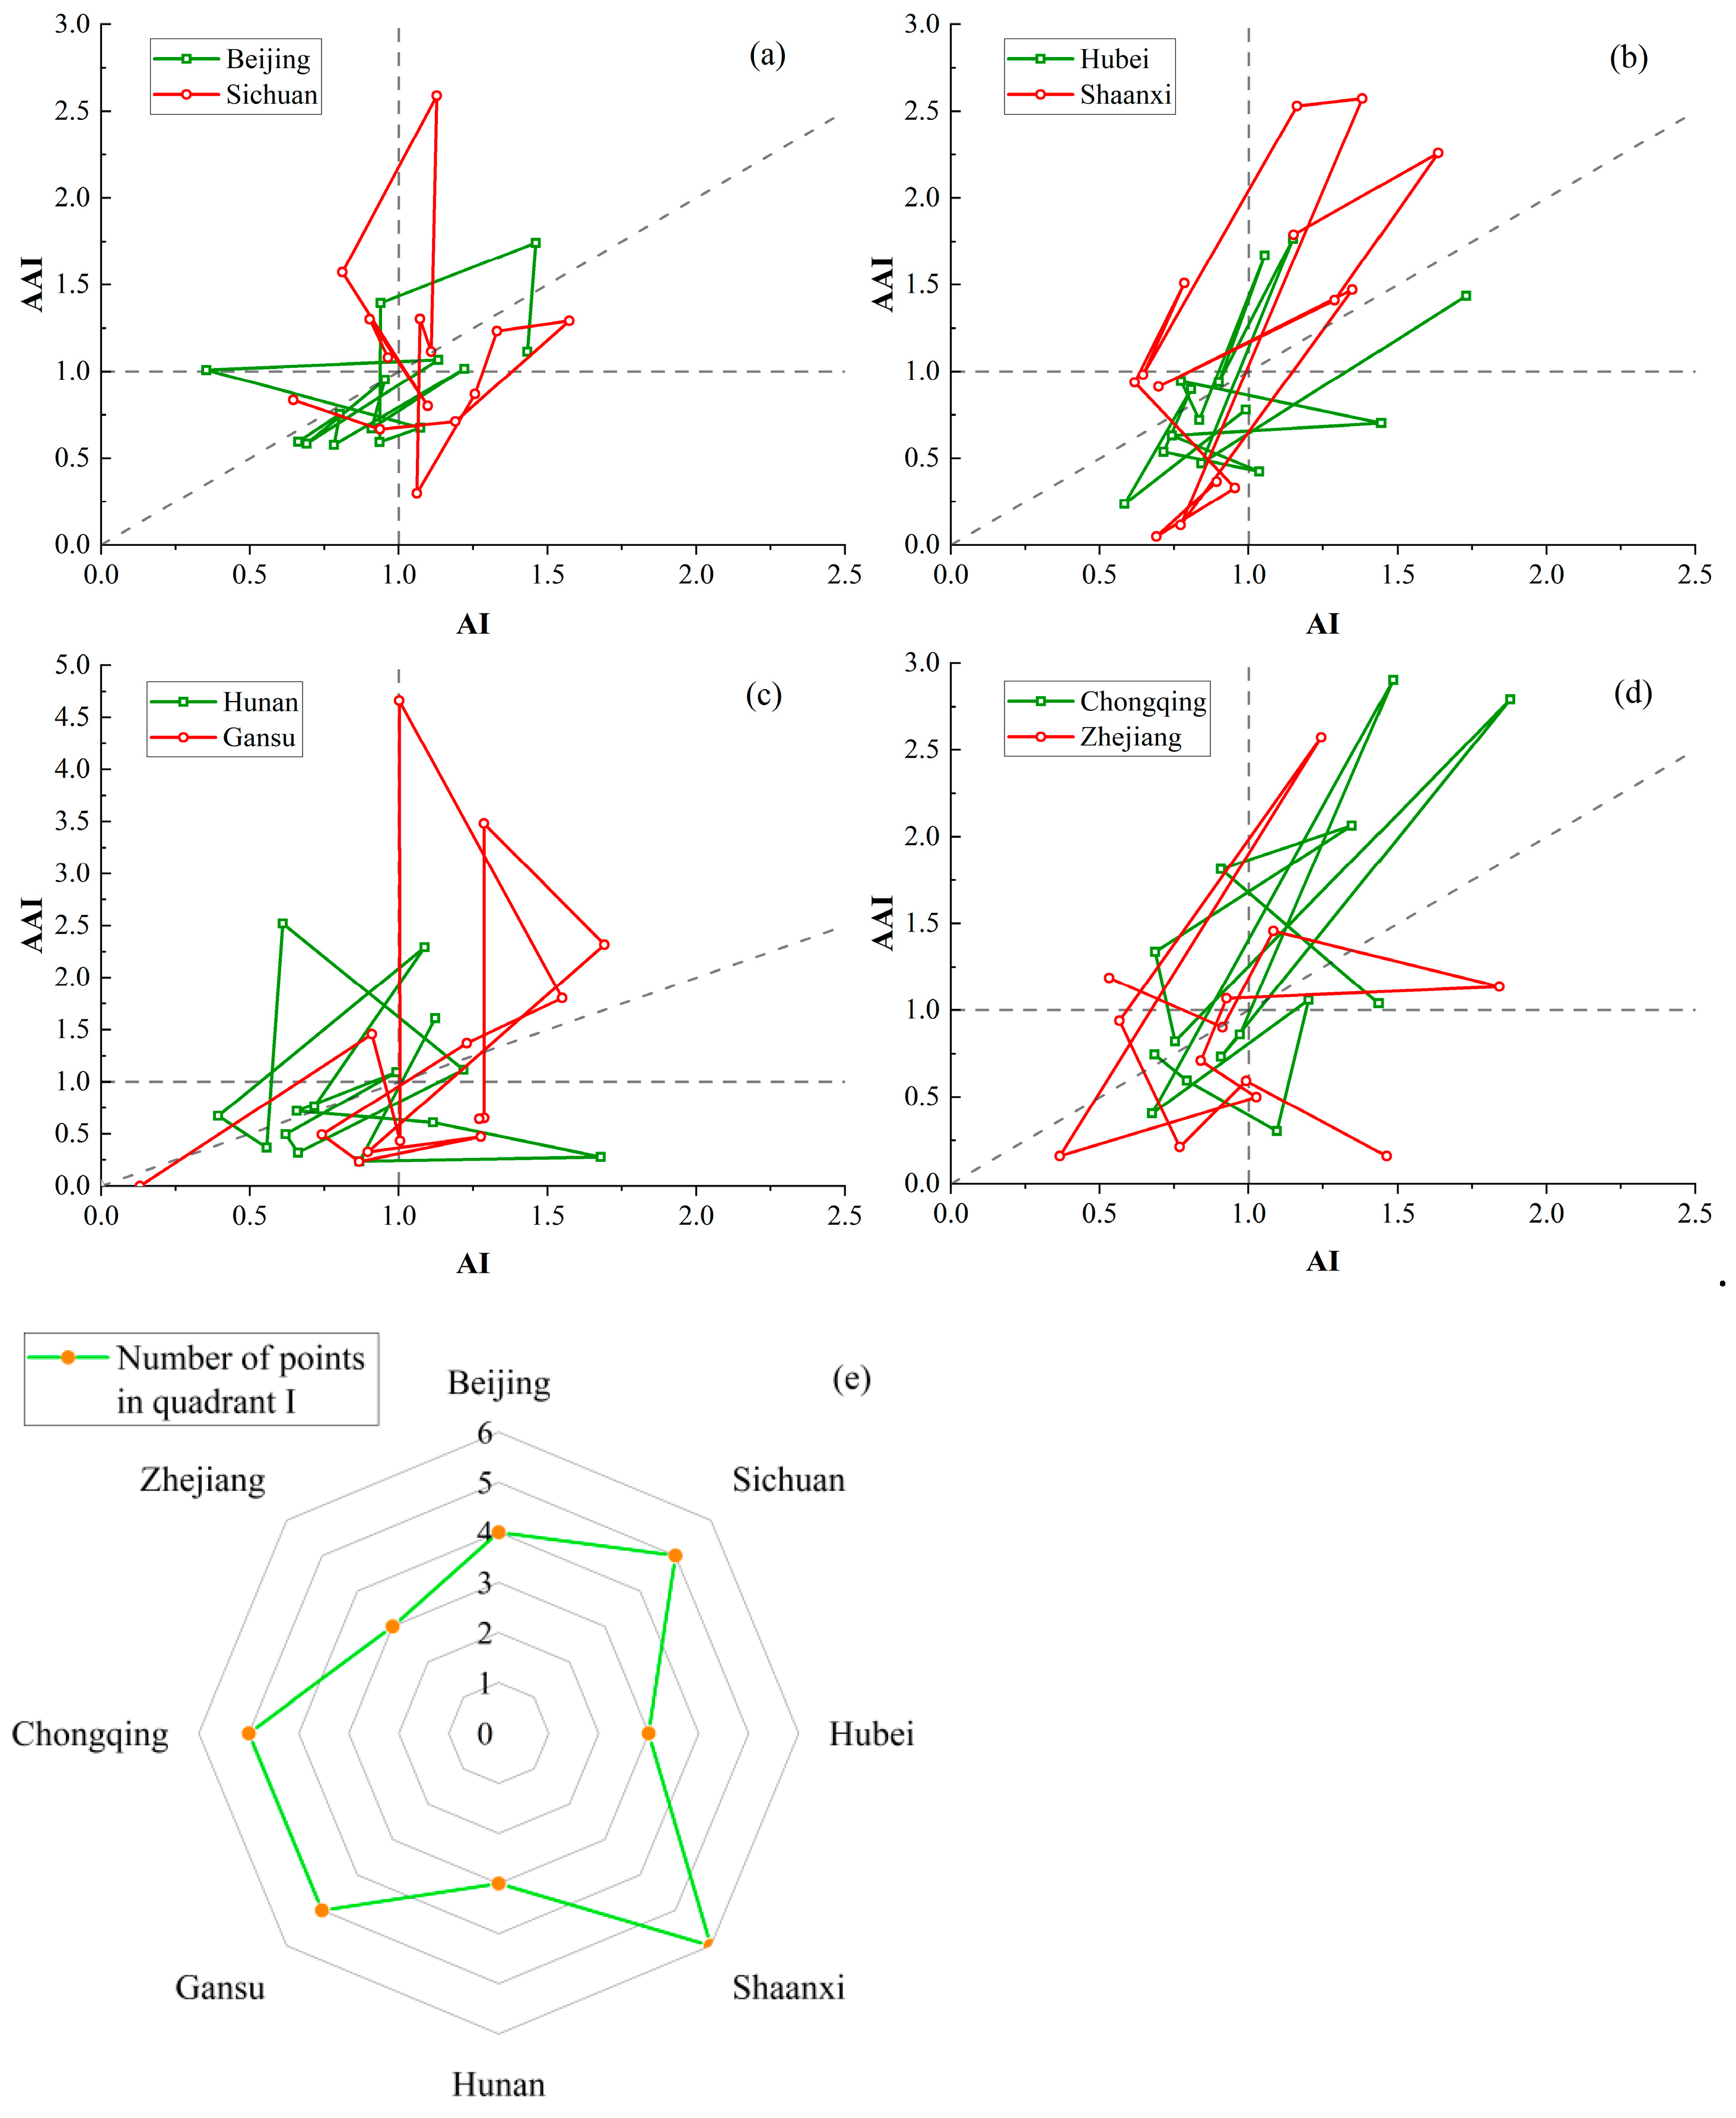
Using AI and AAI, the research intensity and influence of the top 8 regions by publication volume in the field of geological hazards prediction from 2010 to 2023 were evaluated. To present the research results more clearly, we display the rankings in pairs, with two regions per graph, as shown in Figure 4. Points in the first quadrant indicate that in those years, a region’s AI and AAI indices were both above the global average. The reference line reflects the balance between a region’s research efforts and its citation impact in geological hazards prediction studies.

Figure 4.
Relationship chart of AI and AAI publication volume for the top 10 provinces from 2010 to 2023. (a) Beijing and Sichuan; (b) Hebei and Shaanxi; (c) Hunan and Gansu (d) Chongqing and Zhejiang; (e) first quadrant point count chart.
From Figure 4a–d, it can be seen that Sichuan’s Attractiveness Index relatively high, while its Activity Index remains is lower. In contrast, Shaanxi and Chongqing both exhibit high Attractiveness Index values, with some years showing explosive growth in both indices. Figure 4e summarizes the number of points located in the first quadrant for each region. The data show that Shaanxi has the most years where both indices are above the global average, underscoring its leading position in the field of geological hazards prediction. Furthermore, regions with more complex terrain, such as Sichuan, Chongqing, and Gansu, demonstrate strong influence in multiple years, solidifying their roles as key players in geological hazards monitoring.
3.3. Research Hot Spots and Frontier Analysis
A “Knowledge Graph” is a graphical representation used to display the development process and structural relationships of scientific knowledge. This concept was proposed by the National Academy of Sciences in the United States in 2003. Currently, there are many software tools available for drawing knowledge graphs. Among them, VOSviewer, developed jointly by Nees Jan van Eck and Ludo Waltman [29], has been widely applied across various research fields, and its visualization analysis effects have been recognized by numerous scholars. Therefore, this paper employs VOSviewer (version 1.6.17) to visually present the authors, institutions, citation situations, and keyword clustering from a total of 6694 papers (including journals, conference papers, and theses) sourced from the CNKI and WOS databases.
3.3.1. Keyword Co-Occurrence Analysis
Keywords provide a concise summary of the core content of an article. The visualization of high-frequency keywords offers deeper insights into research trends and emerging hot spots [30,31]. Based on literature data from the CNKI and WOS databases, the keywords in these articles were analyzed and visualized. Table 3 presents the top 10 most frequently occurring keywords in the analyzed articles. It is evident that in the field of geological hazards, scholars focus heavily on key issues such as landslides, debris flows, and geological environments.
Table 3.
List of the 10 most commonly used keywords.
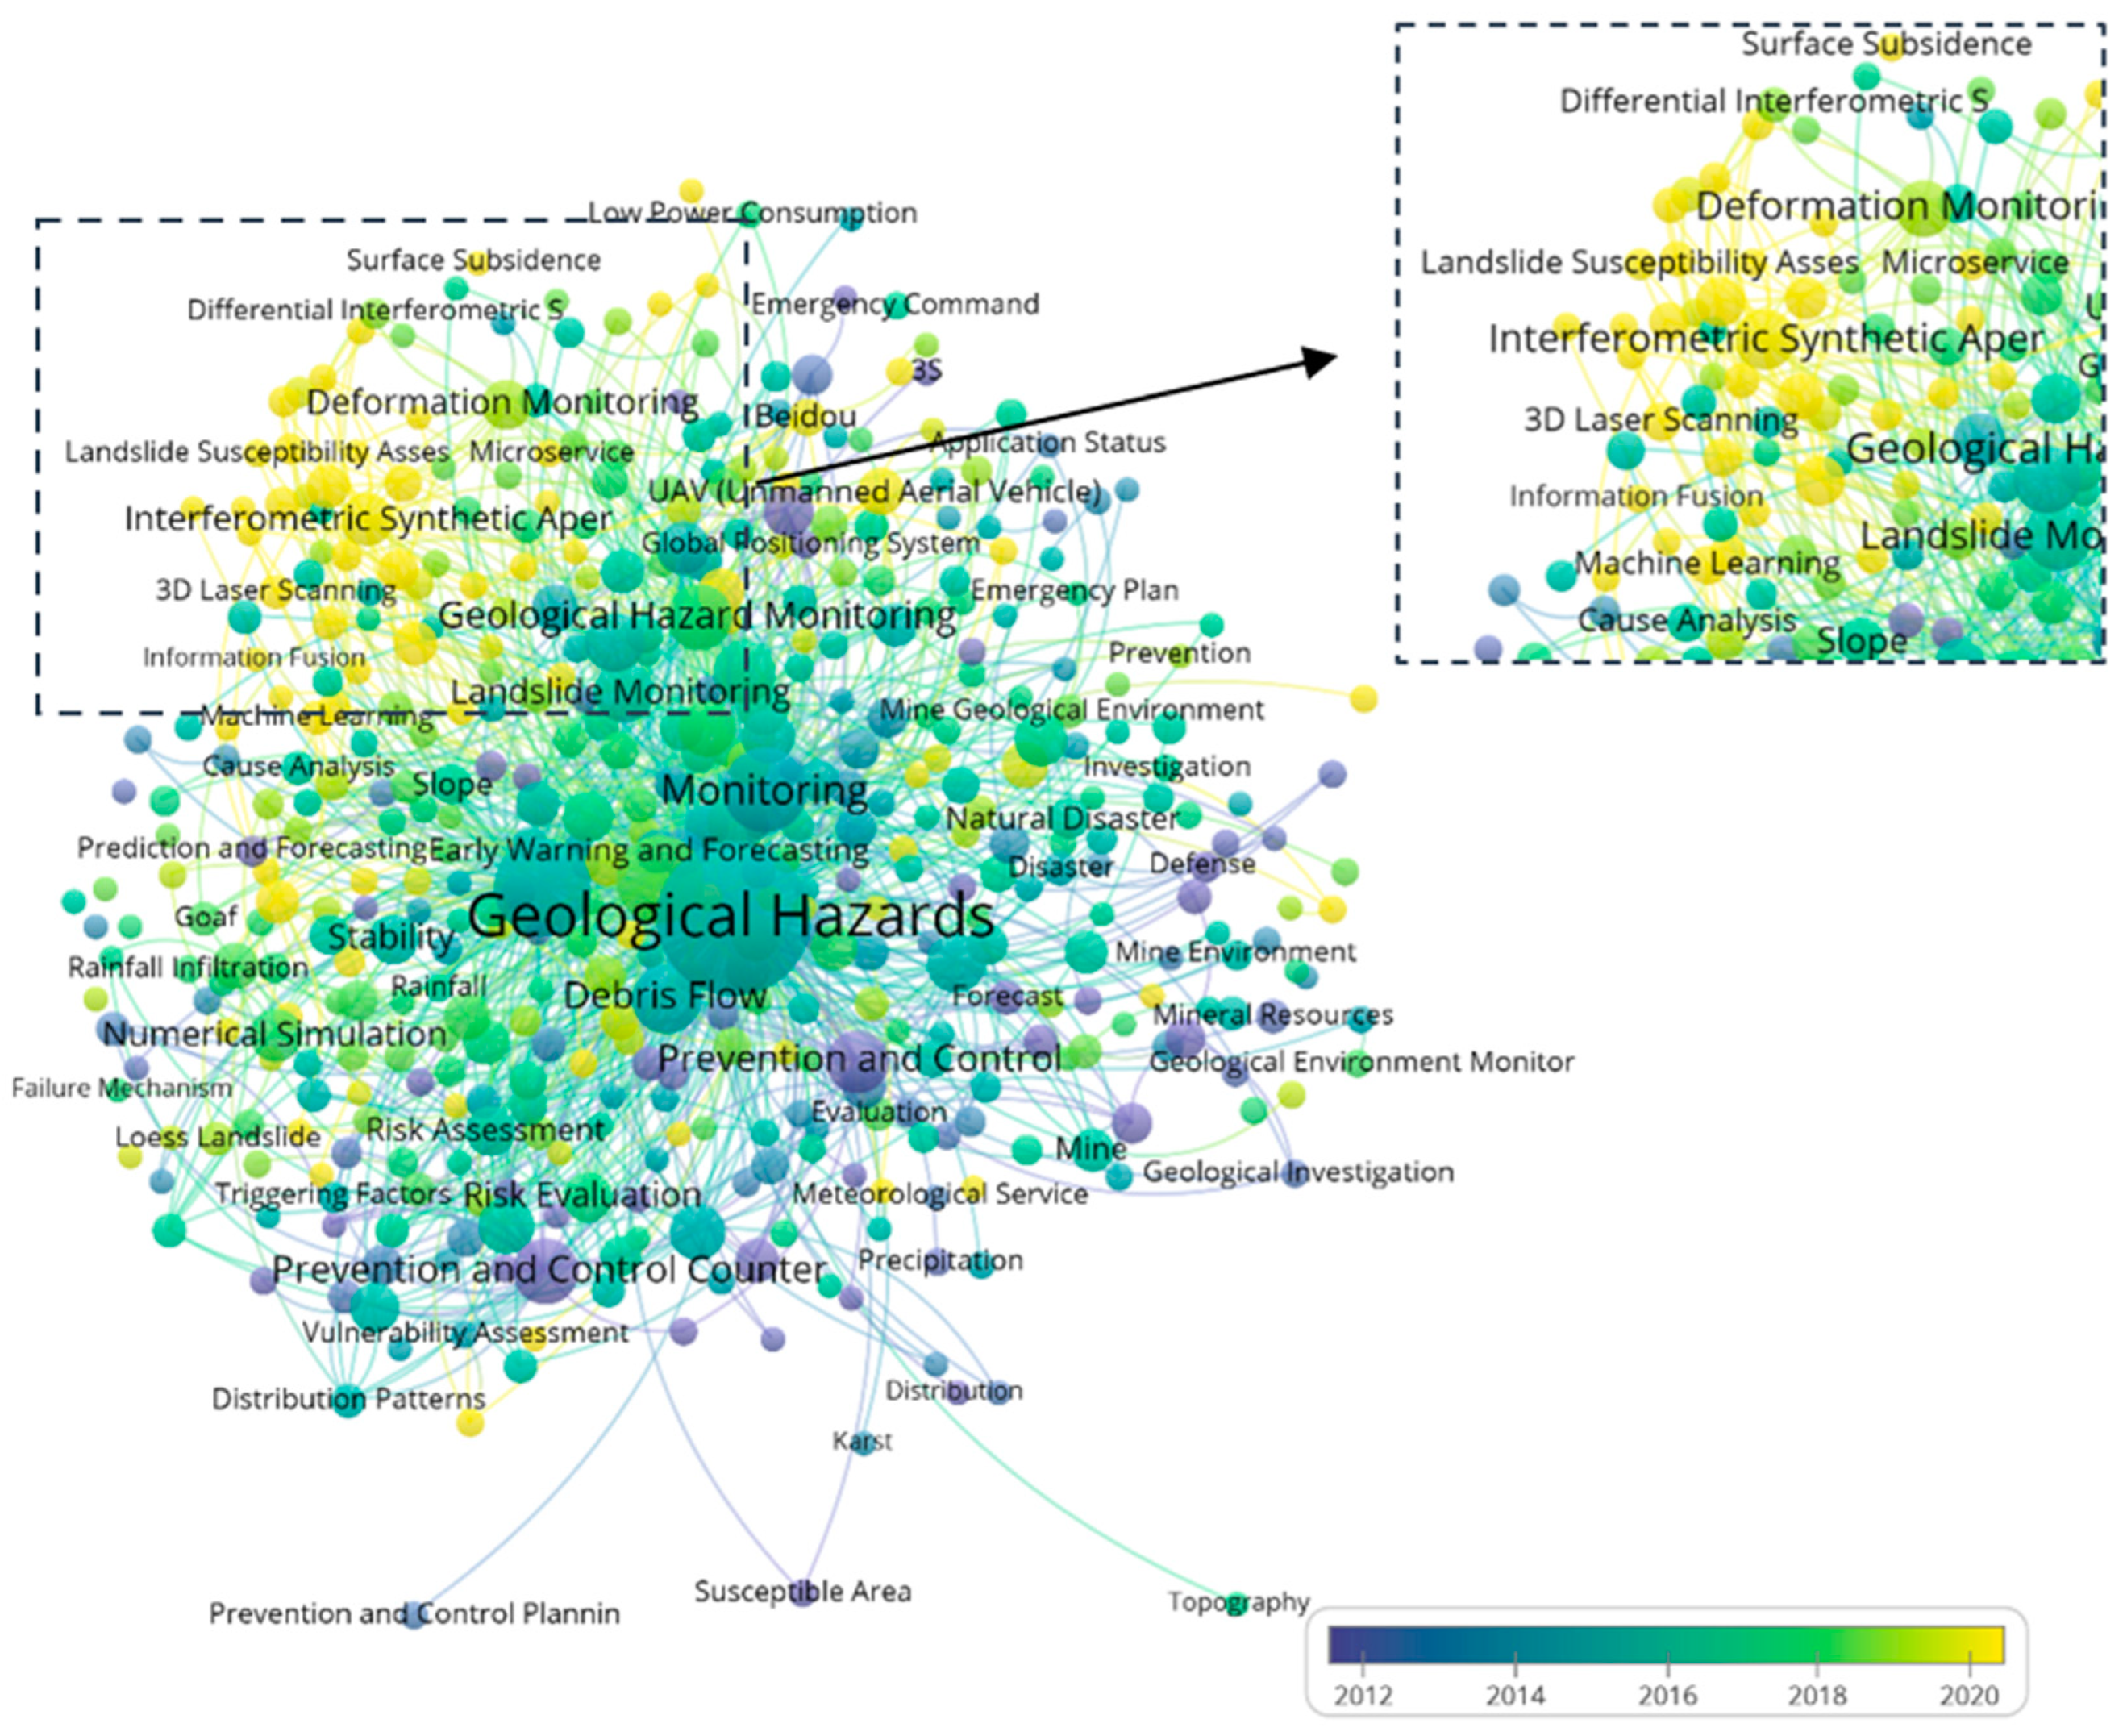
Figure 5 illustrates the keyword co-occurrence network and system mapping based on interconnections. In this figure, the size of the nodes indicates the volume of research publications associated with the respective technology, while the color of the nodes reflects the year of the first publication. The connecting lines represent co-occurrence relationships between publications on the two technologies, and the line thickness reflects the frequency of these co-occurrences. The legend shows the publication timeline of the keywords, with the yellow section representing the most recent publications, highlighting current research trends and the latest outcomes. From Figure 5, it can be inferred that Interferometry Synthetic Aperture Radar (InSAR), 3D Laser Scanning, Machine Learning, Landslide Susceptibility Assessment, Information Fusion, and Deformation Monitoring have become hot research topics.

Figure 5.
Systematic map of keywords.
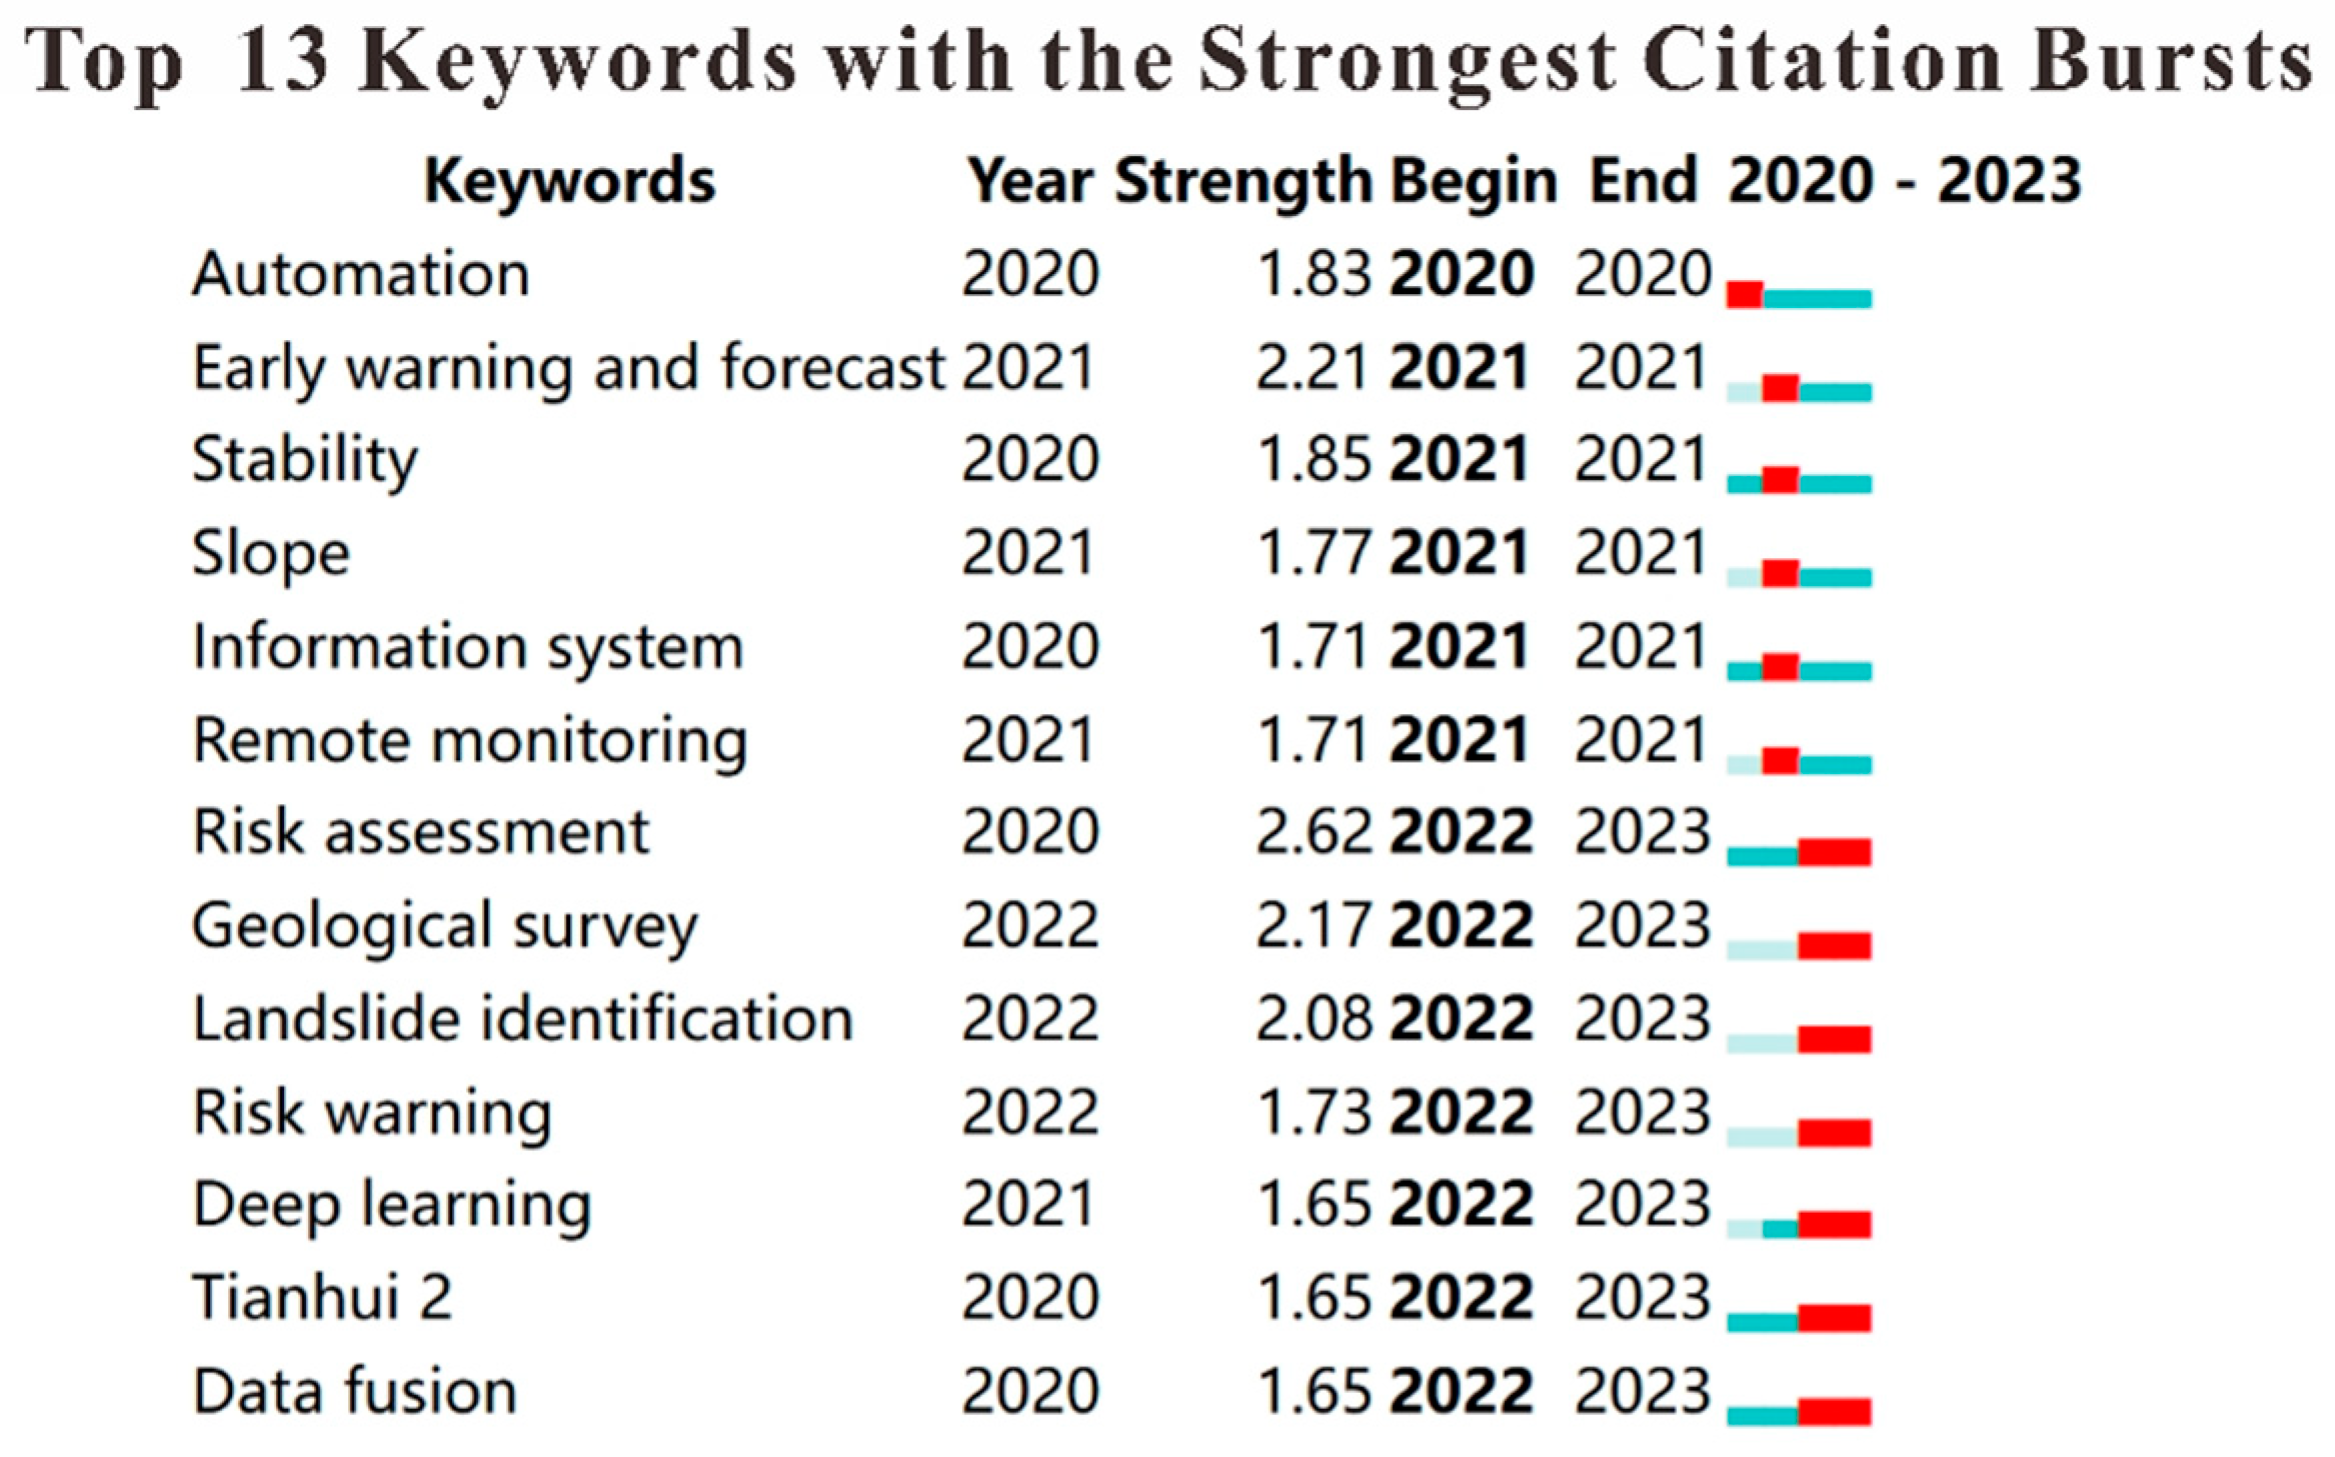
To further explore the development trends of various keywords in the field of geological hazards monitoring, this study utilized Citespace (6.3.R1) software to perform a burst analysis of keywords, as illustrated in Figure 6. The red lines in the figure represent the duration of keyword bursts. Notably, from 2022 to 2023, terms such as “data fusion”, “landslide identification”, “deep learning”, and “risk warning” gained significant prominence. This trend suggests that analytical approaches integrating geological hazards monitoring with machine learning are emerging as a novel field of study and are gradually evolving into a key research focus.
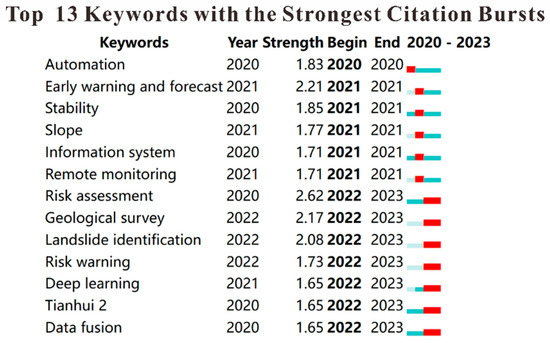
Figure 6.
Keyword burst map of geological hazards prediction field.
3.3.2. Intelligent Geological Hazards Warning Analysis
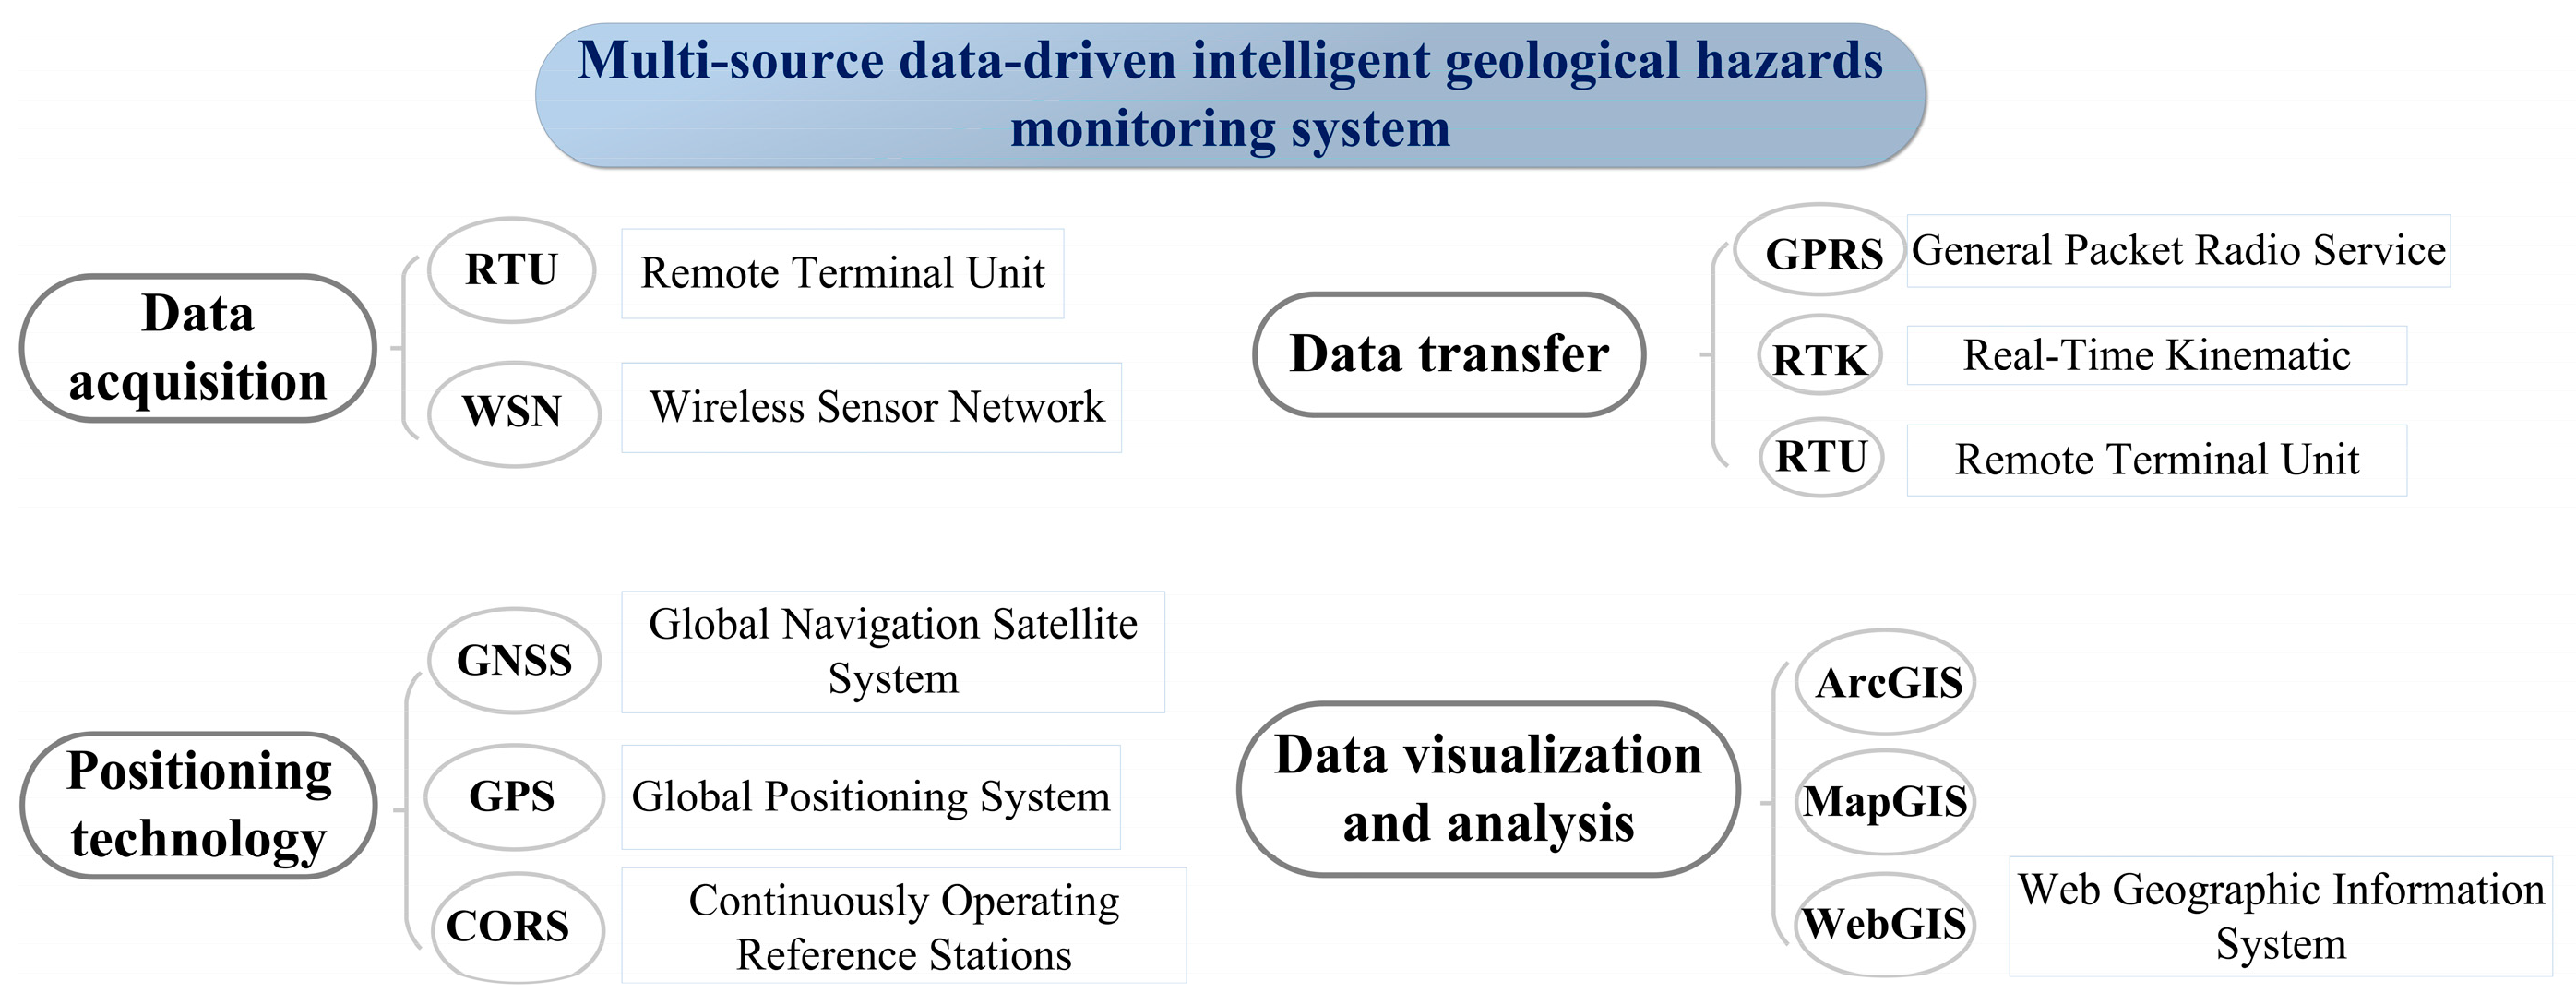
The analysis of intelligent geological disaster warning driven by multi-source data consists of four components: data collection, positioning, data transmission, and visualization processing. Each component involves various methods. By exporting and organizing data from the database, commonly used analytical approaches in geological disaster monitoring can be identified, as illustrated in Figure 7. Figure 8 illustrates the correlation analysis of intelligent geological disaster warning driven by multi-source data. Commonly used tools for data collection include RTU (Remote Terminal Unit) and WSN (Wireless Sensor Network). RTU has emerged as a prominent application in recent years, emphasizing reliability and communication security, while WSN focuses more on wide-area coverage. This indicates that current research prioritizes data security over coverage. For positioning technology, GPS (Global Positioning System), part of the GNSS (Global Navigation Satellite System), remains a fundamental component of positioning systems despite its long-established presence. CORS (Continuously Operating Reference Stations) enhances the positioning accuracy of GPS and GNSS through continuous differential data correction. Data transmission methods include GPRS (General Packet Radio Service), PTK (Real-Time Kinematic), and RTU. GPRS is suitable for low-speed, non-real-time data transmission but lacks speed. In contrast, RTU, known for high precision and real-time capabilities, and PTK, with its wide coverage, have become research hot spots in recent years. For data visualization analysis, ArcGIS, as part of a GIS (Geographic Information System), has become a crucial pillar for visualization analysis due to its comprehensive functionality and modular design.
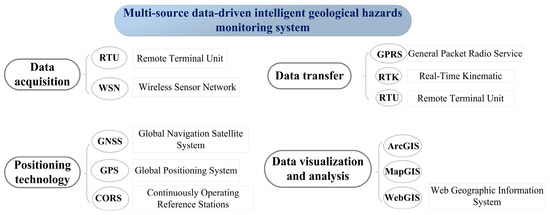
Figure 7.
Components of a database-based multi-source data-driven intelligent geological hazards warning system.
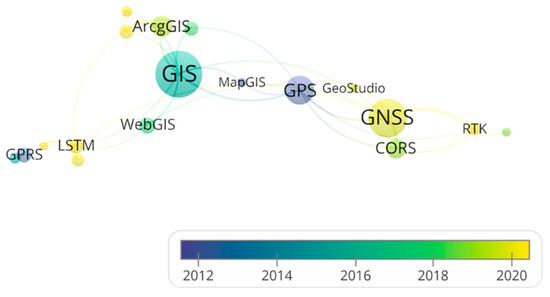
Figure 8.
Correlation analysis of intelligent geological hazards warning based on multi-source data-driven components.
According to the co-occurrence analysis mechanism of VOSviewer, the lines connecting nodes represent the co-occurrence of publications on two technologies, while the thickness of the lines reflects the number of related publications. Starting with GNSS as a focal point, a comprehensive analysis of the literature data revealed that the combined application of GNSS and RTK has emerged as a significant research trend in geological disaster monitoring (Figure 9). GNSS, as a positioning system, is capable of wide-area coverage and is well suited for monitoring large-scale geological hazards, such as landslide- and debris flow-prone regions. By utilizing multiple base stations, GNSS can monitor entire geological disaster risk zones, while RTK, through differential processing, enhances the local monitoring accuracy of GNSS. This combination enables the detection of subtle displacements, facilitating the early identification of potential hazards.
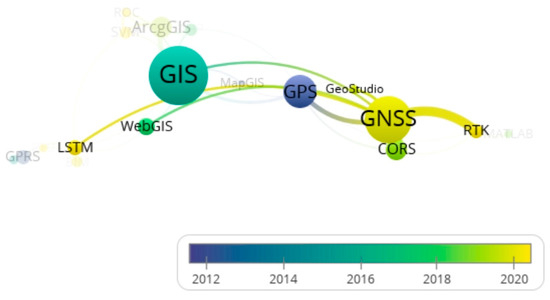
Figure 9.
Co-occurrence analysis centered on GNSS.
Moreover, in geological disaster prediction, the integration of GNSS and LSTM has become another research focus. By combining real-time data from GNSS positioning technology with the deep learning capabilities of LSTM, effective analysis and prediction of geological hazards can be achieved.
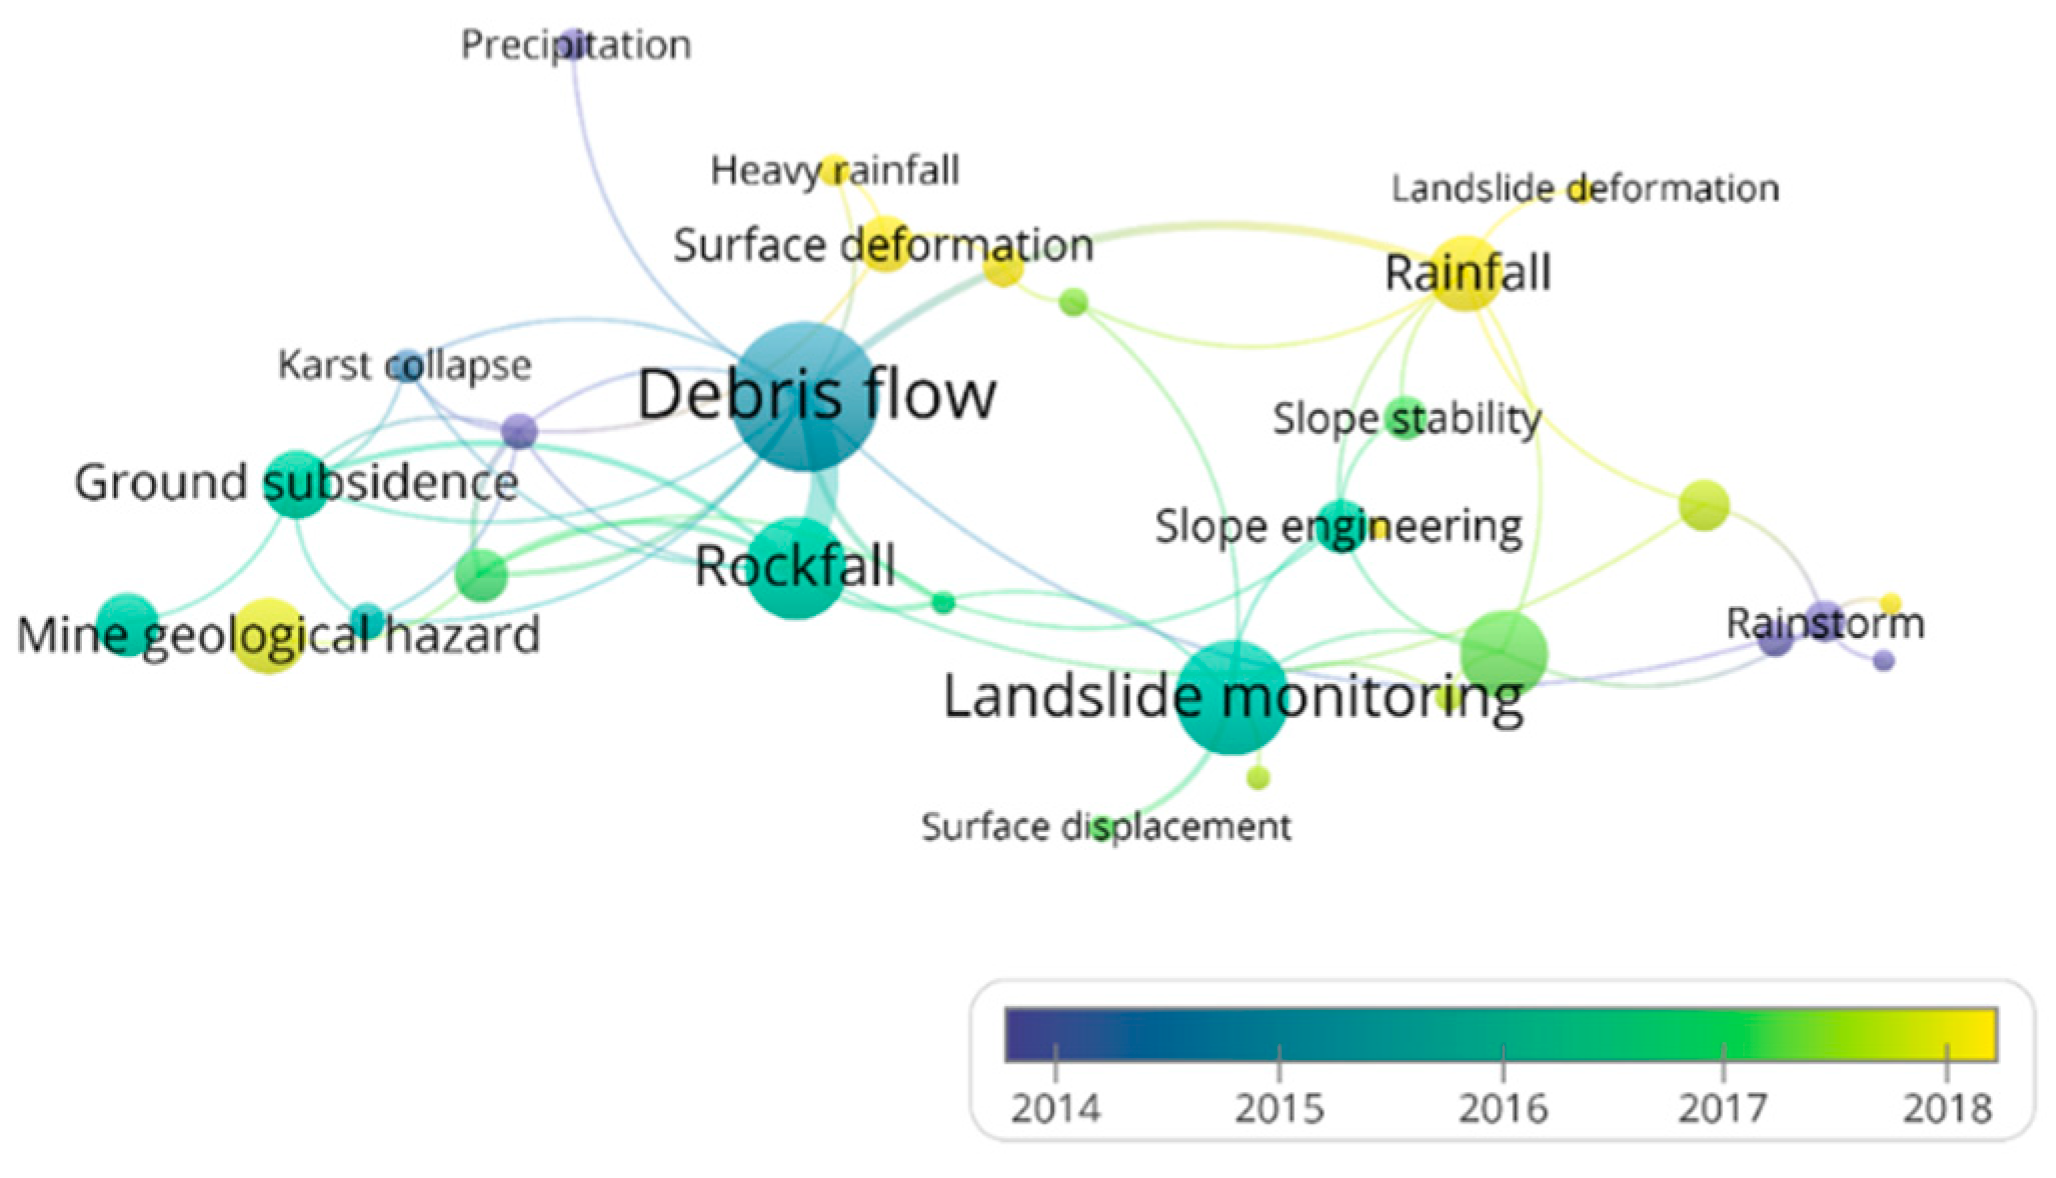
Based on literature research, it has been found that the occurrence of geological hazards is often not limited to a single type of disaster but involves a phenomenon of multi-factor coupling. Additionally, studies typically examine disaster types in combination with their causes. Therefore, it was necessary to perform a co-occurrence analysis of geological hazards. Figure 10 presents a co-occurrence analysis of geological hazards based on the literature data. The analysis reveals that landslides and debris flows exhibit high publication frequency and centrality. In the monitoring of geological hazards, researchers have increasingly focused on the underlying causes of these phenomena, with rainfall emerging as a key triggering factor. Furthermore, ground subsidence caused by mining-related geological hazards has gained significant attention in recent years, becoming a prominent research focus in the field of geological disaster monitoring.
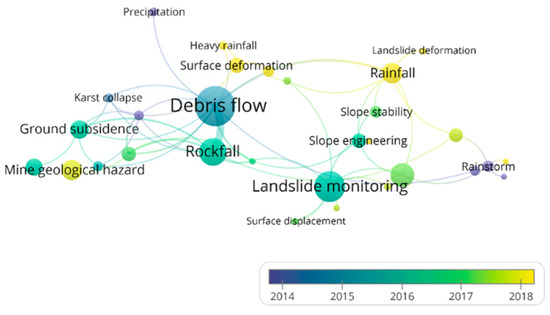
Figure 10.
Co-occurrence analysis of geological hazards based on literature database.
4. Discussion
4.1. Research Stages
The development of global geological hazard monitoring can be categorized into three distinct stages: the germination stage (1976–2003), the rapid development stage (2004–2013), and the steady development stage (2014–2024). China, with the highest incidence of geological hazards and the largest affected population, has produced the majority of thevresearch literature in this field. Although research on geological disaster monitoring began later than in other disciplines, it has progressed rapidly.
During the germination stage, researchers primarily focused on identifying the geological conditions for hazard formation, understanding the mechanisms governing disaster development, and mapping the spatial distribution of occurrences. In the rapid development stage, significant advances were achieved in studying disaster formation mechanisms, which led to the design of innovative monitoring methods and instruments, enabling continuous monitoring. In the steady development stage, risk areas have been continuously identified and updated through field investigations and verification, improving the timeliness and accuracy of monitoring potential hazards.
Technological advancements have driven the transition between stages, particularly the adoption of high-resolution remote sensing, Real-Time Kinematic (RTK) positioning, and the integration of machine learning in hazard prediction. This technological shift represents a critical turning point, fostering both theoretical research and practical applications in geological hazard monitoring.
4.2. Research Community
The research community in geological hazard monitoring exhibits clear geographical and institutional clustering, with specialized universities playing a prominent role. While some scholars have achieved high publication outputs, collaboration between individual researchers and research groups remains limited. Most research is concentrated in geology-focused academic institutions and governmental decision-making bodies, reflecting a high level of specialization, likely driven by the sensitivity and confidentiality surrounding geological hazards.
In recent years, it has become possible to publish academic papers on geological hazards within a month of an event occurring. However, significant gaps remain in the application of monitoring technologies for preventive purposes. Many studies continue to focus on post-disaster impact assessments rather than proactive monitoring. Promoting the use of open data sources and accessible, non-specialized monitoring technologies could broaden research participation and enhance the scope and effectiveness of hazard monitoring.
4.3. Research Technologies
Geological hazard monitoring employs two primary methods: human monitoring and machine monitoring. Human monitoring involves assigning specific personnel to observe designated risk points in real time following comprehensive investigations and evaluations. However, this approach can be time-consuming and resource-intensive. Machine monitoring, on the other hand, utilizes remote sensing technologies for hazard identification and incorporates alarms from monitoring instruments deployed both above and below ground.
Recent advancements in this field include not only the continuous updating of equipment and integration of multiple monitoring devices but also the adoption of machine learning techniques. Machine learning is now being trained to identify conditions conducive to hazard occurrences and accurately predict critical thresholds, thereby enhancing the precision and reliability of monitoring systems. Despite progress in the integration of real-time monitoring systems, several challenges persist. These include improving the operability of data interactions, optimizing sensor network configurations, and incorporating socio-economic factors into disaster prediction models.
Overall, geological hazard monitoring is increasingly characterized by the integration of interdisciplinary fields such as geology, computer science, surveying and mapping, remote sensing, and sociology. This convergence is driving advancements toward broader monitoring coverage, higher accuracy, and reduced costs, reflecting a promising trajectory for the field.
4.4. Study Contributions and Limitations
Our goal is to contribute to the development of more effective and innovative hazard monitoring solutions. Nevertheless, several limitations must be acknowledged. First, the reliance on the Web of Science and CNKI databases may have excluded relevant studies from other repositories, potentially limiting the comprehensiveness of this analysis. Second, while bibliometric tools such as VOSviewer and CiteSpace provide valuable visualizations, the inherent limitations in parameter settings and data cleaning processes could introduce biases that affect the reliability of the findings.
To overcome these limitations, future studies should prioritize integrating multiple data sources, including regional repositories and non-English databases, to achieve a more comprehensive analysis. Moreover, interdisciplinary collaborations that combine geological hazard monitoring with fields such as climate science, urban planning, and artificial intelligence hold significant potential, helping to uncover new insights and enhance the capabilities of disaster monitoring systems.
5. Conclusions
A visualization model for the field of geological hazards monitoring was established. The analysis revealed that the overall number of related publications has shown an upward trend, with two peaks in 2013 and 2022. Although there were small fluctuations over five years starting in 2014, the number of publications rapidly increased afterward, reaching nearly a hundred times that of the initial years.
Within the database, “The Chinese Journal of Geological Hazard and Control” was identified as the journal with the highest number of publications, serving as an authoritative professional periodical of the Chinese government. Chengdu University of Technology and Chang’an University contributed the most relevant theses, with their geological programs holding considerable influence both domestically and internationally. In terms of publishing institutions, China University of Geosciences (Beijing) and the Beijing Geological Research Institute began their research earlier, while later the China Geological Environment Monitoring Institute and other government agencies published more research. Geographically, Shaanxi Province had both an Activity Index (AI) and Attractive Index (AAI) that are above the global average. Other regions prone to geological hazards, such as Sichuan, Chongqing, and Gansu, also demonstrated strong influence in multiple years.
Keyword analysis indicated that landslides, debris flows, and geological environments have been consistent focal points in geological hazard monitoring research since the field’s early stages. Between 2022 and 2023, topics such as “data fusion”, “landslide identification”, “deep learning”, and “risk warning” emerged as highly cited keywords, signifying the growing trend of integrating machine learning methods into the monitoring and forecasting of geological disasters. Among these, the combined application of GNSS and RTK technologies was seen as a relatively mature approach for geological hazard monitoring. Meanwhile, the integration of GNSS and LSTM models has emerged as a pivotal trend in geohazard research. Bibliometric analysis offers considerable potential to advance monitoring technologies and improve the sustainability of disaster management.
Author Contributions
Writing—original draft, methodology, resources, Z.L.; validation, writing—review and editing, J.H.; formal analysis, X.L.; writing—review and editing, Y.L., F.Q. and Y.H. All authors have read and agreed to the published version of the manuscript.
Funding
This work was supported by the National Natural Science Foundation of China under Grant Number (41930641); Natural Science Basic Research Program of Shaanxi (Program No. 2024JC-YBQN-0364, 2021JCW-17); and the Shaanxi Science and Technology Association Youth Talent Lifting Program under Grant Number (NYHB202242).
Institutional Review Board Statement
Not applicable.
Informed Consent Statement
Not applicable.
Data Availability Statement
Not applicable.
Conflicts of Interest
The authors declare no conflicts of interest.
References
- Huang, R.Q.; Li, W.L. Analysis of the geo-hazards triggered by the 12 May 2008 Wenchuan Earthquake, China. Bull. Eng. Geol. Environ. 2009, 68, 363–371. [Google Scholar] [CrossRef]
- Brabb, E.E. The world landslide problem. Episodes 1991, 14, 52–61. [Google Scholar] [CrossRef]
- Froude, M.J.; Petley, D.N. Global fatal landslide occurrence from 2004 to 2016. Nat. Hazards Earth Syst. Sci. 2018, 18, 2161–2181. [Google Scholar] [CrossRef]
- Zhang, C.S.; Zhang, Y.C.; Hu, J.J.; Gao, Q.Z. Spatial and temporal distribution characteristics and forming conditions of Chinese geological disasters. Quat. Sci. 2000, 20, 559–566. [Google Scholar] [CrossRef]
- Dowling, C.A.; Santi, P.M. Debris flows and their toll on human life: A global analysis of debris-flow fatalities from 1950 to 2011. Nat. Hazards 2014, 71, 203–227. [Google Scholar] [CrossRef]
- Andersson-Sköld, Y.; Bergman, R.; Johansson, M.; Persson, E.; Nyberg, L. Landslide risk management-a brief overview and example from Sweden of current situation and climate change. Int. J. Disaster Risk Reduct. 2012, 3, 44–61. [Google Scholar] [CrossRef]
- Tie, Y.B.; Zhang, X.Z.; Gong, L.F.; Gao, Y.C.; Bai, Y.J.; Xu, W.; Ba, R.J.; Li, Z.L.; Ge, H. Research on the pattern of typical geohazard chains in the southwest mountainous region, China. J. Geomech. 2022, 28, 1071–1080. [Google Scholar] [CrossRef]
- Kyle, B.; Rishav, M.; Harisma, A.; Judith, H.; Ella, M.; Adam, S.; Nairong, D.; Gilles, B.; Dedy, A.; Benazir, B.; et al. Earthquake-triggered 2018 Palu Valley landslides enabled by wet rice cultivation. Nat. Geosci. 2019, 12, 935–939. [Google Scholar] [CrossRef]
- Aerts, J.C.J.H.; Botzen, W.J.; Clarke, K.C.; Cutter, S.L.; Hall, J.W.; Merz, B.; Michel-Kerjan, E.; Mysiak, J.; Surminski, S.; Kunreuther, H. Integrating human behaviour dynamics into flood disaster risk assessment. Nat. Clim. Change 2018, 8, 193–199. [Google Scholar] [CrossRef]
- Jiménez-Perálvarez, J.D.; Irigaray, C.; El Hamdouni, R.; Chacón, J. Building models for automatic landslide-susceptibility analysis, mapping and validation in ArcGIS. Nat. Hazards 2009, 50, 571–590. [Google Scholar] [CrossRef]
- Yang, F.; Jiang, Z.R.; Ren, J.Q.; Lyv, J. Monitoring, Prediction, and Evaluation of Mountain Geological Hazards Based on InSAR Technology. Sci. Program. 2022, 2022, 2227049.1–2227049.12. [Google Scholar] [CrossRef]
- Nichol, J.E.; Shaker, A.; Wong, M.S. Application of high-resolution stereo satellite images to detailed landslide hazard assessment. Geomorphology 2006, 76, 68–75. [Google Scholar] [CrossRef]
- Kulawardhana, R.W. Remote sensing and GIS technologies for monitoring and prediction of disasters. Int. J. Digit. Earth 2012, 5, 88–90. [Google Scholar] [CrossRef]
- Qian, C. Landslide Recognition Based on Machine Learning Considering Terrain Feature Fusion. ISPRS Int. J. Geo-Inf. 2024, 13, 306. [Google Scholar] [CrossRef]
- Qin, H.; Wang, J.; Mao, X.; Zhao, Z.; Gao, X.; Lu, W. An Improved Faster R-CNN Method for Landslide Detection in Remote Sensing Images. J. Geovis. Spat. Anal. 2024, 8, 2. [Google Scholar] [CrossRef]
- Prokesova, R.; Kardos, M.; Taborik, P.; Medved’ova, A.; Stacke, V.; Chudy, F. Kinematic behaviour of a large earthflow defined by surface displacement monitoring, DEM differencing, and ERT imaging. Geomorphology 2014, 224, 86–101. [Google Scholar] [CrossRef]
- Joyce, K.E.; Samsonov, S.V.; Levick, S.R.; Engelbrecht, J.; Belliss, S. Mapping and monitoring geological hazards using optical, LiDAR, and synthetic aperture RADAR image data. Nat. Hazards 2014, 73, 137–163. [Google Scholar] [CrossRef]
- Xu, Q. Understanding the landslide monitoring and early warning: Consideration to practical issues. J. Eng. Geol. 2020, 28, 360–374. [Google Scholar] [CrossRef]
- Ingrid, A.B.G.; Renato, M.; Jorge, R.; Chris, G.; Roger, S.; Kristen, T. Introduction and testing of a cost-effective GNSS system for landslide monitoring. Nat. Hazards 2014, 120, 8521–8549. [Google Scholar] [CrossRef]
- Xu, Q. Understanding and consideration of related issues in early identification of potential geohazards. Geomat. Inf. Sci. Wuhan Univ. 2020, 45, 1651–1659. [Google Scholar] [CrossRef]
- Van Eck, N.J.; Waltman, L. Citation-based clustering of publications using CitNetExplorer and VOSviewer. Scientometrics 2017, 111, 1053–1070. [Google Scholar] [CrossRef] [PubMed]
- Jamil, A.; Ahmad, A.; Irfan, M.; Hou, X.; Wang, Y.; Chen, Z.; Liu, X. Global microplastics pollution: A bibliometric analysis and review on research trends and hotspots in agroecosystems. Environ. Geochem. Health 2024, 46, 486. [Google Scholar] [CrossRef] [PubMed]
- Petrović, E.K.; Thomas, C.A. Global Patterns in Construction and Demolition Waste (C&DW) Research: A Bibliometric Analysis Using VOSviewer. Sustainability 2024, 16, 1561. [Google Scholar] [CrossRef]
- Lyu, Y.J.; Zhao, H.J.; Zeng, G.P.; Yang, J.; Shao, Q.P.; Wu, H.Y. Mapping the evolving trend of research on leukocyte telomere length: A text-mining study. Hum. Genom. 2024, 18, 117. [Google Scholar] [CrossRef]
- Kemeç, A.; Altınay, A.T. Sustainable Energy Research Trend: A Bibliometric Analysis Using VOSviewer, RStudio Bibliometrix, and CiteSpace Software Tools. Sustainability 2023, 15, 3618. [Google Scholar] [CrossRef]
- Salmerón-Manzano, E.; Manzano-Agugliaro, F. Bibliometric Studies and Worldwide Research Trends on Global Health. Int. J. Environ. Res. Public Health 2024, 17, 5748. [Google Scholar] [CrossRef]
- Ji, W.; Yu, S.; Shen, Z.; Wang, M.; Cheng, G.; Yang, T.; Yuan, Q. Knowledge Mapping with CiteSpace, VOSviewer, and SciMAT on Intelligent Connected Vehicles: Road Safety Issue. Sustainability 2023, 15, 12003. [Google Scholar] [CrossRef]
- Shen, S.; Cheng, C.X.; Yang, J.; Yang, S.L. Visualized analysis of developing trends and hot topics in natural disaster research. PLoS ONE 2018, 13, E0191250. [Google Scholar] [CrossRef]
- van Eck, N.J.; Waltman, L. Software survey: VOSviewer, a computer program for bibliometric mapping. Scientometrics 2010, 84, 523–538. [Google Scholar] [CrossRef] [PubMed]
- Cheng, G.; Wang, Z.X.; Li, G.Q.; Ni, Y.F.; Xu, L. Visual analysis of bibliometric research on landslide monitoring in China. China Saf. Sci. J. 2022, 32, 172–179. [Google Scholar] [CrossRef]
- Yan, K.; Chen, H.M.; Fu, D.J.; Zeng, Y.L.; Dong, J.W.; Li, S.W.; Wu, Q.S.; Li, H.L.; Du, S.Y. Bibliometric visualization analysis related to remote sensing cloud computing platforms. Natl. Remote Sens. Bull. 2022, 26, 310–323. [Google Scholar] [CrossRef]


Disclaimer/Publisher’s Note: The statements, opinions and data contained in all publications are solely those of the individual author(s) and contributor(s) and not of MDPI and/or the editor(s). MDPI and/or the editor(s) disclaim responsibility for any injury to people or property resulting from any ideas, methods, instructions or products referred to in the content. |
© 2025 by the authors. Licensee MDPI, Basel, Switzerland. This article is an open access article distributed under the terms and conditions of the Creative Commons Attribution (CC BY) license (https://creativecommons.org/licenses/by/4.0/).