
Determining Optimum Coal Bottom Ash/Slag Content for Sustainable Concrete Infrastructure


Abstract
1. Introduction
2. Materials and Methods
2.1. Experimental Plan
2.2. Material
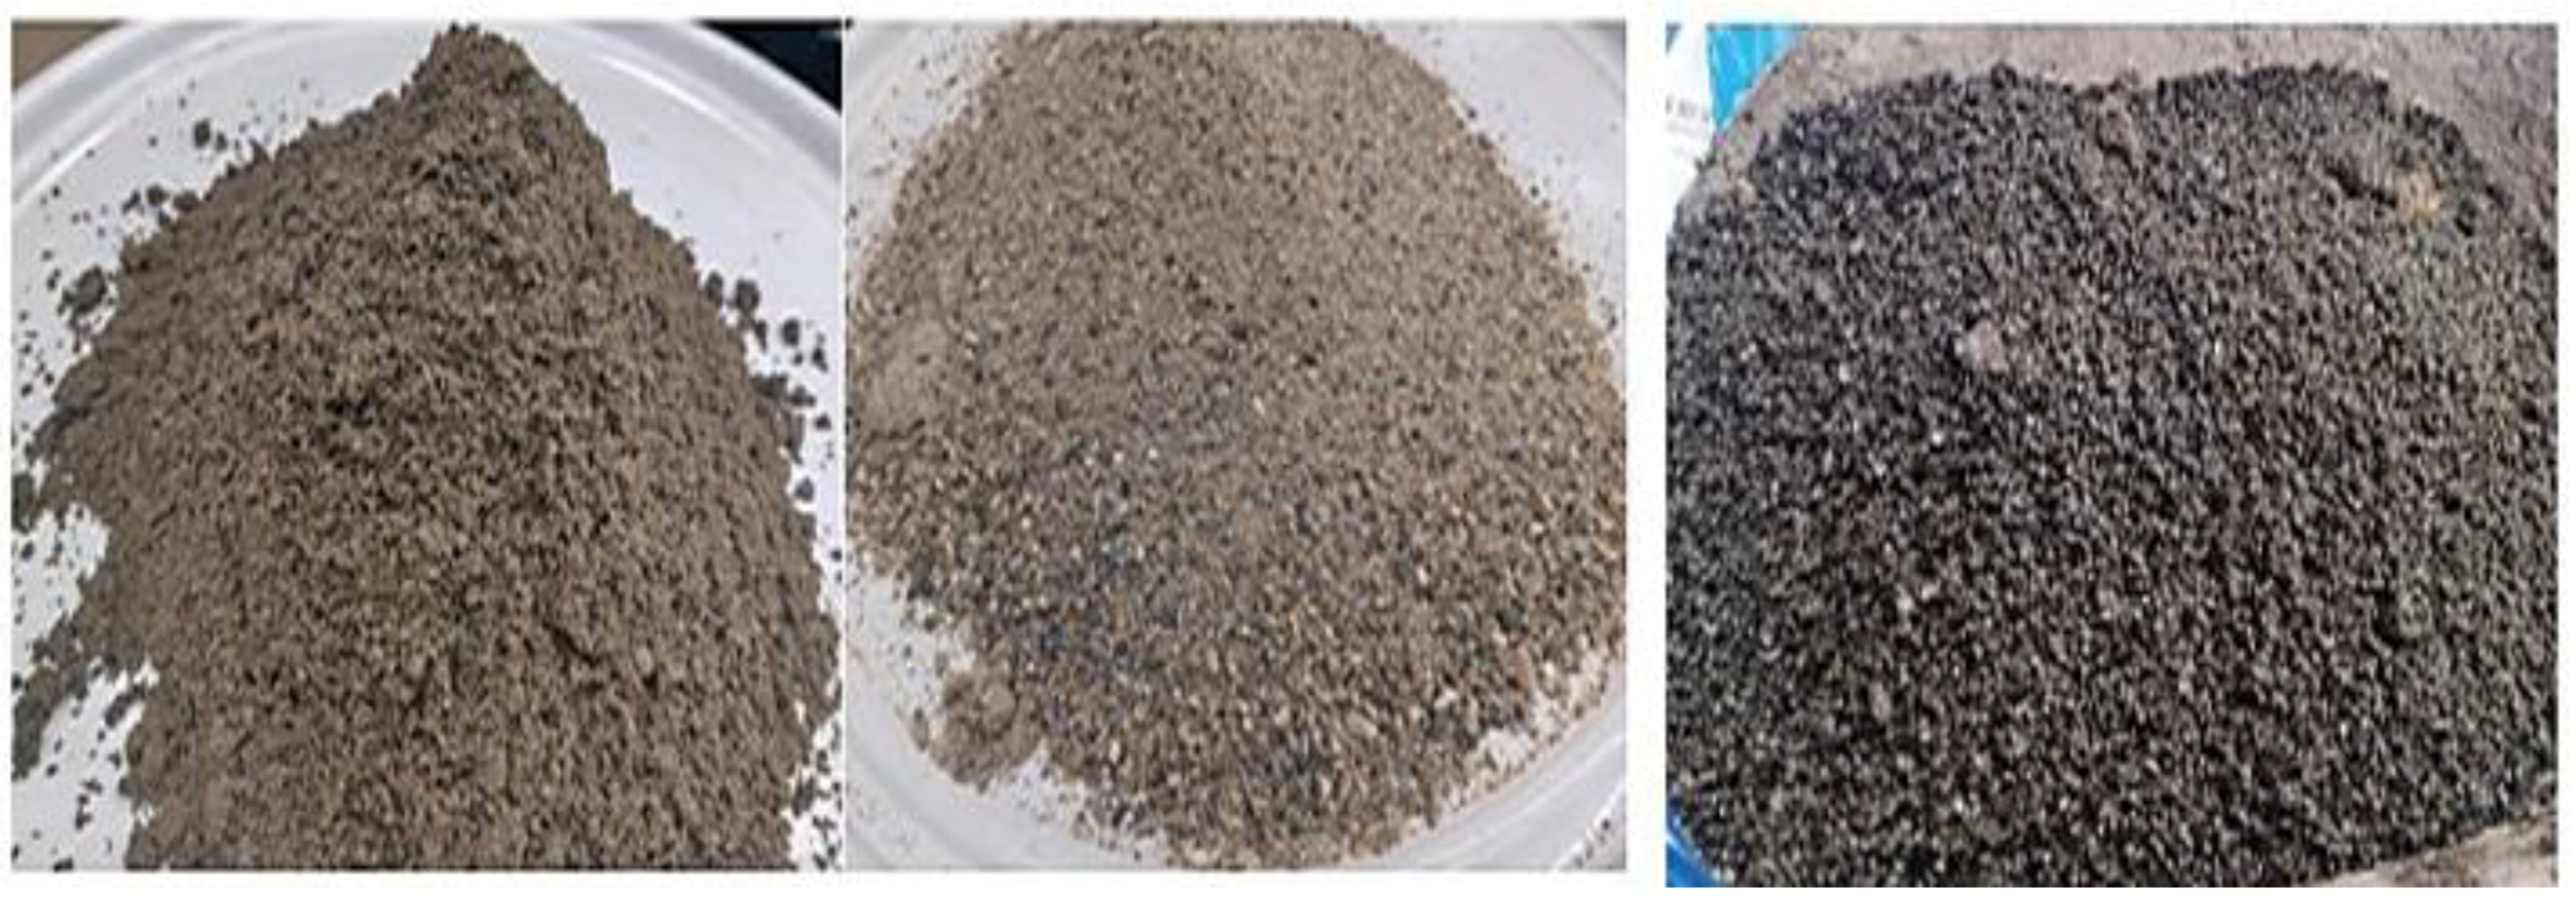
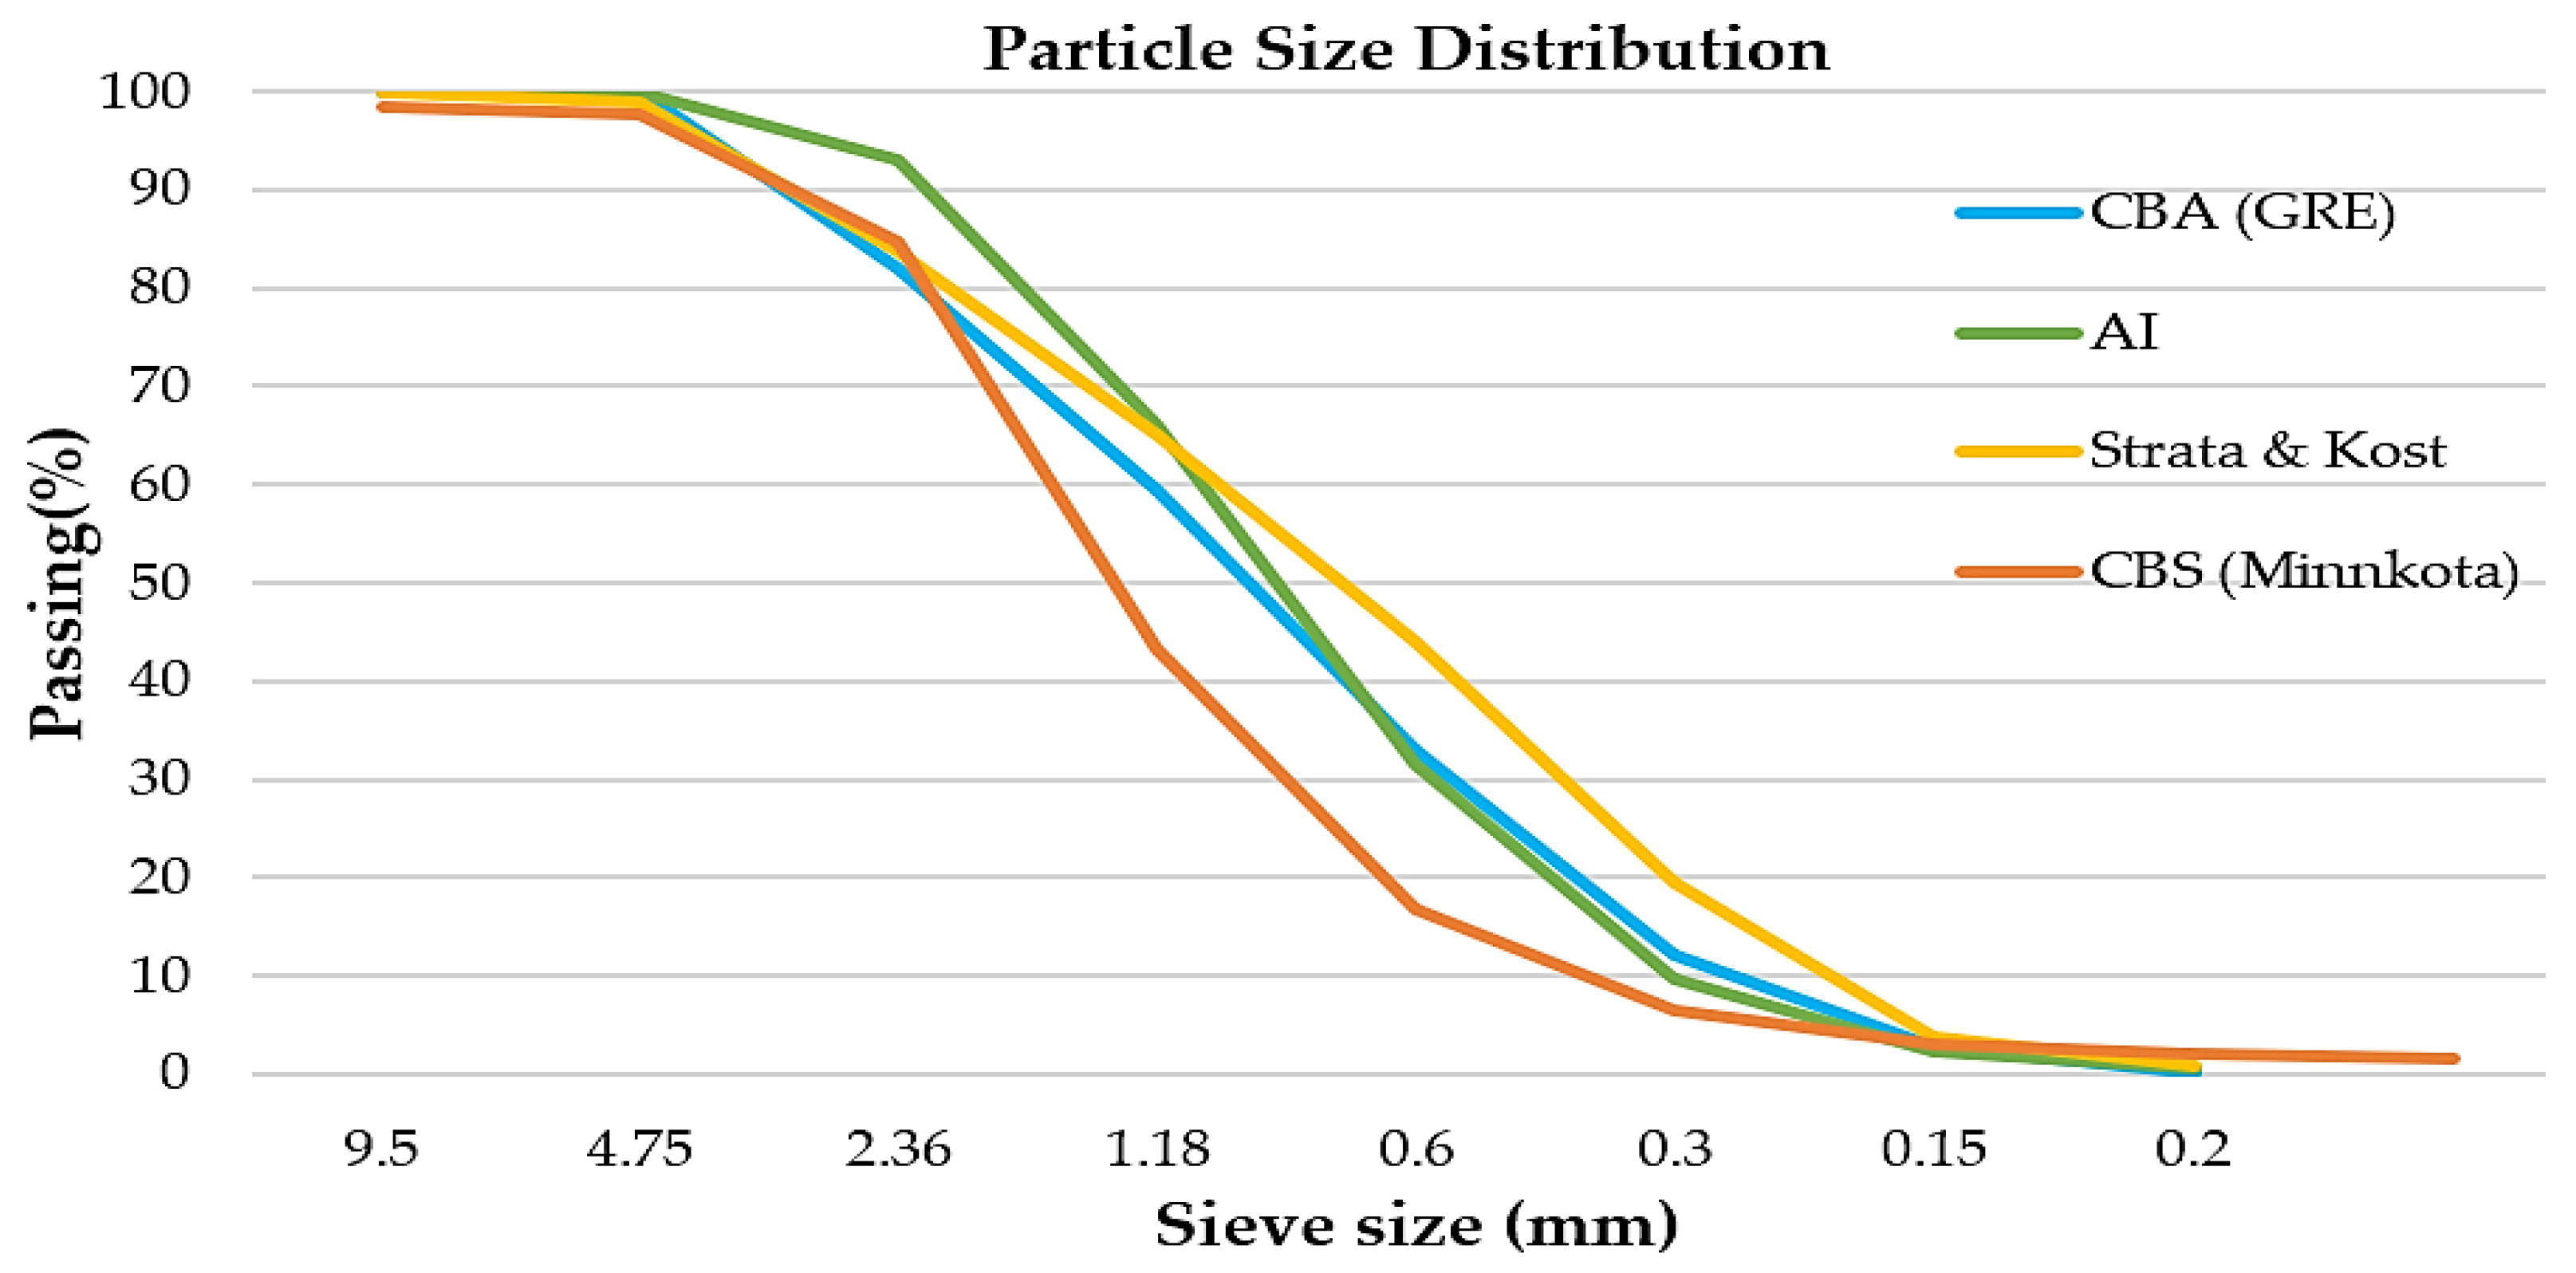
2.2.1. Fine and Coarse Aggregate, CBA, and CBS
2.2.2. Physical Properties of CBA and CBS
2.2.3. Chemical Properties of CBA and CBS
2.2.4. Water Reducer and Superplasticizer
2.2.5. Nanoclay
2.3. Mix Design
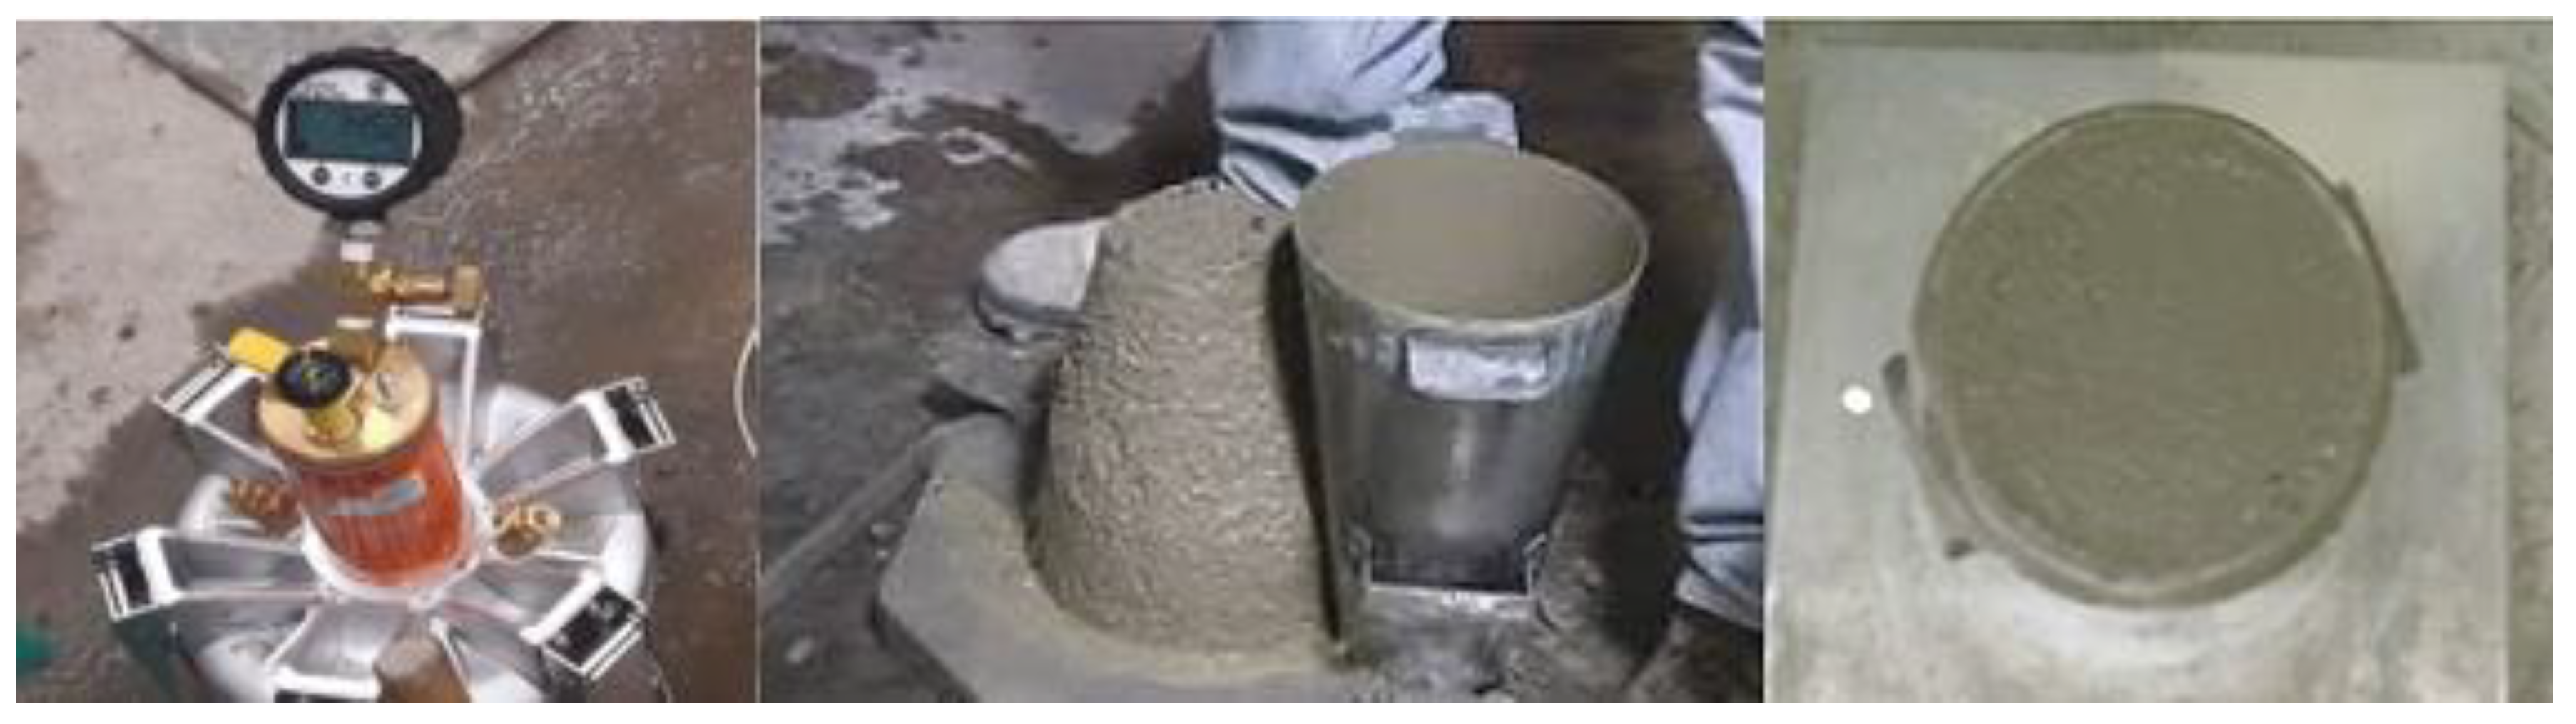
2.4. Testing
3. Results and Discussions
3.1. Strata Mix
3.1.1. Fresh Properties of % CBA and Strata Control
3.1.2. Compressive Strength of % CBA and Strata Control
3.2. Aggregate Industries Mix
3.2.1. Fresh Properties of % CBA and AI Control
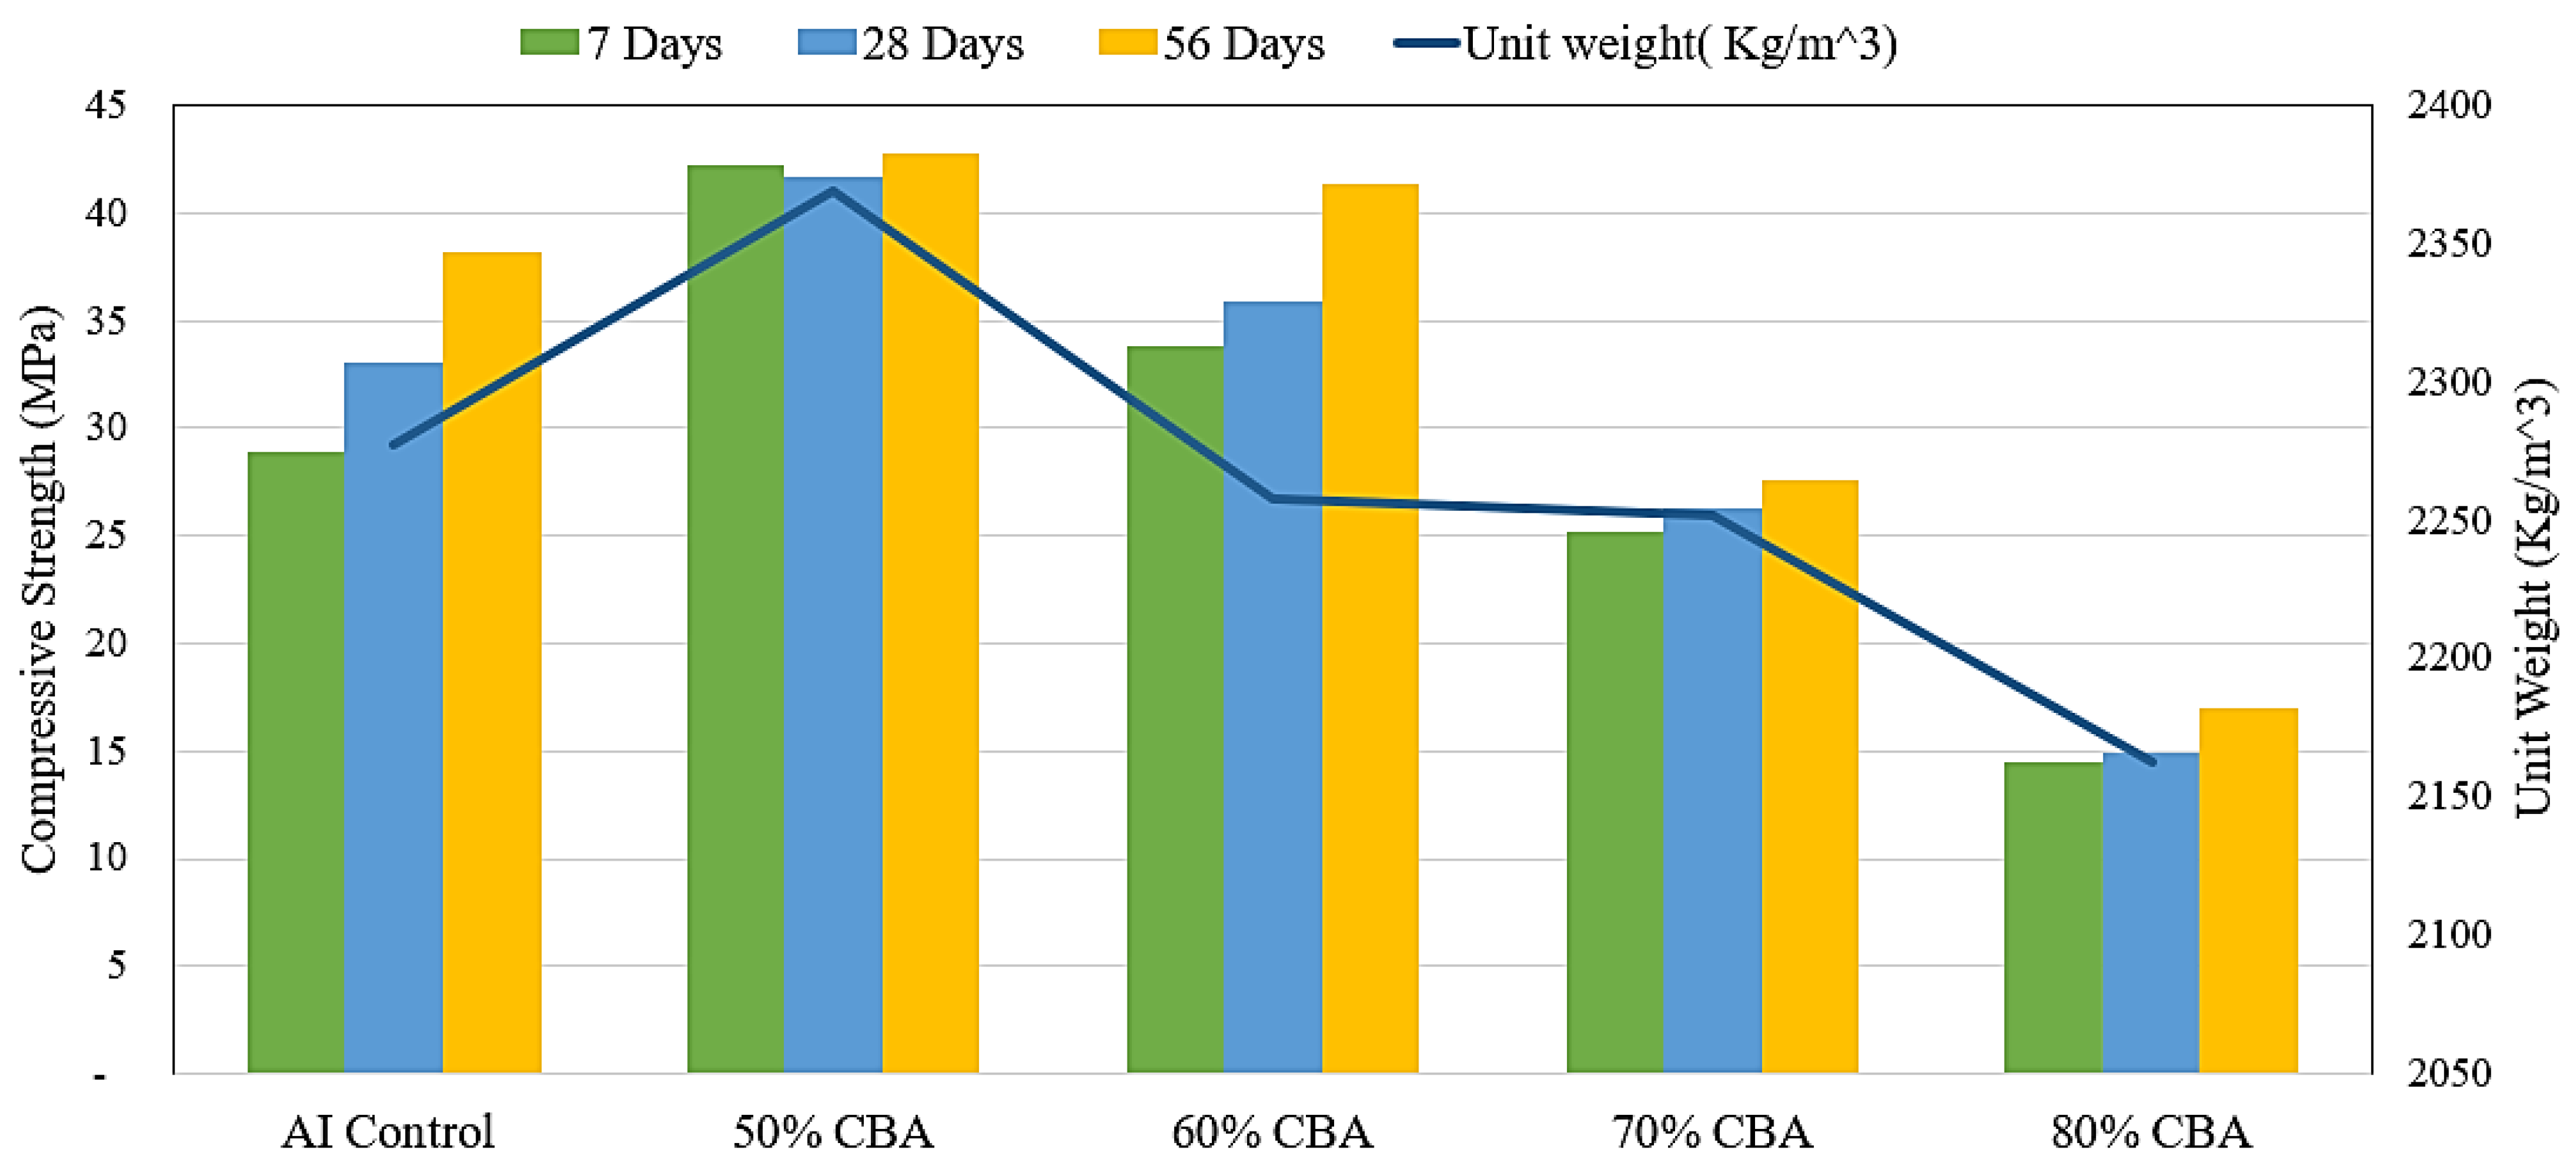
3.2.2. Compressive Strength of % CBA and AI Control
3.3. Kost Mix
3.3.1. Fresh Properties of % CBA and Kost Control
3.3.2. Compressive Strength of % CBA and Kost Control
3.4. CBS at Kost and Strata Projects
3.4.1. Fresh Properties of Kost and Strata CBS Concrete
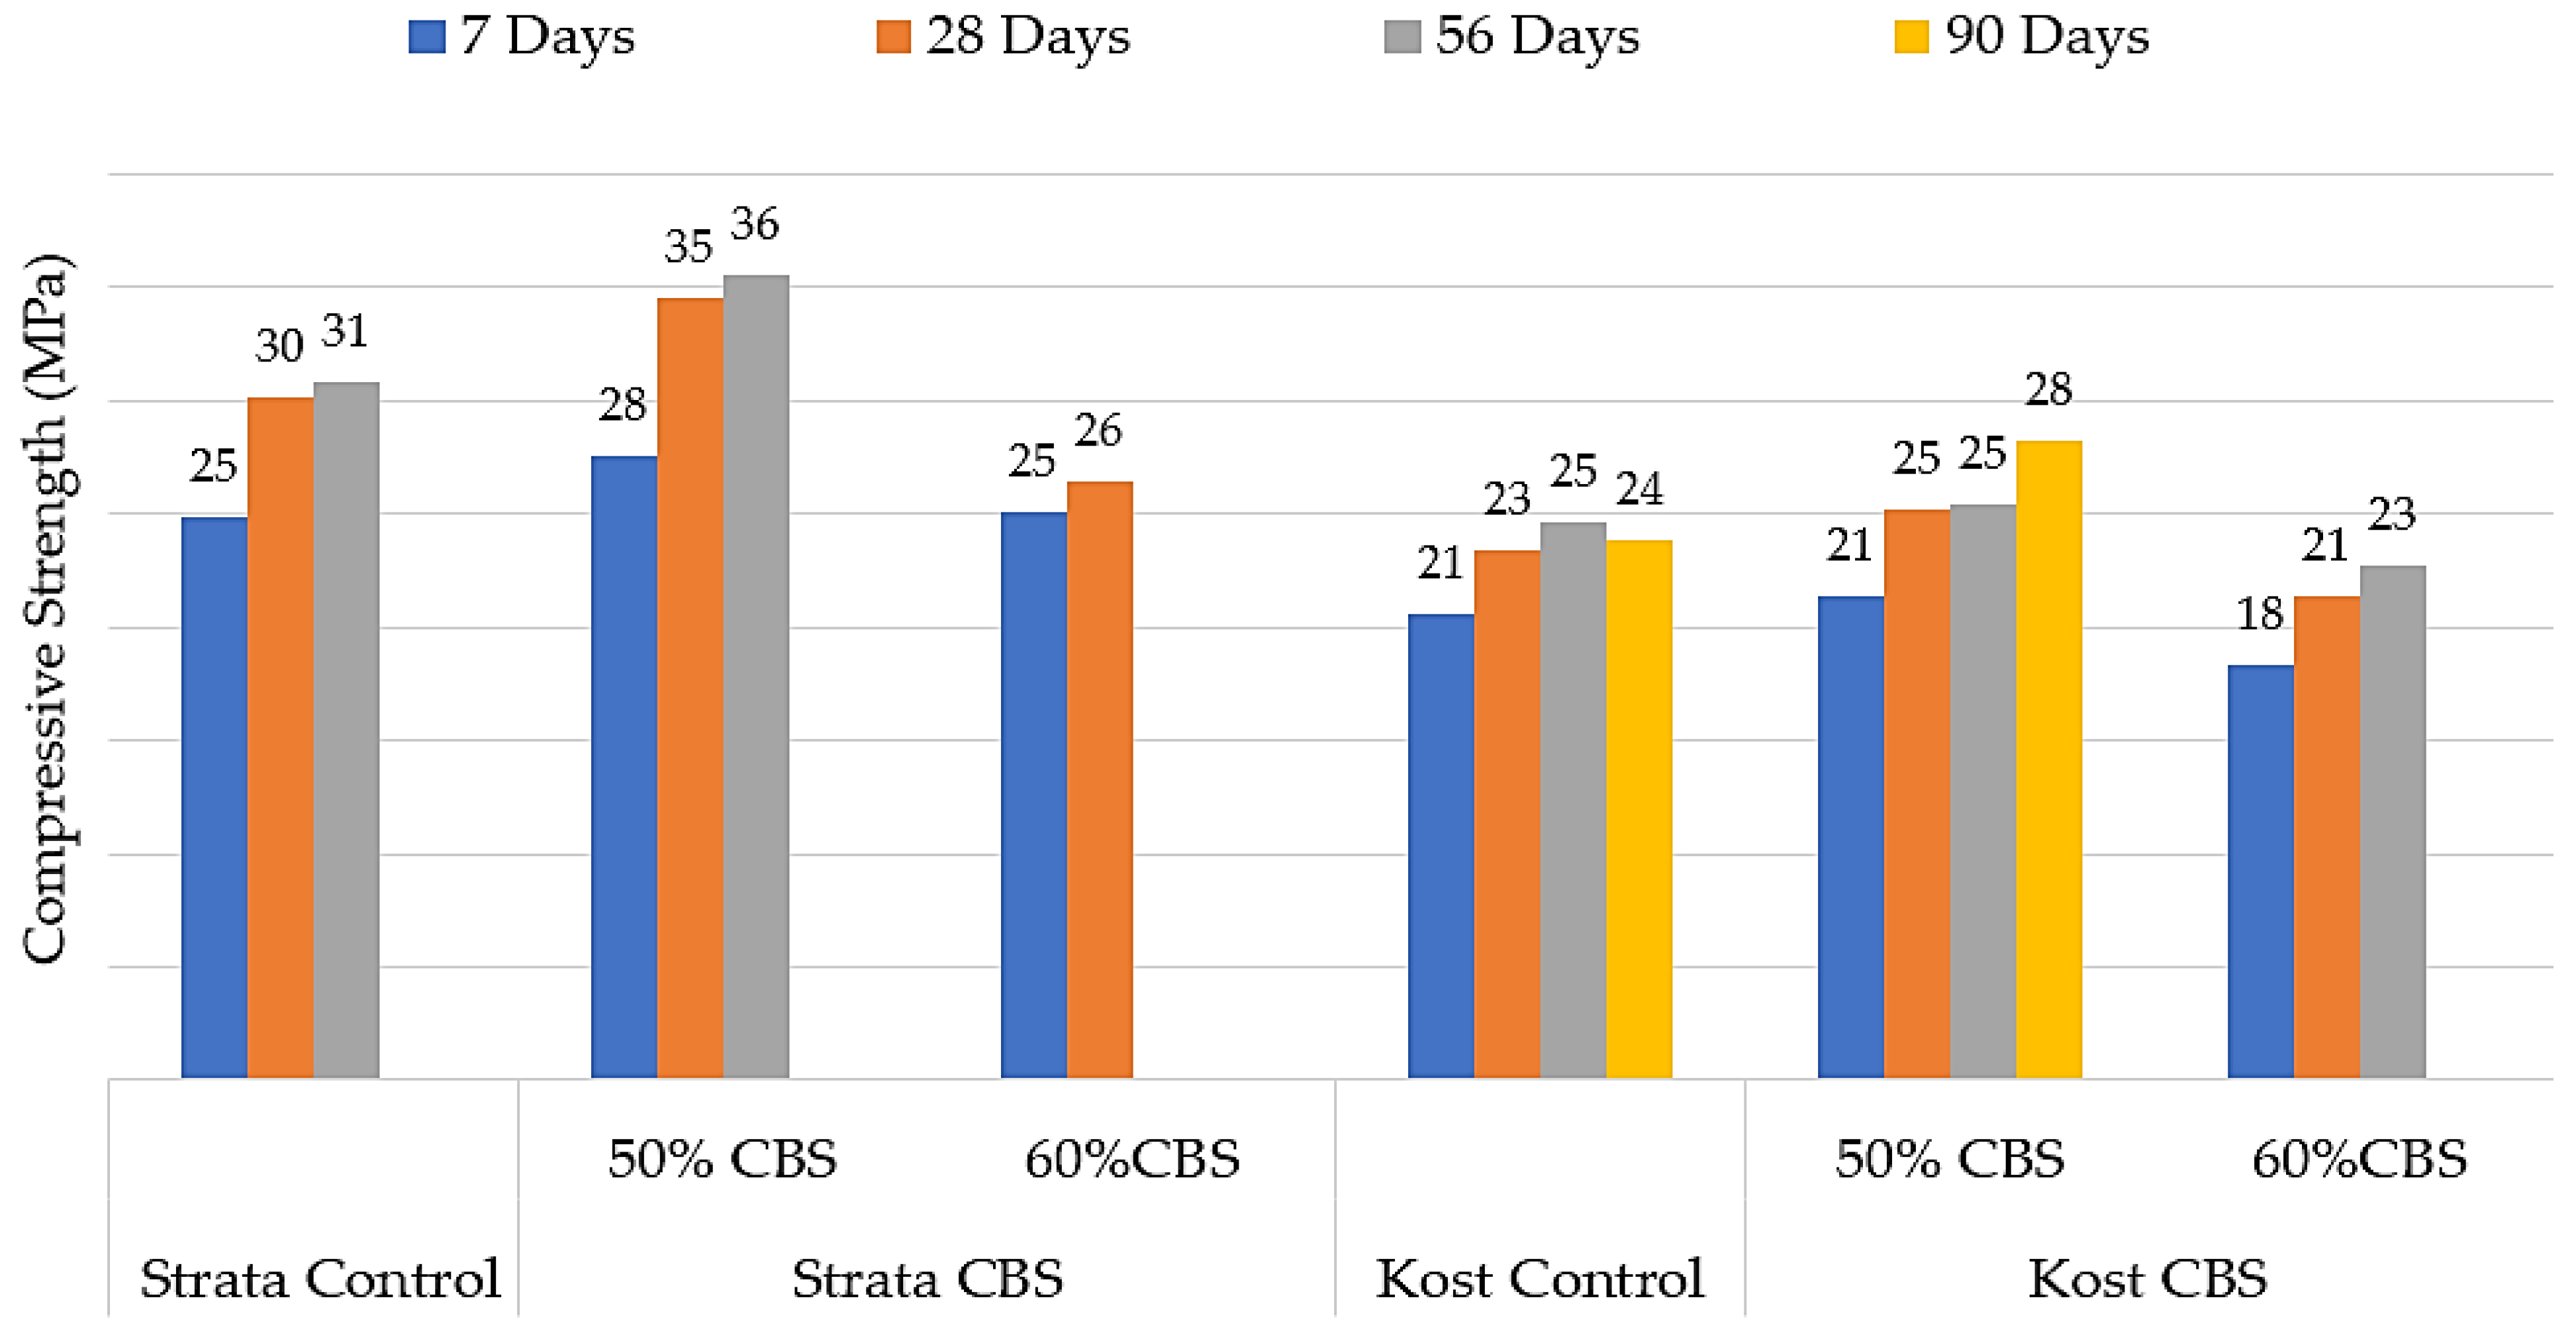
3.4.2. Compressive Strength of the Strata and Kost, % CBS and Relative to Controls
3.5. Effect of Nanoclay on Optimum Content for AI Project
3.5.1. Fresh Properties of % CBA, AI and Nanocaly
3.5.2. Compressive Strength
4. Conclusions and Recommendations
- The optimum content of CBA and CBS in concrete is at least 50%, which indicates that both materials could replace a minimum of 50% fine aggregate in a concrete mix.
- The 50% CBA concrete yielded a comparable unit weight to the controls. However, 50% CBS concrete has a slightly higher unit weight than the control and the 50% CBA concrete.
- Using a high-range water reducer minimizes the decrease in workability by replacing fine aggregate with CBA.
- After 7 days, 28 days, and 56 days of curing, the 50% CBA concrete had 15%, 43%, and 42% higher compressive strength than the control, respectively, and compressive strength higher than that of the 50% CBS concrete, indicating that CBA concrete yields higher compressive strength than CBS. However, both 50% CBA and CBS concrete have higher compressive strengths than the control, which is a promising result in terms of sustainability.
- Nanoclay increases CBA concrete compressive strength at an early age of curing, and adding 2.5% nanoclay in CBA concrete increases the optimum CBA content from 50% to 80%.
- The materials used in this experiment have no water content; both CBA/CBS are oven-dried. A moisture correction calculation was used to replace fine aggregate with CBA/CBS. Therefore, minor impreciseness is expected during calculation errors, and the materials’ moisture content and properties vary.
- Further study is needed to see how a water reducer affects the compressive strength of CBA concrete.
- The mechanical and durability properties of CBA concrete should be assessed from various perspectives and compared to the same control.
Author Contributions
Funding
Institutional Review Board Statement
Informed Consent Statement
Data Availability Statement
Acknowledgments
Conflicts of Interest
References
- Ismail, S.; Hoe, K.W.; Ramli, M. Sustainable aggregates: The potential and challenge for natural resources conservation. Procedia-Soc. Behav. Sci. 2013, 101, 100–109. [Google Scholar] [CrossRef]
- Ramos, T.; Matos, A.M.; Sousa-Coutinho, J. Mortar with wood waste ash: Mechanical strength carbonation resistance and ASR expansion. Constr. Build. Mater. 2013, 49, 343–351. [Google Scholar] [CrossRef]
- Netherlands Environmental Assessment Agency. Trends in Global CO2 Emissions; Netherlands Environmental Assessment Agency: Hague, The Netherlands, 2015. [Google Scholar]
- Kirthika, S.K.; Singh, S.K.; Chourasia, A. Alternative fine aggregate in the production of sustainable concrete—A review. J. Clean. Prod. 2020, 268, 122089. [Google Scholar]
- Gedafa, D.S.; Tolliver, S. Investigating the Use of Fly Ash and Nanomaterials for Sustainable Concrete Infrastructure. Int. J. Eng. Res. Technol. 2016, 5, 173–177. [Google Scholar]
- Mangi, S.; Ibrahim, M.H.; Jamaluddin, N.; Arshad, M.; Putra Jaya, R. Effects of Ground Coal Bottom Ash on the Properties of Concrete. J. Eng. Sci. Technol. 2019, 14, 338–350. [Google Scholar]
- Ganesan, H.; Sachdeva, A.; Petrounias, P.; Lampropoulou, P.; Sharma, P.K.; Kumar, A. Impact of Fine Slag Aggregates on the Final Durability of Coal Bottom Ash to Produce Sustainable Concrete. Sustainability 2023, 15, 6076. [Google Scholar] [CrossRef]
- Babcock; Wilcox. Steam, Its Generation, and Use, 39th ed.; Kessinger Publishing: Whitefish, MT, USA, 1978. [Google Scholar]
- NETL National Energy Technology Laboratory. Clean Coal Technology Report: Coal Utilization by-Products; Department of Energy Office of Fossil Energy: Washington, DC, USA, 2006; No. 24. [Google Scholar]
- Abbas, S.; Arshad, U.; Abbass, W.; Nehdi, M.L.; Ahmed, A. Recycling Untreated Coal Bottom Ash with Added Value for Mitigating Alkali-Silica Reaction in Concrete: A Sustainable Approach. Sustainability 2020, 12, 10631. [Google Scholar] [CrossRef]
- Production; Use Reports. ACAA. 2021. Available online: https://acaa-usa.org/publications/production-use-reports/ (accessed on 26 January 2023).
- Baig, A.M.; Varghese, V. Coal Bottom Ash as a Concrete Ingredient: Review. Proc. Sustain. Dev. Manag. 2019. [Google Scholar] [CrossRef]
- Cheriaf, M.; Rocha, J.C.; Péra, J. Pozzolanic Properties of Pulverized Coal Combustion Bottom Ash. Cem. Concr. Res. 1999, 29, 1387–1391. [Google Scholar] [CrossRef]
- Abdulmatin, A.; Tangchirapat, W.; Jaturapitakkul, C. An Investigation of Bottom Ash as a Pozzolanic Material. Constr. Build. Mater. 2018, 186, 155–162. [Google Scholar] [CrossRef]
- Kim, H.K.; Lee, H.K. Use of Power Plant Bottom Ash as Fine and Coarse Aggregates in High-Strength Concrete. Constr. Build. Mater. 2011, 25, 1115–1122. [Google Scholar] [CrossRef]
- Lee, H.; Kim, H.; Hwang, E. Utilization of Power Plant Bottom Ash as Aggregates in Fiber-Reinforced Cellular Concrete. Waste Manag. 2010, 30, 274–284. [Google Scholar] [CrossRef]
- Singh, M.; Siddique, R. Effect of Coal Bottom Ash as Partial Replacement of Sand on Properties of Concrete. Resour. Conserv. Recycl. 2013, 72, 20–32. [Google Scholar] [CrossRef]
- Maliki, A.I.F.A.; Shahidan, S.; Ali, N.; Hannan, N.I.R.R.; Zuki, S.S.M.; Ibrahim, M.H.W.; Azmi, M.A.M.; Rahim, M.A. Compressive and Tensile Strength for Concrete Containing Coal Bottom Ash. In Proceedings of the IOP Conference Series: Earth and Environmental Science, Johor Bahru, Malaysia, 28–29 August 2017; Volume 271. [Google Scholar]
- Raju, R.; Paul, M.; Aboobacker, K.A. Strength performance of concrete using bottom ash as fine aggregate. Int. J. Res. Eng. Technol. 2014, 2, 111–122. [Google Scholar]
- Kim, H.-K.; Lee, H.-K. Coal bottom ash in field of civil engineering: A review of advanced applications and environmental considerations. KSCE J. Civ. Eng. 2015, 19, 1802–1818. [Google Scholar] [CrossRef]
- Amaya, P.; Amaya, A.J. The use of Bottom Ash in the design of the dam. In Proceedings of the 2007 World of Coal Ash (WOCA), Covington, KT, USA, 7–10 May 2007. [Google Scholar]
- Lynn, C.J.; Obe RK, D.; Ghataora, G.S. Municipal incinerated bottom ash characteristics and potential for use as aggregate in concrete. Constr. Build. Mater. 2016, 127, 504–517. [Google Scholar] [CrossRef]
- Ramme, B.W.; Tharaniyil, M.P. Coal Combustion Products Utilization Handbook; We Energies Publication: Milwaukee, WI, USA, 2004. [Google Scholar]
- Ksaibati, K.; Conner, G.L. Laboratory Evaluation of the Bottom Ash Asphalt Mixes; Department of Civil & Architectural Engineering, University of Wyoming: Laramie, WY, USA, 2004. [Google Scholar]
- Ksaibati, K.; Sayiri, S.R.K. Utilization of Wyoming Bottom Ash in Asphalt Mixes; Department of Civil & Architectural Engineering, University of Wyoming: Laramie, WY, USA, 2006. [Google Scholar]
- American Coal Ash Association (ACAA). 2009 Coal Combustion Product (CCP) Production & Use Survey Report; American Coal Ash Association (ACAA): Alexandria, VA, USA, 2010. [Google Scholar]
- Poudel, S.; Menda, S.; Useldinger-Hoefs, J.; Guteta, L.E.; Dockter, B.; Gedafa, D.S. The Use of Ground Coal Bottom Ash/Slag as a Cement Replacement for Sustainable Concrete Infrastructure. Materials 2024, 17, 2316. [Google Scholar] [CrossRef]
- Ibrahim, M.H.W.; Basirun, N.F.; Jamaluddin, N.; Jaya, P.R. A Review: The Effect of Grinded Coal Bottom Ash on Concrete. In Proceedings of the MATEC Web of Conferences, Melaka, Malaysia, 5 April 2017. [Google Scholar] [CrossRef]
- Vera-Agullo, J.; Chozas-Ligero, V.; Portillo-Rico, D.; García-Casas, M.J.; Gutiérrez-Martínez, A.; Mieres-Royo, J.M.; Grávalos-Moreno, M. Mortar and Concrete Reinforced with Nanomaterials. Nanotechnol. Constr. 2009, 3, 383–388. [Google Scholar]
- Ji, T. Preliminary study on concrete’s water permeability and microstructure incorporating nano-SiO2. Cem. Concr. Res. 2005, 35, 1943–1947. [Google Scholar] [CrossRef]
- Kumari, K.; Preetha, R.; Ramachandran, D.; Vishwakarma, V.; George, R.P.; Sundaramurthy, U.; Mudali, U.K.; Pillai, C.S. Nanoparticles for enhancing mechanical properties of fly ash concrete. Mater. Today Proceeding 2016, 3, 2387–2393. [Google Scholar] [CrossRef]
- Mansi, A.; Sor, N.H.; Hilal, N.; Qaidi, S.M. The Impact of Nano Clay on Normal and High-performance Concrete Characteristics: A Review. In Proceedings of the IOP Conference Series: Earth and Environmental Science, Baghdad, Iraq, 3–4 November 2022; Volume 961. [Google Scholar] [CrossRef]
- Menda, S. Determining Optimum Coal Bottom Ash Content for Sustainable Concrete Infrastructure. Master’s Thesis, University of North Dakota, Grand Forks, ND, USA, 2022. [Google Scholar]
- AASHTOT 84-13; Standard Method of Test for Specific Gravity and Absorption of Fine Aggregate. American Association of State Highway and Transportation Officials: Washington, DC, USA, 2013.
- AASHTOT 85-14; Standard Method of Test for Specific Gravity and Absorption of Coarse Aggregate. American Association of State Highway and Transportation Officials: Washington, DC, USA, 2018.
- ASTM C136/C136M-19; Standard Test Method for Sieve Analysis of Fine and Coarse Aggregates. ASTM International: West Conshohocken, PA, USA, 2020.
- ASTMC138/C138M-17; Standard Test Method for Density (Unit Weight), Yield, and Air Content (Gravimetric) of Concrete. ASTM International: West Conshohocken, PA, USA, 2017.
- AASHTO T 27-20; Standard Test Method of Sieve Analysis of Fine and Coarse Aggregates. American Association of State Highway and Transportation Officials: Washington, DC, USA, 2020.
- Allujami, H.M.; Abdulkareem, M.; Jassam, T.M.; Al-Mansob, R.A.; Ng, J.L.; Ibrahim, A. Nanomaterials in Recycled Aggregates Concrete Applications: Mechanical Properties and Durability. A Review. Cogent Eng. 2022, 9, 2122885. [Google Scholar] [CrossRef]
- AASHTO R 39M/R 39-19; Standard Practice for Making and Curing Concrete Test Specimens in the Laboratory. American Association of State Highway and Transportation Officials: Washington, DC, USA, 2019.
- ASTM C143/C143M-20; Standard Test Method for Slump of Hydraulic-Cement Concrete. ASTM International: West Con-shohocken, PA, USA, 2020.
- AASHTO T 22 M/T 22-20; Standard Method of Test for Compressive Strength of Cylindrical Concrete Specimens. American Association of State Highway and Transportation Officials: Washington, DC, USA, 2020.


| Physical Properties | Bulk Specific Gravity | Bulk SSD Specific Gravity | Absorption (%) | Fineness Modulus | ||
|---|---|---|---|---|---|---|
| Strata Corporation | Fine Aggregate | Lab | 2.62 | 2.641 | 0.36 | 2.85 |
| Supplier | 2.67 | 2.678 | 0.36 | 2.86 | ||
| Coarse Aggregate | Lab | 2.61 | 2.634 | 0.91 | - | |
| Supplier | 2.66 | 2.69 | 0.91 | - | ||
| Aggregate Industries | Fine Aggregate | Lab | 2.64 | 2.657 | 0.542 | 2.9 |
| Supplier | 2.66 | 2.671 | 0.558 | 2.5 | ||
| Coarse Aggregate | Lab | 2.63 | 2.663 | 1.21 | - | |
| Supplier | 2.69 | 2.715 | 0.86 | - | ||
| Kost Materials | Fine Aggregate | Lab | 2.65 | 2.65 | 0.38 | 2.74 |
| Supplier | 2.67 | 2.678 | 0.36 | 2.86 | ||
| Coarse Aggregate | Lab | 2.64 | 2.688 | 0.86 | - | |
| Supplier | 2.69 | 2.709 | Not Received | - | ||
| CBA | Coal Creek | Lab | 2.23 | 2.26 | 2.31 | 2.55 |
| Supplier | NA | NA | NA | NA | ||
| CBS | MR Young | Lab | 2.23 | 2.26 | 2.31 | 2.55 |
| Supplier | NA | NA | NA | NA |
| Constituents Percentage by Weight (%) | CBA (GRE) | CBS (Minnkota) |
|---|---|---|
| 51.87 | 47.9 | |
| 13.98 | 14.87 | |
| 7.20 | 12.55 | |
| Sum of Oxides | 73.05 | 75.32 |
| 0.62 | 0.62 | |
| CaO | 15.05 | 12.34 |
| MgO | 4.63 | 4.48 |
| 0.66 | 0.21 | |
| 1.83 | 3.33 | |
| 1.7 | 1.71 | |
| 0.2 | 0.09 | |
| Total | 97.75 | 98.1 |
| Sro | 0.31 | 0.29 |
| BaO | 0.39 | 0.53 |
| Sum | 98.44 | 98.92 |
| Mix Design | Control | 10% | 20% | 30% | 40% | 50% | 60% | 70% | 80% |
|---|---|---|---|---|---|---|---|---|---|
| Material (Kg/m3) | CBA | CBA | CBA | CBA | CBA | CBA | CBA | CBA | |
| Cement | 335 | 335 | 335 | 335 | 335 | 335 | 335 | 335 | 335 |
| Coarse Aggregate | 973 | 973 | 973 | 973 | 973 | 973 | 973 | 973 | 973 |
| Coarse Aggregate # 2 | 74 | 74 | 74 | 74 | 74 | 74 | 74 | 74 | 74 |
| Fine Aggregate | 819 | 737 | 655 | 573 | 491 | 409 | 327 | 246 | 164 |
| CBA (GRE) | - | 68 | 135 | 203 | 270 | 338 | 406 | 473 | 541 |
| Water | 151 | 151 | 151 | 151 | 151 | 151 | 151 | 151 | 151 |
| Air Content (mL/m3) | 115 | 115 | 115 | 115 | 115 | 115 | 115 | 115 | 115 |
| Water Reducer (mL/m3) | 706 | 1236 | 1766 | 2649 | 3178 | ||||
| W/C | 0.45 | 0.45 | 0.45 | 0.45 | 0.45 | 0.45 | 0.45 | 0.45 | 0.45 |
| Mix Design | Control | 50% CBS | 60% CBS |
|---|---|---|---|
| ) | |||
| Cement | 335 | 335 | 335 |
| Coarse Aggregate # 1 | 973 | 973 | 973 |
| Coarse Aggregate # 2 | 74 | 74 | 74 |
| Fine Aggregate | 819 | 407 | 324 |
| CBS (Minnkota) | - | 411 | 494 |
| Water Reducer (mL/) | - | 177 | 177 |
| Water | 151 | 151 | 151 |
| Air content (mL/) | 115 | 115 | 115 |
| W/C | 0.45 | 0.45 | 0.45 |
| Mix Design | Kost | AI | AI | ||||||||
|---|---|---|---|---|---|---|---|---|---|---|---|
| Material (kg/m3) | Control | 50% | 60% | 70% | Control | 50% | 60% | 70% | 80% | 2.5% NanoClay | 2.5% NanoClay |
| CBA | CBA | CBA | CBA | CBA | CBA | CBA | 70% CBA | 80% CBA | |||
| Cement | 367 | 367 | 367 | 367 | 335 | 335 | 335 | 335 | 335 | 328.3 | 328.3 |
| Coarse Aggregate | 1133 | 1133 | 1133 | 1133 | 1048 | 1048 | 1048 | 1048 | 1048 | 1048 | 1048 |
| Fine Aggregate | 583 | 291 | 233 | 175 | 794 | 397 | 317 | 238 | 158 | 238 | 158 |
| CBA (GRE) | - | 241 | 289 | 337 | - | 329 | 395 | 461 | 527 | 461 | 527 |
| Water | 154 | 154 | 154 | 154 | 151 | 151 | 151 | 151 | 151 | 151 | 151 |
| Air Content (mL/m3) | 239 | 239 | 239 | 239 | 124 | 124 | 124 | 124 | 124 | 124 | 124 |
| High Range Water Reducer (mL/m3) | - | - | - | - | 311 | 706 | 1413 | 2119 | 2471 | 2119 | 2471 |
| W/C | 0.42 | 0.42 | 0.42 | 0.42 | 0.45 | 0.45 | 0.45 | 0.45 | 0.45 | 0.45 | 0.45 |
| Mix Design | Kost | ||
|---|---|---|---|
| Material (kg/m3) | Control | 50% CBS | 60% CBS |
| Cement | 367 | 367 | 367 |
| Coarse Aggregate | 1133 | 1133 | 1133 |
| Fine Aggregate | 583 | 291 | 233 |
| CBS (Minnkota) | - | 290 | 347 |
| Water | 154 | 154 | 154 |
| Air Content (mL/m3) | 239 | 239 | 239 |
| W/C | 0.42 | 0.42 | 0.42 |
| Fresh Properties | Strata Control | 10% CBA | 20% CBA | 30% CBA | 40% CBA | 50% CBA | 60% CBA | 70% CBA | 80% CBA |
|---|---|---|---|---|---|---|---|---|---|
| Measured Slump (cm) | 9.5 | 5.1 | 2.5 | 1.9 | 1.9 | 6.4 | 5.1 | 0.0 | 0.0 |
| Measured Air Content (%) | 7.4 | 5.6 | 5.9 | 5.4 | 5.9 | 7.9 | 9.6 | 9.9 | 11.9 |
| Measured Unit Weight (kg/) | 2291 | 2322 | 2322 | 2322 | 2315 | 2258 | 2207 | 2149 | 2111 |
| Fresh Properties | AI Control | 50% CBA | 60% CBA | 70% CBA | 80% CBA |
|---|---|---|---|---|---|
| Measured Slump (cm) | 10.2 | 1.3 | 3.2 | 2.0 | 2.5 |
| Measured Air Content (%) | 8.8 | 4.4 | 7.9 | 8.3 | 11.9 |
| Measured Unit Weight (kg/) | 2276 | 2273 | 2258 | 2243 | 2162 |
| Fresh Properties | Kost Control | 50% CBA | 60% CBA | 70% CBA |
|---|---|---|---|---|
| Measured Slump (cm) | 12.1 | 7.6 | 7.9 | 15.2 |
| Measured Air Content (%) | 8.1 | 6.2 | 6.3 | 13.1 |
| Measured Unit Weight (kg/) | 2281 | 2303 | 2278 | 2102 |
| Fresh Properties | Strata Control | Strata CBS | Kost Control | Kost CBS | ||
|---|---|---|---|---|---|---|
| 50% CBS | 60% CBS | 50% CBS | 60% CBS | |||
| Measured Slump (cm) | 9.53 | 1.91 | 6.35 | 12.07 | 8.26 | 7.87 |
| Measured Air Content (%) | 7.40 | 4.60 | 7.70 | 8.10 | 7.80 | 7.50 |
| Measured Unit Weight (kg/) | 2291 | 2371 | 2287 | 2281 | 2307 | 2313 |
| Compressive Strength (MPa) | Kost Control | 50% CBA | 50% CBS |
|---|---|---|---|
| 7 Days | 21 | 29 | 21 |
| 28 Days | 23 | 39 | 25 |
| 56 Days | 25 | 40 | 25 |
| 90 Days | 24 | 44 | 28 |
| AI Control | Nanoclay AI 2.5% | ||
|---|---|---|---|
| Mix Design | 70% CBA | 80% CBA | |
| Measured Slump (cm) | 12.1 | 7.6 | 2.5 |
| Measured Air Content (%) | 8.8 | 5.8 | 3.8 |
| Measured Unit Weight (kg/) | 2278 | 2294 | 2332 |
| Compressive Strength (MPa) | |||
| 7 Days | 29 | 35 | 39 |
| 28 Days | 38 | 40 | 44 |
| 56 Days | 37 | 45 | |
| Compressive Strength (MPa) | |||
|---|---|---|---|
| Mix Design | 70% CBA Without Nanoclay | AI Control | 70% CBA with 2.5% Nanoclay |
| 7 Days | 27 | 29 | 35 |
| 28 Days | 32 | 38 | 40 |
| 56 Days | 37 | 45 | |
Disclaimer/Publisher’s Note: The statements, opinions and data contained in all publications are solely those of the individual author(s) and contributor(s) and not of MDPI and/or the editor(s). MDPI and/or the editor(s) disclaim responsibility for any injury to people or property resulting from any ideas, methods, instructions or products referred to in the content. |
© 2025 by the authors. Licensee MDPI, Basel, Switzerland. This article is an open access article distributed under the terms and conditions of the Creative Commons Attribution (CC BY) license (https://creativecommons.org/licenses/by/4.0/).
Share and Cite
Menda, S.; Poudel, S.; Useldinger-Hoefs, J.; Dockter, B.; Gedafa, D. Determining Optimum Coal Bottom Ash/Slag Content for Sustainable Concrete Infrastructure. Sustainability 2025, 17, 1429. https://doi.org/10.3390/su17041429
Menda S, Poudel S, Useldinger-Hoefs J, Dockter B, Gedafa D. Determining Optimum Coal Bottom Ash/Slag Content for Sustainable Concrete Infrastructure. Sustainability. 2025; 17(4):1429. https://doi.org/10.3390/su17041429
Chicago/Turabian StyleMenda, Samrawit, Sandip Poudel, Joe Useldinger-Hoefs, Bruce Dockter, and Daba Gedafa. 2025. "Determining Optimum Coal Bottom Ash/Slag Content for Sustainable Concrete Infrastructure" Sustainability 17, no. 4: 1429. https://doi.org/10.3390/su17041429
APA StyleMenda, S., Poudel, S., Useldinger-Hoefs, J., Dockter, B., & Gedafa, D. (2025). Determining Optimum Coal Bottom Ash/Slag Content for Sustainable Concrete Infrastructure. Sustainability, 17(4), 1429. https://doi.org/10.3390/su17041429