Abstract
The report of the 20th National Congress of the Communist Party of China has proposed to promote green development, which is an important concern in realizing agricultural green development (AGD). Based on the connotations of AGD, the mechanism of the impact of digital inclusive finance on AGD is explored from the perspective of agricultural technology innovation, agricultural production socialization services and rural industry integration. Using the spatial Durbin model from 2011 to 2021, the regional development differences in AGD are analyzed. The results are as follows. (1) The level of AGD in the eastern region is relatively high, and the regional distribution pattern of “east–middle–west” is generally formed from high to low. (2) In terms of the mechanism of action, digital inclusive finance has an impact on AGD, mainly by promoting agricultural technological innovation, improving the level of socialized services of agricultural production and promoting the integrated development of rural industries. (3) When the intensity of environmental regulation is high, the promotional effect of digital inclusive finance on AGD is greater, while, when environmental regulation is weak, the promotional effect of digital inclusive finance on AGD is small. When more attention is paid to AGD, the impact of digital inclusive finance on AGD is stronger; when the emphasis on AGD is small, the impact of digital inclusive finance on AGD is weaker. (4) The higher the level of AGD, the greater the role of digital inclusive finance in promoting AGD, and the impact in the eastern region is greater than that in the central and western regions.
1. Introduction
In recent years, as countries have defined deadlines for carbon neutrality, the question of how to accelerate the pace of agricultural green development (AGD) based on carbon neutrality has been of great concern [1]. The 2022 Emissions Gap Report released by the United Nations Environment Programme (UNEP) pointed out that the food system is responsible for about a third of the global greenhouse gas emissions. If nothing changes, the greenhouse gas emissions from the food system will double by 2050 [2,3]. China contributes 8% of these carbon emissions, most of which are from feed, livestock, and ruminant gas emissions. Existing research suggests that every country needs to adopt comprehensive and diversified agricultural green development measures, including improving the crop cultivation techniques, optimizing livestock management, enhancing the carbon sequestration capacity and promoting the use of renewable energy to effectively promote carbon emission reduction and sequestration in agriculture [4]. Agricultural green development is not only a only strategy that could enable China’s agriculture to achieve growth after relying on traditional development methods for a long time, but is also an important aspect in realizing agricultural modernization with Chinese characteristics, and it is also crucial to accomplish high-quality agricultural development to achieve better quality of life [5]. The report of the 20th National Congress of the Communist Party of China has made suggestions for green development improvement, which could promote harmonious coexistence between man and nature. It proposes important arrangements in four aspects: accelerating the green transformation of the development mode; deeply promoting the prevention and control of environmental pollution; improving the diversity, stability and sustainability of the ecosystem; and actively and steadily promoting carbon to peak carbon neutrality. Agriculture is the main area of green development. As China’s agricultural development enters a new stage, it is of great significance to study how to promote AGD, realize the high-quality development of agriculture, protect the green waters and green mountains and extend the Jinshan and Silver Mountains [6]. In essence, agricultural green development is a form of high-quality sustainable development. It is a development mode that aims to achieve optimal outputs and comprehensive benefits with minimal inputs and environmental costs. The core aim is to build a new layout system, production system, ecological system and living system based on the load capacity of resources and the environment and to change the development mode. This will promote a novel pattern of sustainable and high-quality growth in agriculture and rural areas that is characterized by resource protection, the safety of the ecological environment, the supply of green products and high quality of life.
During the “14th Five-Year Plan" period, China’s agriculture entered a key stage of green low-carbon transformation and high-quality development. However, whether it is agricultural green infrastructure construction, non-point source pollution control, green agricultural scientific and technological reformation or the development of circular agriculture, ecological agriculture, smart agriculture and other new forms of agriculture, this will result in increased financial needs, which cannot be met by financial support alone. In the existing research on the promotion of agricultural green development, financing constraints have always been considered as an important factor restricting agricultural progress [7,8]. Specifically, the hindering effect of financing constraints on China’s agricultural green development is mainly manifested in the difficulties faced by agricultural operators in terms of condition exclusion, marketing exclusion, price exclusion, evaluation exclusion, geographical exclusion and self-exclusion. Moreover, the information asymmetry between agricultural operators and formal financial institutions reduces the availability of agricultural financial services. Although informal financial institutions in some rural areas can provide certain financing channels for agricultural green development, their role is extremely limited, and they are not an effective means to reduce the access threshold of agricultural financial services. Relying on information technologies such as large models, 5G and AI, digital inclusive finance came into being. By decreasing the service costs of conventional financial institutions, digital inclusive finance further improves the penetration of financial services, expands the coverage of financial services and offers more efficient financing channels for the majority of the vulnerable agricultural production groups in rural areas, which have long been excluded by finance [9]. At present, although many studies have made great contributions regarding the influence of traditional rural finance on agricultural development, in the stage of agricultural green development, with the continuous sinking of digital financial elements into rural areas, there is still an opportunity to deepen the impact of digital inclusive finance on AGD. Specifically, does digital inclusive finance promote agricultural green development? If so, how does digital inclusive finance affect agricultural green development? Is there regional heterogeneity in the impact of the development level of digital inclusive finance on AGD and so on? The answers to these questions will be the core concerns of this paper. Based on the above, this paper intends to expand the existing research from the following four perspectives. First of all, we explore the temporal connotations of agricultural green development and build an evaluation index system; secondly, we explore the impact of digital inclusive finance on AGD and its heterogeneity; third, we identify the mission of digital inclusive finance in AGD; fourthly, we verify the threshold effect of digital inclusive finance on the impact of agricultural green development under different levels of environmental regulation and emphasis on AGD. This paper aims to enrich the theoretical achievements of digital inclusive finance and AGD so as to provide insights for relevant departments when formulating digital inclusive finance development promotion plans and agricultural green development strategies.
This paper is organized as follows. We put forward the theoretical analysis and research hypotheses in Section 2. We describe the connotations, comprehensive evaluation and space–time evolution of China’s agricultural green development in Section 3. In Section 4, we present the research design. Empirical results are provided in Section 5. Finally, Section 6 presents the conclusions and policy implications.
2. Theoretical Analysis and Research Hypotheses
2.1. Direct Impact of Digital Inclusive Finance in Promoting Agricultural Green Development
Digital inclusive finance is a combination of traditional inclusive finance and digital technology. With the rapid development of artificial intelligence, privacy computing, blockchain, large models and other technologies, digital inclusive finance has become a significant tool in financial services. It can serve as a new financial development model for high-quality development in China [10]. Driven by digital technologies, digital inclusive finance can provide services with lower barriers and lower costs [11] to entry and greater convenience [12]. The G20 Summit held in China in 2016 formally listed digital inclusive finance as an important topic [13]. In 2019, China’s Digital Inclusive Finance Conference highlighted the important role of the development of digital inclusive finance in addressing the financial exclusion of the poor. In fact, in China, the use of digital inclusive finance has increased, especially in areas where financing is urgently needed, such as agriculture, rural areas [14,15] and small and micro-enterprise financing. Digital inclusive finance is providing strong financial support for the realization of collective prosperity, while it is also offering favorable conditions to increase personal incomes and narrow the social distribution gap [16]. It also plays an important role in the field of green agriculture. Because green agriculture has the characteristics of a long production cycle, slow returns on investment and low investment efficiency [17], it is challenging for traditional financial services to satisfy the demands of agricultural green production [18]. The phenomenon of financing constraints is prominent in rural areas. In addition to the preferential policies provided by the government, financial support is also required. Digital inclusive finance has solved the problem of financial exclusion existing in the process of rural financial development in the past, externally changed the fund accumulation mode of agricultural production, enabled agricultural producers to obtain financial services through digital technology, stimulated farmers’ willingness to use financial borrowing, accelerated farmers’ production capital accumulation and made it possible to adopt green production behaviors [19]. Digital inclusive finance can offer better financial services, reduce the financing costs for agricultural producers, encourage and guide farmers to adopt agricultural green production behaviors and thus greatly improve the level of agricultural green development. Second, digital inclusive finance can play a positive role in poverty reduction, promote industrial optimization and upgrading, increase farmers’ incomes and narrow the urban–rural income gap to a certain extent. In this way, the amount of funds available in rural areas will increase. With the continuous increase in funds available in rural areas, the intensity of infrastructure construction will continue to increase, the production and living conditions of rural areas and the living standards of farmers have been improved and the process of rural modernization has been promoted; moreover, the green total factor productivity of agriculture has been improved, and AGD has been achieved. Digital inclusive finance can accurately match the demands of AGD with government financial capital, improve the efficiency of income distribution and resource allocation and ultimately achieve the goals of resource conservation, ecological environment security, an increased supply of green products and better quality of life.
Hypothesis 1 (H1).
Digital inclusive finance can improve the level of agricultural green development in our country.
2.2. Mediating Effect Analysis
We already know that digital inclusive finance can facilitate agricultural green development, but what is the specific mechanism of action? It is necessary to discuss this. With the increasing attention paid to agricultural green development, agricultural producers must take into account factors such as natural resource consumption and environmental pollution, which will increase the demand for green technology to achieve long-term benefits. The demand for technological innovation in the agricultural production sector has increased, and the opportunities for profitable agricultural technology research and development have therefore increased [20]. In the pursuit of profit, research and development institutions often devote themselves to the research and development of agricultural technology. Digital inclusive finance provides financial support for research and development departments, reduces the marketization restrictions on enterprises’ scientific research results, accelerates the transformation and application of research and development results, promotes the innovation of agricultural production technology and promotes agricultural green development [21]. In addition, the development of digital inclusive finance can effectively reduce the risks that may arise in the process of research and development [22] and increase the enthusiasm of scientific research institutions to participate in agricultural technology development, and technological innovation can promote green efficiency in agricultural production, reduce the carbon emissions and improve the resource utilization efficiency and agricultural waste utilization efficiency [23]. Some scholars [24,25] also show that technological innovation can strengthen the innovation environment through the spatial spillover effect, which can contribute to AGD.
Hypothesis 2 (H2).
Digital inclusive finance affects agricultural green development via the intermediary role of technological innovation.
At present, the national conditions of “small farmers in big countries” have remained unchanged for a long time [26]. The question of how to realize the effective connection between small farmers and modern agricultural development is an important issue in the context of agricultural green transformation. In 2020, the High-Quality Development Program for New Agricultural Business and Service Entities (2020–2022) was promulgated by the Ministry of Agriculture and Rural Affairs. The program places an emphasis on accelerating the improvement of the agricultural socialization service system, using Internet technology and big data information to match financial services such as credit insurance for production entities and promoting intelligent production, efficient management and service facilitation in rural areas. This indicates that, in the future, China’s agricultural development should pay attention to the combination of digital technology, take digital finance as the starting point and constantly innovate its financial service models, so as to provide better and more efficient financial services for farmers and modern agriculture. Against the background of the integration of small farmers with modern agriculture, agricultural socialization services play an important intermediary role in the effect of digital inclusive finance on AGD [27]. Specifically, on the one hand, digital inclusive finance can improve the level of agricultural socialization services. First, the advantages of digital inclusive finance, such as wide coverage, low costs and low barriers, can effectively alleviate the financing constraints of social agricultural organizations, such as new agricultural business entities, rural collective economic organizations, agricultural materials and machinery production enterprises and agricultural technology companies, and it can offer them adequate financial support and fast financial services, thereby expanding the scope of agricultural production services and improving their service willingness, level and quality. Second, digital inclusive finance can directly use digital technological means such as mobile Internet, large models, blockchain and AI to empower agricultural social service organizations, promote innovative service models and organizational forms and improve their service capabilities and efficiency. On the other hand, the level of agricultural socialized services can promote the green development of agriculture. First, the technical equipment of agricultural social service organizations is advanced, and the application and promotion abilities of green production technologies, such as unified control and scientific fertilization, are strong, which suggests that they can effectively overcome the problems of farmers lacking advanced technologies, such as the scientific use of agricultural materials and the green prevention and control of diseases and insect pests, and promote AGD. Second, compared with traditional small farmers, it is possible to give full play to the organizational advantages and promote the effective connection between small farmers and modern green agriculture [28]. Therefore, digital inclusive finance can enhance the green total factor productivity of agriculture by improving the level of socialized services of agricultural production, thus boosting AGD.
Hypothesis 3 (H3).
Digital inclusive finance affects agricultural green development through the intermediary role of enhancing the level of agricultural production socialization services.
The labor force, land and technology are important production factors in agricultural industry integration; they determine the level and quality of the integration of industries. With an improvement in the integration level of rural industries, their interpenetration will bring about a “Pareto improvement” in the cross-border intensive allocation of production factors, and the utilization rate of factor resources will also increase, thus promoting the green development of agriculture. In this process, digital inclusive finance has played an important role. In addition to guiding funds into the agricultural industry and other related industries, it can also optimize the allocation of resource factors and provide more services for AGD. Thanks to the development of digital inclusive finance, its related service model innovation and dissemination also provide experience and models for more agriculture-related financial institutions [29]. It is helpful to promote the integration and transformation of the agricultural industry chain [30,31] and to develop complex functions such as new agricultural industries and new forms of business [32]. The surrounding areas are encouraged and driven to optimize and reorganize their resources through imitation and learning. A large number of demonstrations have enabled new forms of agricultural green industry to emerge in large numbers, thus promoting the green development of agriculture.
Hypothesis 4 (H4).
Digital inclusive finance affects agricultural green development through the intermediary role of improving the integration of rural industries.
2.3. Threshold Effect Analysis
Due to externalities and other factors, the mechanism of the effect of digital inclusive finance on agricultural green development is not linear. We make use of the threshold effect to measure the nonlinear correlation of digital inclusive finance and AGD. Based on Porter’s hypothesis and traditional environmental economics theory [33], the “compliance cost effect” and “innovation compensation effect” exist in environmental regulation. On the one hand, environmental regulations increase the subject’s compliance cost and crowd out scientific and technological innovation funds, thus weakening the innovation ability and production efficiency, resulting in the “compliance cost effect”. On the other hand, reasonable environmental regulations can encourage producers to innovate continuously in order to reduce the production costs and improve the product quality, thus producing the “innovation compensation effect”. In the field of agriculture, digital inclusive finance is able to facilitate the green transformation of the agricultural development mode by exerting the effect of technological innovation. At a lower level of environmental regulation, the “compliance cost effect” is greater than the “innovation compensation effect”, so the compliance cost effect will continue to be adopted. When the intensity of environmental regulation gradually increases, operators tend to adopt advanced technologies to reduce the production costs and improve their competitiveness. At this time, the “innovation compensation effect” generated by environmental regulations will gradually offset the “compliance cost effect” caused by the increase in costs. Therefore, there are threshold effects in environmental regulation, which play different roles before and after the turning point.
Hypothesis 5 (H5).
Environmental regulation plays a threshold effect in the impact of digital inclusive finance on agricultural green development.
In regions with different degrees of emphasis on AGD, the influence of digital inclusive finance in promoting AGD will also be different, so the relationship between the two is not simple and linear. When the emphasis on the green development of agriculture is low, the promotion effect of digital inclusive finance on AGD is relatively small, but, with a gradual increase in the emphasis on AGD, digital inclusive finance will exert a greater influence in promoting AGD.
Hypothesis 6 (H6).
The degree of emphasis on agricultural green development plays a threshold effect in promoting the role of digital inclusive finance on agricultural green development.
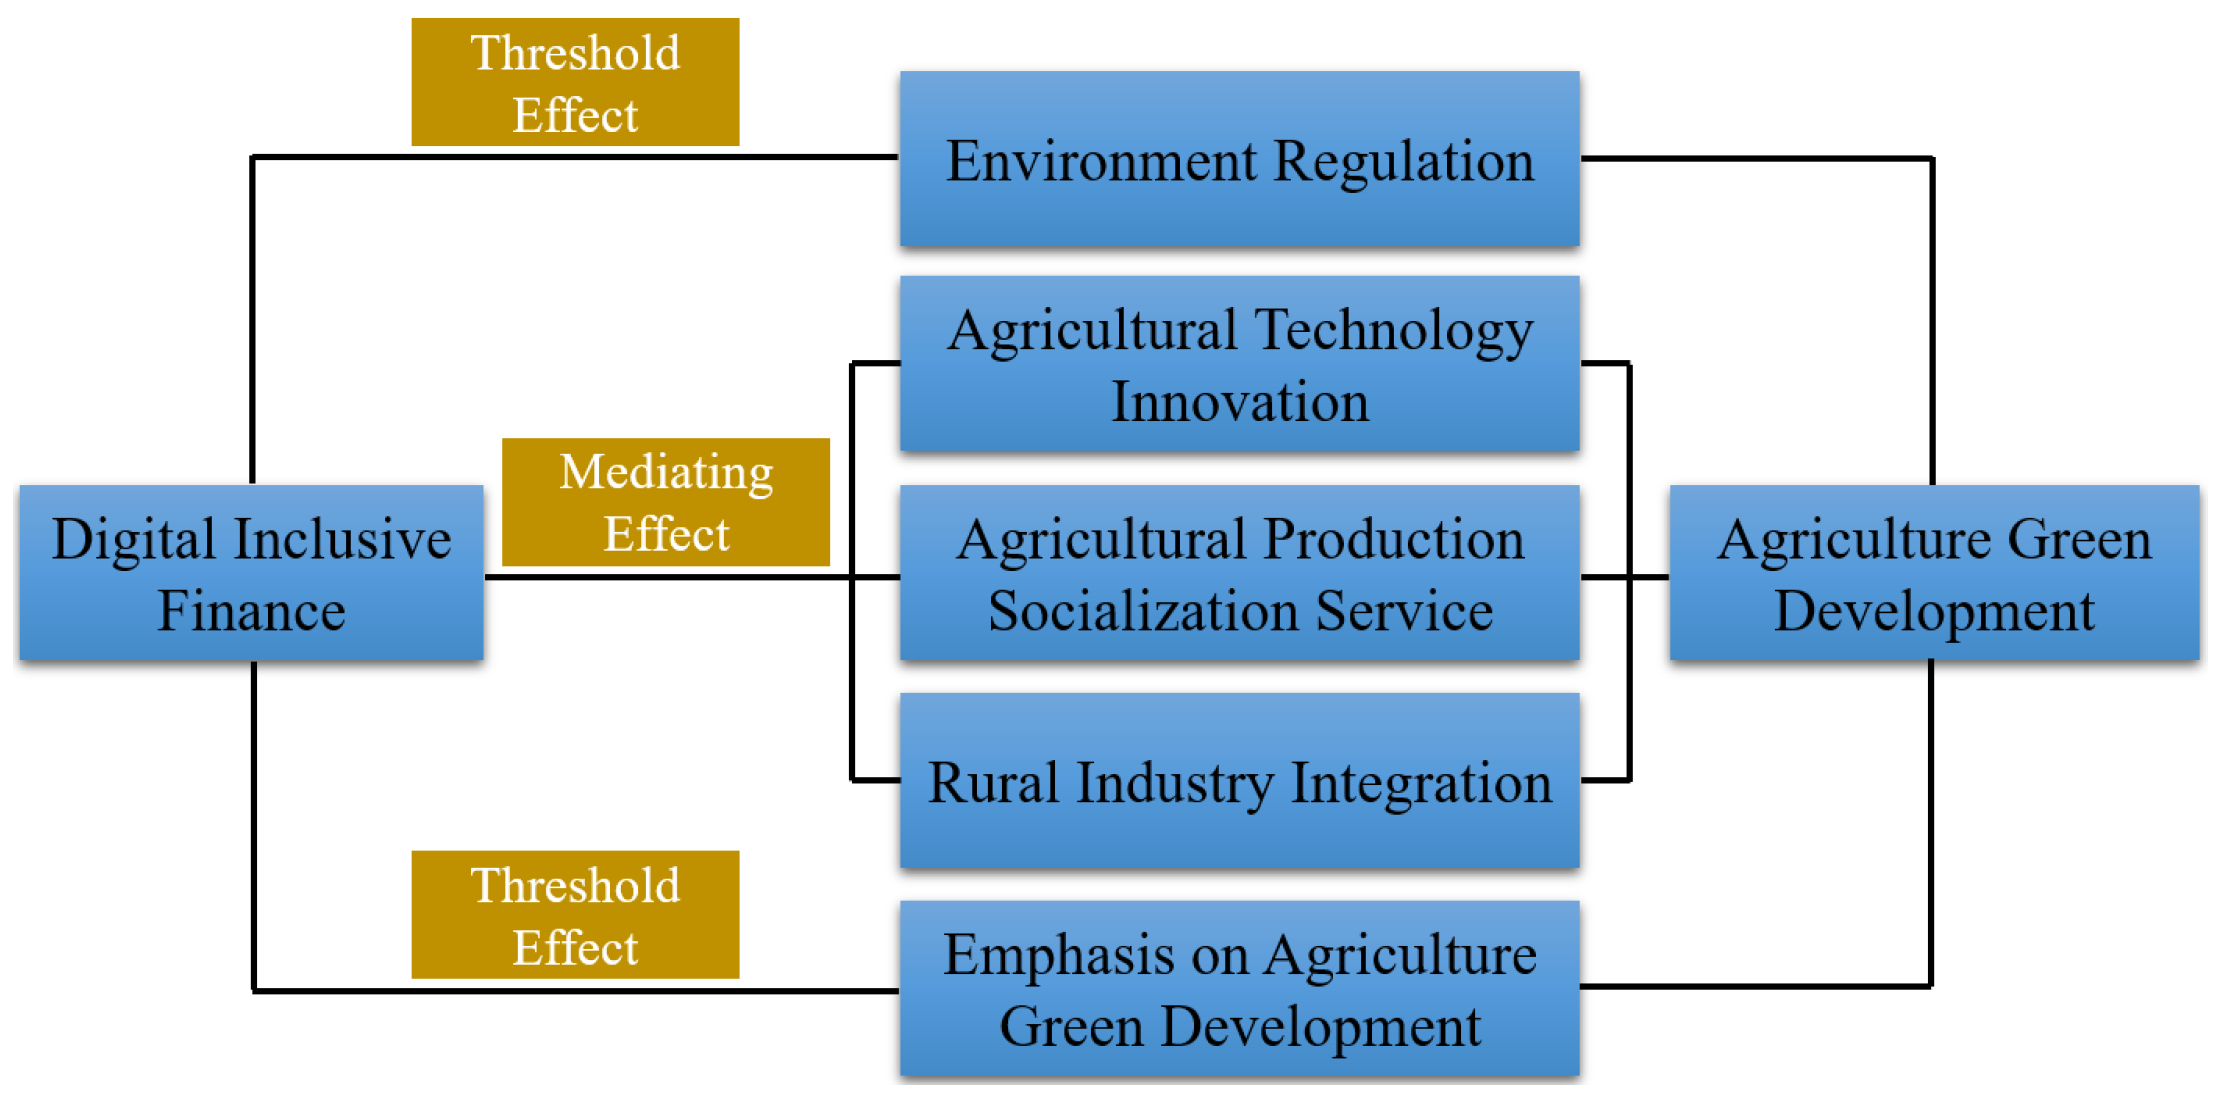
Figure 1 depicts the mechanism by which digital inclusive finance affects agricultural green development.

Figure 1.
Mechanism of digital inclusive finance affecting AGD.
3. Connotations, Comprehensive Evaluation and Space–Time Evolution of China’s Agricultural Green Development
3.1. Connotations of Agricultural Green Development
After the Opinions on Innovating Institutions and Mechanisms to Promote Agricultural Green Development were issued in 2017, there has been an increase in the relevant literature on AGD. As far as the interpretation of the connotations of AGD is concerned, the relevant literature can be roughly summarized into two categories. One concerns the interpretation of the concept and connotations of agricultural green development based on policy texts. Agricultural green development is the transformation of the agricultural development mode from high inputs and high consumption in the past to resource-saving and environmentally friendly agriculture. The core aim is to concert the economic benefits, social benefits, environmental benefits and ecological benefits of agricultural development—that is, to accomplish resource conservation, environmental friendliness, ecological conservation, quality and efficiency. The greening of the agricultural environment, production process and agricultural products is emphasized, including the greening of institutions and institutional mechanisms. The other aims to compare or associate agricultural green development with similar concepts. Some take it as a way to achieve agricultural sustainable development or an alternative to agricultural sustainable development; some relate it to specific agricultural production modes (such as organic agriculture, green agriculture, etc.). On the one hand, these documents extend the chain of agricultural research forward to the protection of the production area and backward to green supplies and even green consumption. On the other hand, it moves beyond the importance of technology or the micro-level cultivation mode considered in the past and lists institutional innovation as one of the core elements of AGD. However, the overall flaw is the excessive emphasis on protection and the neglect of development, which makes the boundary between AGD and agricultural environmental protection unclear. With the continuous improvements in economic and social development, AGD is no longer limited to improving the ecological environment but gradually ensures the quality of agricultural products, promotes green and low-carbon transformation and helps to build a community with a shared future. Agricultural green development is an important approach to agricultural modernization and rural revitalization, and it is also the only way to achieve the goal of double carbon.
3.2. Comprehensive Evaluation of Agricultural Green Development
We construct an indicator system for AGD from four perspectives: resource conservation, ecological environment security, green product supply and a prosperous life. Referring to the establishment method of the agricultural green evaluation index system in the China Agricultural Green Development Report 2022, in terms of resource conservation, two indicators are set: the cultivated land retention rate and water consumption per CNY 10,000 of agricultural added value. In terms of ecological environment security, three indicators are set, namely the carbon emissions per CNY 10,000 of agricultural added value, fertilizer application intensity and pesticide application intensity. In terms of the supply of green products, two indicators are set: the quantity of high-quality agricultural products per unit area and the improvement in the comprehensive production capacity of major agricultural products. In terms of having a good life, the per capita disposable income of rural residents and the Engel coefficient of rural residents are set (See Table 1).

Table 1.
Agricultural green development index.
The analytic hierarchy process (AHP) was employed to determine the weight of each evaluation index of AGD, and a pair comparison judgment matrix was created for the hierarchical index system. Experts scored it according to its relative importance, and the scoring results were summarized to calculate the weight of the index. The agricultural green development index () was calculated by the comprehensive index method. The agricultural green development index was obtained by means of the deviation method and weighted summation. The calculation formula is
where the value of ranges from 0 to 100. The larger the value, the higher the level of agricultural green development. denotes the standardized value of the j-th index. is the weight of the j-th indicator.
3.3. Space–Time Evolution Characteristics of Agricultural Green Development
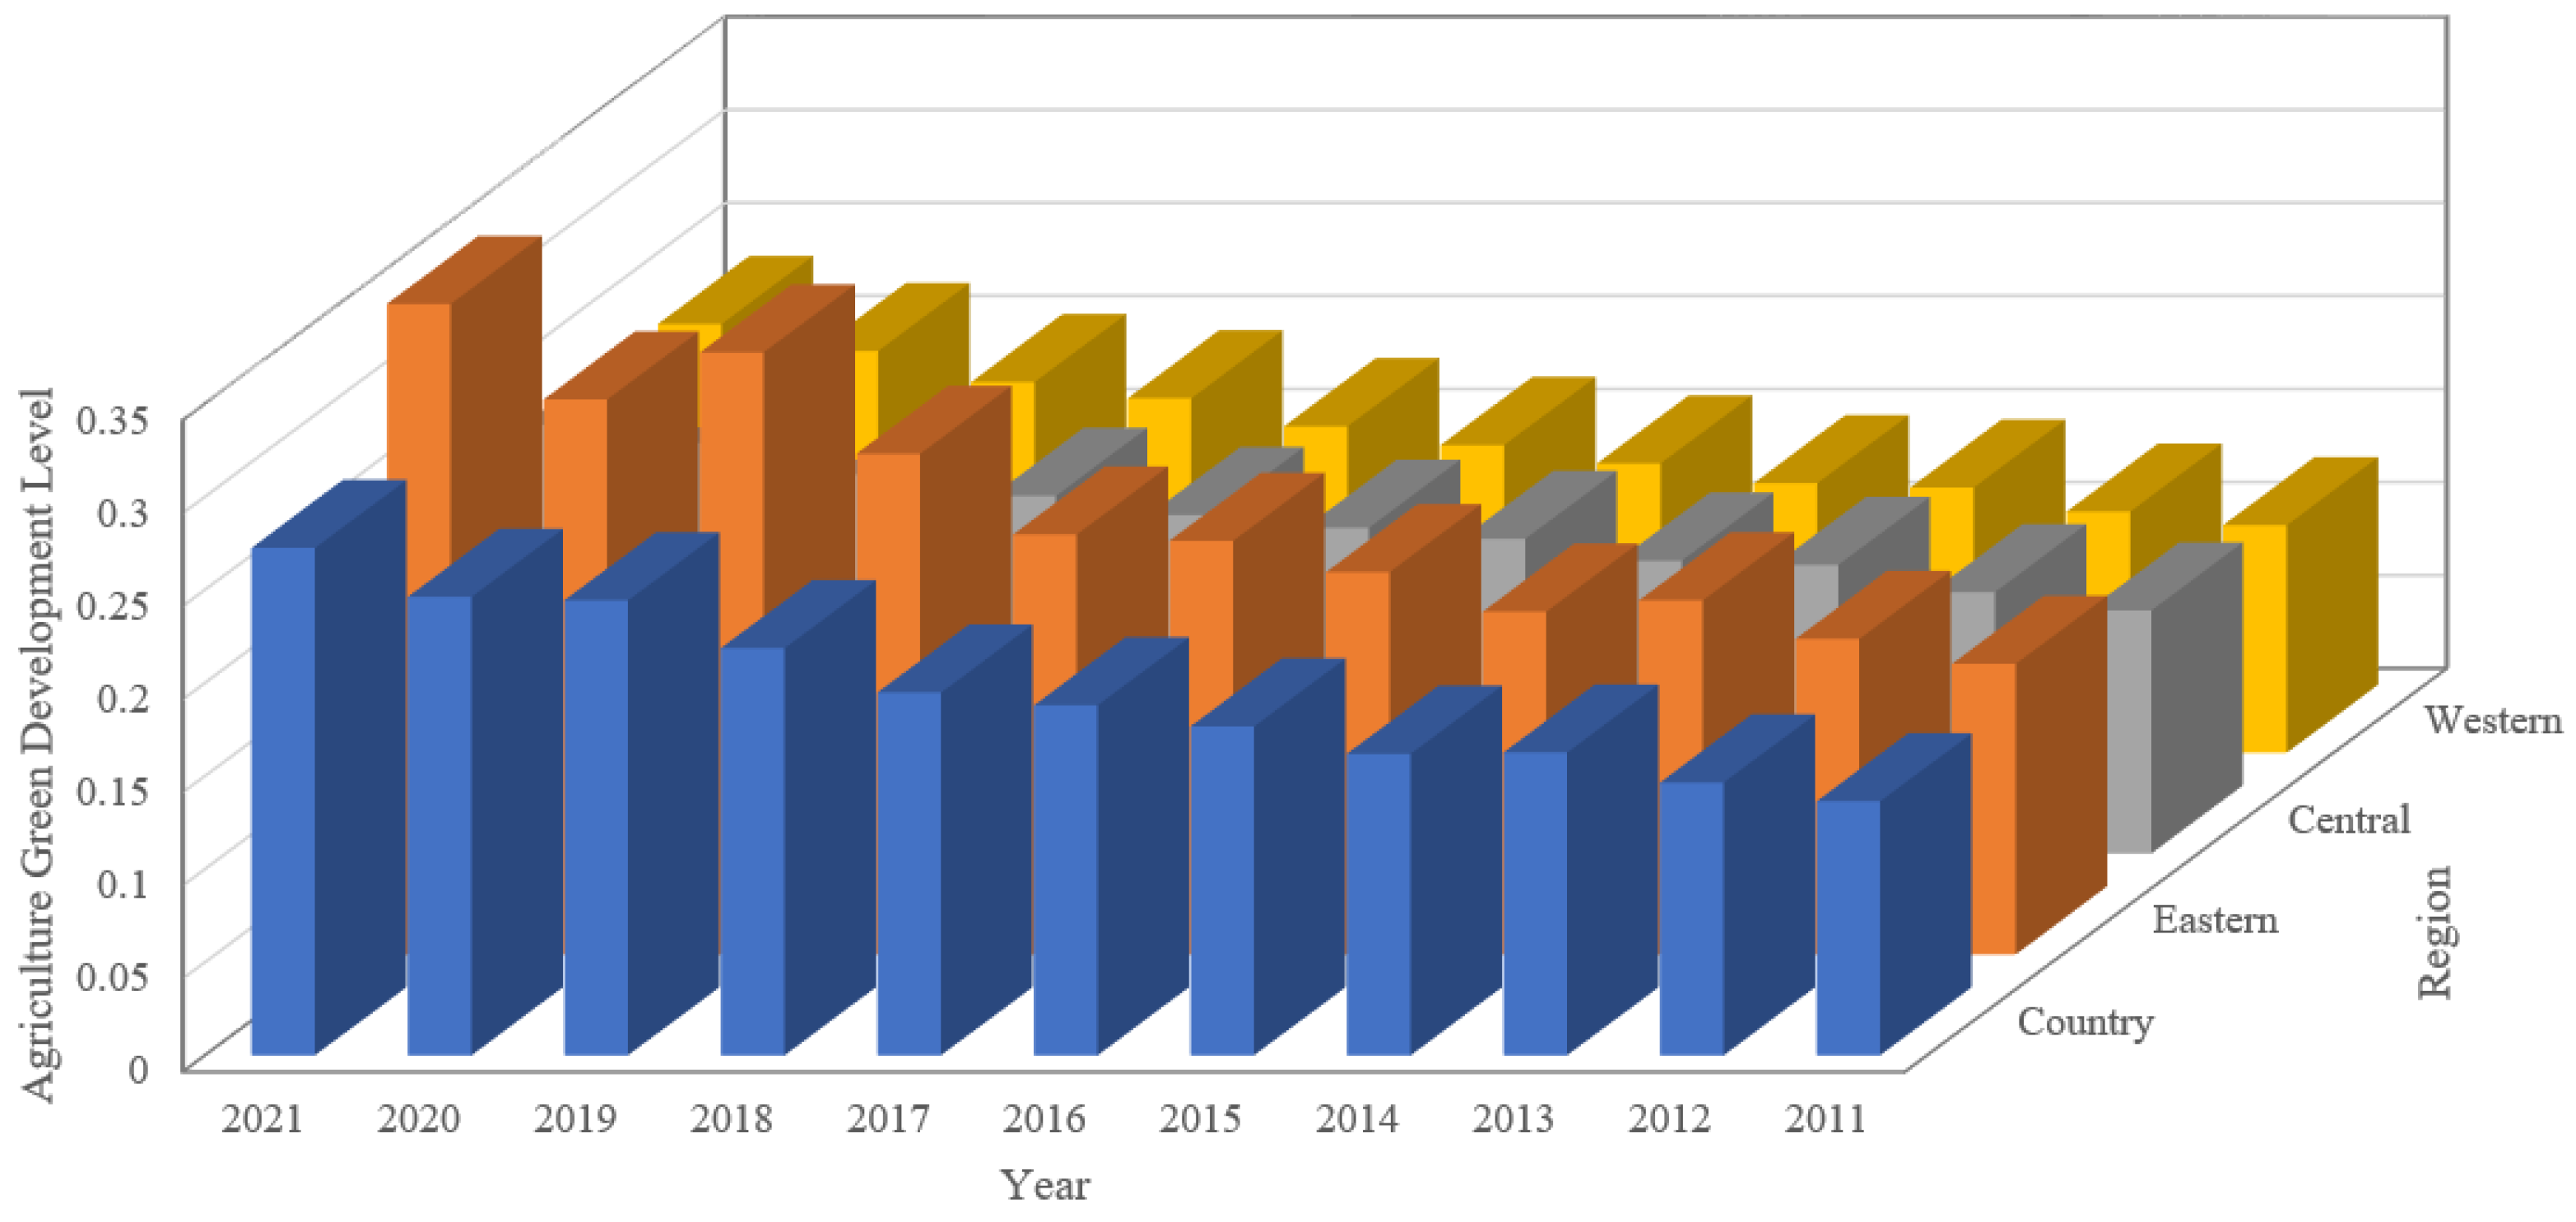
On the basis of calculating the agricultural green development index as above, this paper further describes the spatiotemporal evolution of the mean value of the AGD level of the whole country and the four types of examples in the east, center and west, as shown in Figure 2. Among them, the larger the column, the higher the level of AGD in the region. Specifically, in terms of timing, the average values of the whole country and the four sample provinces in the east, center and west (including autonomous regions and municipalities and provinces directly under the Central Government; the same applies below) increased steadily from 2011 to 2021. Moreover, the increase in 2019 was more obvious than that in other years, which may have been due to the fact that the “ecological civilization” was included in the Constitution in 2018 and the national agricultural green development leading zone was established. The green development level of agriculture in the eastern region was relatively high, and an overall regional distribution pattern of “east–middle–west” was formed from high to low.

Figure 2.
The level of agricultural green development in the western, central and eastern parts of China.
4. Empirical Model and Data
4.1. Model Specification
4.1.1. Spatial Econometric Model
Digital inclusive finance not only has an impact on local agricultural green development, but also can break through the spatial limitations and have an impact on the agricultural green development of other neighboring provinces. Moreover, agricultural green development itself also has a certain spatial spillover effect. Therefore, we employ the spatial econometric model for empirical testing. Spatial econometric models consist mainly of the spatial lag model (SLM), spatial error model (SEM) and spatial Durbin model (SDM). The SDM contains both the explained variable and the lag term of the explanatory variable, which is an expansion of the SLM. The authors of [34] also pointed out that if there are both spatial errors and spatial lag effects, and the LM test rejects the OLS estimation results that do not contain spatial effects, the spatial Durbin model should be chosen. Therefore, drawing on the ideas of [35], this paper designs the following spatial Durbin model and uses maximum likelihood estimation (ML) for estimation [36]:
In Equations (2) and (3), is the agricultural green development level of province i in year t, is the digital financial inclusion index of province i in year t, is the control variable and represents the spatial autoregressive coefficient. , and , respectively, represent the regional fixed effect, time fixed effect and random error terms; , , , , are the coefficients of each variable. is the spatial weight matrix.
4.1.2. Mediating Effect Model
To test the direct and indirect impacts of digital inclusive finance on agricultural green development, the intermediate effect test method proposed by [37] was used for reference, and agricultural green development was taken as the explained variable, digital inclusive finance was taken as the key explanatory variable and agricultural technology innovation, agricultural production socialized services and rural industry integration were taken as the intermediary variables to jointly construct a recursive mediation model, as shown in Equations (4)–(6):
where refers to the level of agricultural green development; refers to digital inclusive finance; , and , respectively, refer to agricultural technology innovation, agricultural production socialization services and rural industry integration; and refers to the control variables of rural residents’ education level, Internet popularity, industrial structure upgrading, the urbanization level and the financial environment expenditure level. i and t are the province and year, respectively, and denotes the error term.
4.1.3. Threshold Effect Model
We consider that digital inclusive finance has a non-linear influence on AGD under different environmental regulation degrees and different emphases on AGD—that is, the influence of digital inclusive finance on AGD has a threshold effect regarding environmental regulation and the degree of emphasis. The panel threshold effect model is constructed with environmental regulation and the degree of emphasis on AGD as threshold variables, as shown in Equations (7) and (8):
where and represent the threshold variables; represents the tested threshold value; and denotes the indicative function of the threshold model, where, if the parentheses are true, then I is 1; otherwise, it is 0.
4.2. Variable Measures and Data Sources
4.2.1. Dependent Variable
The dependent variable in our research is the agricultural green development index. It has already been introduced in Section 3 and will not be discussed here.
4.2.2. Independent Variable
The core explanatory variable in this paper is the level of digital inclusive finance. We use the Peking University Digital Inclusive Finance Index [38]; the data come from the “Peking University Digital Inclusive Finance Index 2011–2021”, released by the research group of the Peking University Digital Financial Research Center. The index system covers three dimensions, namely the coverage breadth, depth of use and digitization degree of digital inclusive finance, including 33 specific indicators, which can objectively and comprehensively reflect the actual development of digital inclusive finance. Moreover, the index is currently the most influential, frequently and widespread digital inclusive finance index.
4.2.3. Mediator Variables and Threshold Variable
Agricultural technology innovation is one mediator variable. Referring to the practice of refs. [39,40,41], the ratio of the number of agricultural and forestry patents to the number of employees in the primary industry is used to express it. Agricultural production socialization services is another mediator variable. With reference to the practice of refs. [42,43], the ratio of the output of the agriculture, forestry, animal husbandry and fishery service industries to the sown area of crops in every province is used to estimate the level of agricultural socialized services. Rural industry integration is the third mediator variable. Based on existing works, mainly referring to the practices of refs. [44,45,46] and taking into account the scientificity and comprehensiveness of the indicators and the availability and comparability of the data, this paper focuses on six dimensions: the extension of the agricultural industry chain, the expansion of agricultural multifunctionality, the integration of the agricultural service industry, the cultivation of new agricultural formats, the penetration of agricultural technology and the improvement of the interest linkage mechanism. We establish a comprehensive evaluation index system for the agricultural industry integration development index with 9 specific indicators. The intensity of environmental regulation is taken as the threshold variable of the reverse incentive type, and the investment amount of industrial pollution control completed per thousand yuan of industrial added value is taken as the index to measure the intensity of environmental regulation. The formula is as follows: environmental regulation intensity = (investment completed in industrial pollution control ÷ industrial added value) × 100% [47,48]. Here, the investment in the completion of industrial pollution control and industrial added value is deflated by the GDP deflator and the factory gate price index, respectively [49,50]. The degree of emphasis on agricultural green development IMP is taken as a positive incentive threshold variable, and it is measured by the number of national agricultural green development pilot zones within the jurisdiction. The construction of the national agricultural green development pilot zone is a comprehensive experimental demonstration platform, aiming to promote the comprehensive green transformation of agriculture, and Central Document No. 1 has been deployed for five consecutive years. In recent years, the Ministry of Agriculture and Rural Affairs and other departments have created 128 pilot zones, distributed in 31 provinces and municipalities across the country. Zhejiang Province and Hainan Province belong serve as promotional areas, so we set IMP = 3; Jiangsu and other 14 provinces and municipalities have at least 5 advanced areas, so we set IMP = 2; the other 15 provinces and municipalities have less than or equal to 4 advanced areas, so we set IMP = 1. The higher the IMP value, the higher the importance of AGD.
4.2.4. Control Variables
Many factors affect the green development of agriculture. The main control variables selected in our work are as follows: (1) the education level of rural residents—we use the per capita education years (years) in rural regions; (2) Internet penetration, measured by rural broadband access users (10,000 households) in every province; (3) industrial structure upgrading, using the ratio of the output of the second and third industries to the total output; (4) the level of urbanization is measured by the ratio of the urban population to the rural population in every province; (5) fiscal environmental expenditure is represented by the ratio of local fiscal environmental protection expenditure to local general budget expenditure. The original data come from the China Statistical Yearbook, China Rural Statistical Yearbook, China Environmental Statistical Yearbook and China Population and Employment Statistical Yearbook, as well as the official website of the Ministry of Agriculture and Rural Affairs of the People’s Republic of China, the website of the National Bureau of Statistics and the EPS database (see Table 2).
Table 2.
Definitions and descriptive statistics of variables.
4.3. Characteristic Fact Description
To preliminarily analyze the correlation between digital inclusive finance and AGD at a factual level, Table 3 and Figure 3 show the average and rankings of the AGD level and digital inclusive finance in 30 provinces and cities in China from 2011 to 2021. It is easy to find that, except for Hainan Province, Shandong Province, Shanaxi Province and Qinghai Province, AGD and digital inclusive finance are basically similar in rank, and the two may have a positive correlation. Therefore, Hypothesis 1 has been preliminarily verified. However, the conclusion of the descriptive analysis lacks rigor and needs to be empirically tested by an econometric model.
Table 3.
Average levels and rankings of AGD and digital inclusive finance in 30 provinces and cities in China from 2011 to 2021.
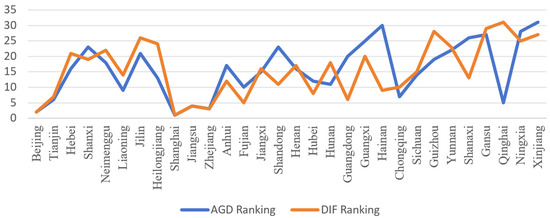
Figure 3.
Mean and rankings of national AGD level and digital inclusive finance development.
5. Empirical Findings
5.1. Spatial Correlation Test
The spatial measurement model requires that the core variables have a spatial correlation. Therefore, this paper first calculates the Moran’s I index of digital inclusive finance and the AGD level during the sample period. This is used to determine whether digital inclusive finance and AGD have a spatial correlation. Table 4 shows the results of the Moran’s I index for the level of digital inclusive finance and agricultural green development from 2011 to 2021. From the results in Table 4, we can find that the digital inclusive finance index and agricultural green development over the years do not show random states but have significant spatial autocorrelation, and they show obvious agglomeration in geographical space. At the same time, the scatter plots of the Moran’s I index for the digital inclusive finance index and the AGD level indicate that China’s digital inclusive finance and agricultural green development mainly show two types of clusters: a “high–high” cluster in the eastern area and a “low–low” cluster in the western area (see Figure 4 and Figure 5). In the plot areas of Figure 4 and Figure 5, the numbers 1, 2, 3, 4, 5, 6, 7, 8, 9, 10, 11, 12, 13, 14, 15, 16, 17, 18, 19, 20, 21, 22, 23, 24, 25, 26, 27, 28, 29, and 30 represent Beijing, Tianjin, Hebei, Shanxi, Neimenggu, Liaoning, Jilin, Heilongjiang, Shanghai, Jiangsu, Zhejiang, Anhui, Fujian, Jiangxi, Shandong, Henan, Hubei, Hunan, Guangdong, Guangxi, Hainan, Chongqing, Sichuan, Guizhou, Yunnan, Shanaxi, Gansu, Qinghai, Ningxia, and Xinjiang, respectively. These two types of differentiation are basically consistent with the spatial pattern of China’s economic development level from east to west, indicating that digital inclusive finance and AGD have obvious dependence and agglomeration pattern heterogeneity in their spatial geographic distribution. Therefore, using a spatial econometric model to conduct empirical tests is reasonable and necessary.
Table 4.
DIF and AGD Moran’s I index.
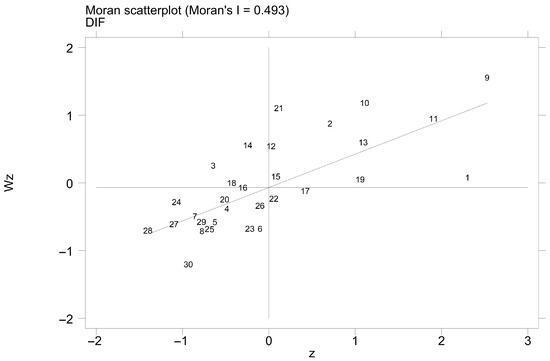
Figure 4.
Scatter plot of Moran’s I index for digital inclusive finance.
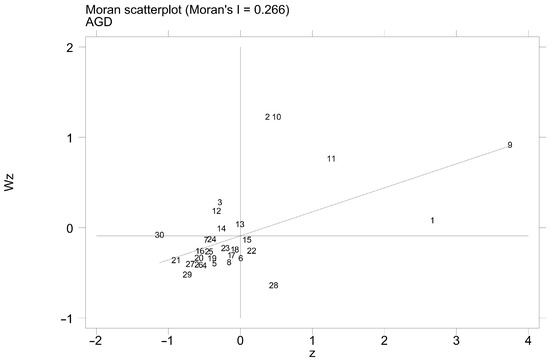
Figure 5.
Scatter plot of Moran’s index for agricultural green development.
5.2. Baseline Regression
In this paper, the reciprocal of the square of the spatial distance is used to set the spatial weight, and the spatial lag model, spatial error model and spatial Durbin model (SDM) are estimated. After correlation tests, such as the Wald spatial lag and LR spatial lag, the SDM is used as the final spatial metrology model in this paper. As can be seen from Table 5, when other factors are controlled for, digital inclusive finance has a remarkable positive influence on AGD. Taking the results of the spatial Durbin model as an example, the regression coefficient of the digital inclusive finance index is 0.061, and the regression coefficient of the spatial lag term of the digital inclusive finance index is 0.057, both of which are significant at the level of 1%. This shows that digital inclusive finance can not only promote the local level of agricultural green development but also has a promoting effect on AGD in surrounding areas—that is, digital inclusive finance has an obvious spatial spillover influence on the promotion of AGD.
Table 5.
Estimated results of the spatial econometric model of the impact of digital inclusive finance on AGD.
When the spatial panel model has a spatial lag term, the overall impact can be split into a direct impact and indirect impact using the calculus approach [36], in order to avoid the bias arising from the use of the point estimation approach to test the spatial spillover effect. This paper compares the direct impacts, indirect impacts and total impacts of digital inclusive finance on AGD, and the specific results are shown in Table 6. From Table 6, we can find that the direct, indirect and total impacts of digital inclusive finance on AGD are all significant, and the coefficients are positive, which further verifies Hypothesis 1. It is also found that the direct effect size and significance level are significantly higher than the indirect effect, indicating that the direct impact of digital inclusive finance on local AGD is greater. This means that, to take full advantage of the capacity of digital inclusive finance to improve AGD, all regions should actively take measures to accelerate the development of digital inclusive finance, and all areas should work together to produce an effect as 1 + 1 is greater than 2.
Table 6.
Estimates of direct effects, indirect effects and total effects of digital inclusive finance on AGD.
5.3. Heterogeneity Analysis
China is a vast country with great differences in its resource endowment, economic levels, infrastructure and production modes, which have led to unbalanced development among different regions. Therefore, the influence of digital inclusive finance on AGD may be heterogeneous. The following will examine whether the influence of digital inclusive finance in facilitating AGD will be different depending on the geographical location and agricultural green development level from two perspectives: location differences and the agricultural green development level. According to the level of the AGD index, the first level is the top 33% of provinces and cities, the second level is the agricultural green development index with rankings of 33–67% and the third level is the bottom 33% of provinces and cities. In Table 7, the provinces and cities with the lowest level of agricultural green development are listed in column (1), and the influence of digital inclusive finance on AGD is small and not significant. For the provinces with the second and third levels of agricultural green development, see columns (2) and (3). The influence coefficients of digital inclusive finance on the level of agricultural green development are 0.283 and 0.424, respectively, both of which are significant at the level of 1%. It can be seen that the higher the level of agricultural green development, the more digital inclusive finance can promote AGD by providing financial services and other means. In contrast, digital inclusive finance is less effective at a lower level of AGD. Meanwhile, (4)–(6) are the estimated results regarding the impact of digital inclusive finance on AGD in the eastern, central and western areas, respectively, and the influence of digital inclusive finance on AGD decreases from the east to middle to west.
Table 7.
Estimation results of spatial heterogeneity.
5.4. Endogeneity Test and Robustness Test
There may be endogeneity problems in the research model in this paper due to the following four reasons. First, there is reverse causality between digital inclusive finance and the level of AGD. In the process of AGD, agricultural producers need to invest time, money and energy to research and develop new agricultural green technologies and explore new models of green production. They have financial needs, which will affect the demand and landing of digital inclusive finance. Second, agricultural producers may view digital inclusive finance and AGD as parallel production tools to be selected simultaneously. Third, due to the availability of data, the model may miss one or more important explanatory variables, such as the education levels of agricultural producers and the amount of carbon sequestration by crops. The missing variables are included in the perturbation term and, if related to other explanatory variables, will cause endogeneity problems. Fourth, there may be measurement errors in the research data. The research data in this paper come from the open data platform and various yearbooks, most of which are obtained through censuses and investigations, but there are some unobservable parts in the data and there may be information omission in the collection process. These errors are included in the perturbation term and, if related to other explanatory variables, will also cause endogeneity problems. In order to solve the endogeneity problem, this paper refers to the practice of [51], selects appropriate instrumental variables and adopts the systematic GMM estimation method to estimate the dynamic spatial Durbin model. However, it is difficult to select effective instrumental variables for digital inclusive finance. Using [52] for reference, the first-order lag of digital inclusive finance is selected as the instrumental variable. On the one hand, this instrumental variable has a relation to the current development of digital inclusive finance; on the other hand, the first-order lagging digital inclusive finance is a prefixed variable and may not be related to the disturbance term, so it meets the two major requirements for the selection of instrumental variables. According to the regression results, the adjoint probabilities of the Sargan test statistics are all greater than 0.1, and the null hypothesis that all instrumental variables are valid is accepted. The adjoint probability of the AR (1) test statistics is less than 0.01, but the adjoint probability of the AR (2) test statistics is greater than 0.1, and the null hypothesis that there is no second-order autocorrelation is accepted, which indicates that the instrumental variables are valid. According to the results in column (2), when instrumental variables are used to estimate the dynamic spatial Durbin model GMM, the estimation results of the digital inclusive finance index and its spatial lag term do not change significantly, which validates the previous empirical results. In this paper, the robustness test is carried out by substituting the core explanatory variables to further verify the reliability of the benchmark regression results. We divide the digital inclusive financial index of each province by 100 to reduce the impact of heteroscedasticity. The test results are shown in column (3) of Table 8. From the robustness test results in column (3) of Table 8, we find that the digital inclusive financial index and its spatial lag terms are significant, and the coefficient is positive, indicating that the empirical results in this work are robust.
Table 8.
Robustness test of DIF’s impact on AGD.
5.5. Mechanism Analysis
5.5.1. Mediating Effect
The above empirical results have confirmed that digital inclusive finance facilitates AGD, and the effects are different for different levels of AGD and different areas [53]. Furthermore, we intend to study the specific influencing channels of digital inclusive finance on AGD. Based on the above theoretical analysis, agricultural technology innovation is an important influencing channel of digital inclusive finance on AGD. Based on the mediation effect model above, this paper uses the Sgmediation command in Stata 16.0 to conduct a Sobel test on the mediating mechanism of digital inclusive finance affecting AGD. The result shows that agricultural technology innovation, agricultural production socialization services and rural industry integration all play a significant role in the process of digital inclusive finance’s influence on agricultural green development. Firstly, it is shown in column (1) of Table 9 that the coefficient of digital inclusive finance and the spatial lag term in DIF are positive and significant at the 1% level. Meanwhile, the coefficient of agricultural technology innovation and the spatial lag term also are positive, being significant at the 1% level. As can be seen from columns (2) and (3) in Table 9, the estimated results regarding the effects of digital inclusive finance on agricultural production socialization and rural industry integration also are positive at the 1% level. We find that the coefficient of agricultural technology innovation is the largest; this means that technology innovation can have the greatest effect in promoting AGD [54]. To guarantee the robustness of the results of the mediation effect test, the bootstrap method was further used. This was consistent with the results of the Sobel test. It can be seen that Hypotheses 2, 3 and 4 are verified [55].
Table 9.
Mediating effect of DIF on AGD.
5.5.2. Threshold Effect
Since the development of the digital economy follows “Metcalfe’s law” and “Moore’s Law”, and digital inclusive finance is an important part of the digital economy, there may be a threshold effect in promoting the green development of agriculture. According to the above analysis, the influence of digital inclusive finance on AGD is different in different stages of environmental regulation and with different degrees of emphasis on AGD, and there is a nonlinear relationship between the two. In order to verify Hypotheses 5 and 6, after the balanced processing of the panel data, the threshold model is selected to further analyze the threshold effect of digital inclusive finance on the level of AGD. The design of the threshold model is based on the method of [56]. With digital inclusive finance as the key explanatory variable and the environmental regulation intensity and emphasis on AGD as threshold variables, the results show that both the environmental regulation intensity and emphasis have threshold effects. The specific results are shown in Table 10. When the threshold variable is the environmental regulation intensity, there are obvious differences in the impact of digital inclusive finance on AGD under different environmental regulation intensities. Specifically, in the first threshold interval, the intensity of environmental regulation is weak, with a small driving effect on green development, and the role of digital inclusive finance in promoting AGD is not evidenced. When the intensity of environmental regulation crosses the threshold value, the coefficient of the core explanatory variable is significantly positive at the level of 1%, and the coefficient increases significantly. This indicates that, with an increase in the environmental regulation intensity, the effect of digital inclusive finance on AGD will gradually appear and be more powerful. A possible reason is that, when the intensity of environmental regulation is weak, the “paying cost” for the environment is low, so the motivation for green development is also low. With the rise in the environmental regulation intensity, the “compensation effect” that can be realized through technological innovation is greater than the “cost effect”, so people will take green growth actions. The mission of digital inclusive finance for the green growth of agriculture will also be played to a greater extent. Similarly, different degrees of emphasis on AGD will also lead to differences in the promotional effect of digital inclusive finance on AGD. When the degree of attention to AGD is low, the effect of digital inclusive finance in improving the green growth of agriculture is poor, but, when the degree of attention is increased, the effect of digital inclusive finance in improving AGD will be greatly improved.
Table 10.
Threshold model estimation results.
6. Conclusions, Discussion and Policy Implications
6.1. Conclusions
This paper analyzed the impact of digital inclusive finance on the green development of agriculture at both the theoretical and empirical levels. It was found that the level of agricultural green development (AGD) in the country and in the eastern, central and western regions increased steadily from 2011 to 2021, and the improvement in 2019 was more obvious than in other years. The level of AGD in the eastern region is relatively high, and a regional distribution pattern of “east–middle–west” is generally formed from high to low. Both digital inclusive finance and AGD in China have significant spatial agglomeration, which is mainly manifested as “high–high” and “low–low” agglomeration modes. Digital inclusive finance plays a significant role in promoting AGD, and there is regional heterogeneity in the effect of digital inclusive finance in promoting AGD. The higher the level of AGD, the greater the role of digital inclusive finance in promoting AGD, and the effect in the eastern region is greater than that in the central and western regions. In terms of the mechanism of action, digital inclusive finance has an impact on AGD mainly by promoting agricultural technological innovation, improving the level of socialized services of agricultural production and promoting the integrated development of rural industries. When the intensity of environmental regulation is high, the promotional effect of digital inclusive finance on AGD is greater, while, when environmental regulation is weak, the promotional effect of digital inclusive finance on AGD is small. When more attention is paid to AGD, the impact of digital inclusive finance on AGD is stronger; when the emphasis on AGD is small, the impact of digital inclusive finance on AGD is weaker.
6.2. Discussion
This paper aimed to research the relationship between digital inclusive finance and AGD. We have obtained several core findings. Digital inclusive finance affects AGD via agricultural technology innovation, agricultural socialization services and rural industry integration. Compared with existing work, the definition of the connotations of AGD is of great significance in the current era; this paper constructed an index system of AGD with temporal significance and explored the relationship between digital inclusive finance and AGD. Regarding the existing conclusions, the level of AGD in the eastern region is relatively high, and a regional distribution pattern of “east–middle–west” is generally formed from high to low, but the distribution of agricultural development and AGD across China is different. Therefore, our work supplies some ideas for AGD in China, as well as an analysis of the intermediary mechanisms. However, this work had certain limitations in the measurement of AGD; in the future, we can start from a smaller unit to measure the level of China’s AGD, such as counties, so as to make our research results more practical, with guiding significance. The findings of this work theoretically provide new insights for AGD and digital inclusive finance, contributing to theoretical research on the influence mechanisms of AGD. Additionally, these results have significant practical applications, such as in further promoting and achieving AGD.
6.3. Policy Implications
Based on the above findings, some policy suggestions are proposed. We should give full play to the role of digital inclusive finance in promoting AGD and its spatial spillover effect. With the help of digital inclusive finance, we should pay more attention to AGD, make full use of the system to encourage the implementation of environmental regulations and implement regional development policies with wide coverage, deep use and the digitization of digital inclusive finance. This would support improvements in the level of agricultural scientific and technological innovation, the level of socialized agricultural production services and the integration of rural industries. A number of measures can be taken to steadily and rapidly improve the level of AGD.
Limited by the timeframe and objective conditions, our research methodology and theory framework also had certain limitations. Although we can see that digital inclusive finance has a significant influence on AGD, due to the differences in our country’s digital infrastructure, data security concerns and so on, there are many issues that remain to be researched in future work. The inter-country differences in this issue are also of interest.
Author Contributions
Conceptualization, H.S. and W.L.; methodology, H.S.; validation, H.S., W.L. and X.G.; investigation, H.S.; data curation, Z.M.; writing—original draft preparation, H.S.; writing—review and editing, H.S., W.L., Z.W. and J.F.; visualization, X.G., W.L. and J.F.; supervision, W.L.; project administration, W.L.; funding acquisition, X.G. All authors have read and agreed to the published version of the manuscript.
Funding
This research was supported by the Hubei Province Education Science Planning Key Topic (grant number 2024GA110); the Hubei Province Philosophy and Social Science Research Project (grant number 23Q083); and the Wuhan Textile University School Fund (grant number 20220609).
Institutional Review Board Statement
Not applicable.
Informed Consent Statement
Not applicable.
Data Availability Statement
Data are contained within the article.
Conflicts of Interest
The authors declare no conflicts of interest.
References
- Wei, Y.M.; Chen, K.; Kang, J.N.; Chen, W.; Wang, X.Y.; Zhang, X. Policy and management of carbon peaking and carbon neutrality: A literature review. Engineering 2022, 14, 52–63. [Google Scholar] [CrossRef]
- Liu, Z.; Deng, Z.; He, G.; Wang, H.; Zhang, X.; Lin, J.; Qi, Y.; Liang, X. Challenges and opportunities for carbon neutrality in China. Nat. Rev. Earth Environ. 2022, 3, 141–155. [Google Scholar] [CrossRef]
- Zhao, X.; Ma, X.; Chen, B.; Shang, Y.; Song, M. Challenges toward carbon neutrality in China: Strategies and countermeasures. Resour. Conserv. Recycl. 2022, 176, 105959. [Google Scholar] [CrossRef]
- Ma, D.; Zhu, Q. Innovation in emerging economies: Research on the digital economy driving high-quality green development. J. Bus. Res. 2022, 145, 801–813. [Google Scholar] [CrossRef]
- Zhang, S.; Wu, Z.; Wang, Y.; Hao, Y. Fostering green development with green finance: An empirical study on the environmental effect of green credit policy in China. J. Environ. Manag. 2021, 296, 113159. [Google Scholar] [CrossRef] [PubMed]
- Wu, H.; Li, Y.; Hao, Y.; Ren, S.; Zhang, P. Environmental decentralization, local government competition, and regional green development: Evidence from China. Sci. Total Environ. 2020, 708, 135085. [Google Scholar] [CrossRef] [PubMed]
- Yu, C.H.; Wu, X.; Zhang, D.; Chen, S.; Zhao, J. Demand for green finance: Resolving financing constraints on green innovation in China. Energy Policy 2021, 153, 112255. [Google Scholar] [CrossRef]
- Fu, H.; Zheng, C.; Yang, P. Digital inclusive finance and green transformation of manufacturing enterprises: Empirical analysis based on the dual perspectives of demand and supply. Technol. Forecast. Soc. Change 2024, 200, 123152. [Google Scholar] [CrossRef]
- Wu, J. Nexus analysis of financial management, digital finance and new technologies. Glob. Financ. J. 2023, 57, 100869. [Google Scholar] [CrossRef]
- Naz, F.; Karim, S.; Houcine, A.; Naeem, M.A. Fintech growth during COVID-19 in MENA region: Current challenges and future prospects. Electron. Commer. Res. 2024, 24, 371–392. [Google Scholar] [CrossRef]
- Ozili, P.K. Impact of digital finance on financial inclusion and stability. Borsa Istanb. Rev. 2018, 18, 329–340. [Google Scholar] [CrossRef]
- Hu, Y.; Liu, C.; Peng, J. Financial inclusion and agricultural total factor productivity growth in China. Econ. Model. 2021, 96, 68–82. [Google Scholar] [CrossRef]
- Tiwari, A.K.; Abakah, E.J.A.; Adekoya, O.B.; Hammoudeh, S. What do we know about the price spillover between green bonds and Islamic stocks and stock market indices? Glob. Financ. J. 2023, 55, 100794. [Google Scholar] [CrossRef]
- Zhao, H.; Chen, S.; Zhang, W. Does digital inclusive finance affect urban carbon emission intensity: Evidence from 285 cities in China. Cities 2023, 142, 104552. [Google Scholar] [CrossRef]
- Zhang, Y.; Sun, Y.; Xie, M.; Chen, Y.; Cao, S. Health shocks, basic medical insurance and common prosperity: Based on the analysis of rural middle-aged and elderly groups. Front. Public Health 2022, 10, 1014351. [Google Scholar] [CrossRef] [PubMed]
- Lacalle-Calderon, M.; Larrú, J.M.; Garrido, S.R.; Perez-Trujillo, M. Microfinance and income inequality: New macrolevel evidence. Rev. Dev. Econ. 2019, 23, 860–876. [Google Scholar] [CrossRef]
- Du, Y.; Wang, W. The role of green financing, agriculture development, geopolitical risk, and natural resource on environmental pollution in China. Resour. Policy 2023, 82, 103440. [Google Scholar] [CrossRef]
- Sun, H.; Hartarska, V.; Zhang, L.; Nadolnyak, D. The influence of social capital on farm household’s borrowing behavior in Rural China. Sustainability 2018, 10, 4361. [Google Scholar] [CrossRef]
- O’Toole, C.M.; Newman, C.; Hennessy, T. Financing constraints and agricultural investment: Effects of the Irish financial crisis. J. Agric. Econ. 2014, 65, 152–176. [Google Scholar] [CrossRef]
- Zheng, J.; Liu, X.; Bigsten, A. Ownership structure and determinants of technical efficiency: An application of data envelopment analysis to Chinese enterprises (1986–1990). J. Comp. Econ. 1998, 26, 465–484. [Google Scholar] [CrossRef]
- Tetteh, G.K. Local digital lending development and the incidence of deprivation in Kenya. Financ. Innov. 2023, 9, 102. [Google Scholar] [CrossRef]
- Berg, T.; Burg, V.; Gombovié, A.; Puri, M. On the rise of the FinTechs—Credit scoring using digital footprints. Federal Deposit Insurance Corporation. Cent. Financ. Res. WP 2018, 4, 2018. [Google Scholar]
- Zheng, H.; Ma, W.; Wang, F.; Li, G. Does internet use improve technical efficiency of banana production in China? Evidence from a selectivity-corrected analysis. Food Policy 2021, 102, 102044. [Google Scholar] [CrossRef]
- Zhang, F.; Wang, F.; Hao, R.; Wu, L. Agricultural science and technology innovation, spatial spillover and agricultural green development—taking 30 provinces in China as the research object. Appl. Sci. 2022, 12, 845. [Google Scholar] [CrossRef]
- Sun, Y. Environmental regulation, agricultural green technology innovation, and agricultural green total factor productivity. Front. Environ. Sci. 2022, 10, 955954. [Google Scholar] [CrossRef]
- Chen, T.; Rizwan, M.; Abbas, A. Exploring the role of agricultural services in production efficiency in Chinese agriculture: A case of the socialized agricultural service system. Land 2022, 11, 347. [Google Scholar] [CrossRef]
- Chen, X.; Liu, T. Can agricultural socialized services promote the reduction in chemical fertilizer? Analysis based on the moderating effect of farm size. Int. J. Environ. Res. Public Health 2023, 20, 2323. [Google Scholar] [CrossRef] [PubMed]
- Zang, L.; Wang, Y.; Ke, J.; Su, Y. What drives smallholders to utilize socialized agricultural services for farmland scale management? Insights from the perspective of collective action. Land 2022, 11, 930. [Google Scholar] [CrossRef]
- Turvey, C.G.; He, G.; Jiujie, M.; Kong, R.; Meagher, P. Farm credit and credit demand elasticities in Shaanxi and Gansu. China Econ. Rev. 2012, 23, 1020–1035. [Google Scholar] [CrossRef]
- Wang, X.; Feng, H. China’s multidimensional relative poverty standards in the post-2020 Era: International experience and policy orientation. Chin. Rural. Econ. 2020, 3, 2–21. [Google Scholar]
- Sun, H.; Li, X.; Li, W.; Feng, J. Differences and influencing factors of relative poverty of urban and rural residents in China based on the survey of 31 provinces and cities. Int. J. Environ. Res. Public Health 2022, 19, 9015. [Google Scholar] [CrossRef]
- Jiabin, Y.; Di, X.; Yuting, W.; Xiaoping, Y. Learning orientation, big data capability and business model innovation: Moderating effect of industry type. Manag. Rev. 2021, 33, 137. [Google Scholar]
- Dong, K.; Yang, S.; Wang, J. How digital economy lead to low-carbon development in China? The case of e-commerce city pilot reform. J. Clean. Prod. 2023, 391, 136177. [Google Scholar] [CrossRef]
- Elhorst, J.P. Applied spatial econometrics: Raising the bar. Spat. Econ. Anal. 2010, 5, 9–28. [Google Scholar] [CrossRef]
- Fischer, M.M.; Scherngell, T.; Reismann, M. Knowledge spillovers and total factor productivity: Evidence using a spatial panel data model. Geogr. Anal. 2009, 41, 204–220. [Google Scholar] [CrossRef]
- LeSage, J.P.; Pace, R.K. Spatial econometric models. In Handbook of Applied Spatial Analysis: Software Tools, Methods and Applications; Springer: Berlin/Heidelberg, Germany, 2009; pp. 355–376. [Google Scholar]
- Wen, Z.; Chang, L.; Hau, K.T.; Liu, H. Testing and application of the mediating effects. Acta Psychol. Sin. 2004, 36, 614. [Google Scholar]
- Du, Y.; Wang, Q.; Zhou, J. How does digital inclusive finance affect economic resilience: Evidence from 285 cities in China. Int. Rev. Financ. Anal. 2023, 88, 102709. [Google Scholar] [CrossRef]
- Biggs, S.D.; Clay, E.J. Sources of innovation in agricultural technology. World Dev. 1981, 9, 321–336. [Google Scholar] [CrossRef]
- Luo, J.; Guo, H.; Jia, F. Technological innovation in agricultural co-operatives in China: Implications for agro-food innovation policies. Food Policy 2017, 73, 19–33. [Google Scholar] [CrossRef]
- Ogundari, K.; Bolarinwa, O.D. Impact of agricultural innovation adoption: A meta-analysis. Aust. J. Agric. Resour. Econ. 2018, 62, 217–236. [Google Scholar] [CrossRef]
- Li, Y.; Huan, M.; Jiao, X.; Chi, L.; Ma, J. The impact of labor migration on chemical fertilizer use of wheat smallholders in China-mediation analysis of socialized service. J. Clean. Prod. 2023, 394, 136366. [Google Scholar] [CrossRef]
- Ying, R.; Xu, B. Demonstrative effect of farmers’ adopting socialized agricultural services-integrated pest management as an example. Chin. Rural. Econ. 2014, 30–41. [Google Scholar]
- Tian, X.; Wu, M.; Ma, L.; Wang, N. Rural finance, scale management and rural industrial integration. China Agric. Econ. Rev. 2020, 12, 349–365. [Google Scholar] [CrossRef]
- Ge, H.; Li, B.; Tang, D.; Xu, H.; Boamah, V. Research on digital inclusive finance promoting the integration of rural three-industry. Int. J. Environ. Res. Public Health 2022, 19, 3363. [Google Scholar] [CrossRef] [PubMed]
- Yang, Y.; Bao, W.; Wang, Y.; Liu, Y. Measurement of urban-rural integration level and its spatial differentiation in China in the new century. Habitat Int. 2021, 117, 102420. [Google Scholar] [CrossRef]
- Ryan, S.P. The costs of environmental regulation in a concentrated industry. Econometrica 2012, 80, 1019–1061. [Google Scholar]
- Li, Z.; Huang, Z.; Su, Y. New media environment, environmental regulation and corporate green technology innovation: Evidence from China. Energy Econ. 2023, 119, 106545. [Google Scholar] [CrossRef]
- Li, J.; Dong, K.; Wang, K.; Dong, X. How does natural resource dependence influence carbon emissions? The role of environmental regulation. Resour. Policy 2023, 80, 103268. [Google Scholar] [CrossRef]
- Guo, M.; Wang, H.; Kuai, Y. Environmental regulation and green innovation: Evidence from heavily polluting firms in China. Financ. Res. Lett. 2023, 53, 103624. [Google Scholar] [CrossRef]
- Halleck Vega, S.; Elhorst, J.P. The SLX model. J. Reg. Sci. 2015, 55, 339–363. [Google Scholar] [CrossRef]
- Zhao, H.; Zheng, X.; Yang, L. Does digital inclusive finance narrow the urban-rural income gap through primary distribution and redistribution? Sustainability 2022, 14, 2120. [Google Scholar] [CrossRef]
- Li, J.; Cheng, P.; Qian, X. Do mineral rents endowment and agricultural raw material imports determine natural resource management in the United States? Resour. Policy 2023, 85, 103918. [Google Scholar] [CrossRef]
- Mensah, C.N.; Long, X.; Dauda, L.; Boamah, K.B.; Salman, M.; Appiah-Twum, F.; Tachie, A.K. Technological innovation and green growth in the organization for economic cooperation and development economies. J. Clean. Prod. 2019, 240, 118204. [Google Scholar] [CrossRef]
- Lin, B.; Ma, R. How does digital finance influence green technology innovation in China? Evidence from the financing constraints perspective. J. Environ. Manag. 2022, 320, 115833. [Google Scholar] [CrossRef] [PubMed]
- Yang, X.; He, L.; Xia, Y.; Chen, Y. Effect of government subsidies on renewable energy investments: The threshold effect. Energy Policy 2019, 132, 156–166. [Google Scholar] [CrossRef]


Disclaimer/Publisher’s Note: The statements, opinions and data contained in all publications are solely those of the individual author(s) and contributor(s) and not of MDPI and/or the editor(s). MDPI and/or the editor(s) disclaim responsibility for any injury to people or property resulting from any ideas, methods, instructions or products referred to in the content. |
© 2025 by the authors. Licensee MDPI, Basel, Switzerland. This article is an open access article distributed under the terms and conditions of the Creative Commons Attribution (CC BY) license (https://creativecommons.org/licenses/by/4.0/).