

Meteorological Data Processing Method for Energy-Saving Design of Intelligent Buildings Based on the Compressed Sensing Reconstruction Algorithm

Abstract
:1. Introduction
2. Related Work
3. Intelligent, Sustainable, Building Energy-Saving Design Platform Based on the CSR Algorithm
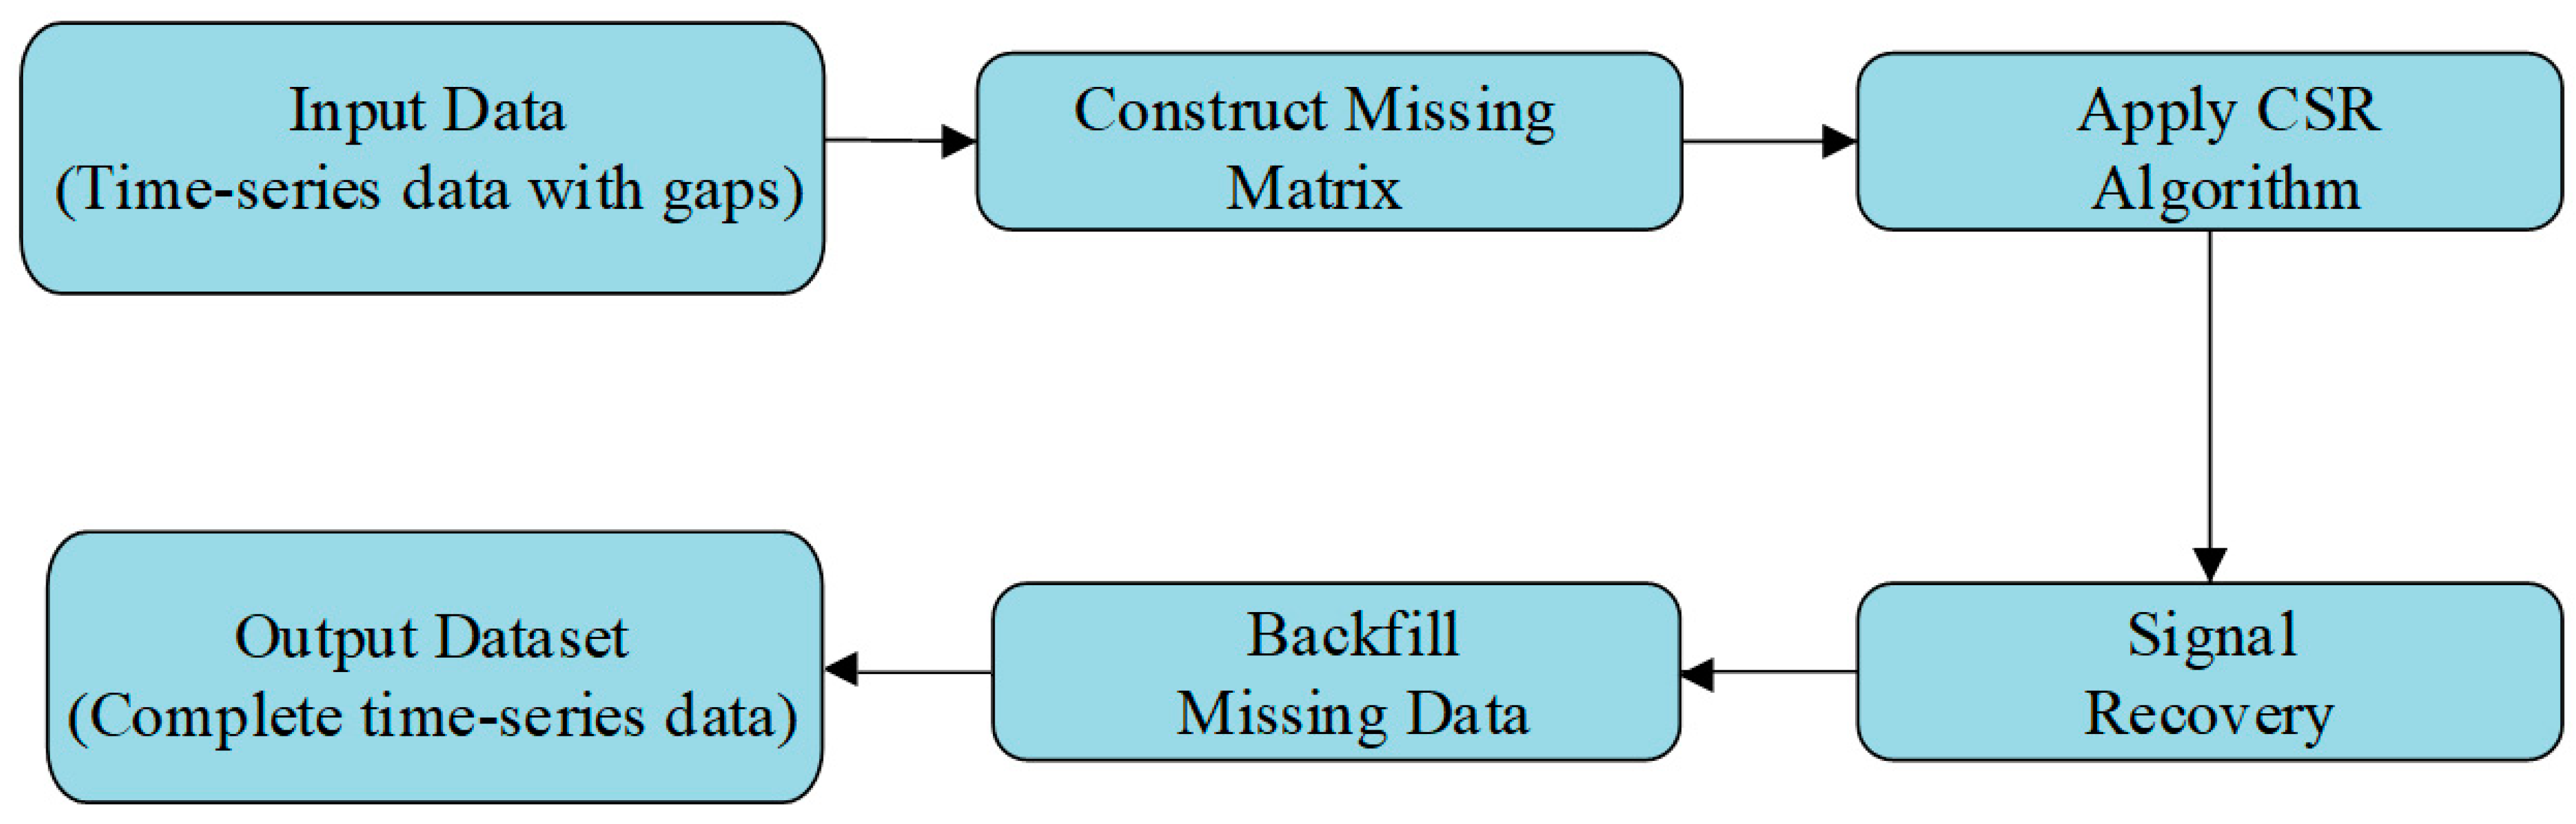
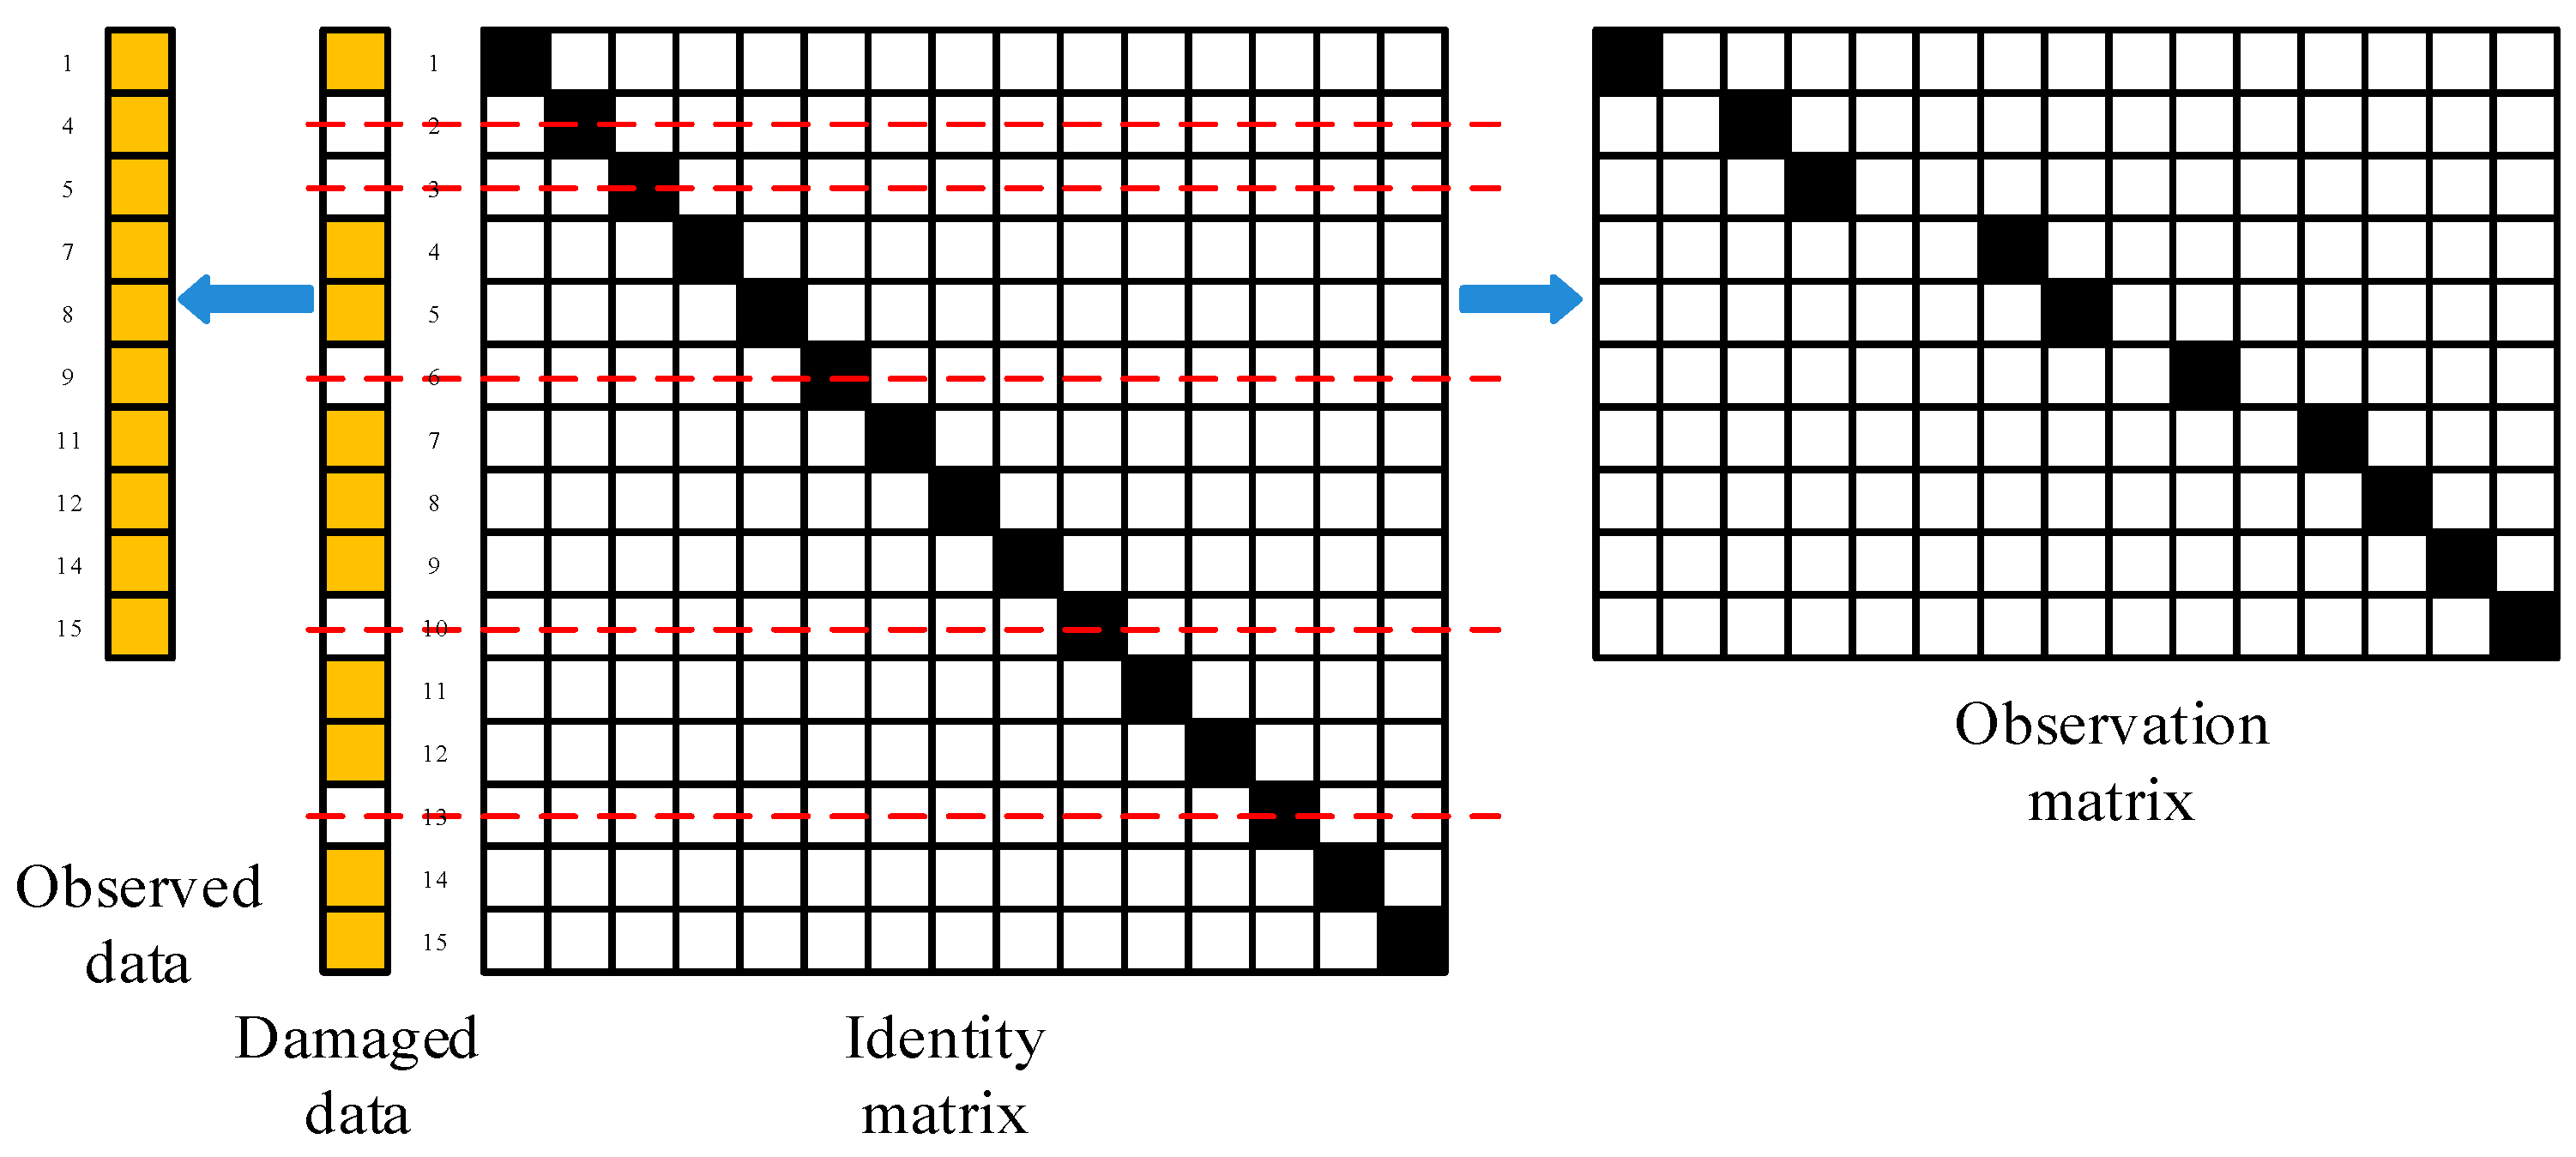
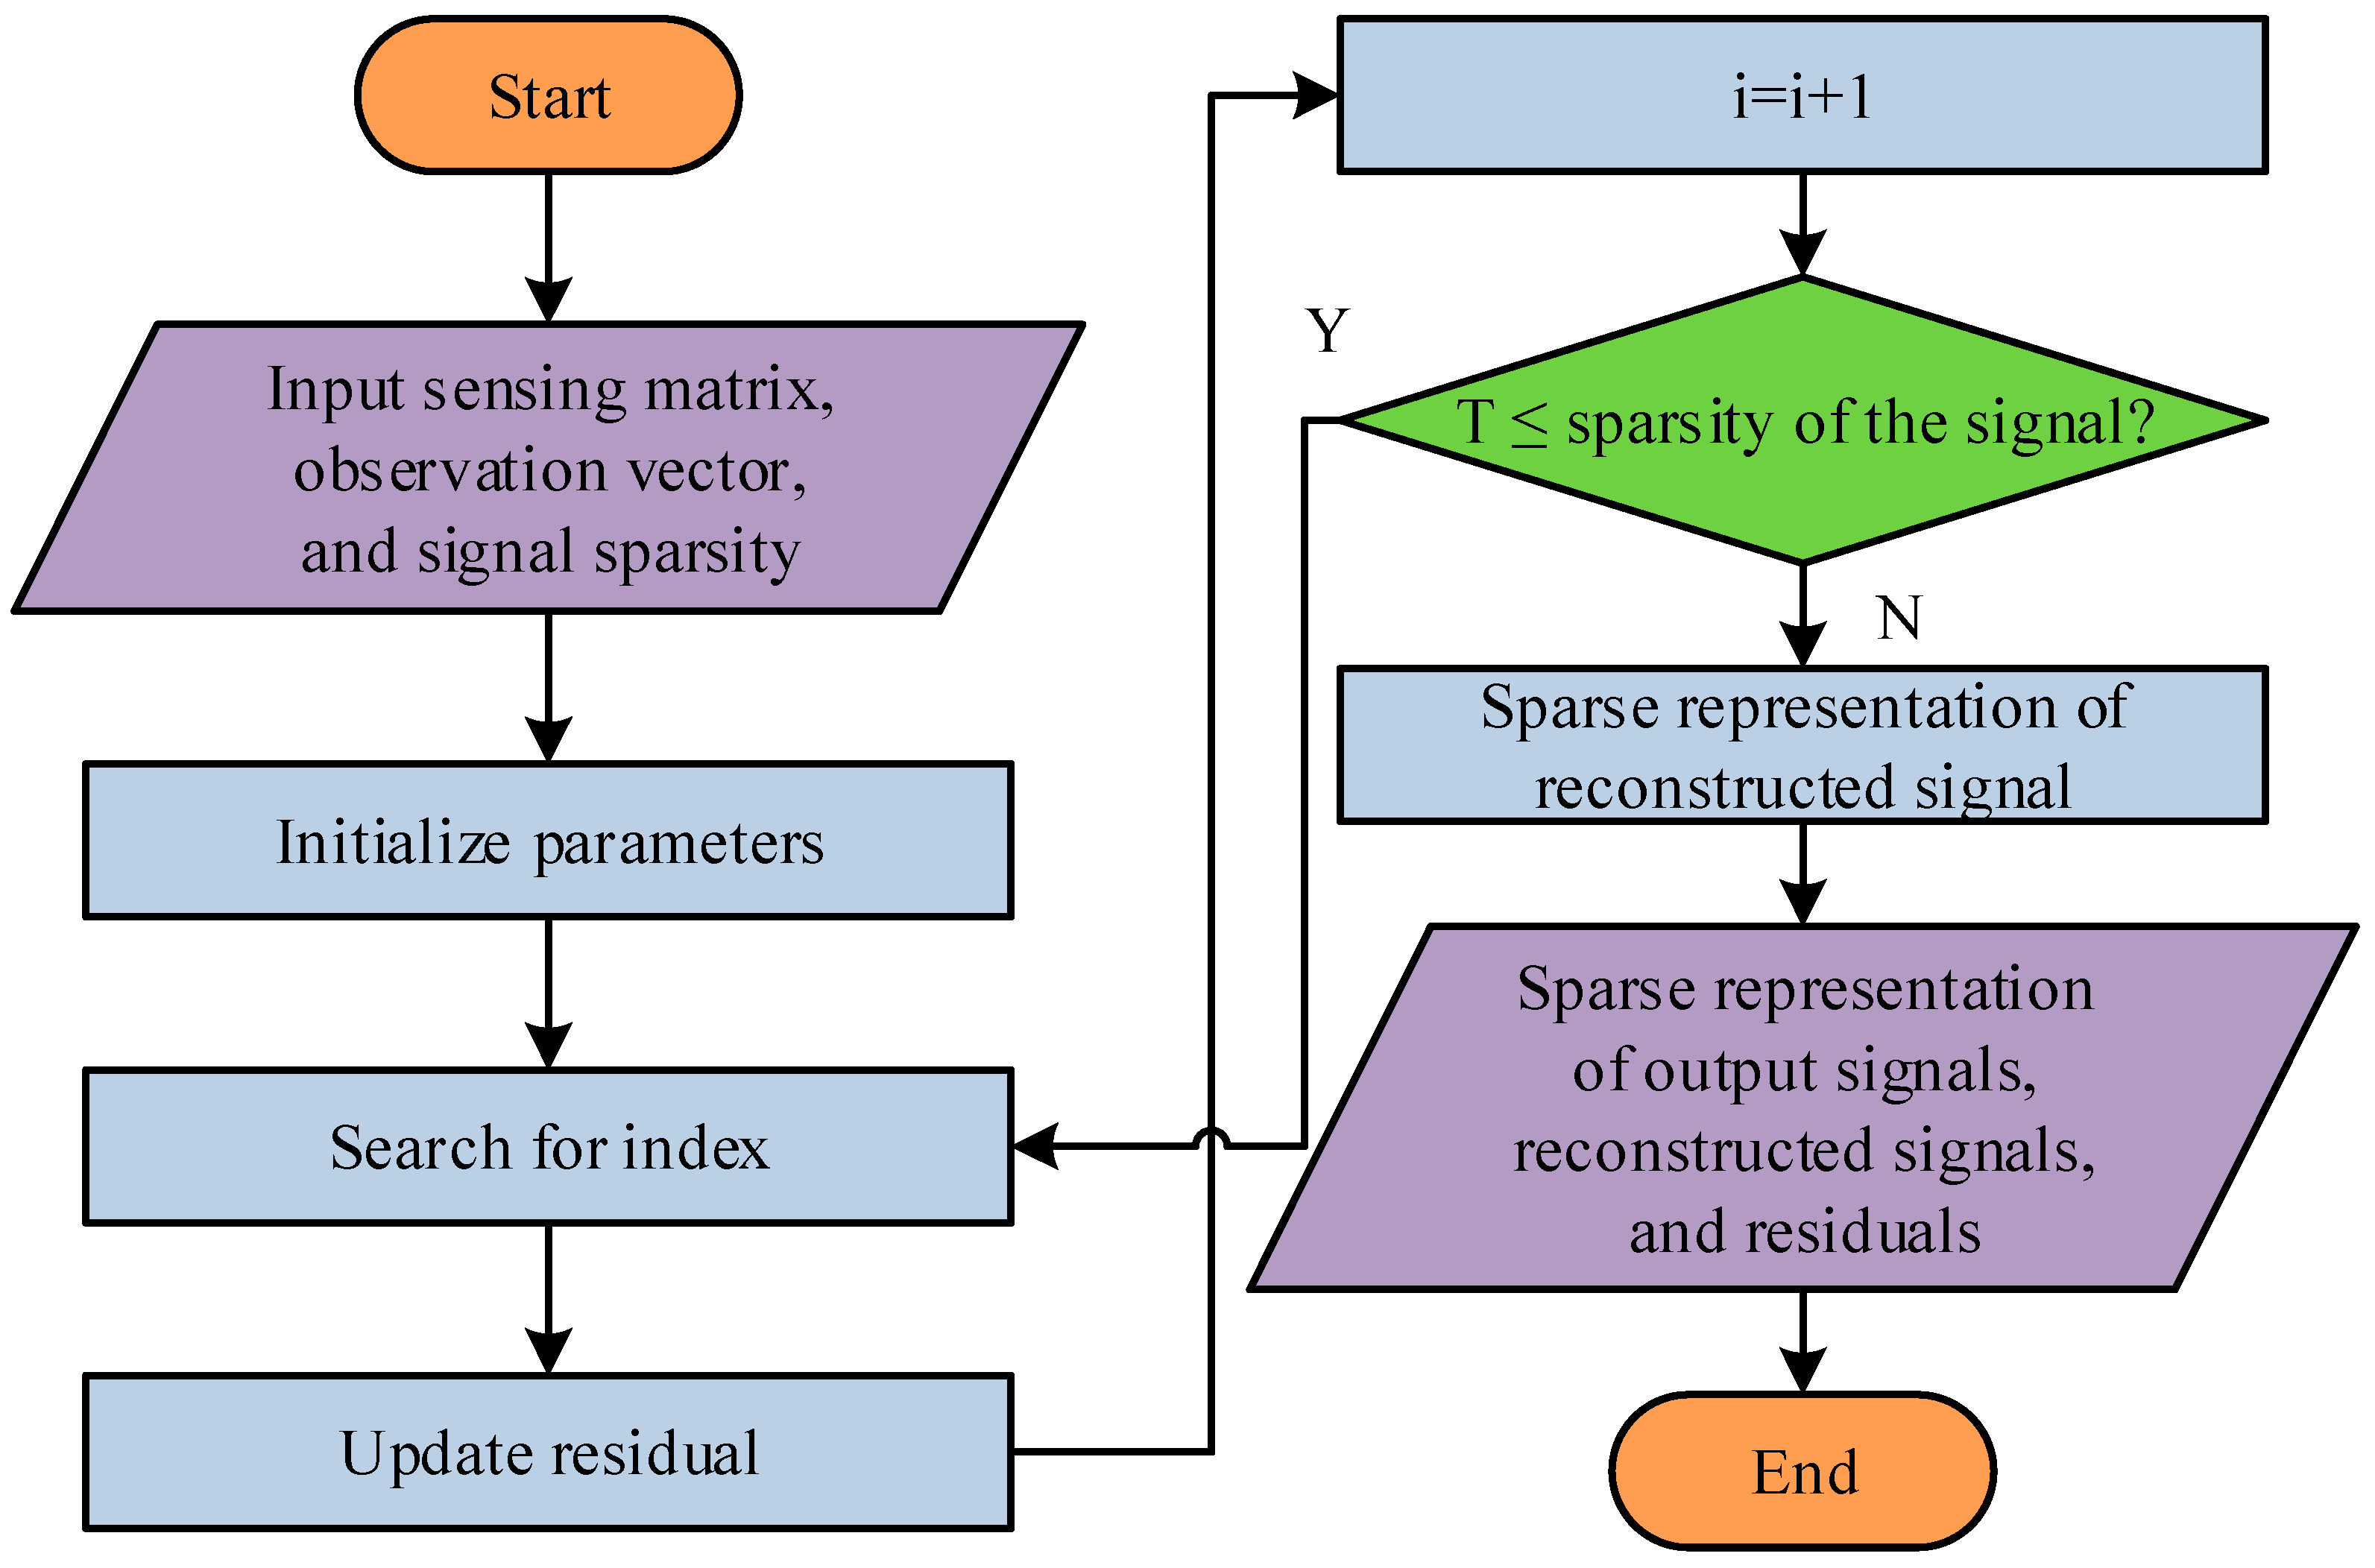
3.1. Design of Data Preprocessing and CSR Algorithm
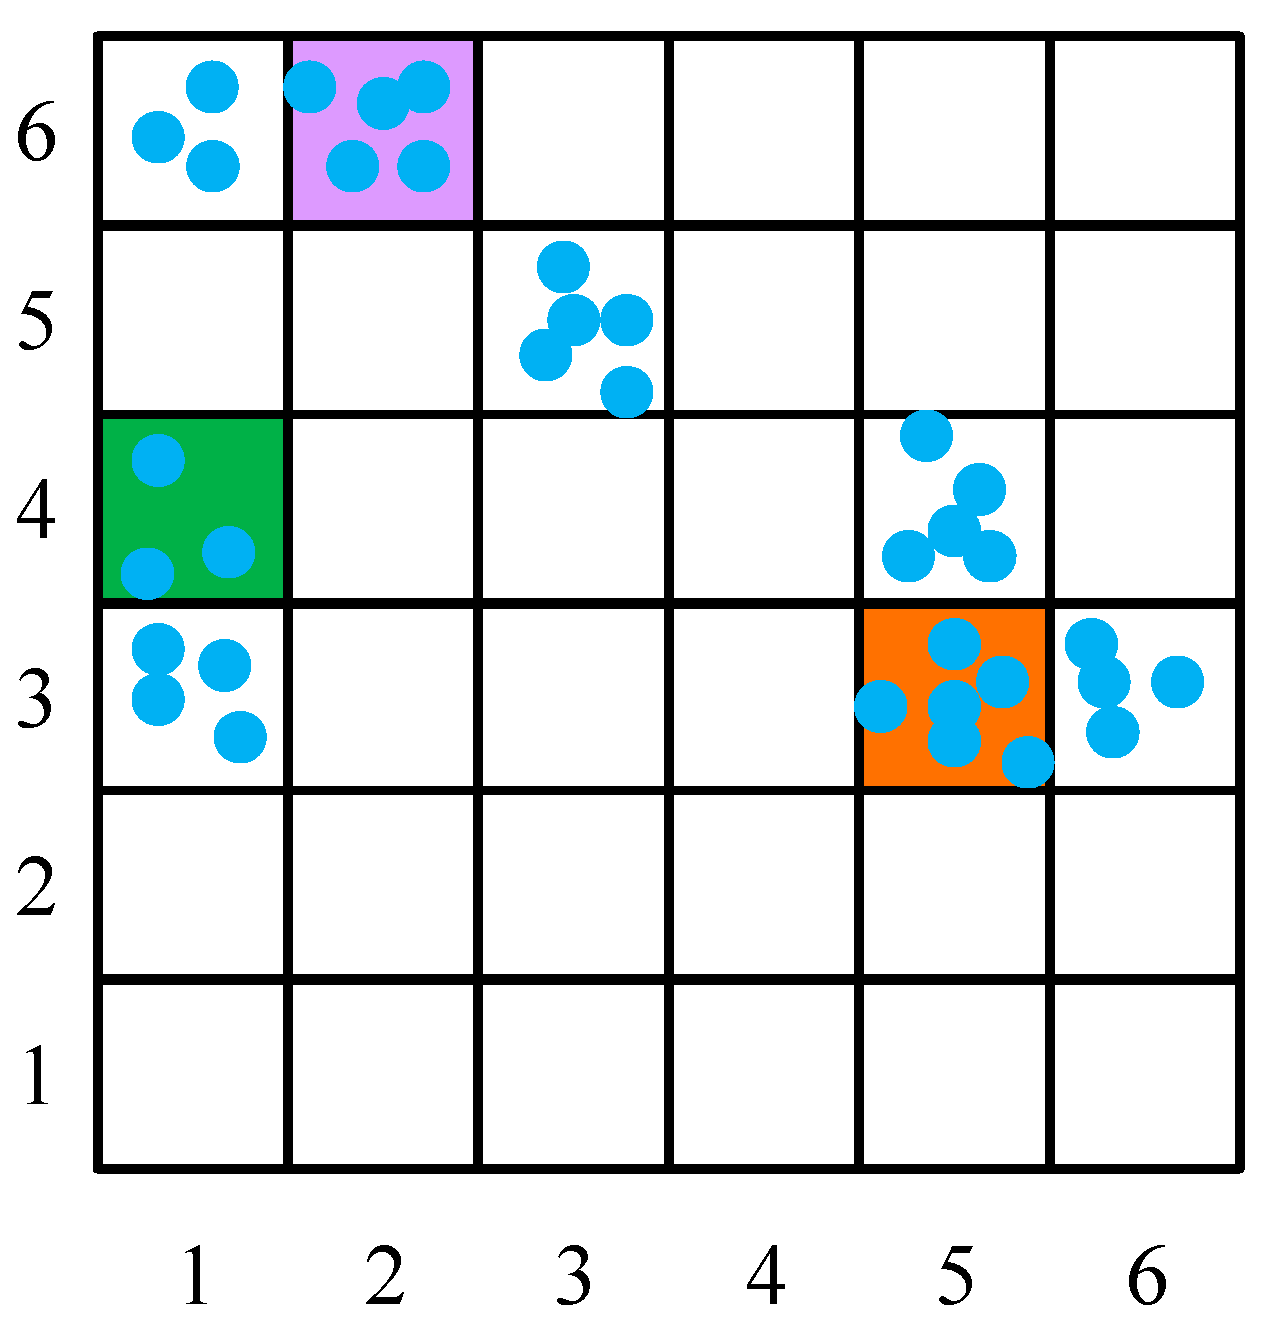
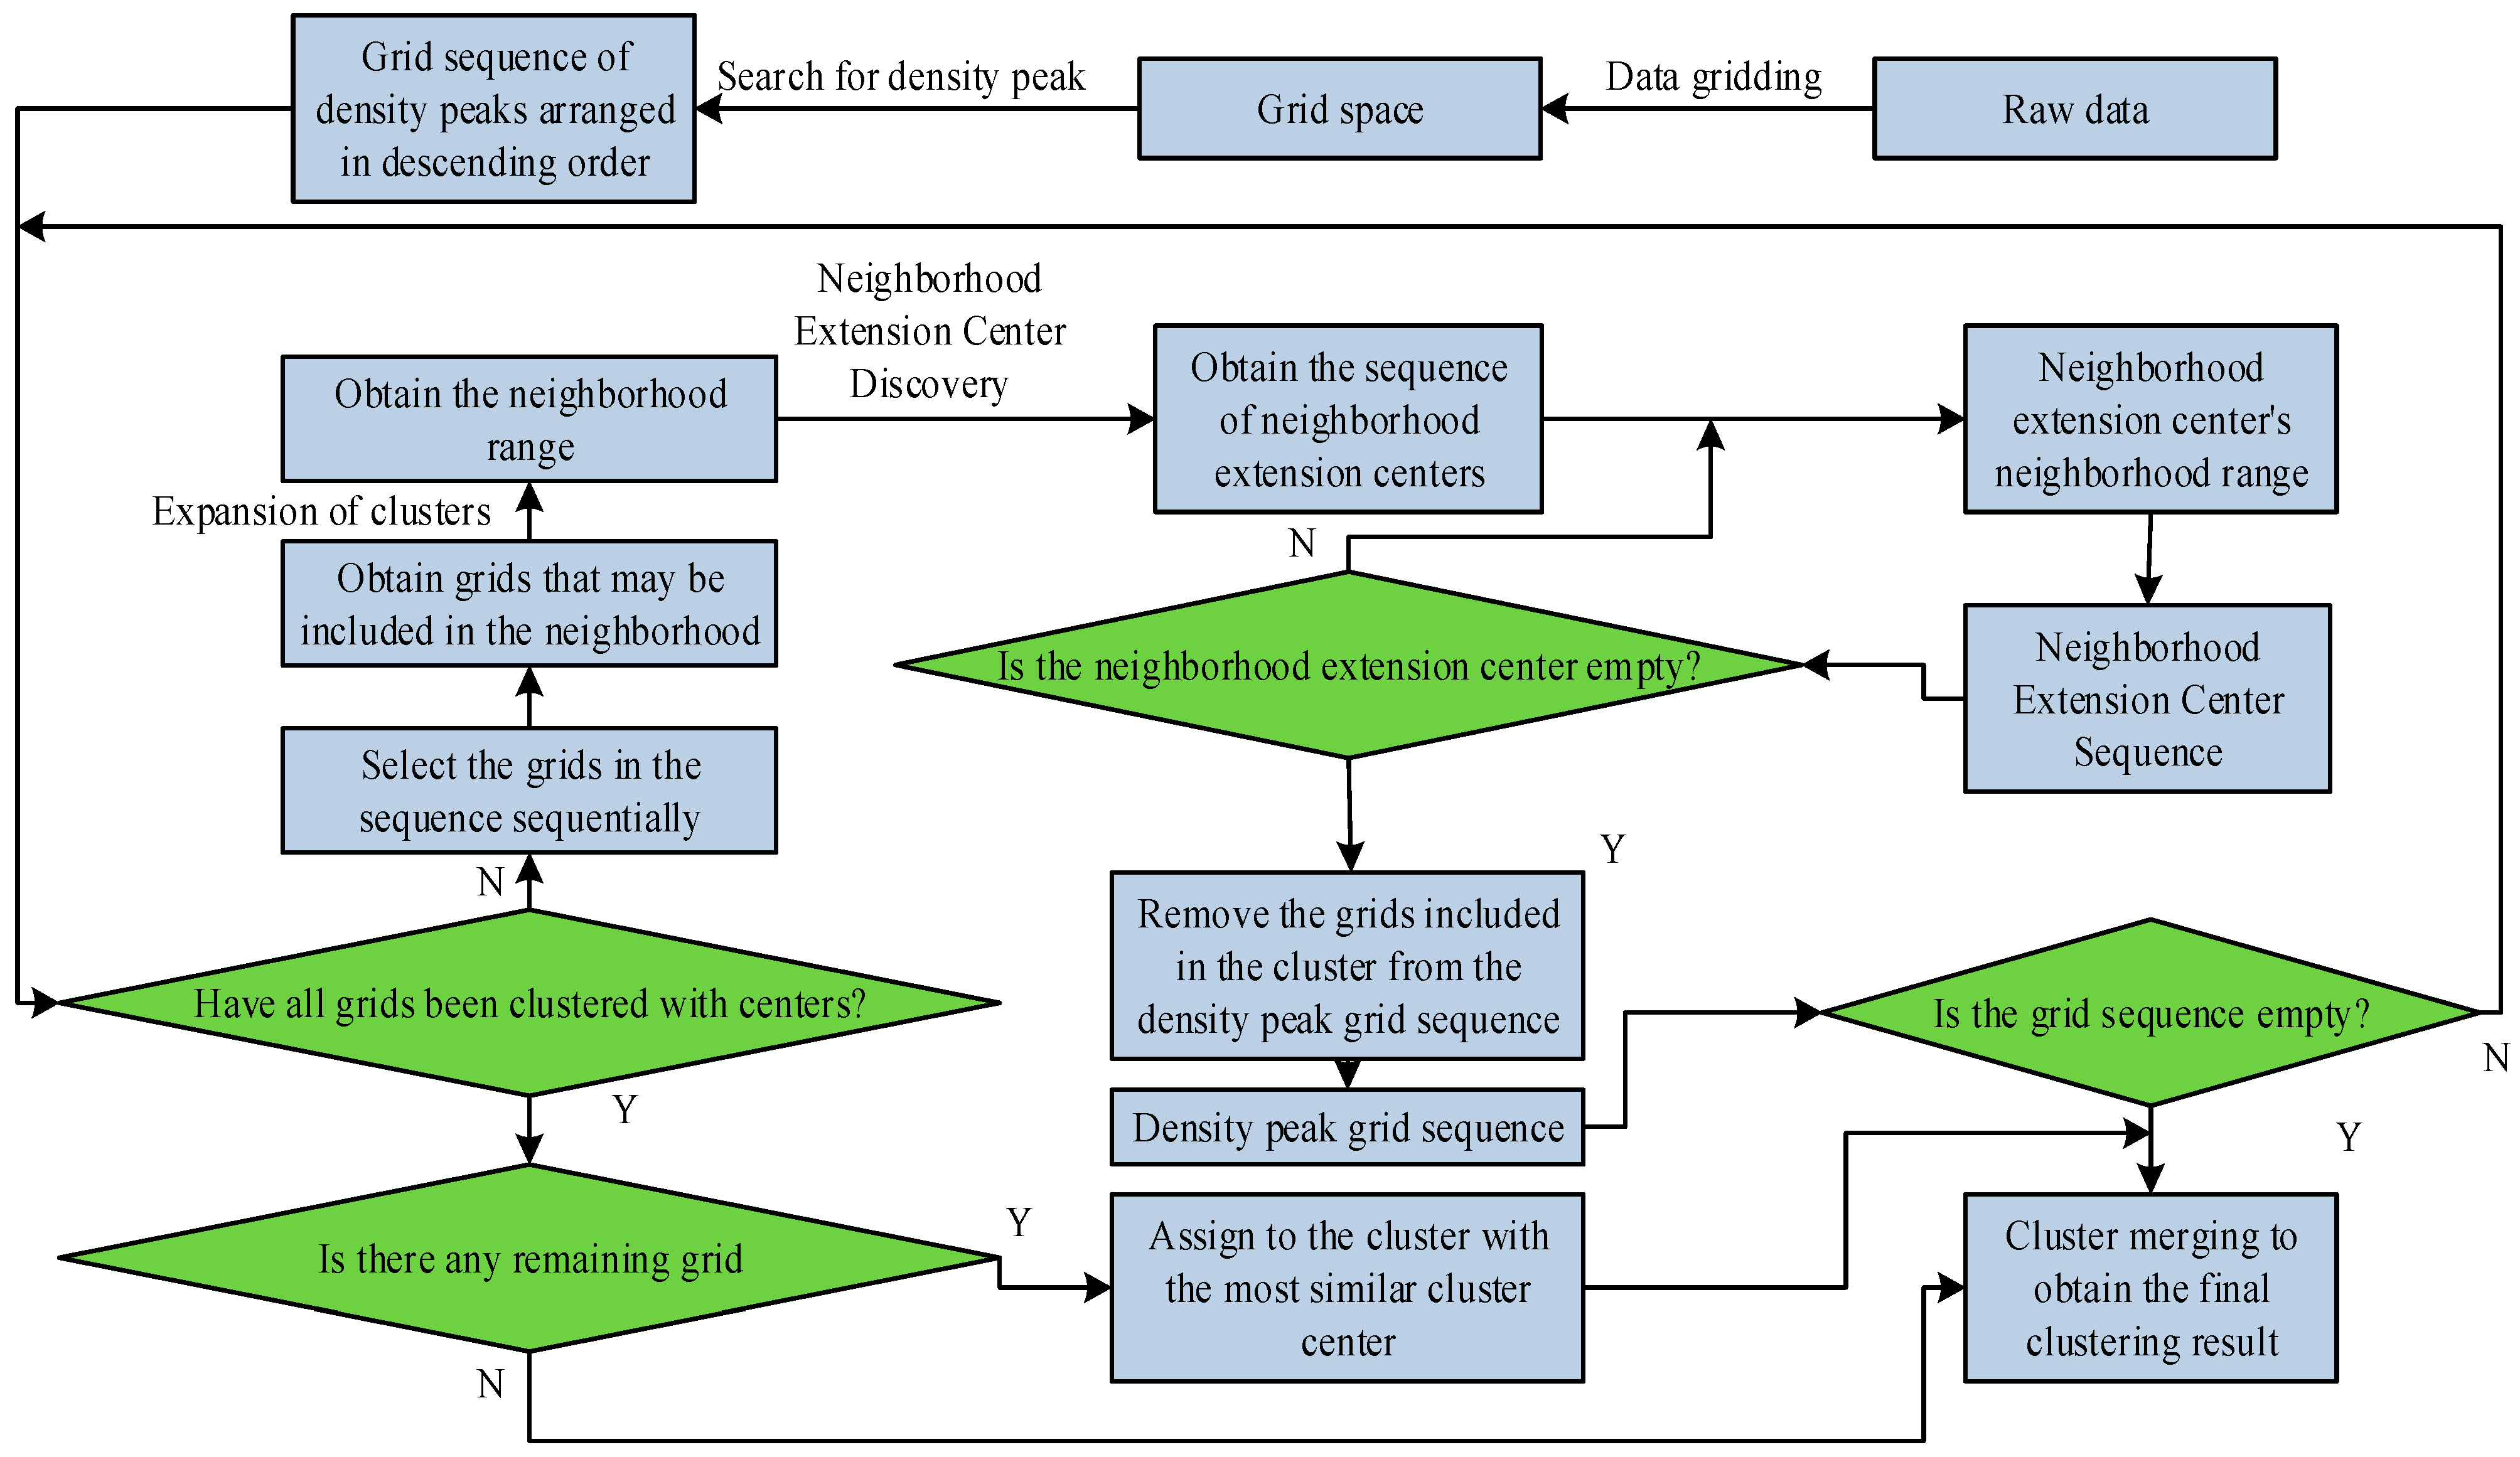
3.2. Meteorological Data Processing Combining CSR Algorithm and Improved PDC Algorithm
3.3. Construction of an Intelligent, Sustainable, Building Energy-Saving Design Platform
4. Analysis of the Results of Building Energy Efficiency Design Platform Based on the CSR Algorithm
4.1. Performance Results of Data Processing Methods Using the CSR Algorithm
4.2. Analysis of the Results of the Intelligent, Sustainable, Building Energy-Saving Design Platform
5. Conclusions
Author Contributions
Funding
Institutional Review Board Statement
Informed Consent Statement
Data Availability Statement
Conflicts of Interest
References
- Mehdi, G.; Hooman, H.; Liu, Y.; Peyman, S.; Arif, R. Data Mining Techniques for Web Mining: A Survey. AIA 2022, 1, 3–10. [Google Scholar] [CrossRef]
- Morales Pedraza, J. The Role of Renewable Energy in the Transition to Green, Low-Carbon Power Generation in Asia. GLCE 2023, 1, 68–84. [Google Scholar] [CrossRef]
- Zhang, H.; Li, Z.; Xue, Y.; Chang, X.; Su, J.; Wang, P.; Guo, Q.; Sun, H. A Stochastic Bi-level Optimal Allocation Approach of Intelligent Buildings Considering Energy Storage Sharing Services. IEEE Trans. Consum. Electron. 2024, 70, 5142–5153. [Google Scholar] [CrossRef]
- Qi, B.; Gao, S.; Xu, P. The Application of Recycled Epoxy Plastic Sheets Waste to Replace Concrete in Urban Construction and Building. Processes 2023, 11, 201. [Google Scholar] [CrossRef]
- Zhang, G.; Mao, J.; Hua, W.; Wu, X.; Sun, R.; Yan, Z.; Liu, Y.; Wu, G. Synergistic Effect of the Planetary-scale Disturbance, Typhoon and Meso-β-scale Convective Vortex on the Extremely Intense Rainstorm on 20 July 2021 in Zhengzhou. Adv. Atmos. Sci. 2023, 40, 428–446. [Google Scholar] [CrossRef]
- Xia, X.; Zou, X.; Zhang, W. El Niño Signals Revealed by AMSU-A Brightness Temperature Observations. Clim. Dynam. 2024, 62, 3431–3450. [Google Scholar] [CrossRef]
- Ding, B.; Li, Z.; Li, Z.; Xue, Y.; Chang, X.; Su, J.; Jin, X.; Sun, H. A CCP-based distributed cooperative operation strategy for multi-agent energy systems integrated with wind, solar, and buildings. Appl. Energy 2024, 365, 123275. [Google Scholar] [CrossRef]
- Yang, Z.; Jia, Y.; Zhang, J. Hierarchical-Morphology Metal/Polymer Heterostructure for Scalable Multimodal Thermal Management. ACS Appl. Mater. Interfaces 2022, 21, 24755–24765. [Google Scholar] [CrossRef]
- Zhao, J.; Sun, J.; Li, Y.; Xia, R.; Zhang, W.; Wang, B.; Fang, X.; Liu, Y.; Guo, H. Wood-plastic Materials with Organic–Inorganic Hybrid Phase Change Thermal Storage as Novel Green Energy Storage Composites for Building Energy Conservation. J. Mater. Sci. 2022, 57, 3629–3644. [Google Scholar] [CrossRef]
- Li, H.; Sun, B.; Hao, J.; Zhao, J.; Li, J.; Khakichi, A. Economical Planning of Fuel Cell Vehicle-to-Grid Integrated Green Buildings with a New Hybrid Optimization Algorithm. Int. J. Hydrog. Energy 2022, 47, 8514–8531. [Google Scholar] [CrossRef]
- Shi, C.; Liu, P.; Chen, Y.; Yang, Z.; Zhao, J.; Chen, C.; Yang, B.; Shahid, S. Adversarial Learning-Based Multi-Timescale Network Resource Management in Multi-Mode Green IoT Network for Smart Building. IET Commun. 2022, 16, 1739–1751. [Google Scholar] [CrossRef]
- Yan, H.; Wei, Y.; Zhou, Y.; Wang, Y. Temperature Distribution Reconstruction Method for Acoustic Tomography Based on Compressed Sensing. Ultrason. Imaging 2022, 44, 77–95. [Google Scholar] [CrossRef] [PubMed]
- Qiu, W.; Xue, L.; Wang, Z. Recovery Performance Improvement of Image Compressive Sensing Using Complex-Valued Vandermonde Matrix. IET Image Process. 2023, 17, 3856–3868. [Google Scholar] [CrossRef]
- Feng, H.; Wang, M.; Sha, Z.Y.X. φ-OTDR Signal Compression Scheme Based on the Compressed Sensing Theory. Opt. Express 2023, 31, 19853–19866. [Google Scholar] [CrossRef]
- Yuan, G.; Jinlin, J.; Wei, C. Fast Bilateral Complementary Network for Deep Learning Compressed Sensing Image Reconstruction. IET Image Process. 2022, 16, 3485–3498. [Google Scholar] [CrossRef]
- Zhang, T.; Qu, Y.; He, G. Pricing Strategy for Green Products Based on Disparities in Energy Consumption. IEEE Trans. Eng. Manag. 2022, 69, 616–627. [Google Scholar] [CrossRef]
- Bucak, A.; Nder, A.Z.; Atk, A.N. Spatial Effects of Renewable and Fossil Energy Consumption on the Ecological Footprint for the EU Countries. Environ. Sci. Pollut. Res. 2024, 31, 55204–55221. [Google Scholar] [CrossRef]
- Kawoosa, A.I.; Prashar, D.; Faheem, M.; Jha, N.; Khan, A.A. Using Machine Learning Ensemble Method for Detection of Energy Theft in Smart Meters. IET Gener. Transm. Distrib. 2023, 17, 4794–4809. [Google Scholar] [CrossRef]
- Barros, P.L.; Ein-Mozaffari, F.; Lohi, A. Power Consumption Characterization of Energy-Efficient Aerated Coaxial Mixers Containing Yield-Stress Biopolymer Solutions. Ind. Eng. Chem. Res. 2022, 61, 12813–12824. [Google Scholar] [CrossRef]
- Scarcello, L.; Cicirelli, F.; Guerrieri, A.; Mastroianni, C.; Spezzano, G.; Vinci, A. Pursuing Energy Saving and Thermal Comfort with a Human-Driven DRL Approach. IEEE Trans. Hum.-Mach. Syst. 2023, 53, 707–719. [Google Scholar] [CrossRef]
- Yu, D.; Yang, L.; Zhan, X.; Fu, Z.; Jia, Y. Logical Stochastic Resonance and Energy Consumption in Stochastic Hodgkin–Huxley Neuron System. Nonlinear Dyn. 2023, 111, 6757–6772. [Google Scholar] [CrossRef]
- Trusel, L.D.; Krome, J.D.; Datta, R.T. Atmospheric Response to Antarctic Sea-Ice Reductions Drives Ice Sheet Surface Mass Balance Increases. J. Clim. 2023, 36, 6879–6896. [Google Scholar] [CrossRef]
- Chiara De Falco, M.P.; Priscilla, A.; Nummelin, M.A.; Tjiputra, J. Added Value of a Regional Coupled Model: The Case Study for Marine Heatwaves in the Caribbean. Clim. Dyn. 2023, 61, 3569–3579. [Google Scholar] [CrossRef]
- Qi, B.; Xu, P.; Wu, C. Analysis of the Infiltration and Water Storage Performance of Recycled Brick Mix Aggregates in Sponge City Construction. Water 2023, 15, 363. [Google Scholar] [CrossRef]
- Li, Z.; Sun, D.; Wang, S.; Yu, H.; Zhang, H.; Liu, J.; He, Y. A Global Satellite Observation of Phytoplankton Taxonomic Groups over the Past Two Decades. Glob. Change Biol. 2023, 29, 4511–4529. [Google Scholar] [CrossRef] [PubMed]
- Schumann, G.; Andreassen, O.A.; Banaschewski, T.; Calhoun, V.D.; Clinton, N.; Desrivieres, S.; Brandlistuen, R.E.; Feng, J.; Hese, S.; Hitchen, E. Addressing Global Environmental Challenges to Mental Health Using Population Neuroscience: A Review. JAMA Psychiatry 2023, 80, 1066–1074. [Google Scholar] [CrossRef]
- Jia, Q.; Jia, H.; Li, Y.; Yin, D. Applicability of CMIP5 and CMIP6 Models in China: Reproducibility of Historical Simulation and Uncertainty of Future Projection. J. Clim. 2023, 37, 5809–5824. [Google Scholar] [CrossRef]
- Gao, Y.; Liu, L.; Ma, S.; Zhou, Y.; Jia, R.; Li, X.; Yang, H.; Wang, B. Vegetation Restoration in Dryland with Shrub Serves as a Carbon Sink: Evidence from a 13-Year Observation at the Tengger Desert of Northern China. Land Degrad. Dev. 2024, 35, 102–113. [Google Scholar] [CrossRef]
- Fei, X.; Wei, Z.; Xiao, L. Iterative Directional Total Variation Refinement for Compressive Sensing Image Reconstruction. IEEE Signal Process. Lett. 2014, 21, 695–699. [Google Scholar] [CrossRef]
- Engelhardt, E.K.; Biber, M.F.; Dolek, M.; Fartmann, T.; Hochkirch, A.; Leidinger, J.; Löffler, F.; Pinkert, S.; Poniatowski, D.; Voith, J. Consistent Signals of a Warming Climate in Occupancy Changes of Three Insect Taxa over 40 Years in Central Europe. Glob. Change Biol. 2022, 28, 3998–4012. [Google Scholar] [CrossRef]
- Jenouvrier, S.; Long, M.C.; Coste, C.F.D.; Holland, M.; Gamelon, M.; Yoccoz, N.G.; Sæther, B.-E. Detecting Climate Signals in Populations across Life Histories. Glob. Change Biol. 2022, 28, 2236–2258. [Google Scholar] [CrossRef]
- Li, Y.; Liu, C.; Sack, L.; Xu, L.; Li, M.; Zhang, J.; He, N. Leaf Trait Network Architecture Shifts with Species-Richness and Climate across Forests at Continental Scale. Ecol. Lett. 2022, 25, 1442–1457. [Google Scholar] [CrossRef] [PubMed]
- Lebel, L.; John, A.; Korolevych, V. Dispersion Simulations of Radon Discharges between Neighboring Buildings and Their Sensitivity to Meteorology, Discharge Rate, and Building Geometry. Health Phys. 2022, 122, 383–401. [Google Scholar] [CrossRef]
- Cui, Y.; Xiao, S.; Giometto, M.G.; Li, Q. Effects of Urban Surface Roughness on Potential Sources of Microplastics in the Atmospheric Boundary Layer. Bound.-Layer Meteorol. 2023, 186, 425–453. [Google Scholar] [CrossRef]
- Huang, X.; Wang, H.; Gao, L. Numerical Simulations of the Thermal Effect on Flow and Dispersion around an Isolated Building. J. Appl. Meteorol. Climatol. 2022, 61, 1905–1918. [Google Scholar] [CrossRef]


| Defect Condition | Method | MAE/°C | RMSE/°C |
|---|---|---|---|
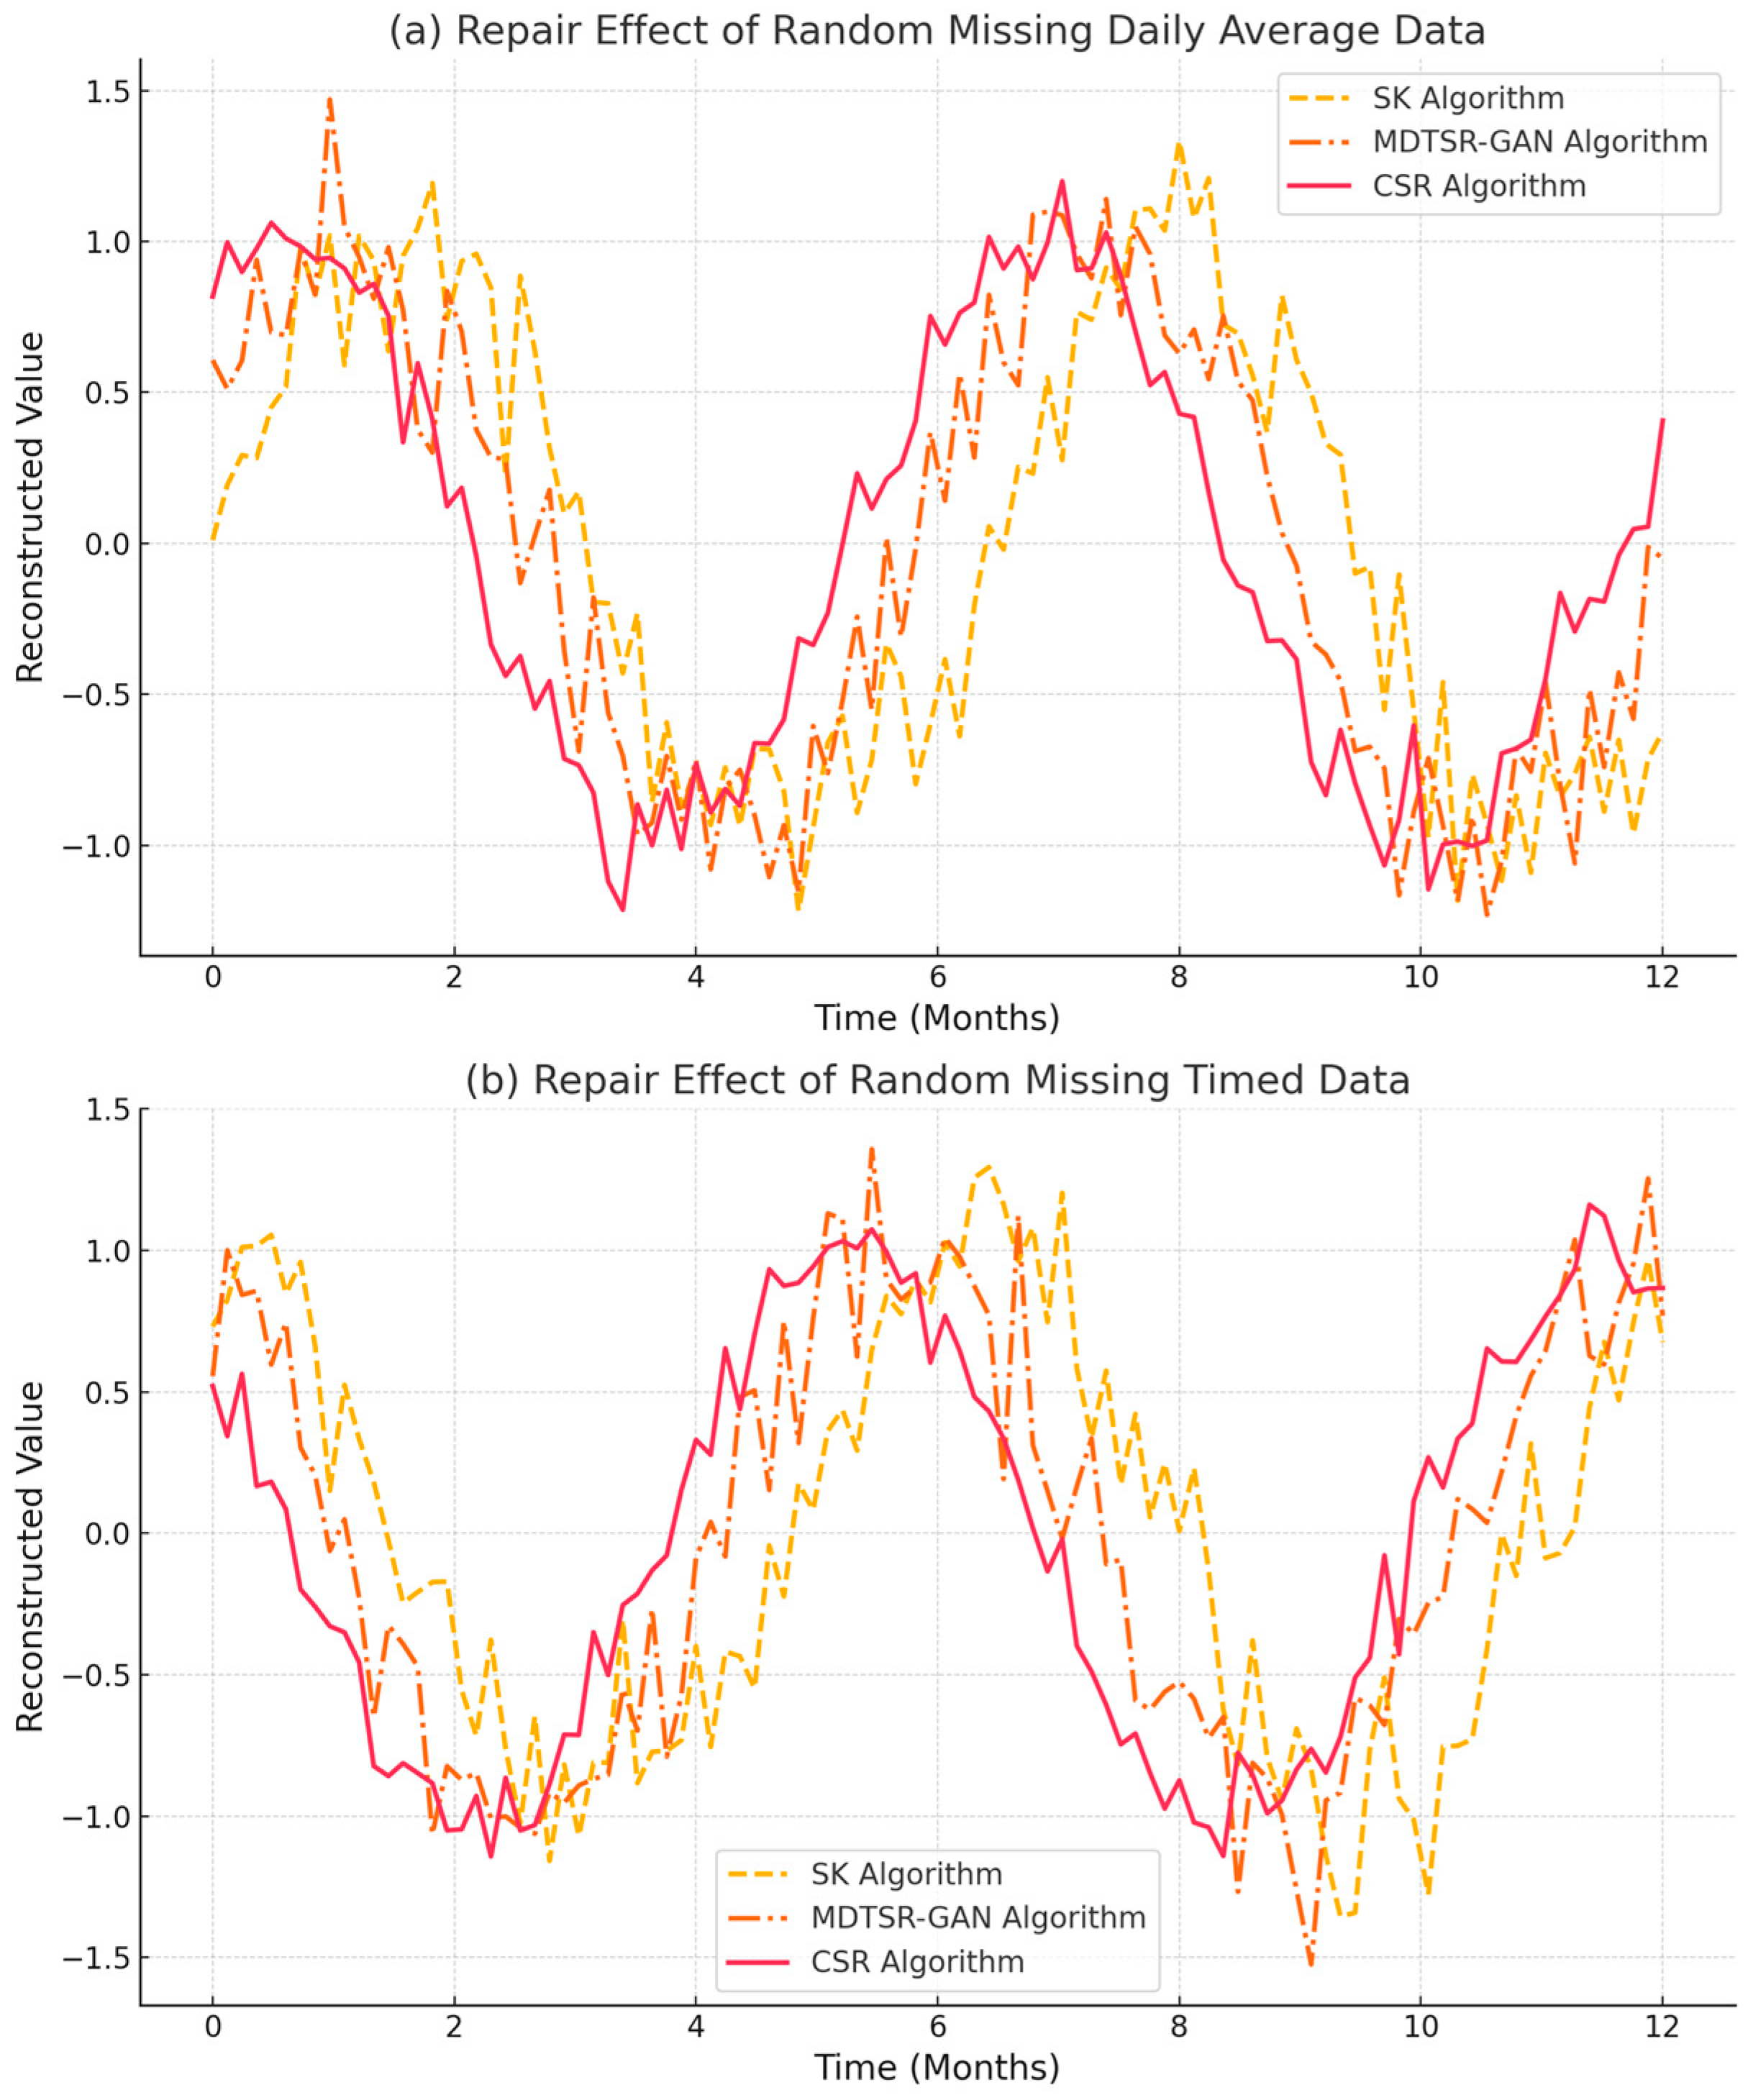
| Random missing daily average data | CSR | 0.0280 | 0.0560 |
| SK | 0.1760 | 0.2640 | |
| MDTSR-GAN | 0.0920 | 0.1650 | |
| Random missing timed data | CSR | 0.0305 | 0.0590 |
| SK | 0.1820 | 0.2720 | |
| MDTSR-GAN | 0.0970 | 0.1700 | |
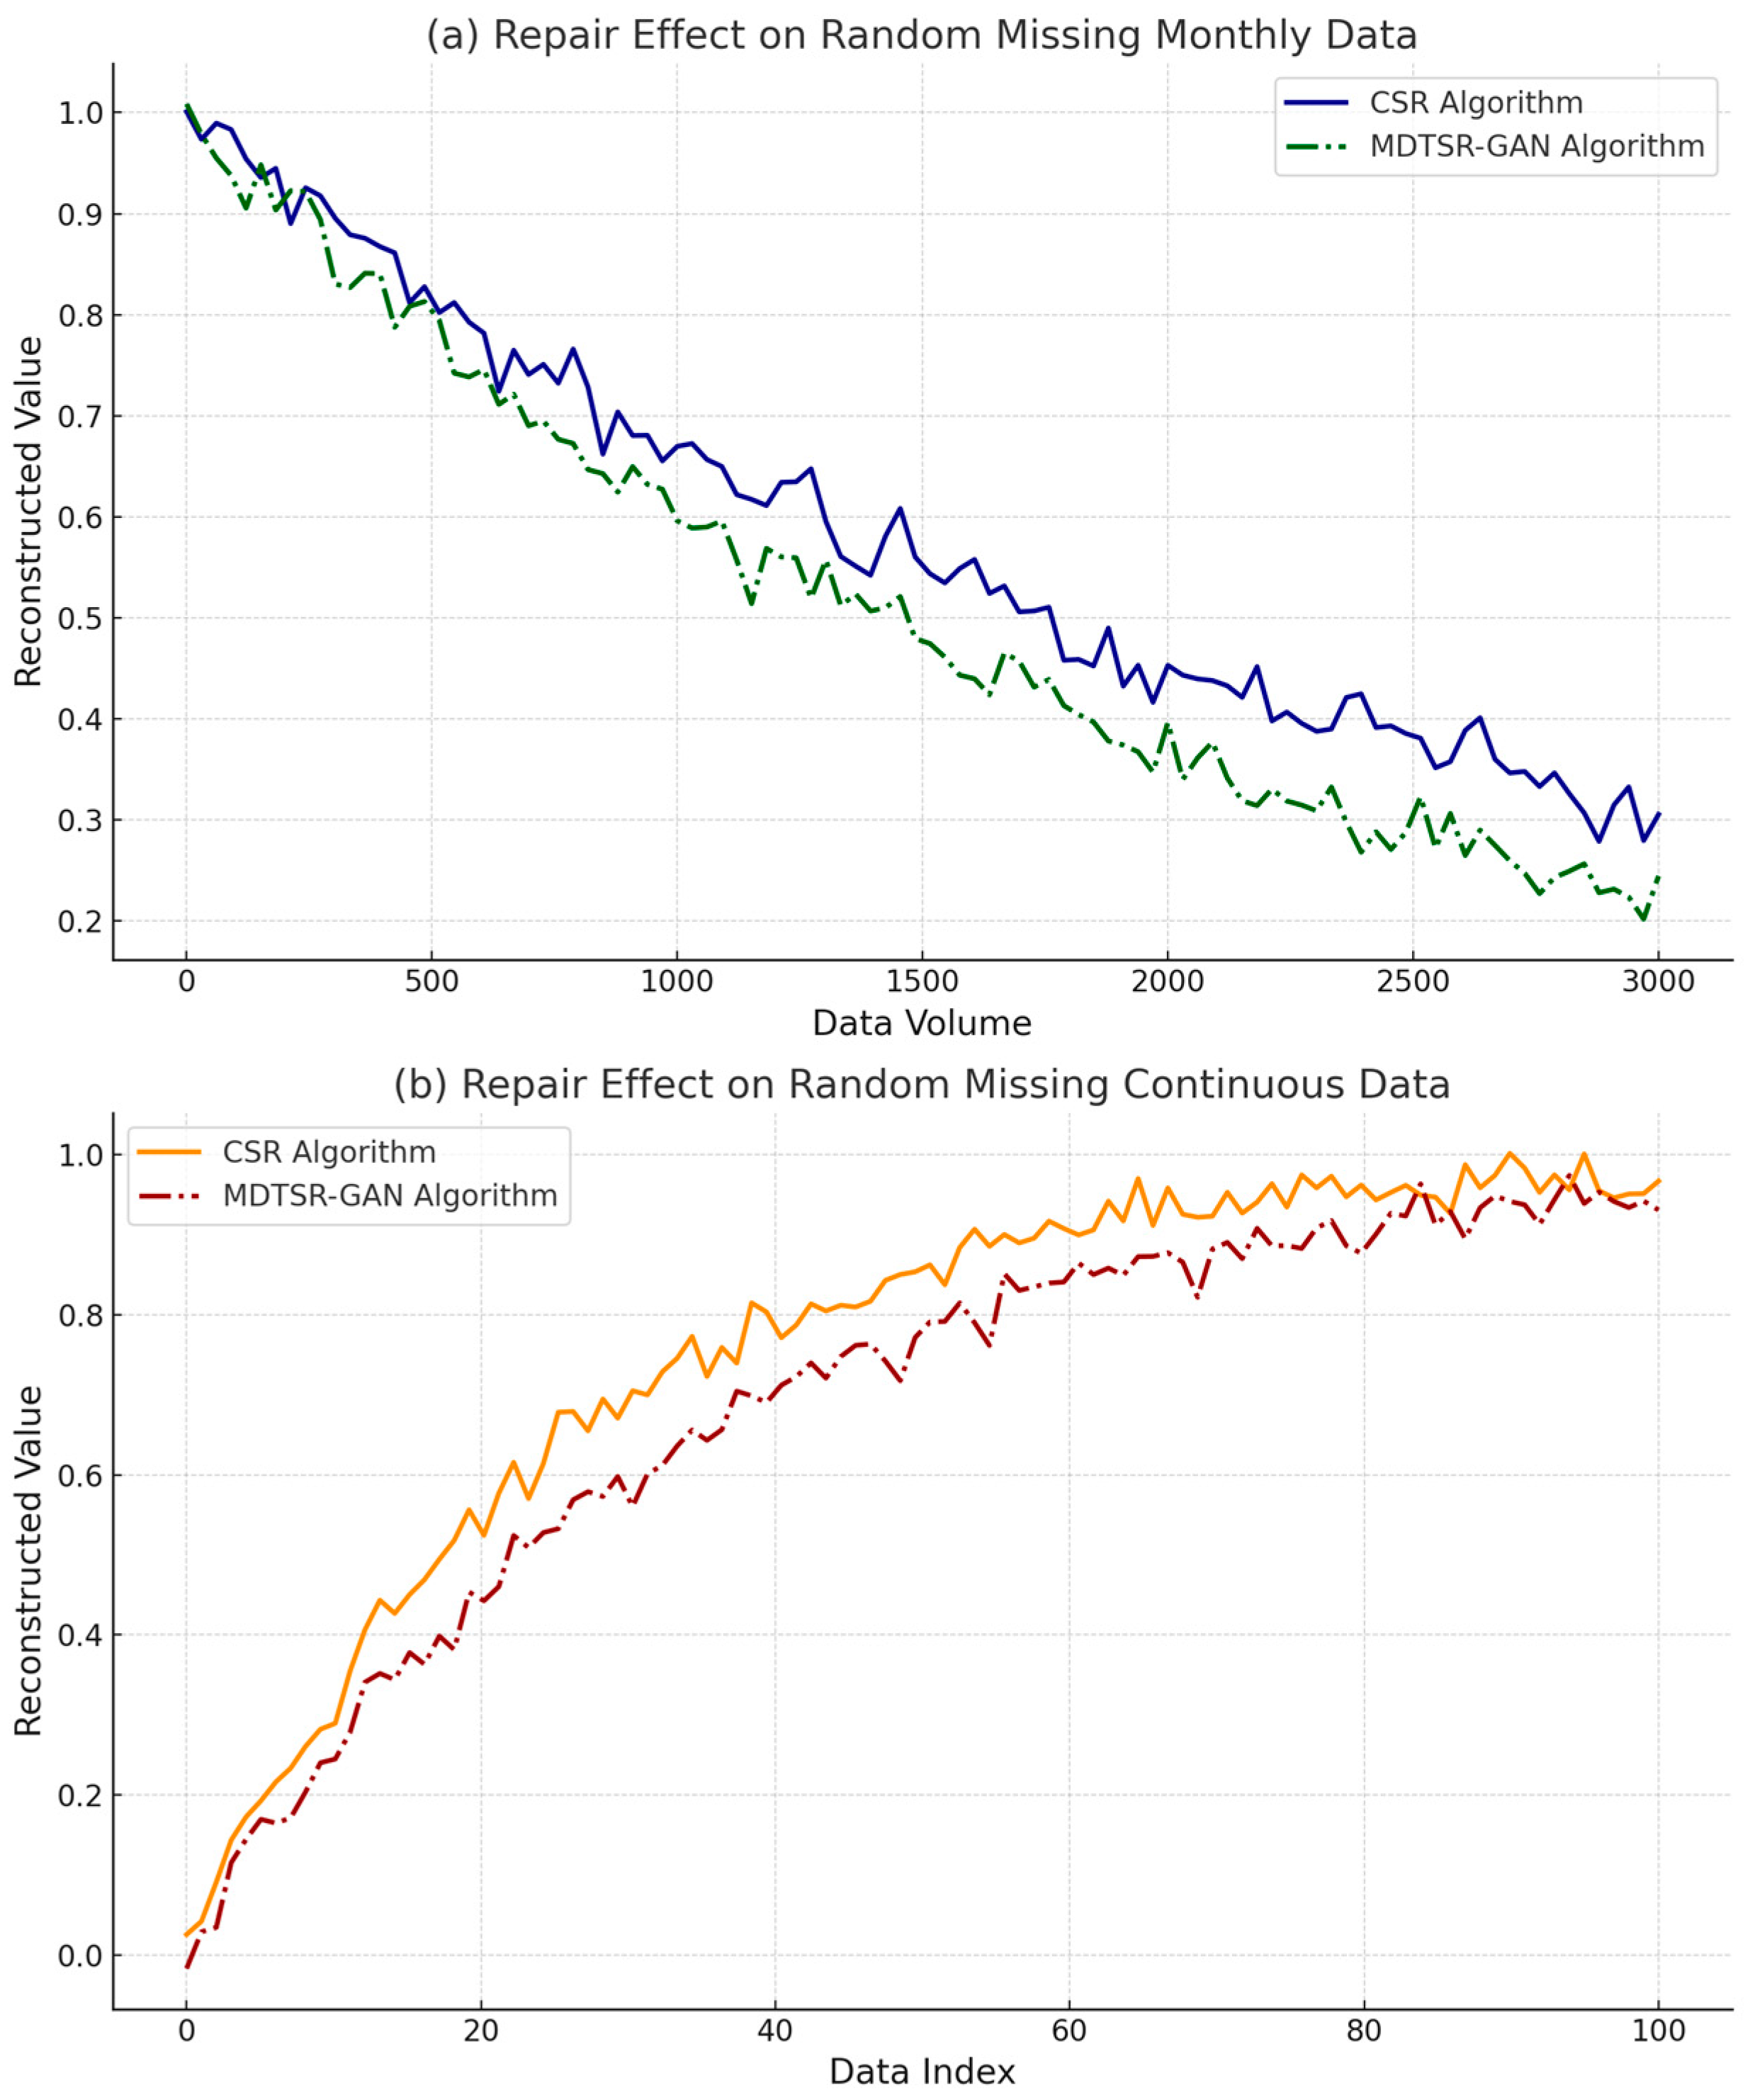
| Continuous data with random defects | CSR | 0.0340 | 0.0650 |
| SK | 0.2500 | 0.3900 | |
| MDTSR-GAN | 0.1100 | 0.1900 | |
| Random missing monthly scheduled data | CSR | 0.0180 | 0.0350 |
| MDTSR-GAN | 0.0700 | 0.1300 |
| Clustering Algorithm | Evaluating Indicator | CD | RD | ||||
|---|---|---|---|---|---|---|---|
| Is3 | Sticks | Eye | Iris | Lonosphere | Coil | ||
| DCCC | Accuracy | 0.6568 | 0.6447 | 0.8263 | 0.8259 | 0.6451 | 0.4825 |
| F1 value | 0.6975 | 0.6352 | 9.8135 | 0.8614 | 0.5526 | 0.4736 | |
| ADC | 0.4623 | 0.6289 | 0.6473 | 0.6425 | 0.4215 | 0.4576 | |
| SMI | 0.6782 | 0.8112 | 0.8119 | 0.7411 | 0.4076 | 0.5127 | |
| PCSD | Accuracy | 0.6118 | 0.7265 | 0.6794 | 0.6639 | 0.5528 | 0.5915 |
| F1 value | 0.5739 | 0.7366 | 0.6418 | 0.5861 | 0.5542 | 0.4859 | |
| ADC | 0.6287 | 0.6347 | 0.8113 | 0.5721 | 0.5137 | 0.4637 | |
| SMI | 0.7693 | 0.7452 | 0.7879 | 0.7342 | 0.5124 | 0.5026 | |
| PDC-IFO | Accuracy | 1.0000 | 1.0000 | 0.8167 | 0.9135 | 0.3317 | 0.4265 |
| F1 value | 1.0000 | 1.0000 | 0.8003 | 0.9264 | 0.3421 | 0.3798 | |
| ADC | 1.0000 | 1.0000 | 0.6298 | 0.8053 | 0.4275 | 0.4678 | |
| SMI | 1.0000 | 1.0000 | 0.6315 | 0.8126 | 0.4525 | 0.5038 | |
| Improve PDC | Accuracy | 1.0000 | 1.0000 | 0.9235 | 0.9613 | 0.6875 | 0.8425 |
| F1 value | 1.0000 | 1.0000 | 0.9062 | 0.9627 | 0.6954 | 0.7762 | |
| ADC | 1.0000 | 1.0000 | 0.8247 | 0.8862 | 0.4875 | 0.4698 | |
| SMI | 1.0000 | 1.0000 | 0.7861 | 0.8711 | 0.4351 | 0.5021 | |
| Data Set | DCCC | PCSD | PDC-IFO | Improve PDC | |
|---|---|---|---|---|---|
| CD | Is3 | 0.9887 | 0.0358 | 0.6125 | 0.2943 |
| Sticks | 0.0569 | 0.0366 | 0.0931 | 0.0736 | |
| Eye | 0.0336 | 0.0259 | 0.0459 | 0.0315 | |
| RD | Iris | 0.0283 | 0.0227 | 0.0501 | 0.0312 |
| Lonosphere | 0.0519 | 0.0279 | 0.0898 | 0.0787 | |
| 0.0411 | Coil | 0.0327 | 0.0248 | 0.0763 | 0.0411 |
| Category | Data | Numerical Value | Category | Data | Numerical Value |
|---|---|---|---|---|---|
| Station information | Province/municipality/autonomous region | / | Wind speed, direction, and frequency | Summer average wind speed | 2.49 m/s |
| City/region/autonomous prefecture | / | Maximum wind direction frequency in summer | 12.03% | ||
| Altitude | / | Maximum outdoor wind speed in summer | 3.07 m/s | ||
| Latitude and longitude | / | Heating period days and average temperature | Annual average temperature | 5.3 °C | |
| Atmospheric pressure | Outdoor atmospheric pressure in summer | 988.897 hPa | Outdoor HVAC calculation temperature | −22.81 °C | |
| Outdoor atmospheric pressure in winter | 1005.643 hPa | Outdoor calculated temperature for summer air conditioning | 30.81 °C | ||
| Outdoor temperature and humidity | The number of days with a daily average temperature not exceeding 5 °C | 165 | Outdoor calculated humidity for summer air conditioning | 24.89% | |
| The number of days with a daily average temperature not exceeding 8 °C | 187 | Outdoor calculated temperature for summer ventilation | 26.84 °C | ||
| Extreme minimum temperature | −37.6 °C | Outdoor calculated humidity for summer ventilation | 26.85% | ||
| Extreme maximum temperature | 39.5 °C | Calculated outdoor temperature for HVAC in winter | −26.7 °C | ||
| Wind speed, direction, and frequency | Average wind speed in winter | 2.37 m/s | Outdoor calculated humidity for HVAC in winter | 70.52% | |
| Maximum wind direction frequency in winter | 12.41% | Outdoor temperature for winter ventilation | −17.6 °C | ||
| Maximum outdoor wind speed in winter | 2.85 m/s | / | / | / | |
| Winter sunshine rate | 39.43% | / | / | / |
Disclaimer/Publisher’s Note: The statements, opinions and data contained in all publications are solely those of the individual author(s) and contributor(s) and not of MDPI and/or the editor(s). MDPI and/or the editor(s) disclaim responsibility for any injury to people or property resulting from any ideas, methods, instructions or products referred to in the content. |
© 2025 by the authors. Licensee MDPI, Basel, Switzerland. This article is an open access article distributed under the terms and conditions of the Creative Commons Attribution (CC BY) license (https://creativecommons.org/licenses/by/4.0/).
Share and Cite
Jia, J.; Kim, C.; Zhang, C.; Han, M.; Li, X. Meteorological Data Processing Method for Energy-Saving Design of Intelligent Buildings Based on the Compressed Sensing Reconstruction Algorithm. Sustainability 2025, 17, 1469. https://doi.org/10.3390/su17041469
Jia J, Kim C, Zhang C, Han M, Li X. Meteorological Data Processing Method for Energy-Saving Design of Intelligent Buildings Based on the Compressed Sensing Reconstruction Algorithm. Sustainability. 2025; 17(4):1469. https://doi.org/10.3390/su17041469
Chicago/Turabian StyleJia, Jingjing, Chulsoo Kim, Chunxiao Zhang, Mengmeng Han, and Xiaoyun Li. 2025. "Meteorological Data Processing Method for Energy-Saving Design of Intelligent Buildings Based on the Compressed Sensing Reconstruction Algorithm" Sustainability 17, no. 4: 1469. https://doi.org/10.3390/su17041469
APA StyleJia, J., Kim, C., Zhang, C., Han, M., & Li, X. (2025). Meteorological Data Processing Method for Energy-Saving Design of Intelligent Buildings Based on the Compressed Sensing Reconstruction Algorithm. Sustainability, 17(4), 1469. https://doi.org/10.3390/su17041469