1. Introduction
One of the primary drivers of climate change is the substantial emission of greenhouse gases, including carbon dioxide (
) [
1]. With the rapid development of the global economy and the increasing human activities, the concentration of
in the atmosphere continues to rise, expediting the Earth’s climate change [
2]. In this context, gaining a thorough understanding and control of carbon emissions becomes paramount. Accurate prediction of carbon emissions allows us to better comprehend the future trajectory of the climate and implement targeted measures to mitigate the impacts of climate change. Consequently, carbon emissions prediction is not merely a domain of scientific research but also forms the foundation for crafting environmental policies and taking action to address the global challenges posed by climate change. Therefore, it is imperative to delve into the various models and methods developed by scientists over the past few decades in this field to enhance our ability to tackle this worldwide challenge effectively.
The purpose of this review is to systematically examine and analyze the current state of research on carbon emissions prediction. We organize the literature into four key classification dimensions, including data types (univariate vs. multivariate), model types (traditional models vs. machine learning models), emission frequency (annual emissions vs. daily emissions), and modeling approaches (single models vs. hybrid models). Through a systematic classification along these dimensions, our aim is to provide researchers, policymakers, and practitioners with a clear perspective to better understand the progress of existing research, assess the strengths and weaknesses of different models, and guide future research directions.
Based on factors such as keywords and citation counts, we selected 11,089 relevant, high-quality papers covering research from 1978 to 2024. The annual publication quantity has shown a notable upward trend from 1978 to 2024. In the early years, from 1978 to 1980, the number of publications was relatively limited. However, over time, there has been a consistent growth in the number of papers addressing carbon emissions prediction. Specifically, a significant increase in publication quantity occurred from 2004 to 2008, with a peak of 100 papers in 2004 and 93 papers in 2005, possibly reflecting an increasing societal concern for climate change and carbon emissions. Subsequent years, particularly from 2010 to 2024, witnessed a further surge in publication quantity, indicating a rapid expansion in research activity and a sustained high level of interest in the field of carbon emissions prediction. The substantial volume of literature reflects the considerable academic attention devoted to the prediction of carbon emissions. The annual growth in the number of papers also underscores the field’s dynamism and sustained research interest, particularly in the context of global climate change and sustainable development.
In selecting studies for this review, we adhered to the PRISMA (Preferred Reporting Items for Systematic Reviews and Meta-Analyses) guidelines to ensure transparency and reproducibility. First, we identified relevant articles through a comprehensive search on the Web of Science using the keyword “carbon emissions prediction”. Next, we applied predefined inclusion and exclusion criteria to select studies that focused on carbon emission forecasting models, with a publication period from 1978 to 2024. The inclusion criteria included peer-reviewed journal articles, conference proceedings, and studies that employed predictive models for carbon emissions. We excluded studies that were not peer-reviewed, those lacking a clear methodology, and studies that were not focused on carbon emissions prediction. The selection process was thoroughly documented to ensure clarity and transparency in the literature review.
Over the past few decades, significant advancements have been made in the field of carbon emissions prediction. However, with the rapid changes in society, economy, and technology, new challenges and opportunities have arisen. Thus, gaining an in-depth understanding of the achievements of existing research and predicting future directions is crucial for effectively addressing climate change and achieving sustainable development goals. Through this review, we aspire to offer a comprehensive and clear overview for the academic community and decision-makers, fostering further advancements in the field of carbon emissions prediction. Key innovations of this paper include the following:
In-depth domain analysis: Through a systematic literature review and meta-analysis, we comprehensively examined 153 relevant studies in the field of carbon emission time series prediction, spanning from 1978 to 2024. This thorough analysis provides a solid foundation for future research, offering a comprehensive understanding of the field’s development.
Model performance analysis and application guide: Following a detailed comparison of multiple models, we present a recommendatory model guide for time series prediction. Clearly outlining the strengths and limitations of each method, we provide a practical guide for practitioners in the fields of statistics and machine learning, enabling informed decision-making among a myriad of prediction models.
Exploration of cutting-edge methods: Delving into both current and potential advanced models, we offer unprecedented insights into the field. This exploration not only establishes benchmarks and references for the proposal of new models but also elucidates the pros and cons of each method. This contributes to the advancement of time series prediction models at the forefront of research.
In the subsequent chapters of this paper, we will delve into the realm of time series forecasting. The second section, ‘Literature Review’ will meticulously explore the extensive and intricate landscape of research, aiming to uncover and elucidate the pivotal methods and profound insights that have shaped the field. Through a systematic and comprehensive review of the literature, we aim to present the key dynamics and primary trends in the current landscape of time series forecasting. The third section, “Summary”, will comprehensively summarize the key research findings from the literature review, highlighting the major advancements in the field of time series prediction and core insights into model performance evaluation. The fourth section, “Future Outlook”, primarily discusses upcoming trends and potential advancements in the field, offering insights into the future directions of time series prediction research.
2. Review on CO2 Emission Forecasting Models
Time series prediction is a key data analysis technique that forecasts numerical values at future time points by learning from past observed values. The process begins with data preprocessing to clean and prepare the raw time series data. Next, the data is divided into a training set and a test set, with the training set used for model training and the test set for evaluating the model’s performance. After training, the model makes predictions on the test set, and its performance is assessed using appropriate evaluation metrics. If the model performs well, it is selected as the final prediction model for forecasting future trends. The entire process emphasizes a systematic and organized approach, ensuring the chosen model performs well on historical data and possesses generalization capabilities, thus providing robust support for real-time decision-making. This methodology is widely applied across various fields, including energy, finance, meteorology, sales, and more.
In the process of delving into the literature on emission forecasting, we not only discovered a myriad of research methods but also recognized the meaningful impact of systematic classification. This systematic categorization not only aids in organizing the complex literature but also provides us with an organized framework, enabling a more in-depth exploration of the contributions and insights from different studies. Therefore, we have classified this literature into four major categories, each representing unique forecasting methods and research perspectives, constructing a more profound cognitive map.
This classification encompasses univariate time forecasting and multivariate time series forecasting, statistical models and machine learning models, annual emission predictions and daily carbon emission forecasts, as well as single prediction models and ensemble models (see
Figure 1). Through in-depth exploration of these categories, we aim to gain a profound understanding of the strengths and weaknesses of different forecasting methods, offering substantial guidance for future research and decision-making. Within this framework, time series forecasting not only becomes a key theme connecting various categories but also demonstrates its irreplaceable role in gaining deep insights into the future trends of
emissions.
2.1. Comparative Study of Univariate and Multivariate Models for Carbon Emission Prediction
2.1.1. Univariate Time Series Prediction
The univariate prediction model centers on modeling and forecasting using a single variable. In this model, the emphasis is on a single variable (such as historical carbon emissions), and through the analysis of its time series data, the goal is to capture trends, seasonal variations, and other influencing factors [
3]. The core of this model lies in the careful examination and understanding of patterns in historical data, providing a foundation for forecasting future changes. Univariate prediction models are typically suitable for scenarios where it is believed that a single variable can offer sufficient information to infer future trends.
Ref. [
4] introduced a novel grey multivariate model, which significantly outperformed traditional models, providing a reliable foundation for predicting
emissions in China. In contrast, ref. [
5] compared ARIMA, artificial neural network (ANN), and Holt-Winters models, finding that the ANN model performed best in forecasting
emissions in Gulf countries. Ref. [
6] utilized an artificial neural network model to model engine efficiency and emissions, demonstrating the effectiveness of the “black-box” modeling approach in predicting engine-related variables. Ref. [
7] designed a carbon emission prediction model for agroforestry ecosystems based on support vector regression, enhancing prediction accuracy. Ref. [
8] constructed a
emission prediction model for China’s transportation industry using support vector regression, providing a reference for future policies. Ref. [
9] proposed an expandable vehicle
emission prediction system based on OBD-II port data and RNN-LSTM model. Ref. [
10] introduced an LSTM model independent of exogenous variables, presenting emission reduction pathways for multiple countries. Ref. [
11] predicted carbon emissions from 30 provinces, regions, and cities in China using an LSTM-CNN combination model. Ref. [
12] introduced the KLS method, combining the Kalman filter, long short-term memory, and support vector machine, improving the accuracy of predicting carbon emissions in China for the next decade.
Based on the literature reviewed, univariate time series forecasting methods exhibit advantages such as intuitiveness, operational simplicity, and effective capture of historical trends and seasonal variations. The simplified data requirements and ease of implementation make it a reliable tool for short-term emission trend predictions, particularly suitable for relatively straightforward forecasting scenarios. However, univariate methods also present certain drawbacks, primarily manifested in the neglect of multiple influencing factors, limitations in addressing complex emission dynamics, and constraints in long-term predictions. Due to its sole consideration of a single variable, this method struggles to comprehensively capture the diverse influencing factors in complex environments and lacks precise predictive capabilities for future intricate changes. The application of univariate time series forecasting may encounter limitations in scenarios involving long-term predictions and the consideration of external factors in complex contexts.
2.1.2. Multivariate Time Series Prediction
Multivariate prediction models often refer to models with multiple input variables, which are typically factors related to carbon dioxide (
) emissions [
13]. In our in-depth exploration of multivariate time series prediction models, we have particularly focused on studies that integrate various factors influencing carbon emissions, including meteorological, economic, demographic, and energy-related information. To effectively address this challenge, researchers commonly employ a range of feature selection models such as STRIPAT, LMDI, RF, LASSO, and PCA models.
The selection process of these feature selection models aims to use advanced methods to carefully identify key factors closely associated with carbon emissions, thereby enhancing the accuracy of the prediction models. This approach not only contributes to a deeper understanding of the impact of various factors on emission changes but also efficiently handles a large number of input features, making the models more adaptable and efficient [
14]. By adopting these feature selection models, researchers can comprehensively consider the influence of multiple factors on carbon emissions, providing the models with more accurate and interpretable inputs. This ensures that the models are more operationally viable and practical in real-world applications.
STRIPAT Model
The Stochastic Impacts by Regression on Population, Affluence, and Technology (STIRPAT) model, a significant analytical framework, has become instrumental in predicting and understanding carbon dioxide (
) emissions across various contexts [
15]. Developed to explore the complex interplay of factors influencing emissions, the STIRPAT model has seen diverse applications and extensions in environmental research. In this review, we examine a series of studies that leverage and expand upon the STRIPAT model, providing valuable insights into the dynamics of
emissions.
The STIRPAT model has emerged as a pivotal tool for predicting and comprehending carbon dioxide (
) emissions across diverse contexts. Extending this exploration, ref. [
16] delved into carbon-related news and extended the STIRPAT model, shedding light on its positive impact on global carbon emissions and transfer. Broadening the geographical perspective, ref. [
17] employed panel data from 1990 to 2014, encompassing BRICS member countries. Their use of the STRIPAT model revealed a positive correlation between urbanization and
emissions, contributing insights into the intricate dynamics of urban development and environmental impact. Zooming into a city-specific analysis, ref. [
18] focused on Chengdu, utilizing the STIRPAT model to predict
emissions under different scenarios. Their findings emphasized the primary influences of energy consumption, population, and energy intensity on Chengdu’s
emissions. The integrated LSTM-STIRPAT method, introduced by [
19], found comprehensive application in predicting
emissions for 30 Chinese provinces, offering an in-depth analysis of the contributing factors. Ref. [
20] added to the understanding of
emissions in Chinese cities, leveraging comprehensive panel data from four major cities between 1990 and 2010. Their study, employing both econometric and extended STRIPAT models, illuminated the nuanced relationships between economic growth, urbanization, industrialization, service levels, technological advancements, and
emissions. Innovation in modeling approaches continued with [
21], who introduced the new STIRPART model, incorporating environmental technology, environmental taxes, and institutional frameworks. Their empirical results, focusing on the emerging E7 economies, showcased that these factors contribute to a reduction in carbon emissions. Lastly, ref. [
22] explored the relationships among high-tech industry, foreign direct investment (FDI), population, and carbon emissions in 30 Chinese provinces. Utilizing the STIRPAT-Durbin model, their study provided insights into the intricate interplay between industrial development, population dynamics, and environmental impact.
In summary, these studies collectively underscore the versatility and applicability of the STIRPAT model in diverse contexts, offering valuable insights into the factors shaping carbon emissions and guiding strategies for emissions reduction. While the STIRPAT model offers insights into emissions, its simplistic assumptions and its static nature limit accuracy in predicting complex scenarios and temporal dynamics. Users should be cautious of its drawbacks and consider complementary approaches for more nuanced predictions.
LMDI Model
The Logarithmic Mean Divisia Index (LMDI) model, a powerful analytical tool, has been extensively applied in regional studies to dissect carbon emissions and discern critical influencing factors [
23]. This model, renowned for its effectiveness in decomposing complex variables, has played a pivotal role in unraveling the intricacies of carbon dynamics in various contexts. The LMDI model, with its unique capability, has found significant applications in the field of carbon emissions, contributing to a profound understanding of the sources, trends, and contributions of various factors in the carbon emission process.
In the examination of industrial energy consumption in Hunan Province, ref. [
24] utilized the LMDI model, revealing a notable upswing in carbon emissions primarily attributed to heightened coal consumption. The study by [
25] in Chongqing showcased the LMDI model’s utility in identifying economic growth as the predominant driver of per capita carbon emissions. Ref. [
26] investigated Dalian’s industrial carbon emissions, with the LMDI model shedding light on the pivotal roles played by output scale and energy intensity. Ref. [
27] applied the LMDI model to unravel the multifaceted factors influencing carbon emissions in the Beijing-Tianjin-Hebei region, showcasing the model’s ability to disentangle the complex web of population dynamics, economic growth, industrial structure, and energy intensity. Ref. [
28] conducted an extensive analysis of China’s three major economic regions, emphasizing the significance of economic development and energy efficiency in per capita carbon emissions growth. In the study of northeastern provinces, ref. [
29] employed the LMDI model to identify the population, economic development, and industrialization rate as driving factors for increasing industrial carbon emissions, while energy efficiency emerged as the primary factor for reductions. Ref. [
30] delved into the electricity industry in China, with the LMDI decomposition method revealing economic growth as the main driving force behind carbon emissions.
Through a literature review, we have learned about the versatility of the LMDI model in unraveling the intricate web of variables impacting carbon emissions across diverse regions and sectors. However, it is essential to note that the model comes with inherent limitations. One of its drawbacks is its sensitivity to initial assumptions and data quality. Additionally, the model’s application may be constrained in situations where accurate data is scarce or subject to significant uncertainty. Despite these limitations, the LMDI model remains a valuable tool for gaining nuanced insights into the driving forces behind carbon emissions in various contexts.
RF Model
The Random Forest (RF) model excels in feature selection. By constructing multiple decision trees and aggregating their results, RF can assess the relative importance of each feature in the model [
31]. This makes the RF model a powerful tool for feature selection, helping identify the features that have the greatest impact on model performance. In handling high-dimensional data and optimizing model inputs, the RF model’s feature selection capability provides an effective and reliable solution for machine learning tasks.
The integration of the RF machine learning model into carbon emissions research has proven instrumental, particularly in the context of feature selection for predictive modeling. Ref. [
32] initiated this trend by effectively employing the RF model to scrutinize the multifaceted relationship between carbon emissions and various factors in Chinese cities, highlighting the RF model’s utility in studying urban emissions trends and regional variations. Expanding the scope, ref. [
33] demonstrated the efficacy of the RF model in feature selection for assessing carbon dioxide emissions in slurry shield tunneling, emphasizing the model’s accuracy in predicting emissions and comparing favorably with other machine learning models. Ref. [
34] further accentuated the RF model’s versatility by employing it for identifying crucial influencing factors, emphasizing economic indicators, and showcasing its effectiveness for feature selection. On a national scale, ref. [
35] employed a RF model for feature selection to identify key factors influencing carbon intensity in China. Ref. [
36] assessed the feasibility of achieving China’s emission intensity reduction commitment, with the RF model playing a pivotal role in selecting crucial influencing factors. In urban contexts, ref. [
37] showcased the RF model’s capacity for feature selection by integrating it with nighttime light datasets, revealing correlations between urban
emissions and socio-economic factors. Ref. [
38] extended the RF model’s versatility by employing it to identify significant factors impacting
emissions, with a focus on building structure. In the industrial sector, ref. [
39] applied RF model for feature selection, emphasizing its role in accurately predicting carbon emissions from industrial sources and reducing noise in input variables.
In summary, the collective findings emphasize the pivotal role of the RF model in feature selection, particularly in identifying influential factors for predicting carbon emissions. From urban settings to specialized domains like tunneling and industrial emissions, the RF model not only enhances our understanding of complex emission patterns but also serves as a crucial tool for selecting input variables in future predictive models. This underscores the RF model’s potential as a valuable asset for advancing carbon emissions research and informing sustainable practices. One drawback of the RF model in feature selection is its less-than-ideal handling of highly correlated features, which may lead to an overestimation of the importance of redundant features.
LASSO Model
The Least Absolute Shrinkage and Selection Operator (LASSO) model is a feature selection and parameter shrinkage technique applied in linear regression [
40]. By employing L1 regularization on the model coefficients, the LASSO model can shrink some coefficients to zero, achieving compression of irrelevant or unimportant features and simplifying the model. In the context of handling high-dimensional data and performing variable selection, the compression capability of the LASSO model makes it a commonly used tool, contributing to improved generalization performance and interpretability of the model.
The application of the LASSO model regression model for feature selection in carbon emissions research has become a prominent theme, offering insights into key influencing factors for subsequent predictive modeling. Ref. [
41] utilized machine learning and deep neural networks to explore future transportation carbon emissions, employing LASSO model regression to identify pivotal factors. Concurrently, ref. [
42] focused on corporate carbon emissions, employing the LASSO model regression model and a fixed effects model to highlight the significant role of financial-level factors in different carbon contexts. Ref. [
43] delved into the relative importance of carbon emission drivers in China, conducting a literature review to identify predominant independent variables. The LASSO model was then applied to rank the relative importance among these variables, revealing that economic growth and energy consumption are primary drivers, followed by population size and industrialization. Ref. [
44] centered their study on Guangdong Province’s carbon reduction goals, utilizing LASSO model regression to determine key factors, including population size, economic development level, energy intensity, and technological factors. Meanwhile, ref. [
45] focused on household carbon emissions in China, utilizing a LASSO model regression model to identify influential factors such as fuel type, dwelling type, income, urban or rural residency, and fuel type. Additionally, ref. [
46] focused specifically on carbon emission prediction, leveraging the LASSO model for feature selection and identifying significant factors like coal consumption, oil consumption, plate glass, pig iron, and crude steel production.
In summary, these studies collectively underscore the recurrent application of LASSO model regression in feature selection, emphasizing its practicality in identifying crucial variables for predicting carbon emissions. Whether applied to transportation, corporate, or household emissions, the systematic use of the LASSO model as a feature selection tool reflects its significance in shaping subsequent predictive models, providing a logical and methodologically consistent approach across diverse carbon emission contexts. However, it’s important to note that the LASSO model has its limitations. One key drawback is its inclination to randomly select one among highly correlated features, disregarding other highly correlated features. This may lead to instability in the model’s selection of true underlying features. Therefore, researchers should exercise caution in considering the correlation structure of the data and the potential introduction of uncertainty in model selection when utilizing the LASSO model for feature selection.
PCA Model
The Principal Component Analysis (PCA) model is a linear transformation method used for feature selection and data dimensionality reduction. It achieves this by transforming original features into a set of linearly independent principal components to reduce data dimensionality. In the context of feature selection, the PCA model captures crucial feature information by mapping data into the space of principal components. Selecting a specific number of principal components to retain enables effective reduction of data dimensions, extraction of key features, reduction of model complexity, and enhancement of model generalization performance [
47].
The application of the PCA model in carbon emissions research is a prevalent and systematic trend, demonstrated across various studies. Beginning with [
48], who used the PCA model alongside the Long Short-Term Memory (LSTM) model to establish a predictive model for carbon emissions in China, the effectiveness of dimensionality reduction became evident. Ref. [
49] delved into agricultural carbon emissions in Hunan Province, leveraging the PCA model to unveil primary influencing factors such as urbanization rate and nitrogen fertilization. Extending this, ref. [
50] applied PCA model and multivariate linear regression, highlighting the pivotal impact of factors like energy consumption scale, GDP, and population on carbon emissions. Ref. [
51] expanded the dimensionality reduction approach, combining bivariate correlation analysis and PCA model to identify 24 influencing factors. Incorporating hybrid models, ref. [
52] introduced a PCA-RELM combination for predicting carbon dioxide emissions, emphasizing the PCA model’s contribution to reducing the dimensionality of influencing factors. Similarly, ref. [
53] focused on a cogeneration enterprise, combining random forest and extreme learning machines with a PCA model to refine predictions. In the context of global impact, ref. [
54] utilized LSTM with the PCA model, highlighting the PCA model’s role in identifying influential factors like energy consumption, financial development, GDP, population, and renewable energy. Moving beyond, ref. [
55] integrated grey relational analysis with the PCA model, revealing economic growth as the primary driver of carbon emissions in Hebei Province. Ref. [
56] extended this approach to Shanxi Province, utilizing a grey relational model with a PCA model to identify key influencing factors. Exploring machine learning applications, ref. [
57] employed Random Forest, XGBoost, and AdaBoost alongside PCA to model the impact of urbanization and energy intensity on carbon emissions. Concluding the series, ref. [
58] utilized an extended STIRPAT model with PCA, emphasizing the PCA model’s role in refining predictions and identifying significant factors in the Yangtze River Economic Belt.
Collectively, these studies demonstrate a consistent and methodologically sound approach, where the PCA model serves as a robust tool for feature selection, systematically shaping subsequent predictive models and contributing to our understanding of diverse carbon emission contexts. PCA model proves instrumental in carbon emissions research by reducing data dimensionality and enhancing interpretability. While offering benefits like noise reduction, researchers must be cautious of its assumptions, including linearity and sensitivity to outliers.
The multivariate carbon emission forecasting method demonstrates significant advantages, enhancing the comprehensiveness and accuracy of the model. By integrating various relevant factors, such as meteorological, economic, demographic, and energy-related information, this approach aligns more closely with real-world conditions, enabling the model to capture the multifaceted, dynamic changes in carbon emissions more accurately. Advanced feature selection models contribute positively to optimizing model inputs, improving predictive accuracy, and enabling researchers to precisely choose factors closely correlated with emissions. However, this method also faces challenges, including the complexity of the feature selection process, increased computational complexity, and the intricacies of data integration. In practical applications, careful consideration of these pros and cons is necessary to choose the most suitable method for a specific research context. We have summarized common factors influencing carbon emissions in the literature, as shown in
Table 1.
2.2. Comparative Analysis of Statistical and Machine Learning Models in Carbon Emission Prediction
2.2.1. Statistical Models
Statistical prediction models encompass the literature that employs traditional statistical methods for modeling and forecasting. These models rely on in-depth analysis of historical data and utilize a range of common statistical techniques such as Holt-Winters, grey forecasting model (GM), Moving Average (MA), AutoRegressive Integrated Moving Average (ARIMA), Seasonal AutoRegressive Integrated Moving Average with eXogenous factors (SARIMAX), and others. By mathematically modeling relationships between variables, the objective of these statistical models is to reveal patterns and trends in emissions. Grounded in classical statistical theory, they provide a relatively explanatory analysis of historical data, offering a reliable foundation for forecasting future emission trends.
Grey Model
The Grey Model (GM) is a modeling and forecasting method suitable for time series data and is particularly adept at handling limited data and incomplete information [
59]. It involves grey transformation, converting the original data sequence into a grey accumulated generation sequence, and establishing a mathematical model to describe its developmental trend.
This model is particularly advantageous in predicting carbon emissions. Ref. [
60] employs a non-linear grey multivariable model, showcasing its effectiveness in capturing nuanced effects, such as GDP’s impact on carbon emissions. This innovation enhances accuracy, providing a robust foundation for energy planning and environmental policymaking in China. Contributing to forecasting precision, ref. [
61] develop an adaptive grey model with a buffered rolling method, offering valuable insights for emission mitigation based on factor analysis. Ref. [
62] demonstrates the effectiveness of grey prediction models in dynamic relationships for pollutant emissions, energy consumption, and output in Brazil, showcasing excellent forecasting performance. Ref. [
63] introduces a novel multivariable grey model with time-varying parameters, surpassing traditional models in simulating and predicting carbon emissions for Anhui Province. In addressing the limitations of traditional grey models, ref. [
64] incorporate a two-stage background value calculation method and spatial weight matrix, improving forecasting precision for carbon emissions. Ref. [
65] innovate with a four-parameter grey Verhulst model, displaying superior structural adaptability in predicting China’s carbon dioxide emissions. Ref. [
66] focuses on short-term carbon emission prediction, employing an enhanced grey model to forecast emissions for 30 Chinese provinces, aligning with natural development trends and predicting China’s carbon peak in 2032.
While the grey model has found significant application in the field of carbon emissions prediction due to its flexibility and adaptability, it excels in handling systems with incomplete information and high uncertainty, effectively addressing complex scenarios and providing reliable references for forecasting. In some studies, the model has demonstrated advantages in capturing trends and patterns in emission changes. However, it is essential to note that the model’s performance heavily depends on the quality and representativeness of input data. Assumptions of uniform background values and linearity may oversimplify complex systems, potentially leading to inaccuracies in forecasting outcomes.
ARIMA and SARIMAX Model
The ARIMA (AutoRegressive Integrated Moving Average) and SARIMAX (Seasonal AutoRegressive Integrated Moving Average with eXogenous factors) models are commonly used statistical models for time series analysis and prediction [
67]. The ARIMA model is a method that transforms time series data into a stationary sequence by combining auto-regressive (AR) and moving average (MA) components to capture the autocorrelation and moving average structure in the sequence. The core idea of the ARIMA model is to differentiate the original time series to achieve stationarity and then apply a combination of auto-regression and moving average modeling. The SARIMAX model extends the ARIMA model by considering seasonal factors and exogenous variables. Seasonal factors represent periodic patterns in the data, while exogenous variables are external factors that may influence the time series. By introducing the concepts of seasonality and exogenous variables, SARIMAX more comprehensively accounts for the structure of the time series, providing greater flexibility and adaptability to the model.
The ARIMA and SARIMAX models are widely used in time series analysis, particularly in predicting carbon dioxide (
) emissions. Ref. [
68] applies the ARIMA model to forecast a steady increase in
emissions in South Africa over the next decade based on annual time series data from 1980 to 2016. This emphasizes the urgency for proactive environmental policies to address the consequences of rising emissions in the country. Ref. [
69] contributes to the field by employing the ARIMA model to analyze carbon emissions data from four representative provinces and cities in China. The findings offer valuable guidance for decision-makers in setting emission reduction targets and implementing appropriate measures based on the modeling results obtained using Eviews software 12. Ref. [
70] utilizes forecasting methods, including the ARIMA model, to project China’s carbon emissions. Despite an anticipated emission peak in 2021, the study suggests that the country may fall short of its emission reduction targets by 2030. This highlights the importance of reevaluating and adjusting strategies to align with governmental goals. In a different context, ref. [
71] discuss the selection of the most suitable Carbon Capture, Utilization, and Storage (CCUS) site in Turkey. Employing methodologies like DEMATEL, unweighted grey relational analysis, and DEMATEL-based GRA methods, the study identifies the Aksaray region as the most suitable CCUS area.
Based on the literature reviewed, we find that the advantages of ARIMA and SARIMAX models lie in their simplicity and intuitiveness, making them easy to understand and implement. They perform well in handling stationary and linear time series data, capable of capturing trends and seasonal variations providing reasonable predictions for future trends under appropriate conditions. However, these models also have limitations, including relatively weak handling of non-linear and non-stationary data, as well as limited ability to capture sudden changes or complex patterns. When selecting models, careful consideration of the nature of the data and the applicability of the models is necessary.
To summarize the above content, statistical models exhibit various advantages in forecasting, including strong interpretability, robustness, theoretical foundations, and convenient parameter interpretation. Built upon classical statistical theory, they can relatively reliably handle historical data and provide intuitive interpretations of variable relationships. However, statistical models have limitations such as dependence on linear assumptions, sensitivity to data distribution, reliance on historical data, and challenges in modeling complex relationships and nonlinear problems. Therefore, when dealing with complex, nonlinear, or rapidly changing issues, other more flexible modeling approaches, like machine learning models, may offer advantages.
2.2.2. Machine Learning Models
Machine learning prediction models represent the literature that utilizes modern computer algorithms and data patterns for forecasting. This category of models employs various machine learning models, including decision trees, support vector machines, neural networks, etc., to handle complex datasets and capture nonlinear relationships in emissions dynamics more flexibly [
72]. These models are capable of adapting to large-scale and high-dimensional data, providing more accurate predictions by learning patterns and trends within the data. The robust performance of machine learning models grants them unique advantages in handling real-world complex data and unknown factors.
ANN Model
The Artificial Neural Network (ANN) model is a flexible and powerful machine learning approach inspired by the structure and function of the biological neural system. It consists of multiple layers of neurons, including the input layer, hidden layers, and output layer. Each neuron automatically adjusts its weights through a learning process to adapt to patterns and relationships in input data. The ANN model is capable of handling nonlinear problems, exhibiting strong adaptability and learning capabilities [
73]. In the context of carbon emissions prediction, the ANN model can capture complex emission dynamics, providing advantages in handling large datasets and improving predictive performance.
ANN models have emerged as a powerful tool for predicting and modeling
emissions across various contexts. Ref. [
74] utilized the enhanced effectiveness of the ANN model through a hybrid Cuckoo Search algorithm and accelerated particle swarm optimization to predict OPEC CO
2 emissions, showcasing the versatility of this approach. In a Turkish context, ref. [
75] employed machine learning methods, ranking the ANN model as the most successful among support vector machines and decision trees, to estimate
emissions based on diverse factors. The study underscores the effectiveness of the ANN model in capturing the complex relationships within a multifaceted dataset. Ref. [
76] focused on
emission expenditure prediction using a backpropagation ANN model, demonstrating excellent performance during training. This emphasizes the capability of the ANN model to handle intricate input variables and predict outcomes accurately. Moving to the transportation sector, ref. [
77] compared various methods, including ANN, for predicting
emissions, with the ANN model outperforming other techniques. The study highlights the superior performance of the ANN model in capturing the nuances of transportation-related emissions. Ref. [
78] conducted real-time monitoring and modeling of vehicle emissions in India using ANN model technology. The study revealed significant variations in emissions under different driving modes, showcasing the adaptability of ANN models to dynamic scenarios. Ref. [
79] employed the ANN model to predict the performance and emission characteristics of a diesel engine using biodiesel blends, demonstrating the applicability of the ANN model in modeling complex interactions within engine systems.
In summary, the ANN model proves effective in predicting emissions across diverse scenarios, capturing intricate relationships in complex datasets. However, it’s essential to acknowledge their limitations, including the need for substantial training data, susceptibility to overfitting, and the challenge of interpreting internal processes, highlighting the importance of careful model selection and interpretation in carbon emissions modeling.
SVR Model
Support Vector Regression (SVR) model is a machine learning method used for prediction and modeling. Unlike traditional linear regression methods, the SVR model excels in handling nonlinear relationships [
80]. It achieves this by mapping input data into a high-dimensional space and establishing a regression model using support vectors. The primary goal of the SVR model is to find an optimal hyperplane that maximizes prediction accuracy while allowing for some error within a tolerance range. This makes the SVR model particularly effective in dealing with datasets that exhibit complex structures and nonlinear relationships.
The SVR model, as a powerful machine learning model, has emerged as a key tool for predicting carbon emissions due to its capacity to discern intricate patterns within datasets. In the realm of emissions forecasting, recent studies have showcased the versatility and effectiveness of the SVR model. Ref. [
81] leveraged the SVR model to compare and predict greenhouse gas emissions in Turkey, revealing its advantageous estimation method with a keen ability to capture intricate details. Building on this, ref. [
82] optimized SVR model parameters through Particle Swarm Optimization, achieving outstanding performance in multi-criteria evaluation. Ref. [
83] underscored the SVR model’s advantages in carbon emission prediction, presenting a model that projects future emissions based on historical data. Moving to regional applications, ref. [
84] proposed an SVR prediction model trained with a Long Short-Term Memory neural network (LSTM), demonstrating its accuracy in predicting emissions in the Yangtze River Economic Belt. Meanwhile, ref. [
85] utilized the SVR model to establish relationships in a spark-ignition engine’s operational parameters, showcasing its predictive accuracy. Extending beyond traditional predictions, ref. [
86] incorporated SVR into a hybrid model for predicting vehicular emissions, achieving an impressive accuracy of 80.6% in validation. In another application, ref. [
87] applied the SVR model to analyze
emissions in Chongqing, offering valuable support for low-carbon goals in urban areas.
In conclusion, the SVR model stands out as a versatile and effective tool in various scenarios related to carbon emission prediction, demonstrating prowess in navigating complex datasets and delivering accurate forecasts. However, it’s crucial to recognize that SVR, like any model, has both advantages and disadvantages. While the SVR model exhibits high predictive accuracy and flexibility, its performance heavily relies on appropriate parameter tuning and may face challenges with large datasets.
RF Model
The Random Forest (RF) model is a powerful machine-learning algorithm widely used for regression tasks. It belongs to the ensemble learning category, where multiple individual models, known as decision trees, are combined to form a robust and accurate predictive model [
88]. In the context of regression, the RF model aggregates the predictions of multiple decision trees to provide a more reliable and precise output. RF model stands as a robust machine learning model widely employed for predicting and understanding complex phenomena, including carbon dioxide emissions. In the following studies, the RF model is showcased as a versatile tool, offering valuable insights into carbon emission trends and contributing factors.
Ref. [
89] adopts the sliding window method, transforming time-series data into a supervised learning problem. Through validation with various shallow learning models, they identify the combined model of RF and LASSO as the most effective in predicting China’s
emissions. Ref. [
90] proposes a hybrid model that synergizes random forest and extreme learning machines, demonstrating enhanced accuracy in predicting the trends of carbon dioxide emissions. In a scenario-specific context, ref. [
91] utilize random forest and back propagation neural network models to assess key variables, concluding that China can achieve carbon peaking on schedule under the 14th Five-Year Plan. Ref. [
92] utilizes the RF model to uncover issues related to urban carbon emissions, highlighting its significance in forecasting societal, economic, environmental, and climatic impacts. Expanding the scope to environmental impact assessment, ref. [
93] employ a predictive method based on random forest to estimate the environmental impact of the construction stage in the building lifecycle, emphasizing its utility in forecasting construction-stage carbon emissions at the early design phase. Ref. [
94] contribute by establishing a
emission prediction platform using a random forest model and urban governance element data, revealing the crucial influences of different elements on
emissions in various sectors.
In conclusion, the RF model emerges as a versatile and effective tool in various domains, showcasing its prowess in predicting carbon emissions and offering valuable insights for policy formulation and environmental planning. Its ability to handle diverse datasets and provide interpretable results positions RF as a valuable asset. However, it’s crucial to acknowledge that RF, like any model, has its limitations, including potential overfitting and sensitivity to hyperparameter tuning.
LSTM Model
The Long Short-Term Memory (LSTM) model is an improved version of Recurrent Neural Networks (RNN) designed specifically for handling and predicting time series data [
95]. In contrast to traditional RNNs, the LSTM model possesses powerful memory and learning capabilities. Through mechanisms like forgetting gates, input gates, and output gates, it can more effectively capture long-term dependencies in sequences. LSTM model excels in time series prediction, particularly in handling long sequences and data with strong temporal dependencies, making it highly successful in applications such as carbon emission forecasting. In the following studies, the LSTM model is applied innovatively to enhance the accuracy of carbon emission predictions.
In recent studies focusing on carbon emission prediction, the LSTM model has emerged as a pivotal tool due to their adeptness in handling spatiotemporal data and addressing recurrent neural network challenges. Ref. [
96] set the stage by introducing a novel deep learning approach, employing the LSTM model to accurately predict vessel trajectories and carbon dioxide emissions. Building on this, ref. [
97] optimize the LSTM model using the Sparrow Search Algorithm to analyze and forecast inter-provincial differences in carbon emissions in the Yellow River Basin, revealing an upward trajectory. Ref. [
98] contributes further by proposing an innovative model that combines oscillatory particle swarm optimization with the LSTM model, effectively addressing overfitting issues and achieving superior accuracy in carbon emission predictions. However, ref. [
99] present a nuanced perspective, exploring the limitations of various methods, including BP neural networks and recurrent neural networks, indicating their constrained effectiveness in predicting long sequences. Ref. [
100] cap off the discussion by emphasizing the urgency of emission reduction measures, particularly in the next decade and notably in China and India, using a
emission prediction model based on Bi-LSTM.
Through the aforementioned literature, the LSTM model demonstrates significant advantages in predicting carbon emissions, particularly in handling complex spatiotemporal dynamics. Its unique mechanism for capturing long-term dependencies and its design to adapt to time series contributes to a better understanding and prediction of data with strong temporal and dynamic complexities. However, it is essential to note that the LSTM model comes with certain challenges, including higher computational intensity, sensitivity to hyperparameters, and potential risks of overfitting.
XGboost Model
eXtreme Gradient Boosting (XGBoost) model is widely recognized for its applicability in time series forecasting, leveraging its ensemble learning capabilities to model sequential data patterns effectively [
101]. In the context of time series prediction, XGBoost model demonstrates robust performance by capturing temporal dependencies and trends in the data. Its ability to handle sequential information, coupled with the advantages of boosting methods, makes it suitable for forecasting tasks where past observations significantly influence future outcomes.
XGBoost, a powerful and scalable machine learning model, has been prominently featured in recent studies focusing on carbon emission prediction. Ref. [
102] introduced a novel ensemble learning model, BO-XGBoost, which combines Bayesian optimization with extreme gradient boosting. This innovative approach demonstrated superior predictive performance, exhibiting at least a 40% reduction in root mean square error (RMSE) when applied to forecast carbon emissions during the design phase of residential buildings in Chengdu. Building on this momentum, ref. [
103] utilized the XGBoost model to analyze extensive data from major Chinese megacities spanning over 15 years. Their findings underscored the model’s applicability and accuracy, particularly in predicting carbon emissions for rapidly expanding urban areas. In a distinct application, ref. [
104] employed ensemble learning models, including CatBoost, XGBoost, RF, and LightGBM, to predict engine carbon dioxide emissions. Among these models, CatBoost stood out as the most effective, emphasizing the robust performance of XGBoost within ensemble frameworks. Ref. [
105] contributed to this narrative by using machine learning methods, with the XGBoost model demonstrating superior performance in estimating and predicting
emissions across various cities in China. Collectively, these studies highlight XGBoost model’s versatility and effectiveness in diverse scenarios, showcasing its capability to outperform other models in terms of accuracy and efficiency.
However, it is essential to note potential limitations associated with XGBoost. The model’s computational complexity and the need for careful parameter tuning may pose challenges. Nonetheless, its widespread use and consistent success across different studies reaffirm XGBoost model’s position as a valuable tool in carbon emission prediction models.
CNN Model
The Convolutional Neural Networks (CNNs) model has shown significant potential in the field of carbon emission prediction and has become a focal point in current research as a deep learning model [
106]. As a deep learning model specialized in processing and analyzing visual data, the CNN model is renowned for its outstanding feature extraction capabilities, particularly suitable for handling complex spatiotemporal relationships in carbon emission data. Recent studies indicate a growing adoption of CNN models in carbon emission prediction, laying a solid foundation for the application of deep learning methods in this domain.
In exploring carbon emission prediction methodologies, ref. [
107] innovatively proposed a real-time operational model utilizing CNN, specifically tailored for the early design phase of residential units. The validation phase underscored its remarkable real-time predictive performance. Expanding on this progress, ref. [
108] introduced a deep learning system, the BFA-CNN model, which not only leveraged a novel optimization algorithm but also demonstrated impressive accuracy and reliability across three distinct carbon markets. Transitioning to urban contexts, ref. [
109] presented the BiLSTM-CNN-GAN model, seamlessly integrating BiLSTM, CNN, and GAN components to enhance predictions related to energy consumption and carbon emission trends in resource-based cities. In a parallel vein, ref. [
110] delved into the complexities of carbon emission prediction by identifying 29 influencing factors using a random forest regression model. Their subsequent development, the CNN-LSTM model, showcased superior goodness of fit in predicting China’s carbon emissions. Notably, ref. [
111] contributed to the landscape with the introduction of the MHA-CNN model, achieving precise multi-objective predictions for 4 CEPIs through the incorporation of 8 influencing variables. This model outperformed both CNN and LSTM counterparts, marking a significant stride in the domain of carbon emission prediction.
In summary, these studies collectively showcase the outstanding performance of CNN models in carbon emission prediction, particularly adept at capturing spatiotemporal relationships. However, CNN models may have substantial data requirements and demand high computational resources. In practical applications, a comprehensive consideration of model performance and computational costs is necessary.
Based on the above-mentioned literature, machine learning models have significant advantages and some challenges in the field of prediction. Their strengths include the flexible capture of complex, nonlinear relationships, adaptation to large-scale and high-dimensional datasets, and achieving more accurate predictions by learning patterns and trends within the data. Machine learning models can handle real-world complex data and unknown factors, providing more comprehensive information for decision-making. However, these models also face challenges, such as the need for substantial amounts of data, sensitivity to hyper-parameters, the black-box nature (difficulty in interpreting the model’s decision-making process), and the requirement for substantial computational resources. When selecting a model, it is crucial to balance these advantages and challenges to ensure that the chosen model aligns with the specific requirements of the prediction task.
2.3. Comparison of Annual and Daily Carbon Emission Forecasting Models
2.3.1. Annual Forest Model
Annual emission forecasting is a method for estimating future carbon dioxide emissions for a specific upcoming year. By analyzing historical annual emission data, considering various potential influencing factors, and applying appropriate forecasting models, annual emission forecasting aims to provide a profound understanding of future trends in emissions for a given year [
112]. This approach is crucial for climate change research, environmental policy formulation, and sustainable development planning, offering valuable insights into the trajectory of emissions for specific future years.
Exploring the dynamic landscape of annual carbon emissions predictions, ref. [
113] presented an integrated model incorporating Extreme Learning Machine, Aquila optimizer, and Elastic Net regression, projecting China’s emissions to peak at 11,441 Mt
in 2029. Beyond the peak, the study envisions achieving net-zero emissions through continued emission reduction efforts and the augmentation of forest carbon sinks. Addressing the broader context of global warming. Additionally, ref. [
114] projected a peak in China’s carbon emissions around 2030, employing STIRPAT, ridge regression, and GA-LSTM models. Their emphasis on technological advancements underscores the necessity of targeted interventions in energy, industry, and technology for effective emission reduction. Ref. [
115] delved into a detailed analysis of carbon emissions from major energy sources in the Beijing-Tianjin-Hebei region, utilizing the SVM-ELM model for energy consumption forecasts from 2017 to 2030. Collectively, these studies contribute to a nuanced understanding of annual carbon emissions predictions, reflecting the evolving strategies and insights shaping the trajectory of emission reduction efforts.
Annual emission forecasting plays a crucial role in environmental management and policy formulation by estimating carbon emissions trends for specific future years, providing valuable insights for decision-makers. Its operational simplicity, utility in policy planning, and support for climate change research make it a common choice for both research and practical applications. However, this method is constrained by limitations in temporal and spatial accuracy, potentially struggling to capture short-term and spatial emission variations. Additionally, challenges arise in addressing future uncertainty due to insufficient consideration of unforeseen events and sensitivity to external factors. Consequently, in practical applications, a careful balance of its strengths and limitations is required, and it may benefit from integration with other methods offering more detailed temporal and spatial resolutions for comprehensive predictions.
2.3.2. Daily Forest Model
Daily carbon emission forecasting is a method focused on estimating carbon emissions for specific future dates. This approach relies on comprehensive data analysis, including a detailed examination of historical daily emission data, consideration of various potential influencing factors, and the application of appropriate forecasting models. Through this method, we can gain a more comprehensive understanding of future daily emission trends. It is noteworthy that the official website
http://carbonmonitor.org provides (accessed on 20 November 2023) valuable daily carbon emission data, offering crucial data support for forecasting models and enhancing their practical utility.
Exploring the realm of daily carbon emission forecasting, ref. [
116] innovatively present a novel model merging ICEEMDAN, PACF-ReliefF feature selection, and ISSA-ELM prediction, showcasing heightened accuracy. Their proposed model not only outperforms existing methods but also furnishes valuable insights for shaping carbon emission reduction policies and informing future predictions. Complementing this, ref. [
117] contribute a hybrid daily carbon emission prediction model that intertwines CEEMD, WD, and LSTM. Exhibiting superior performance, this model excels in predicting global carbon emissions, marked by enhanced accuracy achieved through secondary decomposition. Moving forward, ref. [
118] propose an ensemble framework tailored for precise daily carbon dioxide emissions prediction, leveraging a signal decomposition–reconstruction model. Rigorously tested on real-world data from 14 regions, their model demonstrates robust performance, particularly addressing challenges in predicting both industrial and ground transport emissions. Shifting the focus to China, ref. [
119] systematically evaluate six daily
emission prediction models, encompassing both statistical (GM(1,1), ARIMA, SARIMAX) and machine learning (ANN, RF, LSTM) approaches. The consistently favorable results for machine learning models, with LSTM emerging as the most effective, underline the potency of these methodologies in advancing daily carbon emission predictions. Collectively, these studies significantly contribute to the field of daily carbon emission forecasting, offering innovative models, superior performance, and valuable insights for policy-making and future projections.
Currently, there is relatively limited literature on daily carbon emission forecasting, placing in-depth research and application of this method in its early stages. Despite challenges related to insufficient exploration of influencing factors in this field, the real-time nature of daily carbon emission forecasting underscores its greater practical value. This approach offers more timely and accurate insights into carbon emission trends, facilitating the prompt formulation of environmental policies and the implementation of effective emission reduction measures. As daily carbon emission data continues to be updated and accumulated, it is anticipated that future research will delve deeper into exploring the advantages of real-time forecasting and addressing associated challenges.
2.4. Comparison Between Single and Ensemble Models in Carbon Emission Prediction
2.4.1. Single Model
A single time series prediction model typically refers to the use of a specific statistical or machine learning method, as opposed to ensemble methods that combine multiple models. Such a model independently models and predicts the time series without considering the influence of other models.
Addressing the multifaceted challenge of predicting
emissions, these studies delve into diverse approaches to forecast future emissions. Ref. [
120] concentrates on India, employing an array of models, including ARIMA, SARIMAX, Holt-Winters, linear regression, random forest, and LSTM, to predict emissions for the next decade. Their performance analysis concludes that the LSTM model stands out as the most accurate for
emission prediction in the Indian context. Meanwhile, ref. [
121] explores the dynamics of
emissions, energy consumption, and economic growth in East Asian countries using dynamic panel data and artificial neural network models. The study identifies bidirectional causality among these variables and suggests the suitability of artificial neural network models for future predictions in the region. Shifting the focus to Turkey, ref. [
122] introduce a grey prediction model to forecast energy-related
emissions, providing valuable insights for shaping the country’s energy policy and meeting international climate change mitigation agreements. Finally, ref. [
123] employ a new-structure multivariable grey model to define, optimize, and predict carbon dioxide emissions data in China, achieving a remarkable outcome with a comprehensive error of only 0.085%.
Using a single model for carbon emission prediction comes with clear advantages and disadvantages. The strength of this approach lies in its simplicity, operational convenience, and relatively efficient computational performance. However, its limitation is evident in the potential inability to capture complex dynamics and relationships in carbon emissions, especially when the data exhibits variability and non-linear features. Additionally, the generalization ability of a single model may be restricted, as it struggles to adapt to various backgrounds and scenarios while also posing a risk of overfitting, particularly when the model is trained on a specific dataset.
2.4.2. Ensemble Model
An ensemble model is an approach that combines multiple base models to enhance overall performance (See
Figure 2). In carbon emission prediction, ensemble models integrate various individual models, leveraging their respective strengths to achieve more accurate and robust predictions. This method combines the predictions from multiple models, often using techniques such as voting, averaging, or other strategies to achieve improved overall performance. Ensemble models are typically capable of demonstrating stronger predictive abilities when dealing with different types of data and complex relationships, playing a crucial role in enhancing model generalization and adaptability.
Navigating the landscape of integrated models for time series forecasting, ref. [
124] lay the foundation with a hybrid approach combining random forest and extreme learning machines, showcasing its potential for improved accuracy in predicting carbon dioxide emissions. This innovative methodology sparks interest in exploring diverse applications and regions. Expanding the scope to the U.S., ref. [
125] adopts a hybrid model, incorporating ANN and Vector Autoregressive (VAR) estimator, surpassing traditional autoregressive methods. The study paves the way for cross-regional comparisons and highlights the adaptability of integrated models. Addressing environmental concerns, ref. [
126] dive into predicting vehicle
emissions using LSTM and BiLSTM models, emphasizing the significance of precise decision-support tools for environmental policy formulation. This environmental-centric perspective encourages a broader examination of AI’s role in sustainability.
Ref. [
127] introduces LG-SVR, a local grey support vector regression, enhancing computing speed and prediction accuracy. The study emphasizes the importance of tailoring models to specific forecasting needs, opening avenues for fine-tuned applications in financial time series.
Exploring seasonal peak load forecasting, ref. [
128] propose ARIMA-Hybrid models incorporating meteorological indices, indicating improved performance. This approach prompts a consideration of contextual factors in forecasting, setting the stage for a deeper exploration of hybrid models in nuanced scenarios. Ref. [
129] contributes a two-stage forecast procedure for China’s
emissions, showcasing the consistent superiority of SVR-ANN. The study emphasizes the significance of multi-stage approaches, hinting at the potential for enhanced accuracy through sequential modeling. Ref. [
130] enhances carbon emission prediction accuracy through a combination model, showcasing the benefits of preprocessing and data optimization. This prompts a closer examination of preprocessing techniques’ impact on the performance of integrated models.
Transitioning to regional considerations, ref. [
131] propose 14 carbon emission factors for China, ranking their importance and predicting trends with the ARIMA + LSTM model. This regional focus encourages a nuanced exploration of integrated models in diverse geographical contexts. Ref. [
132] introduces the PSO-ERT model for day-ahead prediction in the Australian National Electricity Market, demonstrating superior performance. This cross-regional application encourages a broader consideration of integrated models in diverse energy markets. Shifting the focus to the Chinese context, ref. [
133] employ a hybrid model, predicting carbon emission peaks using the CNN-LSTM approach. This temporal consideration prompts an exploration of integrated models in capturing the dynamics of emission trends. Ref. [
134] further contributes by proposing 14 carbon emission factors for China, employing the random forest model and predicting trends with the ARIMA + LSTM model. This integrated approach encourages a deeper understanding of the interplay between influencing factors and model performance.
The strengths of ensemble models lie in enhancing the overall robustness of predictions by integrating results from multiple models, providing a more comprehensive capture of patterns and trends within the data. This approach is particularly effective in handling complex relationships and leveraging the advantages of different algorithms. However, ensemble models also pose certain challenges, including higher computational costs, difficulty in interpreting prediction outcomes, and a greater demand for high-quality input data. According to the existing literature, it is evident that ensemble models often outperform individual models in terms of predictive accuracy. In the fields of environmental science and policy formulation, the application of ensemble models contributes to a more comprehensive and accurate understanding of the dynamic changes in carbon emissions, offering decision-makers more reliable information support.
3. Assessment Metrics for Carbon Emission Models and Their Software Implementations
3.1. Evaluation Criteria
In the literature studying the performance of time series forecasting models, a set of nine core evaluation metrics is commonly employed, including Mean Squared Error (MSE), Root Mean Squared Error (RMSE), Mean Absolute Error (MAE), Mean Absolute Percentage Error (MAPE), Coefficient of Determination (R2), Maximum Error (ME), Relative Absolute Error (RAE), Root Mean Squared Logarithmic Error (RMSLE), and the Mean Absolute Percentage Deviation (MAPD) [
135]. The selection of these metrics not only aids in assessing the accuracy of models during the forecasting process but also provides insights into the distribution of errors and the extent to which the model explains the total variance. By comprehensively applying these five metrics, researchers and practitioners can consistently choose evaluation criteria suitable for specific scenarios, ensuring a comprehensive and accurate assessment of the performance of time series forecasting models. This consensus not only facilitates the promotion of consistency in evaluation standards but also provides researchers with more reliable tools to delve deeper into understanding and comparing the performance of different time series forecasting models.
3.2. Related Software and Packages
The selection of appropriate software and tools is crucial for enhancing research efficiency and model performance in CO2 emission forecasting. In recent years, many open-source software frameworks and libraries have provided powerful support to researchers, assisting in data processing, model construction, and result evaluation. TensorFlow and Keras are widely used deep learning frameworks that allow for the efficient construction and training of complex predictive models, including BiLSTM and other recurrent neural networks. These tools offer rich functionalities and user-friendly interfaces, making them particularly suitable for time-series forecasting tasks. PyTorch is another popular deep learning framework known for its flexibility and dynamic computation graph, which makes it highly advantageous when building advanced models. PyTorch has widespread applications in implementing attention-based BiLSTM models and other sophisticated predictive methods. Scikit-learn is a versatile machine-learning library ideal for traditional regression-based forecasting models. It provides a wide range of tools for data preprocessing, feature selection, model training, and performance evaluation. Its ease of use and comprehensive functionality make it a preferred choice for many researchers.
Additionally, XGBoost and LightGBM are two commonly used gradient-boosting frameworks known for their efficiency and accuracy in handling large datasets. They are widely applied in predictive modeling tasks, as they optimize model training speed and precision, making them particularly suitable for large-scale CO2 emission forecasting. Each of these tools and libraries has its strengths and weaknesses, but all have been extensively used in the field of CO2 emission forecasting. They offer flexible and efficient solutions for researchers, and selecting the right tool can significantly improve model performance and forecasting accuracy.
4. Summary
In the study of carbon emission prediction, we delved into the characteristics and challenges of various models, offering valuable insights for future research and applications. From the selection of univariate and multivariate models to the comparison of statistical methods and machine learning models, the challenges of annual and daily emission predictions, and the cutting-edge trends in ensemble models, we systematically examined issues across different dimensions. The following is a specific summary:
In carbon emission prediction, a comprehensive consideration of univariate and multivariate models reveals key factors influencing model selection. Depending on the specific requirements of the prediction task, either univariate or multivariate models are chosen. Univariate models are simple and efficient, making them suitable for scenarios with relatively simple requirements, resource constraints, or limited data. In contrast, multivariate models provide more comprehensive and accurate modeling capabilities, which are particularly useful when prediction tasks demand a thorough consideration of multiple influencing factors. The quality and quantity of data are another critical consideration. Univariate models have lower requirements for data quality and quantity, making them suitable for situations with diverse data quality or limited data. On the other hand, multivariate models rely on high-quality and abundant data to fully understand and predict carbon emission trends. In summary, the flexible application of both univariate and multivariate models based on task requirements, data characteristics, and computational resources can enhance the accuracy and efficiency of carbon emission predictions.
Statistical models play a crucial role in carbon emission prediction. Models like ARIMA and SARIMAX excel in simple scenarios, requiring lower data input, being easy to operate, and demanding relatively fewer computational resources. On the other hand, other statistical models, such as RF and LASSO, which require higher data quality and quantity, offer a comprehensive approach by considering multiple factors providing solutions for more complex forecasting tasks. Machine learning models show excellent performance, especially when dealing with more complex relationships and large-scale datasets. Ensemble learning models, such as RF, XGBoost, and LSTM, have achieved significant results in various studies, effectively capturing non-linear relationships in the data. However, machine learning models have relatively higher requirements for data quality and computational resources, especially when considering deep learning models. The current trend strongly favors the adoption of deep learning models, such as LSTM and CNN, to more effectively handle spatiotemporal relationships in carbon emission data. Deep learning models have robust feature extraction capabilities, enabling them to capture dynamic patterns in carbon emission data comprehensively, demonstrating great potential in the field of carbon emission prediction and offering new possibilities to improve predictive performance.
In carbon emission prediction, annual emission forecasting is a critical method for estimating future carbon dioxide emissions for specific years, and recent research has made significant progress in this area. Various models, including single models like Random Forest, comprehensive models such as LSTM-STIRPAT, and ensemble models involving Extreme Learning Machines, Aquila Optimizer, and Elastic Net Regression, provide profound insights into future emission trends. These studies emphasize the potential to achieve emission peaks and net-zero emissions through targeted emission reduction measures. The advantages of annual emission forecasting lie in its simplicity and its support for policy planning. However, due to limitations in spatiotemporal accuracy, it is challenging to capture short-term and spatial emission changes. Additionally, future uncertainty may impact forecasting results. Daily emission forecasting is another important method aimed at estimating future emissions for specific dates. Current research has made significant progress in this field, but in-depth studies on daily emission forecasting remain relatively limited. Innovative applications of various models have achieved remarkable results in improving accuracy and performance. Challenges in current research on daily emission forecasting include insufficient exploration of influencing factors. The literature lacks comprehensive discussions on the factors influencing daily emissions, limiting the models’ comprehensiveness. Furthermore, there is a need for deeper research into the non-linear relationships between the mechanisms and influencing factors of daily emission forecasting. The advantage of daily emission forecasting lies in its ability to provide timely and accurate carbon emission trends, offering robust support for real-time environmental policy formulation. However, challenges arise due to limited research, restricting the predictive models’ ability to address complexity and variability. With the continuous updating and accumulation of daily carbon emission data, future research is expected to delve deeper into the advantages of real-time forecasting and explore methods to address related challenges.
In the field of carbon emission forecasting, single models focus on either statistical or machine learning methods, each having unique strengths and facing specific challenges. Numerous studies have explored different approaches using models such as ARIMA, SARIMAX, Support Vector Machines (SVM), Artificial Neural Networks (ANN), and more. The advantages of single models lie in their simplicity, operational convenience, and relatively efficient computational performance. However, they exhibit notable limitations, especially in capturing complex dynamics and relationships, handling data variability and nonlinear features, and mitigating the risk of overfitting. Therefore, the selection of a single model requires careful consideration of its pros and cons to ensure suitability for a specific task. Ensemble models, by combining multiple base models to enhance overall performance, demonstrate exceptional capabilities in carbon emission prediction. Hybrid approaches, such as combining Random Forests with Extreme Learning Machines or integrating Artificial Neural Networks with Vector Autoregressive Estimators, show a trend of improving accuracy across various scenarios. Ensemble models excel in handling complex relationships and leveraging the strengths of different algorithms. Challenges include higher computational costs, difficulty in interpreting prediction results, and greater demands for high-quality input data, particularly when considering deep learning models. Despite these challenges, ensemble models consistently outperform single models in environmental science and policy-making, providing decision-makers with more reliable information support. The current trend strongly favors the adoption of ensemble models, combining various technologies for more effective handling of carbon emission data.
5. Future Outlook
The field of carbon emission prediction is currently experiencing a robust phase of development, with innovations in various models and methods opening up extensive possibilities for future research. Here is a comprehensive summary of the future outlook for carbon emission prediction:
Integration of Multi-Scale Data: Future trends will focus on integrating data from multiple scales, including both annual aggregates and daily emissions. This integration will contribute to building more comprehensive and accurate models for a better understanding of the dynamic changes in carbon emissions.
Continued Application of Deep Learning Models: With the successful application of deep learning models such as LSTM and CNN in carbon emission prediction, future research will continue to explore the potential of these models. However, researchers need to balance their reliance on extensive data, computational resource requirements, and model interpretability challenges.
Advancements in Real-time Prediction: As daily carbon emission data continues to be updated and accumulated, future research will delve deeper into the advantages of real-time prediction. This is expected to provide more timely and flexible support for environmental policy formulation.
In-depth Exploration of Influencing Factors: Future research will delve more deeply into exploring the influencing factors of carbon emissions, aiming for not only quantity but also diversity and spatiotemporal variations to be considered comprehensively.
Enhancing Model Adaptability: Future studies will strive to improve model adaptability to complex and variable scenarios, addressing uncertainties and changes in real-world environments more effectively.
Application of Integrated Models: The integration of various models through comprehensive approaches may become more prevalent, leveraging the strengths of individual models to enhance overall predictive performance.
Global Challenge-oriented Solutions: With increasing global attention on reducing carbon emissions, future research will focus on providing targeted support for emission reduction policies and sustainable development goals through advanced prediction and analysis.
In summary, the future of carbon emission prediction research is heading towards more comprehensive, real-time, and adaptable approaches, providing robust support for addressing climate change challenges and achieving sustainable development objectives.


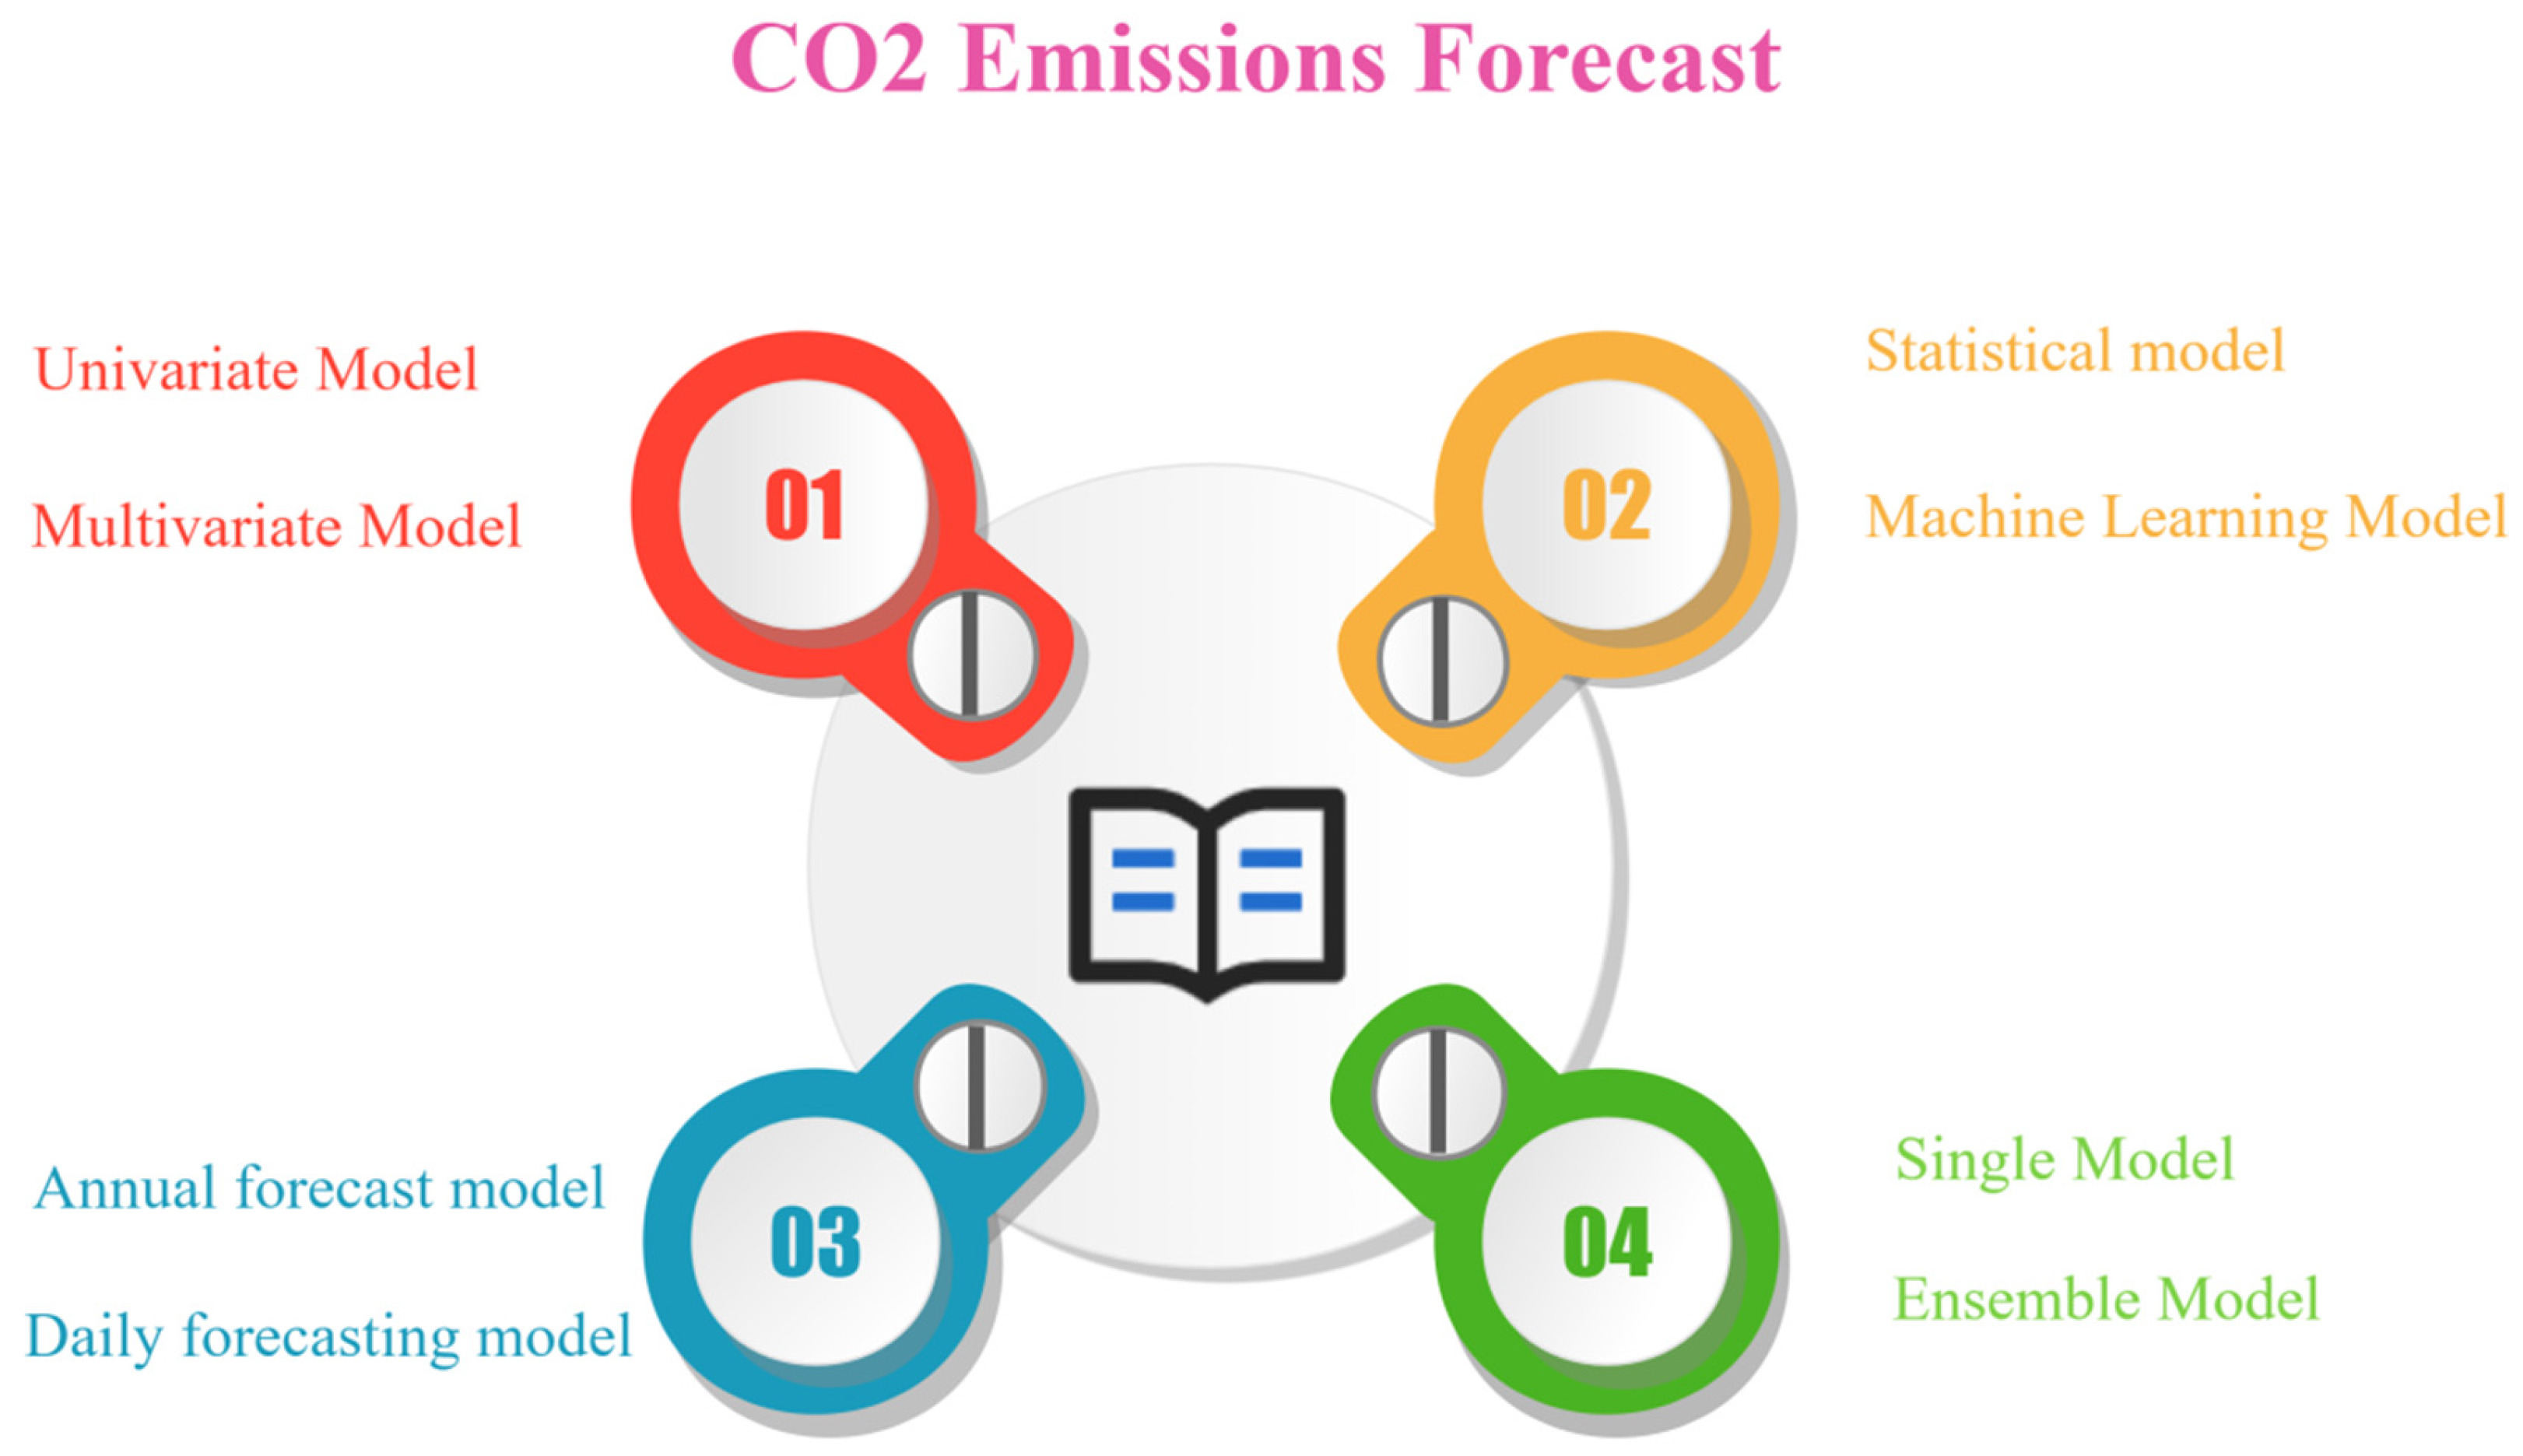

