Abstract
Water resources are essential for human survival and sustainable development. However, the global freshwater scarcity, exacerbated by climate change, presents significant sustainability challenges. Using the SWAT model, we simulated the spatiotemporal distribution of total nitrogen (TN) in the Hangjiang River Basin from 2005 to 2020. The average TN concentration was 2.16 mg/L, with the soil nitrogen pool contributing 92.78% of emissions, highlighting the need to address the soil nitrogen legacy. Sampling showed average concentrations of TN, nitrate, ammonium, nitrite, and dissolved organic nitrogen at 3.01 mg/L, 1.66 mg/L, 0.21 mg/L, 0.02 mg/L, and 1.11 mg/L, respectively. Precipitation accounted for 61.4% of nitrogen emission variability, indicating that water resource sustainability will be significantly influenced by climate change. Projections indicated that from 2020 to 2050, climate change will increase runoff by 6.19 m3/s and reduce TN concentration by 0.004 mg/L annually, potentially enhancing the overall sustainability of water resources. It’s necessary to continue strengthening the prevention and control of agricultural non-point source pollution and reduce nitrogen discharge to further enhance water resource security for the Beijing–Tianjin–Hebei development. The findings provide critical insights to inform policies aimed at protecting water sources and ensuring public water safety.
1. Introduction
Adequate and high-quality freshwater resources are essential for the sustainable development of human society [1,2]. Currently, approximately half of the global population faces unsustainable water supply, with nearly one-quarter residing in regions facing water scarcity [3]. In 2022, per capita water resources in eight provinces, including Tianjin, Ningxia, and Beijing, fell below the international threshold for extreme water scarcity of 500 m3 [4]. Additionally, global river pollution, particularly from agricultural non-point sources of nitrogen and phosphorus, remains a critical issue [5,6]. Huang et al. [7] pointed out that despite significant improvements in water quality in China, nitrogen contributes to approximately 48% of river pollution. Therefore, controlling non-point source pollution of nitrogen and phosphorus is vital for sustainable development.
The core of sustainable development is the preservation of development potential and opportunity in the future [8]. While current monitoring techniques could effectively identify and respond to pollutants in runoff, climate change introduces considerable uncertainty in water quality management. For example, the influence of precipitation variability on pollution load exhibits a dual nature. When precipitation increases significantly, or the frequency of extreme precipitation events rises, intensified surface erosion transports a greater quantity of pollutants into rivers [9,10]. Concurrently, increased runoff generation on land surfaces and direct precipitation inputs into water bodies augment the overall streamflow, which in turn dilutes the pollution load and mitigates its environmental impact [11]. A study predicts a roughly 50% increase in the concentrations of ammonia nitrogen, organic nitrogen, and total nitrogen in the Ganges River within the time frame of 2040 to 2060 [12]. In contrast, the ammonia nitrogen concentration in the upper reaches of the Huai River basin is predicted to decrease by 0.2% to 42.6% between 2020 and 2050 [10]. Therefore, whether climate change exerts positive or negative impacts on surface water pollution and to what extent remains a crucial issue for future strategic planning and management of water resources.
The Hanjiang River, recognized as the largest tributary of the Yangtze River with a total length of 1577 km, is endowed with abundant water resources and superior water quality [13,14]. It serves as a vital water source and critical conservation zone for the Central Line Project of South-to-North Water Diversion as well as the Yangtze River Diversion to Wei River Project [15]. Numerous studies assess the runoff of the Hanjiang River to determine its capacity for spatiotemporal water resource allocation. Zhao et al. [16] predicted that the runoff of the Hanjiang River would gradually increase at an annual rate of 4.747 m3/s from 2020 to 2035 under natural development scenarios. Yue et al. [17], utilizing multiple CMIP6 climate models, found an upward trend in the runoff of the upper and middle reaches of the Hanjiang River in the future, with a slightly higher increase under a low-carbon emission pathway compared to a high-carbon emission pathway.
Despite the relatively optimistic water volume forecasts for the Hanjiang River basin in the future, current research on nitrogen pollution is predominantly centered on status analysis [18]. Zhang et al. [19] observed the total nitrogen (TN) concentration fluctuating between 0.22 and 2.91 mg/L from 2017 to 2019, with an ascending trend that signals potential water quality risks. Research mainly emphasizes basin planning and management, quantifying annual nitrogen loads, and proposing management measures for polluted areas [20]. Based on the HYPE model, Yang and Li [21] calculated the TN pollution intensity to be within the range of 0.354 to 6.139 kg/ha, highlighting a notable load in the southern part of the basin. Utilizing the SWAT model, Li et al. [22] estimated the annual average TN load at the Ankang hydrological station, advocating for a comprehensive approach including stubble coverage, grassed waterway, and returning farmland to forest land as effective control measures. However, whether future nitrogen concentrations in the Hanjiang River basin will meet standards and continue to provide high-quality water remains an open question. The quality of water is directly linked to the health of the people within the water catchment areas. Therefore, the investigation of prospective nitrogen pollution dynamics is of paramount importance for the establishment of ecological conservation strategies for water resources and for safeguarding the sustainable development of the Beijing–Tianjin–Hebei region.
The Soil and Water Assessment Tool (SWAT) model has demonstrated superior efficacy in modeling hydrological processes and water quality at the basin scale [16,17,20,23]. In this study, the SWAT model was used to simulate the spatiotemporal distribution of TN concentration in the Hanjiang River basin from 2005 to 2020 and to identify key pollution sources and critical emission drivers. This analysis aims to provide insights for the development and implementation of targeted non-point source pollution management strategies. Additionally, the study examined the distribution of nitrogen across different chemical forms within the basin, offering a comprehensive overview of the current nitrogen pollution situation. Beyond focusing on water supply and demand through water diversion projects, the study placed emphasis on the impacts of climate change on nitrogen pollution trends. Projections of TN emissions under different shared socioeconomic pathways (SSPs) from 2020 to 2050 were also made, providing valuable information for the sustainability of water resources in the region. The findings aim to support scientific decision-making for water resource management and the formulation of sustainable development strategies, ensuring access to sufficient and clean water for local residents.
2. Materials and Methods
2.1. Study Area
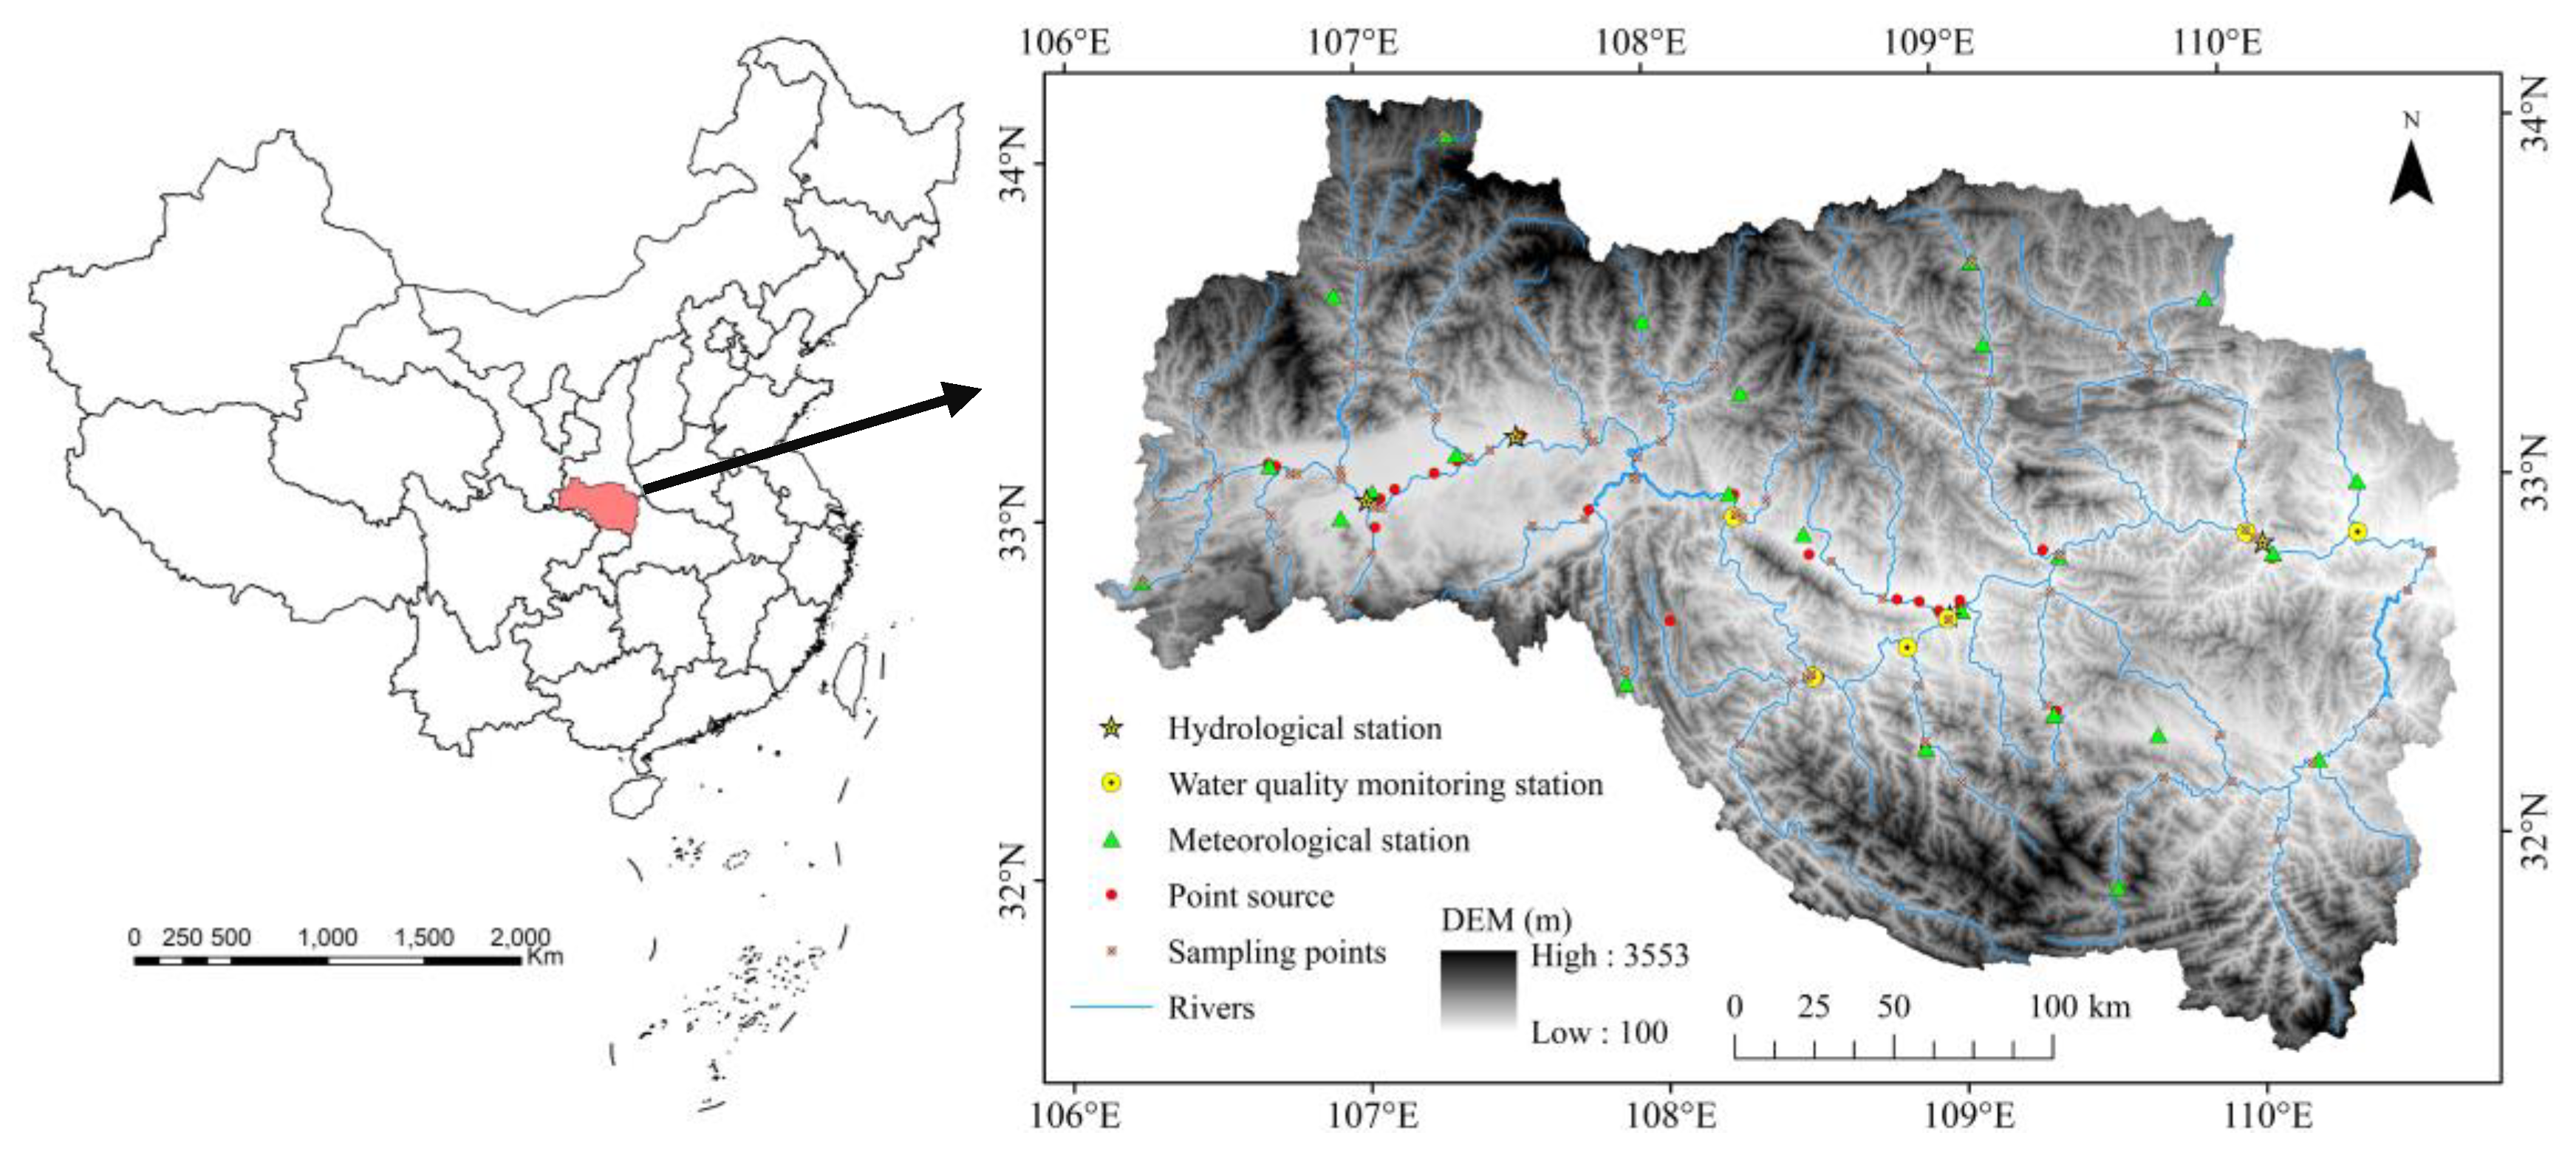
The Hanjiang River is one of the principal tributaries of the Yangtze River. Its upper reaches are delineated by the Qinling Mountains to the north and the Dabashan Mountains to the south, with a geographical location spanning 110.5–116° E and 31.5–34.5° N (Figure 1). The basin primarily encompasses the cities of Hanzhong, Ankang, and Shiyan, covering an area of approximately 74,000 km2. Characterized by a subtropical monsoon climate, the region experiences an average annual temperature ranging from 12 to 15 °C, accompanied by average annual precipitation between 750 and 1100 mm, predominantly occurring from June to October. This ample rainfall has given rise to an extensive network of rivers within the basin, including notable tributaries such as the Du River and the Jia River, which contribute to the abundant water resources in the region. The hydrological richness has also facilitated a high vegetation cover, reaching up to 76%, thus supporting a diverse and robust ecological environment. However, the region’s economic development remains relatively limited, creating a complex tension between the urgent need for economic growth and the critical demands of environmental conservation.
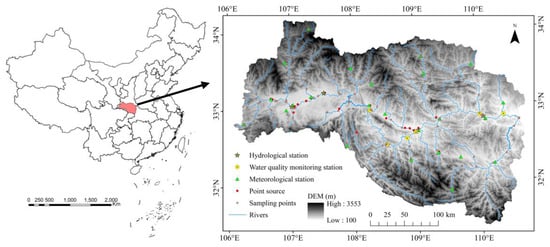
Figure 1.
Study area. The map base was obtained from the Resource and Environmental Science Data Platform (https://www.resdc.cn/, accessed on 15 July 2024).
2.2. Data Collection
Data utilized for the simulation within the SWAT model include: (1) The Digital Elevation Model (DEM), a 90 m resolution DEM, serving as the foundational topographical input, was sourced from the Resource and Environmental Science Data Platform (https://www.resdc.cn/, accessed on 15 July 2024). (2) Land use and land cover data: The 2020 Land Use Dataset [24], with a resolution of 1 km, categorizes into arable land, grassland, woodland, water area, construction land, and unused land, also obtained from the Resource and Environmental Science Data Platform. (3) Soil data: The Harmonized World Soil Database (https://www.fao.org/soils-portal/data-hub/soil-maps-and-databases/, accessed on 15 July 2024) provided a soil type dataset with a resolution of 1 km. (4) Current climate data: Daily parameters from 2000 to 2022, including precipitation, temperature, wind speed, solar radiation, and relative humidity, were obtained from the China Meteorological Data Network (https://data.cma.cn/, accessed on 15 July 2024). (5) Future climate scenarios: Projections for future climate change in terms of precipitation and temperature were derived from general circulation models (GCM) in the CMIP6 framework, including FGOALS-g3, GFDL-ESM4, MIROC6, MRI-ESM2-0, NESM3, NorESM2-LM, and NorESM2-MM, with data accessed through the Earth System Grid Federation (https://aims2.llnl.gov/search, accessed on 15 July 2024). (6) Runoff and TN concentration: Monthly runoff data from January 2014 to September 2022 were extracted from the Shaanxi Hydrological and Water Resources Information Network (http://www.shxsw.com.cn/, accessed on 15 July 2024), while monthly water quality data from January 2021 to December 2022 were sourced from the National Surface Water Quality Data Release System (https://waterpub.cnemc.cn:10001/, accessed on 15 July 2024). (7) TN emission: The nitrogen emissions from non-point sources, such as livestock farming, rural life, and the application of chemical fertilizers, were quantified by integrating the statistical survey of emission sources and the calculation methods and coefficients manual (http://www.mee.gov.cn, accessed on 15 July 2024) for pollution discharge.
Field sampling was conducted at four intervals: September 2021, March 2022, October 2023, and March 2024. At each sampling site (Figure 1), 1 L of water sample was collected using a rinsed polytetrafluoroethylene plastic bottle, with concentrated sulfuric acid added to adjust the pH to less than 2 for preservation. The samples were stored at 4 °C and analyzed within 7 days. After filtration through a 0.45 μm microporous membrane, the water samples were analyzed for various chemical forms of nitrogen using the Smartchem200 automated discrete analyzer. The analysis and determination of nitrate nitrogen (–N), nitrite nitrogen (–N), ammonia nitrogen (–N), and TN were all conducted using the spectrophotometric method, following the national standards for surface water environmental quality. Standard curves were established using gradient dilution methods, with the requirement that the coefficient of determination for each standard curve be greater than 0.995. Each sample was measured twice, and the average of the two measurements was used as the final concentration. The concentration of dissolved organic nitrogen (DON) was calculated by subtracting the aforementioned inorganic nitrogen components from the TN.
2.3. Geographical Detector
The geographical detector is an effective analytical tool for assessing spatial heterogeneity and the influence of various driving factors, providing valuable insights for understanding the influence of socioeconomic and natural environmental factors on spatial attributes [25,26]. The explanatory power of individual factors is quantified using the q statistic, calculated according to Equation (1). The q-value ranges from 0 to 1, indicating that the factor explains 100 × q% of the spatial heterogeneity of the attribute.
where h, ranging from 1 to L, represents the strata of the factor. Nh and N denote the number of spatial units in the stratum and the entire area, respectively. σh2 and σ2 are the variances of the spatial attribute in stratum and the entire area, respectively.
The intensity of land use serves as an indicator of the degree of human exploitation and utilization of land resources. In this study, land use types were classified into four hierarchical levels: unused land (Level 1), woodland, grassland, and water area (Level 2), arable land (Level 3), and construction land (Level 4). This classification framework was employed to quantify the overall intensity of land use across the study area (Equation (2)) [27].
where Ai represents the level of grade i land use intensity classification, and Si represents the proportion of grade i land use type area.
Nighttime light can reflect human activity footprints and is characterized by high spatiotemporal resolution, making them widely used in studies of human impacts. For example, Huang et al. [7] found that in China’s Liao River, Hai River, Yellow River, Yangtze River, Huai River, and Pearl River, nighttime light had contribution values of 0.73 and 0.62 to the variation of total phosphorus and ammonia nitrogen, respectively, making it the most powerful predictor among the factors studied.
In this study, six driving factors for the year 2020 were selected, including the intensity of land use, annual precipitation, nighttime light, average elevation, population density, and annual mean temperature. Employing the ArcGIS, each factor was delineated in the five distributional strata using natural breaks [28,29]. This approach enabled a comprehensive analysis of how these factors influenced the TN load intensity (the nitrogen load per unit area) within the Hanjiang River subbasins for the year 2020.
2.4. Downscaling
Given the relatively low spatial resolution of GCM, the application of downscaling methodologies is imperative for the correction and optimization of rational climatic information to a local scale [30,31]. The delta bias correction technique is a straightforward and widely employed method for downscaling, as indicated by Equations (3) and (4) [30,32]. This method is favored for its simplicity and effectiveness in adjusting the bias present in large-scale model outputs, thereby aligning them more closely with observed data at local scales [33]. Additionally, the Taylor diagram, a graphical representation, serves to effectively illustrate the differences in the performance metrics of various models, including the correlation coefficient (r) and the normalized root mean square error (NRMSE) Equation (5). This study adopts the period from 2000 to 2013 as the baseline historical period for the delta downscaling correction of daily precipitation and the temperatures of maximum and minimum at 25 individual stations. Subsequently, an evaluation of the performance suitability of the GCMs, after downscaling, is conducted.
where Td* and Pd* denote the daily temperature and precipitation values post the application of delta bias correction, respectively. The variables Td,GCM and Pd,GCM correspond to the daily temperature and precipitation as projected by the GCM. Tmi,GCM and Pmi,GCM signify the monthly mean temperature and precipitation, respectively, as simulated by the GCM for month i within the historical periods. The observed counterparts, Tmi,obs and Pmi,obs, represent the monthly mean temperature and precipitation recorded at the meteorological station for month i during the same historical timeframe.
where n represents the sample size. Si and Oi stand for simulated and observed values, respectively. denotes the mean values of the observed data.
2.5. SWAT Model
SWAT, an advanced semi-distributed hydrological model developed by the United States Department of Agriculture, is based on the principles of physical hydrological processes and temporal continuity [34,35]. It is highly regarded for its effectiveness in assessing runoff, sediment transport, and nutrient load in large and complex watersheds. The SWAT model delineates the watershed into several subbasins based on elevation, which are subsequently stratified into hydrological response units (HRU) according to land use, soil classification, and slope characteristics. By simulating the hydrological processes and nutrient cycles of each HRU in detail, the model integrates these assessments to provide a comprehensive evaluation of runoff and pollution conditions across the entire basin. In this study, the SWAT model (SWAT2012 rev. 692) was utilized to divide the Hanjiang River basin into 62 subbasins, including 1239 HRUs, facilitating an extensive analysis of the runoff and nitrogen pollution. Additionally, scenario analysis was conducted to simulate conditions devoid of specific nitrogen inputs, thereby quantifying the contributions of various nitrogen sources to TN discharge. These sources encompass livestock farming, rural domestic, fertilizer application, atmospheric deposition, point sources, and soil nitrogen pools.
SWAT-CUP, an effective automated calibration program, is specifically designed to adjust the parameters of the SWAT model within recommended ranges, enhancing its accuracy in reflecting actual hydrological and water quality conditions [35]. This study calibrated and validated the model using monthly observed data from four hydrological stations and six water quality monitoring stations to ensure a high degree of consistency between the simulated outcomes and the observed hydrological fluxes and TN emissions within the Hanjiang River basin. The accuracy of the model is assessed by two key indicators [34] (Equations (6) and (7)): the coefficient of determination (R2) and the Nash efficiency coefficient (NSE). This study adheres to the principle of first calibrating runoff and then calibrating pollutants. It repeatedly simulates the given parameters and ranges to obtain the optimal results’ statistics and recommended ranges for the next parameter adjustment, iterating until the evaluation parameters meet the expected criteria.
where n represents the total number of observations. Oi and Si denote the observed and simulated values, respectively. Oave and Save represent the mean values of the observed and simulated data, respectively.
Non-point source pollution is the result of the combined effects of numerous anthropogenic and natural factors. This study primarily considers the soil nitrogen pool, rural domestic, atmospheric deposition, fertilizer application, livestock farming, and large-scale point sources. By reducing specific nitrogen sources, the contributions of various nitrogen sources are analyzed (Equations (8) and (9)) [36].
where TNi represents the TN quantities originating from nitrogen source i. TNall and TNall,i represent the total and lack of specific nitrogen source i, respectively, and i is rural domestic, atmospheric deposition, fertilizer application, livestock farming, and large-scale point source.
3. Results and Discussion
3.1. The Performance of SWAT Model
When employing the SWAT model, it is standard practice to perform calibration and validation [37,38]. To enhance predictive accuracy, this study selected 13 runoff and 15 nitrogen cycle parameters as key variables for model correction (Table S1). Precipitation data from Hanzhong, Yangxian, Ankang, and Baihe stations revealed a notable increase in rainfall during the autumn months (Figure S1). The precipitation trends in Hanzhong and Yangxian were similar, as were those in Ankang and Baihe. Over the period 2005 to 2022, Hanzhong station recorded an average annual precipitation of 1011.06 mm, with above-average rainfall in 2010, 2011, 2013, 2014, and 2021 (Figure S1a). Yangxian station had an average of 864.73 mm, with above-average years in 2011, 2017, 2019, and 2021 (Figure S1b). Ankang station reported an average of 792.37 mm, with above-average precipitation in 2005, 2007, 2008, 2010, 2019, and 2021 (Figure S1c). Baihe station’s average was 790.01 mm, with above-average years in 2005, 2009, 2010, 2011, 2017, and 2021 (Figure S1d). The peak precipitation across all stations occurred in 2021, with a decreasing trend in average precipitation observed from the upper reaches to the lower reaches of the Hanjiang River.
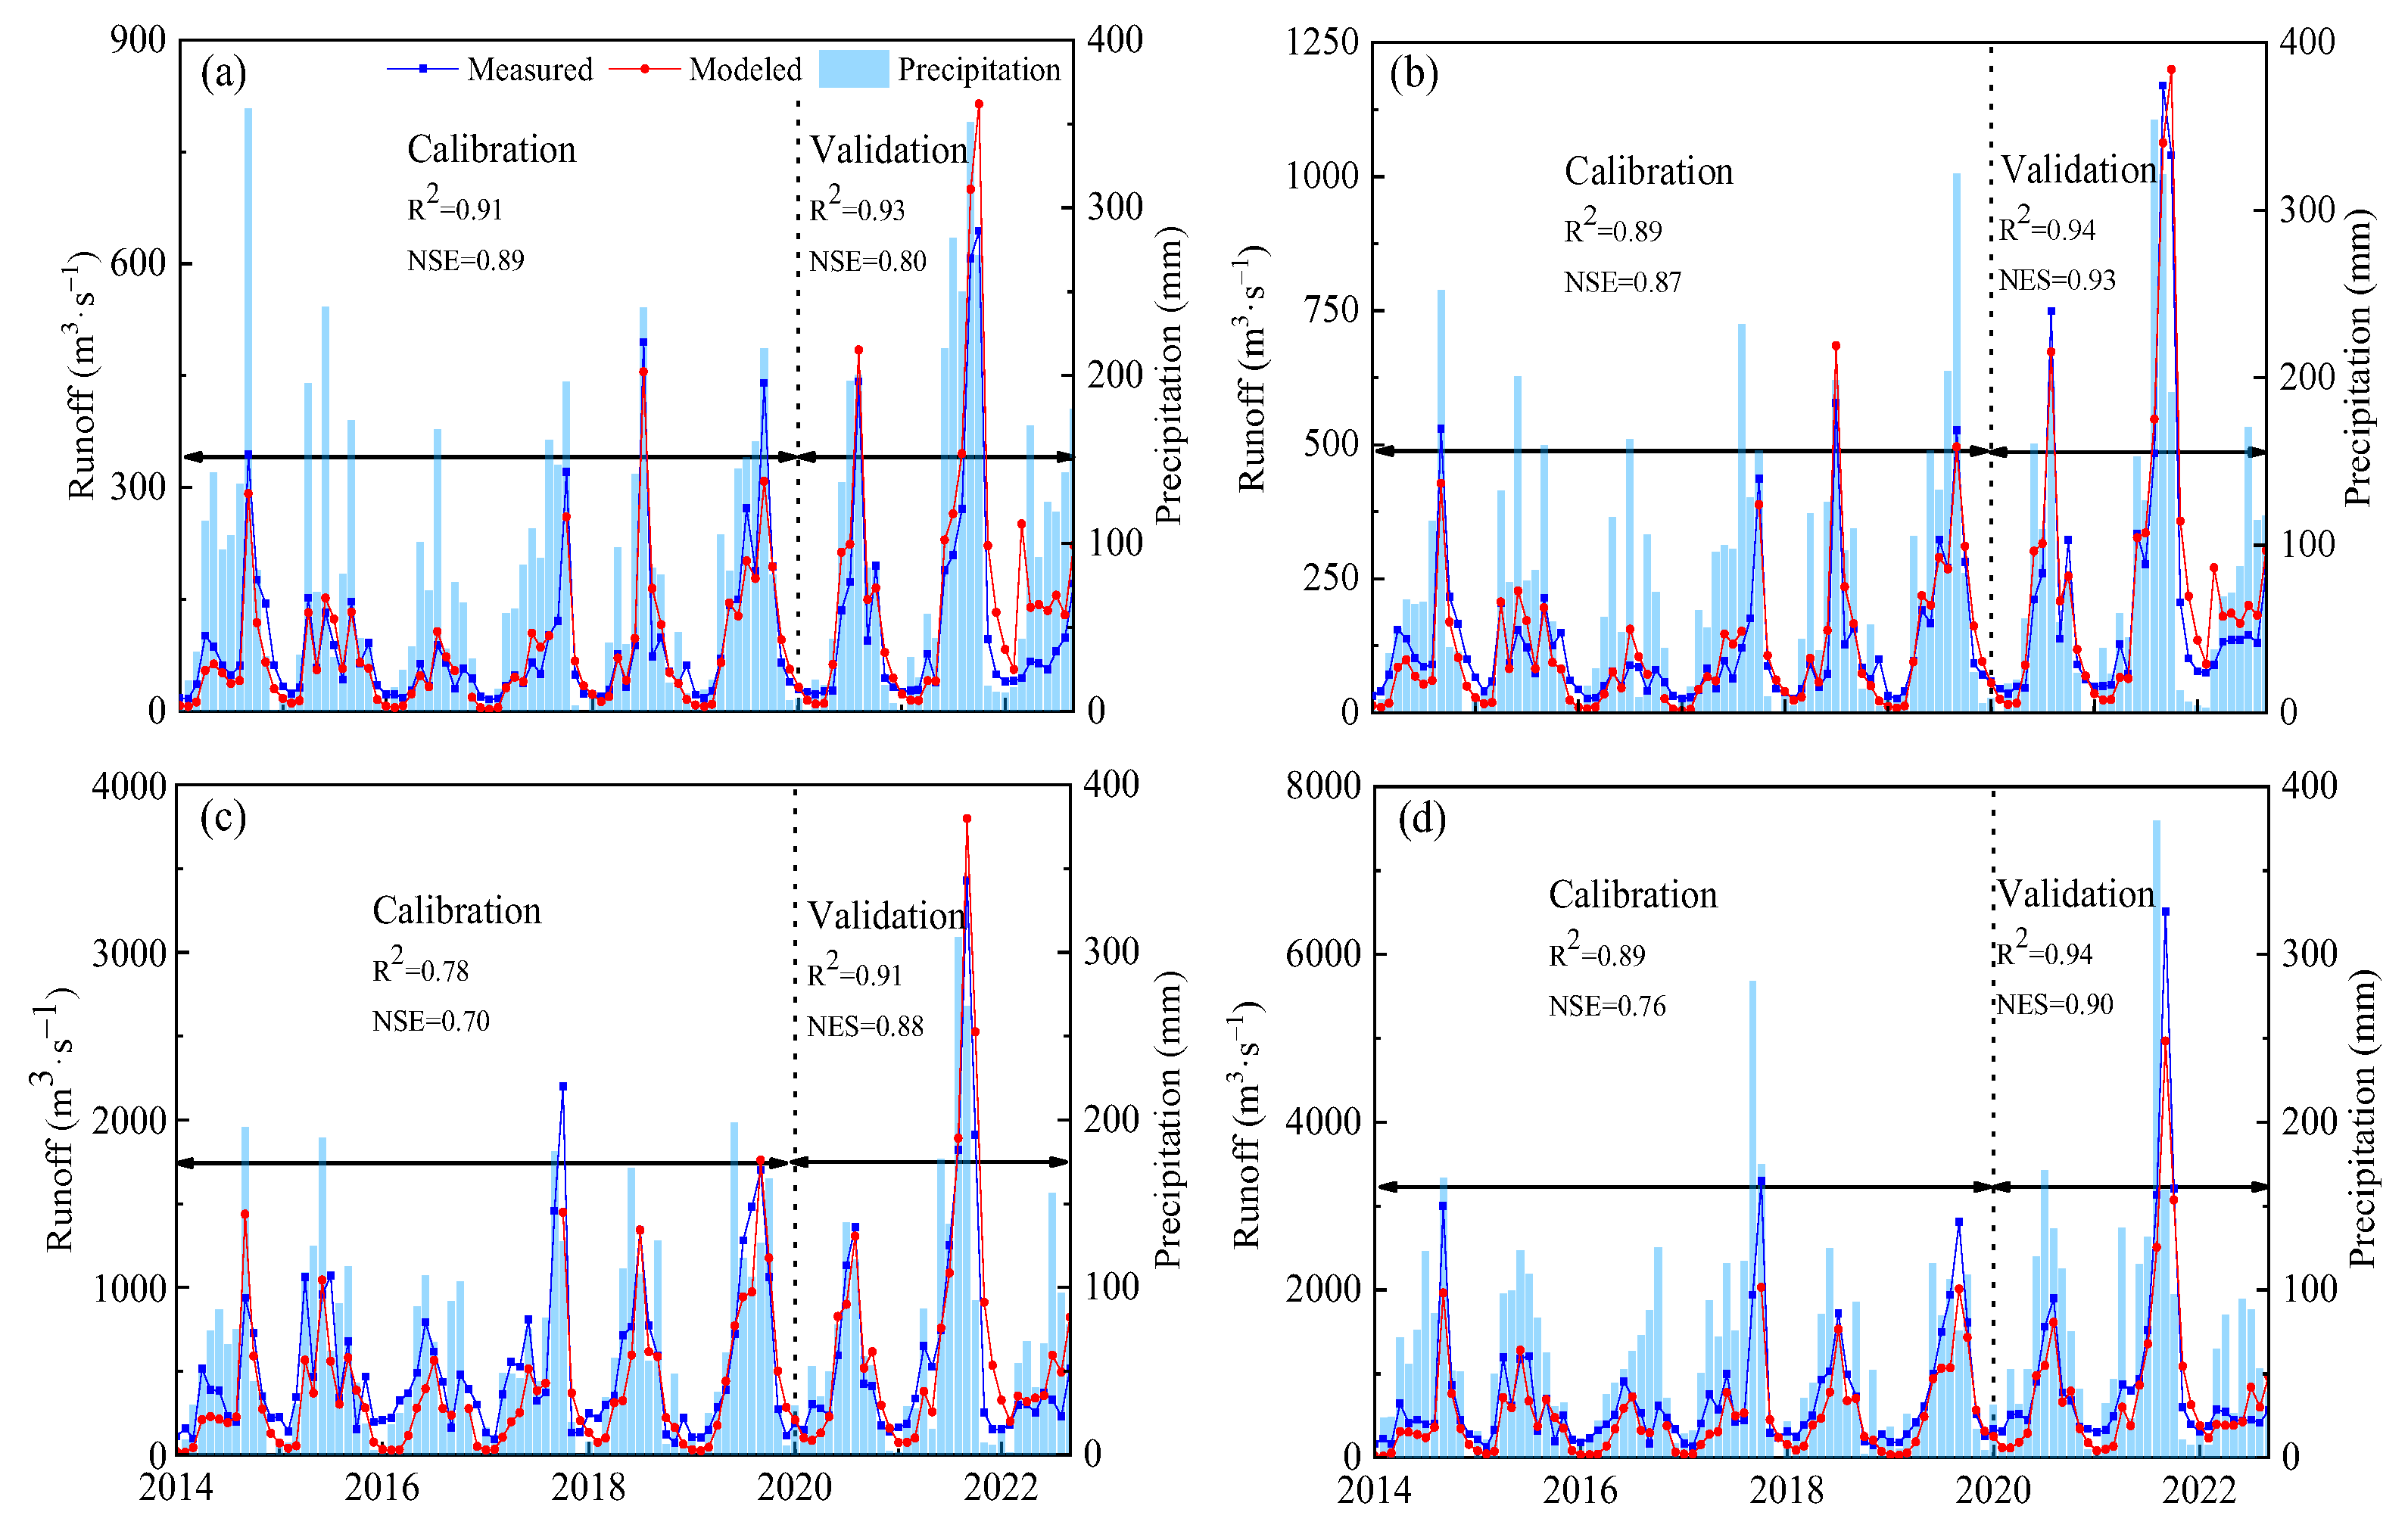
Runoff and precipitation exhibited similar variation trends, with peak runoff observed in 2021 at all stations (Figure 2). Analysis of simulated data for Hanzhong (Figure 2a), Yangxian (Figure 2b), Ankang (Figure 2c), and Baihe (Figure 2d) hydrological stations indicated high model accuracy during both calibration and validation periods, with R² values greater than 0.75 and NSE values exceeding 0.7. This aligns with the superior performance of the SWAT model in simulating runoff across various global basins, such as the Ganges basin [39] (R2 > 0.85, NSE > 0.75), the Mississippi Big Sunflower River basin [40] (R2: 0.61–0.70, NSE: 0.55–0.63), and the Yellow River basin [41] (R2: 0.65–0.73, NSE: 0.5–0.78). Moriasi et al. [42] suggest that satisfactory SWAT model performance is indicated when R2 exceeds 0.6 and NSE surpasses 0.5 in runoff simulations. Therefore, the calibrated SWAT model effectively captured runoff dynamics in the Hanjiang River basin.
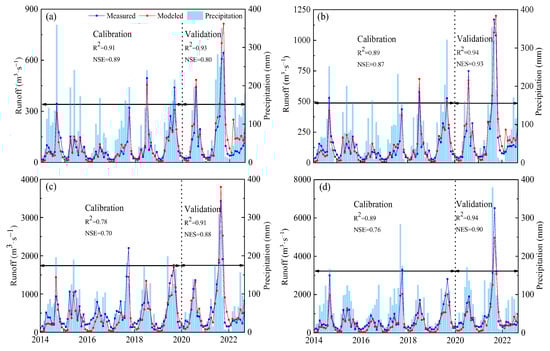
Figure 2.
The trend of runoff in the Hanjiang River basin of Hanzhong (a), Yangxian (b), Ankang (c), and Baihe hydrographic stations (d) over the past 10 years. Blue dots represent measured values, red dots represent modeled values, and the bar chart shows monthly precipitation.
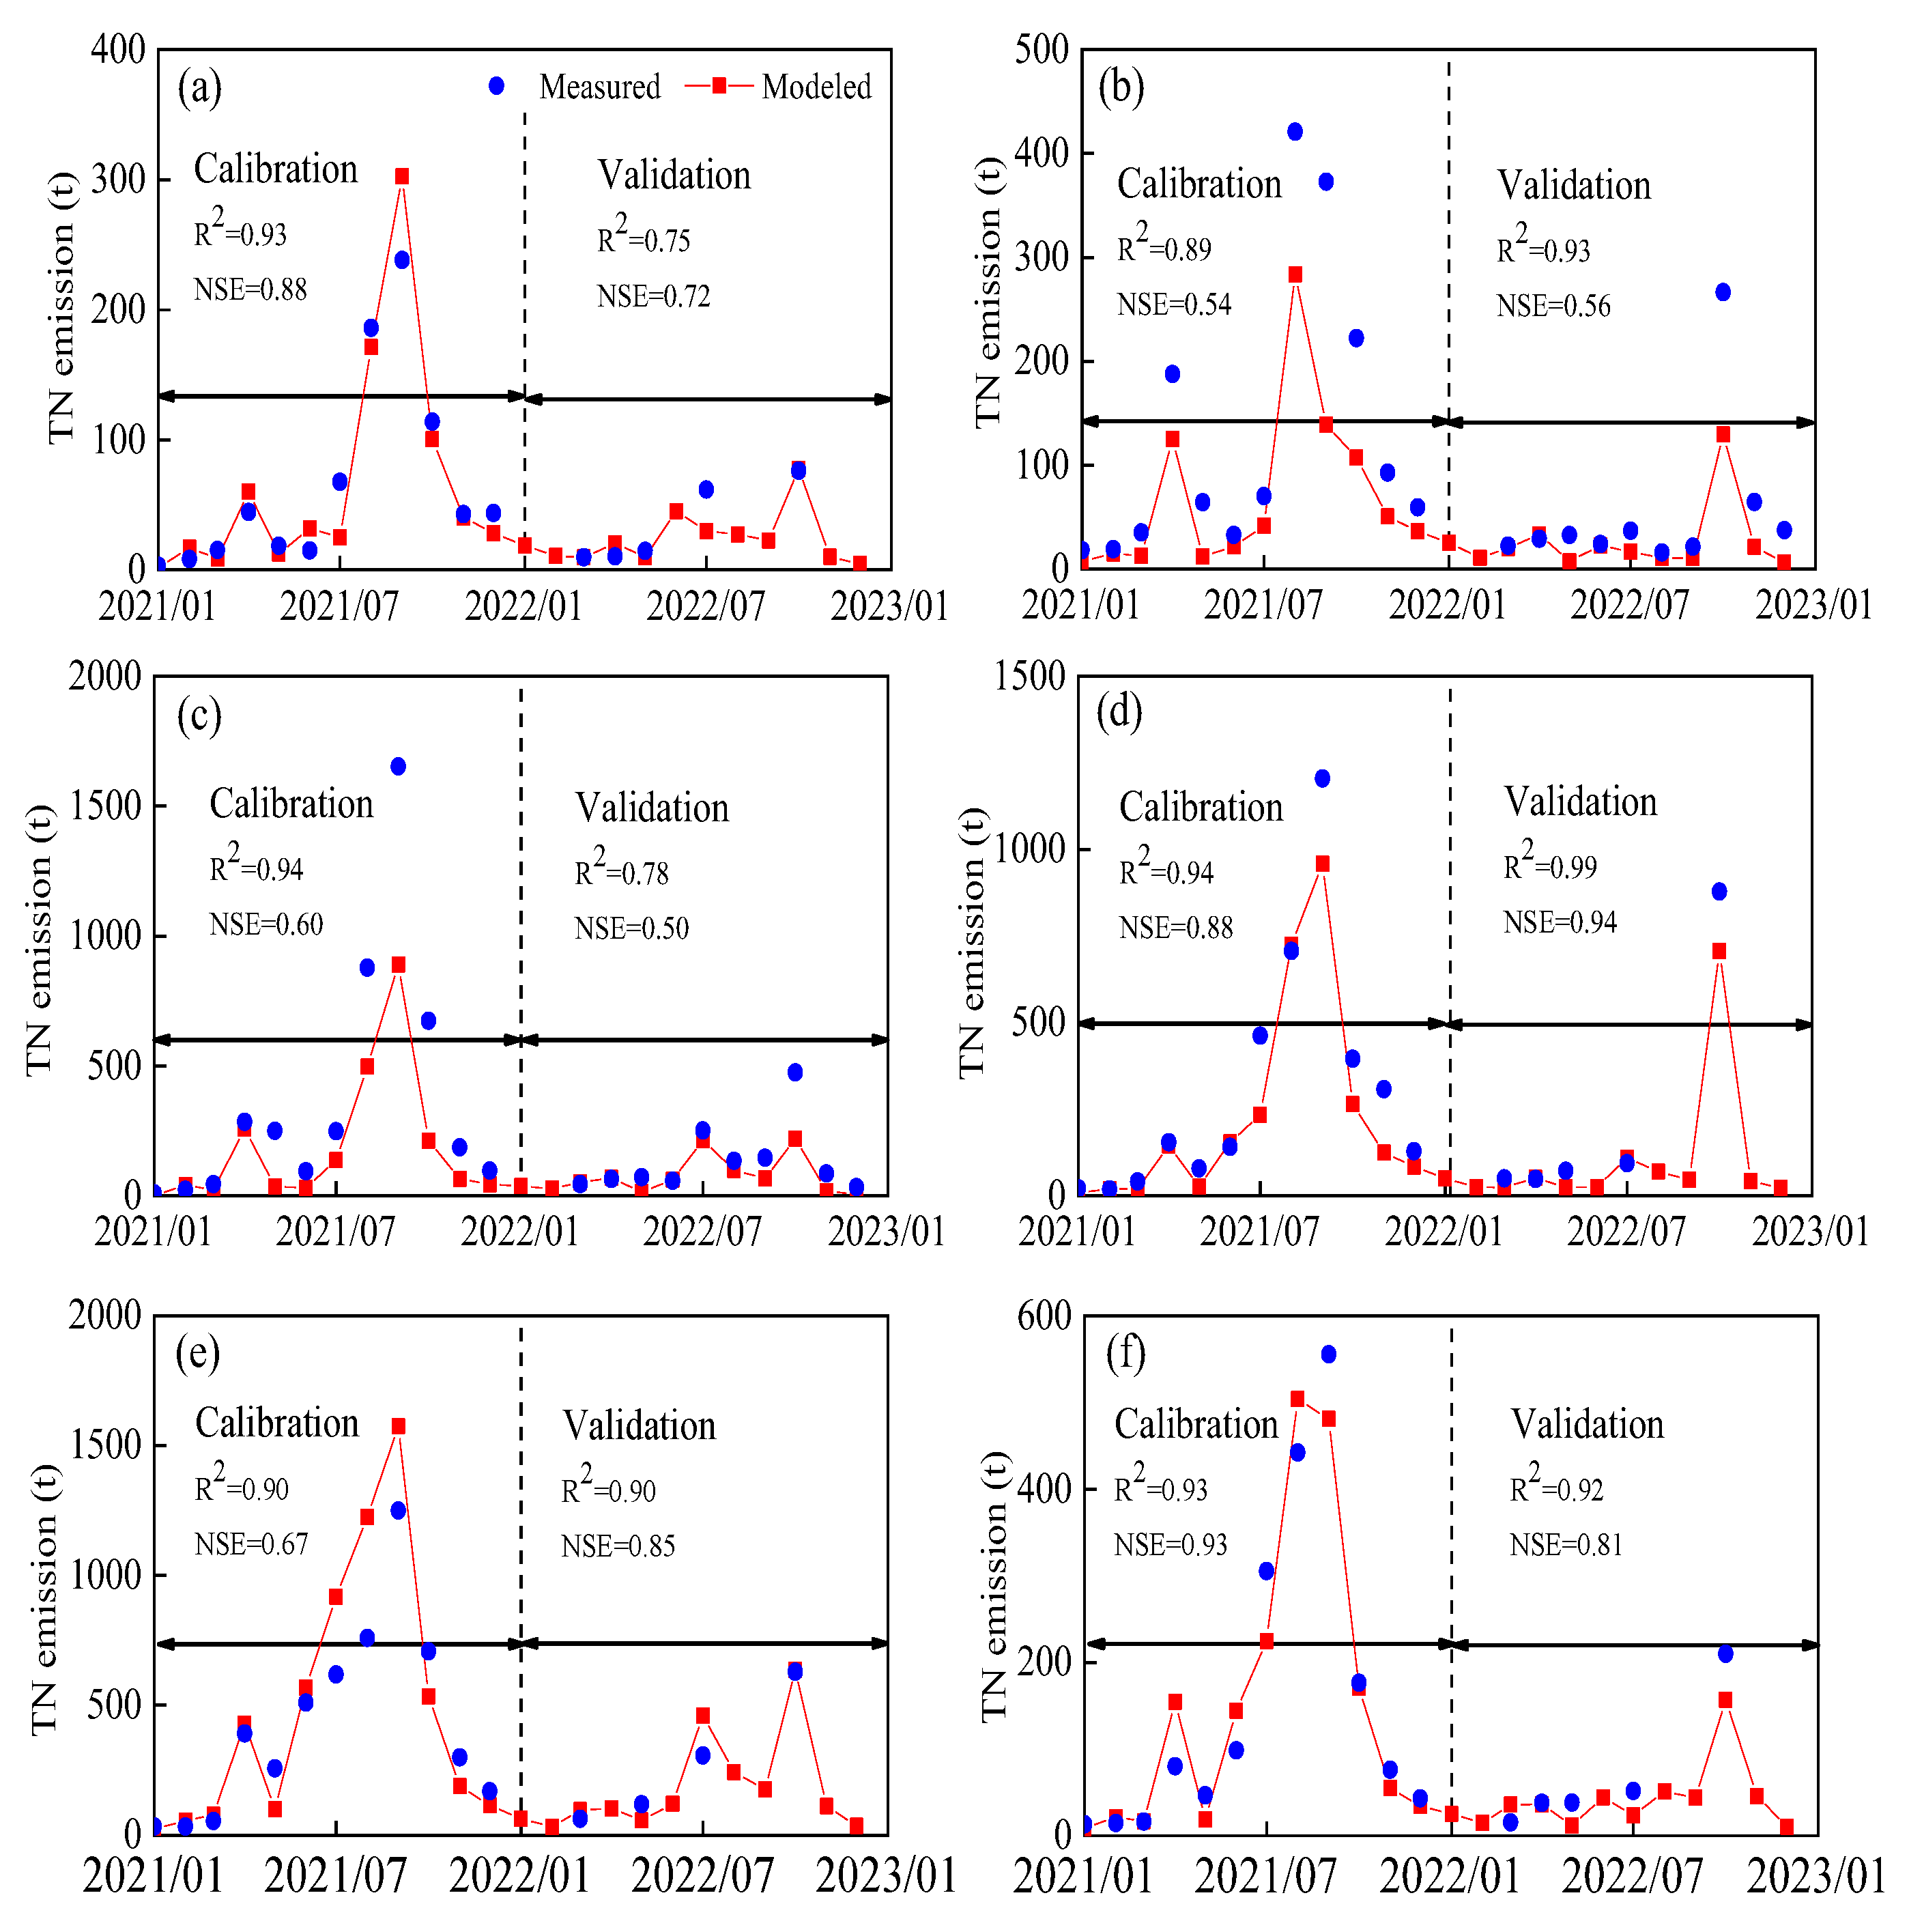
Employing the SWAT model to simulate the TN pollution in the Hanjiang River basin, the accuracy of the simulation results was as excellent as that of the runoff simulation (Figure 3). The simulation outcomes at six water quality monitoring stations (Chi River, Tian River, Jia River, Yue River, Ren River, and Lan River) demonstrated R2 values exceeding 0.65 and NSE values greater than 0.5, indicating a strong consistency between the simulated and observed TN values. Regarding nitrogen pollution, Moriasi et al. [42] suggest that satisfactory model performance is indicated when R2 and NSE for the simulated versus observed data reach 0.3 and 0.35, respectively; values above 0.6 denote good performance, while those above 0.7 signify excellent performance. Consequently, the calibrated SWAT model accurately simulated both the hydrological cycle and nitrogen pollution in the Hanjiang River basin, proving to be a reliable tool for simulating and predicting hydrological processes and TN emissions in the basin.
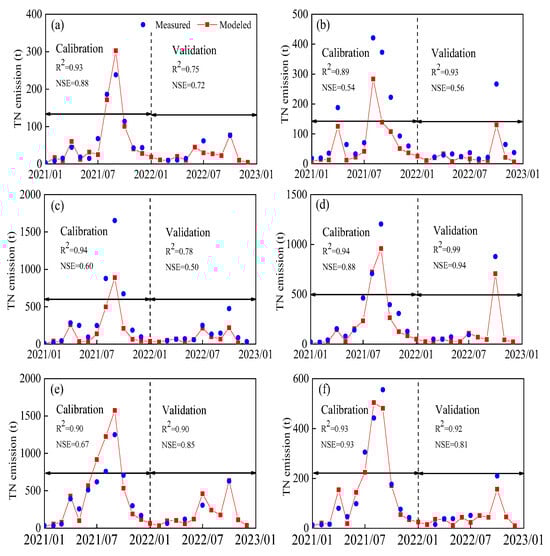
Figure 3.
The trend of TN emissions in the Hanjiang River basin of Chi River (a), Tian River (b), Jia River (c), Yue (d), Ren River (e), and Lan River (f) water quality monitoring stations over the past 2 years. Blue dots represent measured values and red dots represent modeled values.
3.2. Characteristics of TN Emissions
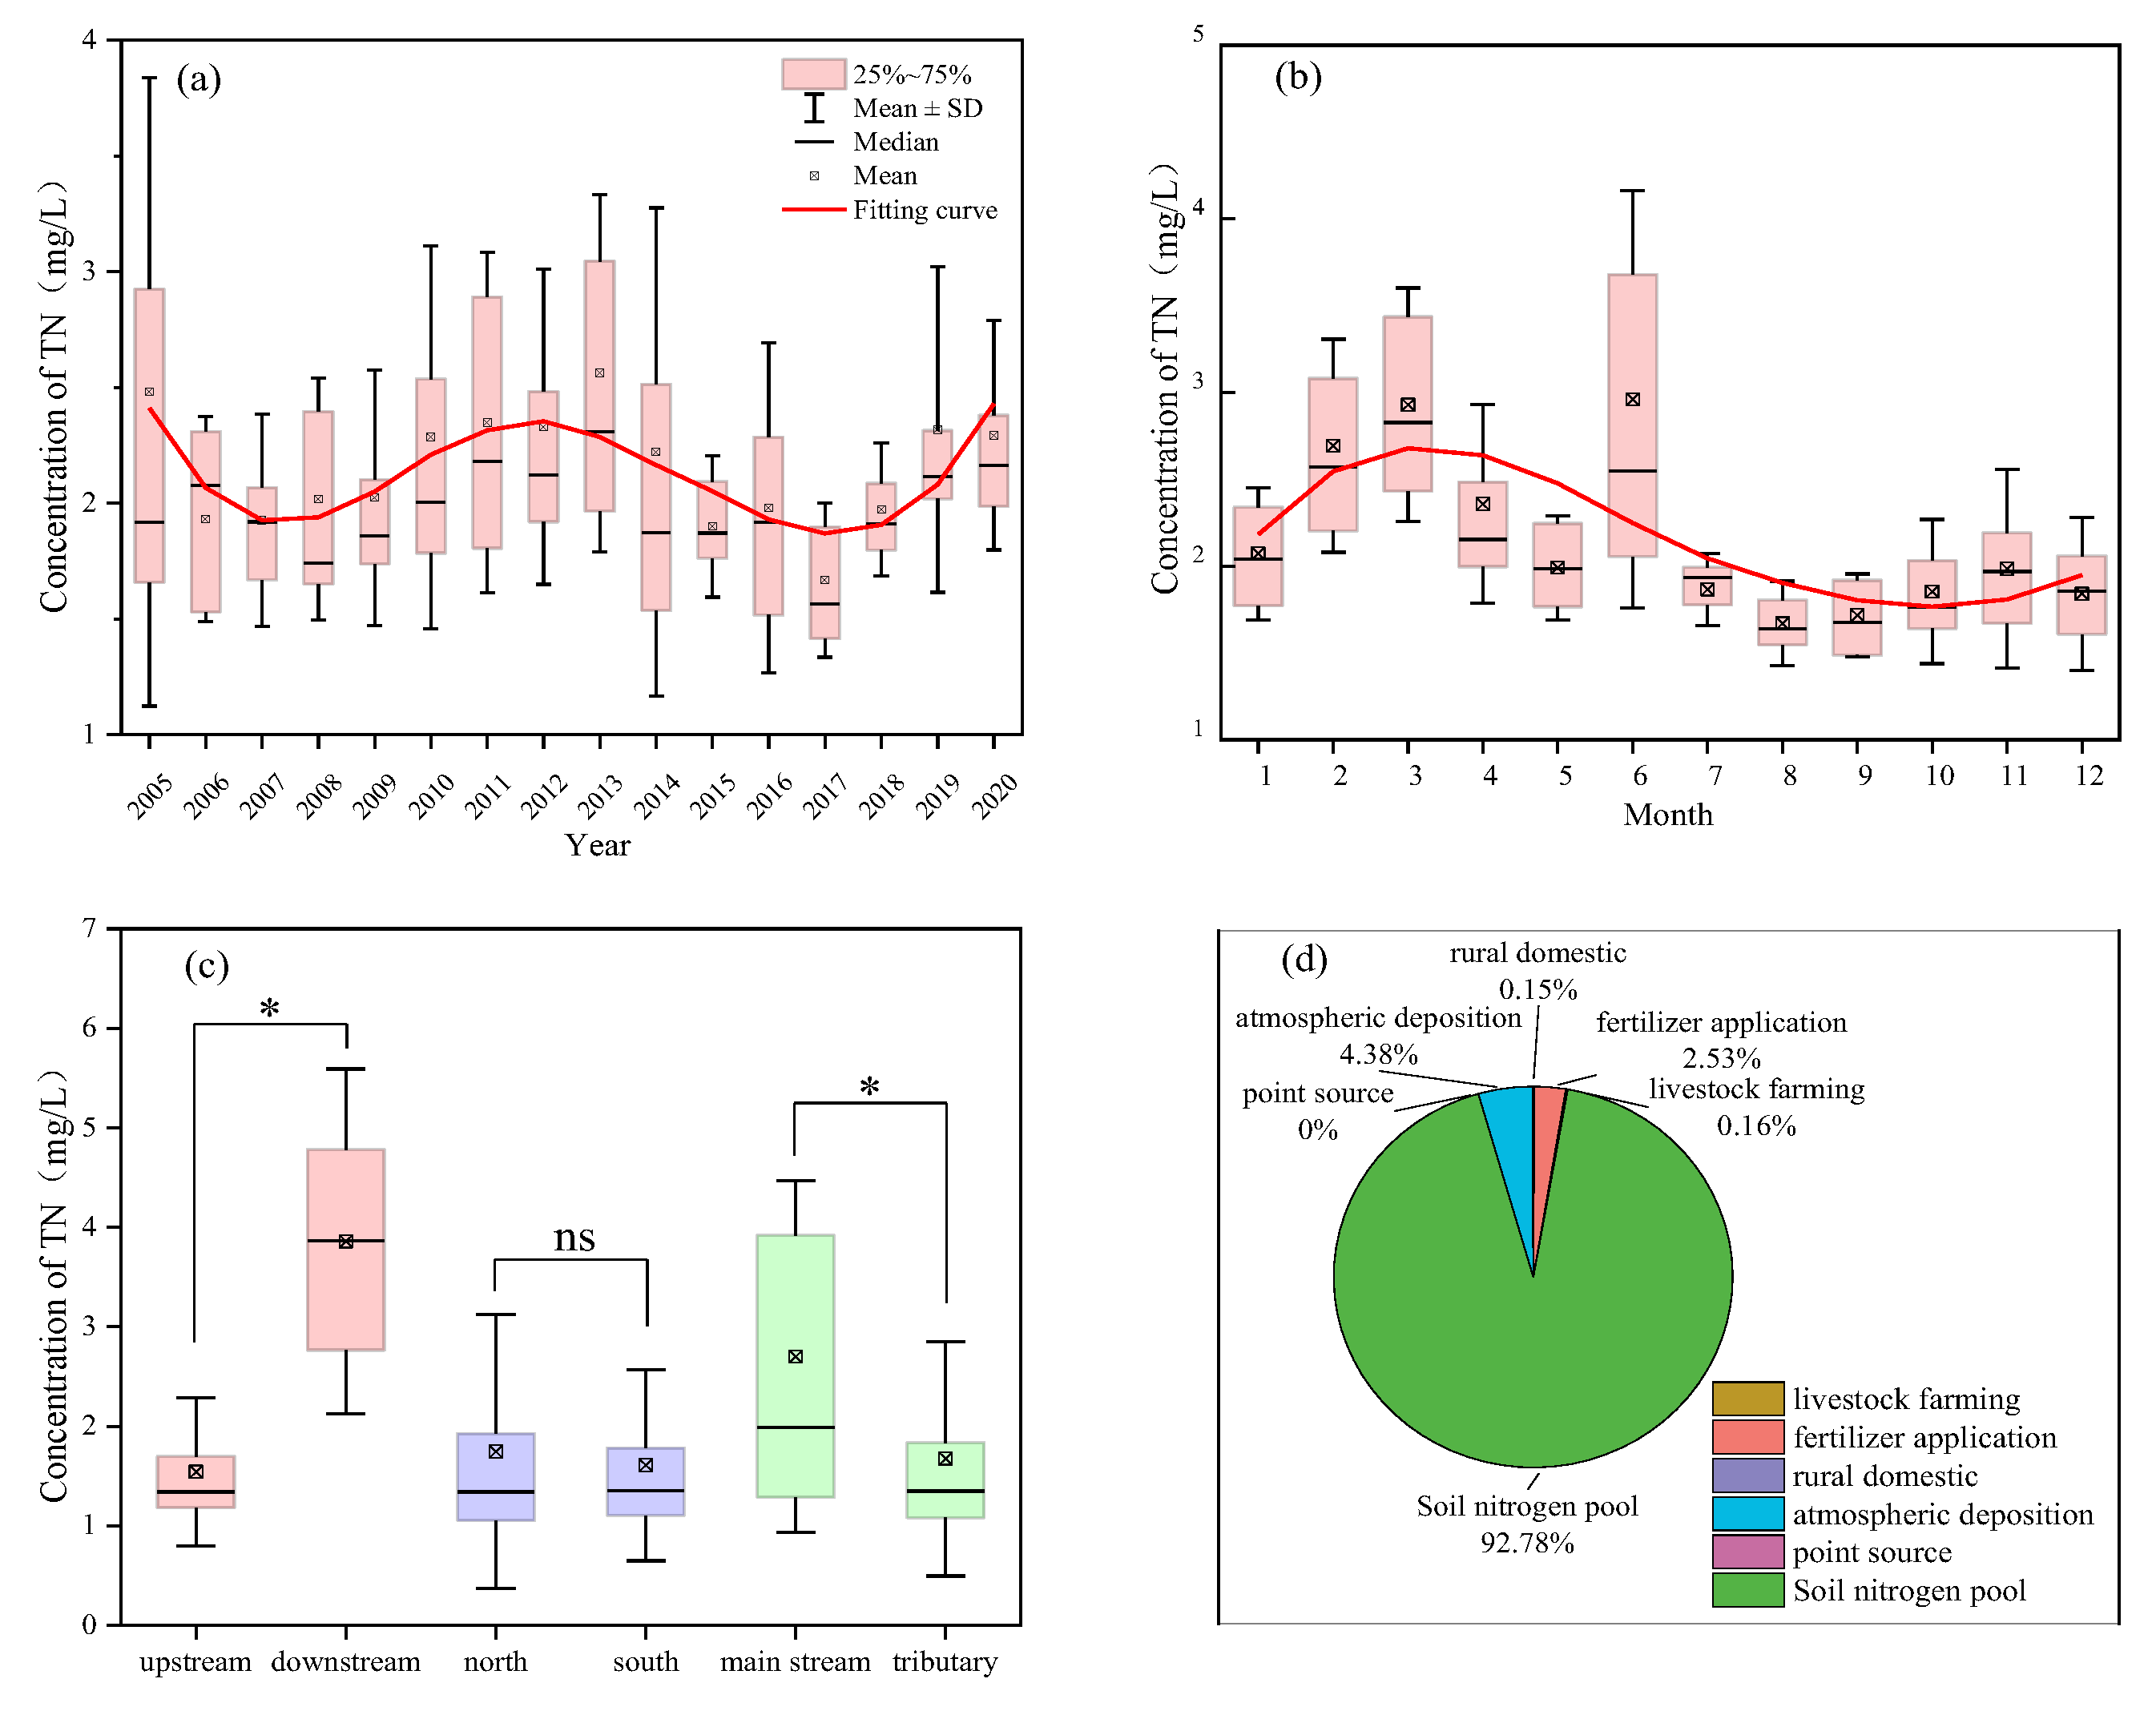
Using the SWAT model, we analyzed interannual and monthly TN emissions in the Hanjiang River basin. The results revealed that the TN concentration in the Hanjiang River exhibited two gentle “V” shaped trends over the 16-year period from 2005 to 2020 (Figure 4a). The first “V” shape occurred from 2005 to 2012, with the lowest point recorded in 2007 at an average concentration of 1.93 mg/L. The second “V” shape, spanning 2013 to 2020, reached its minimum in 2017, with an average concentration of 1.67 mg/L. Overall, the average TN concentration in the Hanjiang River was 2.16 mg/L during the 16 years, with a peak concentration of 2.56 mg/L recorded in 2013.
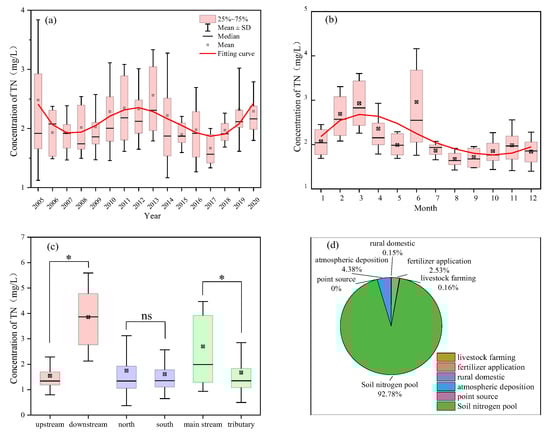
Figure 4.
The variation of interannual tendency (a), monthly tendency (b), spatial difference (c), light red as upstream and downstream, light blue as north and south banks, light green as the main stream and tributaries, and source analysis of nitrogen pollution in the Hanjiang River basin over the past 16 years (d). * indicates a significant difference between means at the level α = 0.05, and ns indicates no significant difference between means at the level α = 0.05.
The Hanjiang River basin exhibited relatively mild nitrogen pollution, with TN concentrations lower than those of many rivers worldwide (Table 1). For instance, the TN concentration in the lower reaches of the Yellow River in China exceeded 7 mg/L [43], while the average TN concentration of the Sąpólna River in Poland was 3.194 mg/L [44]. In contrast, the TN concentration of the Athabasca River in Canada with more green spaces was notably lower, at less than 1 mg/L [45]. Thus, while the nitrogen pollution in the Hanjiang River basin is comparatively low, further control measures are necessary.

Table 1.
Comparison of TN concentration.
Monthly TN concentrations exhibited an upward trend from January to March, followed by a decline from April to August and a subsequent rise from September to December (Figure 4b). Overall, TN concentrations were higher during the dry season compared to the wet season. Notably, TN peaked at 2.929 ± 0.672 mg/L in March during the dry season, while the minimum concentration of 1.669 ± 0.244 mg/L was recorded in August during the wet season. It is worth noting that there was a peak of TN concentration in June, up to 2.960 ± 1.201 mg/L, likely linked to the intensive application of base fertilizers for autumn crops, such as maize and rice. In accordance with the fertilization guidelines from the Ministry of Agriculture and Rural Affairs of the People’s Republic of China, rice cultivation areas are recommended to apply about 150 kg N/ha, with the rice transplanting typically scheduled for the end of May. Meanwhile, maize cultivation areas are advised to apply about 180 kg N/ha, and the sowing period is mainly concentrated in early June. During this time, the water demand for vegetation growth within the river basin increases, while the enhanced precipitation intensity further promotes nitrogen leaching, thereby leading to a rise in the TN concentration.
Further analysis of regional differences in TN concentration within the Hanjiang River basin revealed that upstream regions experienced significantly lower TN pollution than downstream regions (Figure 4c, p < 0.05), with concentrations approximately 64% lower. When the accumulation of pollutants exceeds the self-purification capacity of a river, the concentration of pollutants in the river tends to increase. The Hanjiang River originates from the Qinling Mountains, which are characterized by good forest and grassland cover. As the altitude decreases, the terrain gradually becomes gentler. Along the banks of the Hanjiang River, human activities have become more concentrated, leading to the formation of urban areas such as Ankang and Shiyan. These urban areas have increased nitrogen inputs from sources such as fertilizers, livestock manure, domestic sewage, and industrial wastewater. Consequently, the TN concentration in the downstream regions may be relatively higher. Among tributaries along the north and south banks of the Hanjiang River, TN concentration on the north bank was only 8.59% higher than those on the south bank, showing no significant difference. Moreover, TN concentration in the main stream of the Hanjiang River was 61% higher than in the tributaries (p < 0.05). This was associated with the concentration of farmland and urban areas along the gently sloping banks of the main stream.
Further research into diverse nitrogen emission scenarios and a quantitative assessment of the contributions of various pollution sources to TN pollution in the Hanjiang River basin revealed that the soil nitrogen pool was the primary source, accounting for 92.78% of the total (Figure 4d). Other contributors included atmospheric deposition (4.38%), fertilizer application (2.53%), livestock farming (0.16%), rural living (0.15%), and point sources (0%). Chen et al. [52] researched the Wen-Rui Tang River basin in Zhejiang Province, China, and found that nitrogen emissions from the soil nitrogen pool ranked second only to those from urban wastewater. The proportion of construction land in the Hanjiang River basin is only about 0.4% [24], in stark contrast to about 40% in the Wen-Rui Tang River basin. This indicated that the contribution of urban wastewater to nitrogen emissions was relatively lower, thereby highlighting the significance of the soil nitrogen pool. Ye et al. [53] conducted an analysis of nitrogen runoff from the Han, Rong, and Lian rivers in Guangdong Province, China, which revealed that in rural areas, the soil nitrogen pool was the principal source of nitrogen emissions, accounting for approximately 68% of the total emissions. Moreover, the Hanjiang River basin received approximately 40% less annual rainfall (800–1100 mm) compared to the Han, Rong, and Lian Rivers basin (1670–1720 mm), reducing the risk of wet deposition of nitrogen and fertilizer leaching [54]. Consequently, this situation increased the contribution of nitrogen emissions from the soil nitrogen pool.
The excessive and irrational application of chemical fertilizers in agricultural production led to a substantial surplus of nitrogen in the soil, which has been persistently degrading water quality [55]. Liu et al. [56] found that between 1900 and 2015, soil nitrogen surpluses in the Yangtze and Pearl River basins exhibited an increasing trend, which in turn drove an upward trend in groundwater nitrogen loads. The accumulation of excess nitrogen has made it extremely challenging to achieve short-term improvements in water quality. Meter et al. [55] found that it could take nearly 35 years to mitigate the biogeochemical impacts of 142 Tg of residual soil nitrogen in the Mississippi River Basin. Despite China’s commitment to achieving zero net growth in chemical fertilizer use by 2020 and optimizing wastewater treatment facilities, the residual nitrogen issue may have become a significant source of water pollution [57,58]. Thus, the key to controlling nitrogen pollution in the Hanjiang River Basin lies in the scientific management of the soil nitrogen pool to mitigate the effects of nitrogen legacy.
3.3. Distribution of Nitrogen in Different Forms
Nitrogen typically exists in various chemical forms. The inorganic nitrogen composition was similar to that of Indonesia’s Batang Arau River, Mexico’s El Fuerte River, and Turkey’s Kucuk Menderes River (Table 2). This research analyzed the content of nitrogen in various chemical forms within the Hanjiang River basin during both wet and dry seasons, finding average concentrations of TN, –N, –N, –N, and DON (Figure 5) to be 3.01 mg/L, 1.66 mg/L, 0.21 mg/L, 0.02 mg/L, and 1.11 mg/L, respectively. Due to the use of sulfuric acid for acidification and preservation during the experimental design, nitrite nitrogen was converted to nitrate nitrogen, resulting in an underestimation of nitrite nitrogen concentrations [59].
Table 2.
Comparison of inorganic nitrogen concentration.
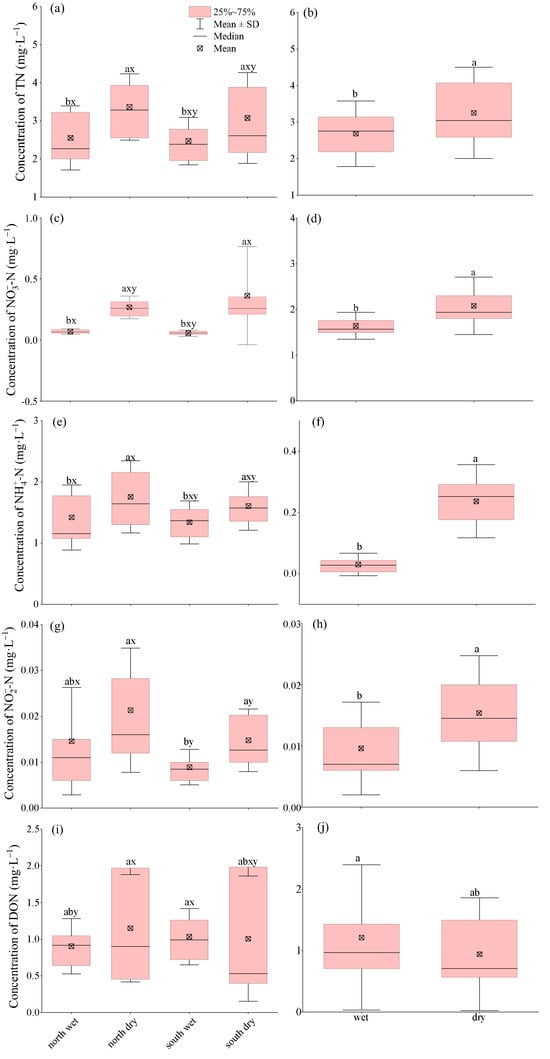
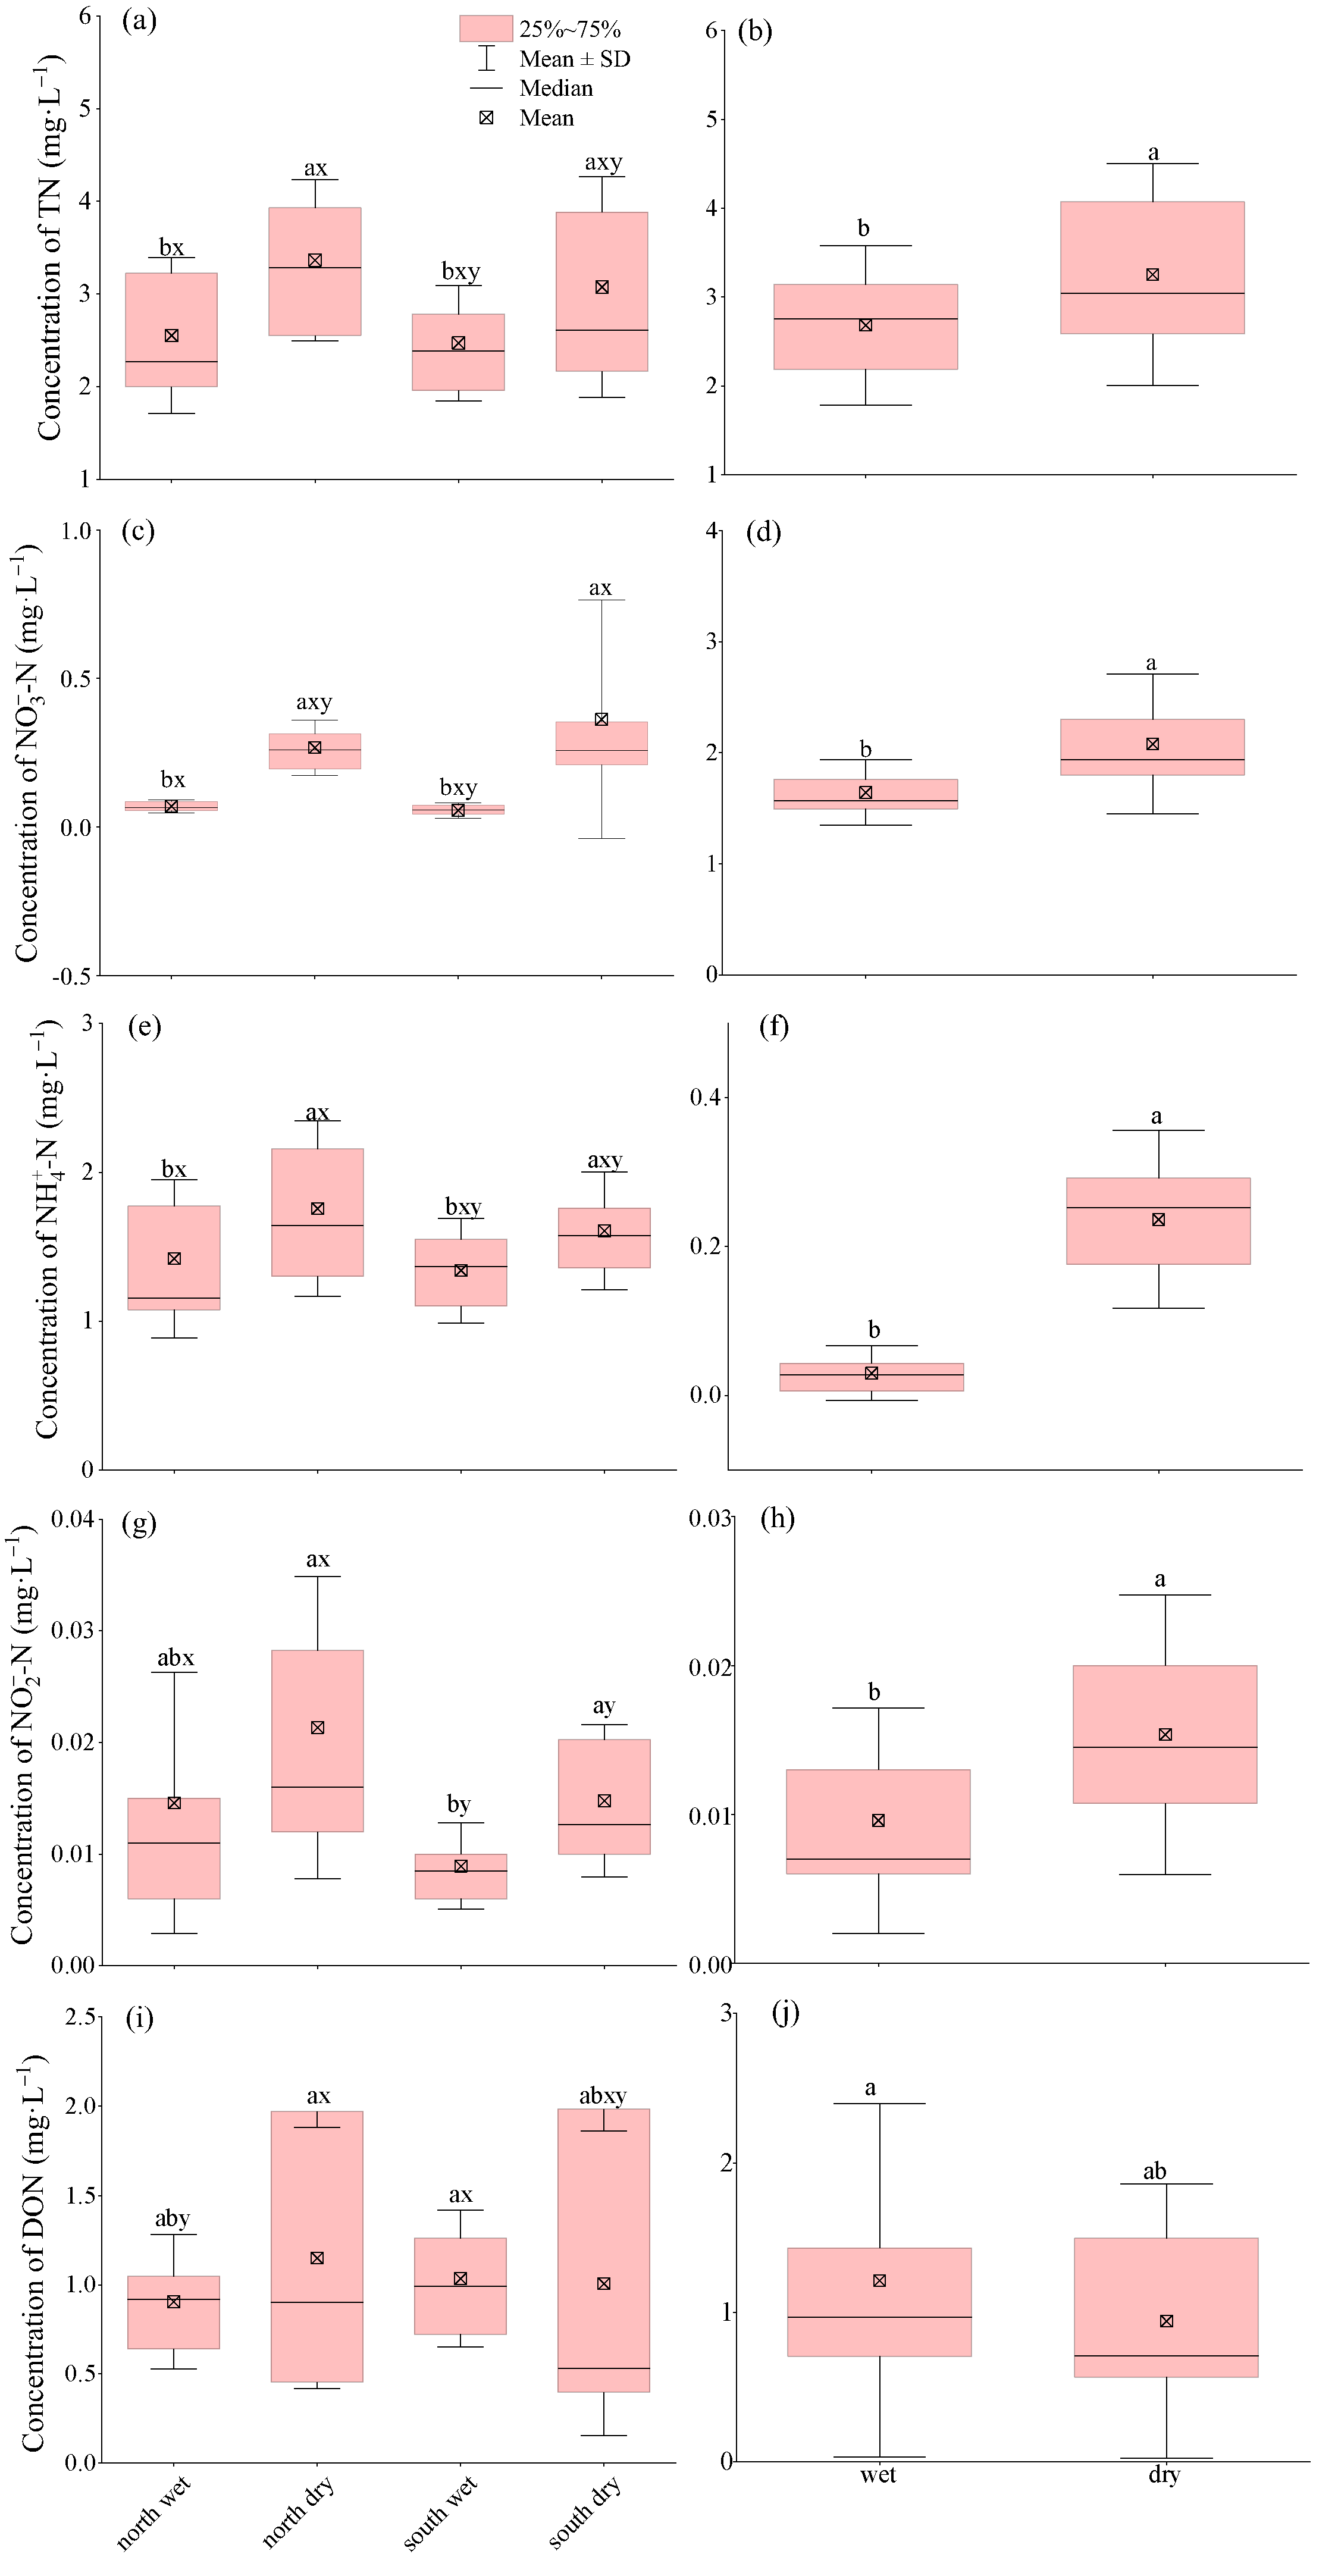
Figure 5.
The variation of tributary TN (a) and main stream TN (b), tributary –N (c) and main stream –N (d), tributary –N (e) and main stream –N (f), tributary –N (g) and main stream –N (h), and tributary DON (i) and main stream DON (j) in the Hanjiang River basin during wet and dry seasons. a and b indicate significant differences (p < 0.05) of different nitrogen forms between wet and dry seasons. x and y indicate significant differences (p < 0.05) of different nitrogen forms between the tributaries of the north and south banks.
Compared to the same period in 2021 to 2022, the concentrations changed by +6.4%, −17.1%, +157%, −77.4%, and +67.8%, respectively (Figure S2). Additionally, –N was the predominant form of nitrogen in the runoff, comprising approximately 55.23% of the TN content, consistent with findings from many river systems, such as the Nala watershed of the Pearl River basin [62] and the East Tiaoxi River basin [44], where –N constituted 80% and 47% of the TN respectively. The variation of nitrogen concentrations in different chemical forms between the north and south banks of the Hanjiang River was generally not significant, except for –N (Figure 5g), which was significantly higher on the north bank at 0.018 ± 0.013 mg/L compared to 0.012 ± 0.006 mg/L on the south bank. Furthermore, the concentrations of TN and –N (Figure 5a,c) on the north bank of the Hanjiang River were slightly elevated compared to the south bank, by 6.8% and 7.6%, respectively.
Nitrogen concentrations exhibit notable fluctuations between dry and wet seasons. For instance, Bu et al. [63] observed that –N levels were significantly elevated during the wet season in the Taizi River basin, while TN, –N, and –N were higher during the dry season. Shi’s sampling and analysis in the Dan River basin [64] revealed that both –N and –N levels were higher during the wet season. However, this study identified that the concentrations of TN, –N, –N, and –N during the wet season were significantly (p < 0.05) lower than those observed in the dry season, with reductions of 13%, 15%, 79%, and 49%, respectively. This discrepancy may be attributed to the stronger dilution effect of precipitation on nitrogen levels in the Hanjiang River basin, despite rainwater introducing nitrogen pollutants into the rivers. Moreover, the concentrations of DON were recorded at 1.179 ± 0.666 mg/L in the wet season and 1.046 ± 0.744 mg/L in the dry season, with no significant differences detected between the two periods. The concentration of organic nitrogen and inorganic nitrogen frequently exhibit a negative correlation, attributable to the dynamic transformation processes between these two forms of nitrogen. These transformations may include the assimilation of inorganic nitrogen by aquatic organisms to synthesize essential organic compounds and bacterial ammonification of DON in aquatic environments [65,66]. During the wet season, as temperatures rise and biological activities become more vigorous, the conversion of inorganic nitrogen into organic nitrogen may be enhanced. This process likely results in a less pronounced decrease in organic nitrogen concentration during the flood season despite the dilution effect.
Li et al. [13] conducted a study in 2008 that highlighted increased nitrogen pollution levels during the wet season in the Hanjiang River basin, attributing this phenomenon to heightened agricultural activities. According to FAO statistics, the nitrogen fertilizer application intensity in China was 213.92 kg N/ha in 2008, which decreased to 191.55 kg N/ha in 2022. In fact, since the peak nitrogen fertilizer application intensity of 235.38 kg N/ha in 2014, there has been a year-on-year decline in nitrogen fertilizer application intensity in China, reflecting the increasing stringency of China’s management of non-point source pollution. It is possible that after nearly 15 years of pollution management, non-point source agricultural pollution in the Hanjiang River has been relatively well controlled, resulting in lower nitrogen concentrations during the wet season. In addition, the precipitation in 2008 was about 861 mm, while the precipitation in 2022 was about 1098 mm, which may make the nitrogen load in the wet season more diluted.
3.4. Driving Factors of TN Spatial Heterogeneity
Both SWAT model simulation and field sampling analysis revealed notable spatial distribution differences in nitrogen emissions. Therefore, the relationship between spatial heterogeneity of TN and various factors such as climatic conditions (annual precipitation and average annual temperature), physical environment (average elevation), and human activities (night light, population density, and land use intensity) was further studied. Our findings indicated a significant linear correlation between TN emission intensity and five of these factors, except for land use intensity, in the Hanjiang River basin (Figure 6, p < 0.05). Among them, the correlation coefficient between TN emission intensity and annual precipitation was the highest, reaching 0.53, indicating a significant positive correlation. Both increased precipitation and rainfall intensity enhance water erosion [67], which accelerates nitrogen migration [68], contributing to a strong linear relationship with TN emission intensity. Additionally, there was a significant correlation between TN emission intensity and average elevation, with a correlation coefficient of 0.33. This suggests that the higher altitude areas, which are predominantly mountainous and characterized by steeper slopes, facilitate the migration of nitrogen pollutants, leading to increased TN emission intensity. Furthermore, since land use intensity, night light, and population density all reflect the influence of human activities, there was a very significant (p < 0.001) linear correlation among these factors.
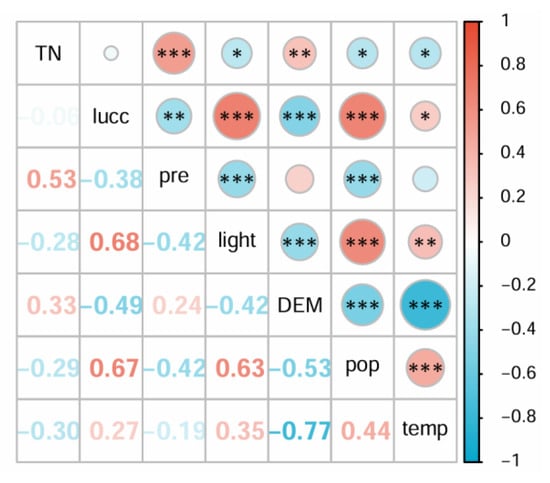
Figure 6.
The Pearson correlation between TN emission intensity and its driving factors. *, ** and *** indicate significance levels α = 0.05, 0.01 and <0.001, respectively. TN: total nitrogen emission intensity; lucc: land use intensity; prep: annual precipitation; light: night light; DEM: average elevation; pop: population density; temp: average annual temperature.
Geographical detectors are commonly employed to assess the influence of various factors on pollution. In the Three Gorges Reservoir area, pig breeding volume and rural population significantly affected the intensity of TN emissions [69]. In the Wu River basin, anthropogenic factors such as cultivated land, livestock, fertilization, and population were the primary drivers of TN spatial variation [70]. This study quantitatively evaluated the explanatory power of these driving factors on the spatial heterogeneity of TN emission intensity, finding that annual precipitation had the greatest impact (61.4%, Table 3), followed by average annual temperature (30.1%), average elevation (29.7%), night lights (23.0%), population density (20.5%), and land use intensity (14.2%). Notably, annual precipitation, average elevation, and night lights were statistically significant (p < 0.05). The sources of TN likely contribute to these findings: the Three Gorges Reservoir area was primarily affected by rural living, livestock and poultry, and fertilizer application [69], while approximately 45% of TN emission in the Wu River basin originated from fertilizer use [70]. In contrast, 90% of nitrogen emissions in the Hanjiang River basin came from the natural soil nitrogen pool, with spatial variation in TN emissions being more significantly influenced by climatic and natural factors. In summary, climatic factors, particularly precipitation, were the key determinants of spatial heterogeneity in TN distribution in the Hanjiang River basin.
Table 3.
The driving factors of spatial heterogeneity about TN emission intensity.
3.5. Sustainability Change Under Climate Change
Climate change poses a significant global challenge, affecting sustainable development across various sectors, including agriculture, ecological environments, and hydrological cycles. Numerical simulation methods are frequently employed to assess the effects of climate change on water resources within river basins. In the Ganges River basin in India [71], CanESM5 exhibited the highest correlation of 0.169, and BCC-CSM2-MR showed the lowest NRMSE of 0.301, indicating their relative efficacy in simulating precipitation patterns in the region. Similarly, Jia et al. [72] evaluated the applicability of eight climate models in the source region of the Yellow River, finding that both temperature and precipitation correlations exceeded 0.8, reflecting satisfactory simulation accuracy. To investigate the trends in runoff and nitrogen emission changes in the Hanjiang River basin influenced by climatic factors, the latest CMIP6 climate models were employed. This study identified that the NorESM2-MM model demonstrated the highest correlation coefficient (0.70) and the lowest NRMSE (0.80) in precipitation simulation, indicating a robust representation of precipitation conditions in the Hanjiang River basin (Figure S3a). Furthermore, all climate models demonstrated high correlation coefficients (0.92–0.95) and low NRMSE (0.25–0.39) for simulating maximum and minimum temperatures, showcasing their strong capability in modeling temperature conditions in the basin (Figure S3b,c). Overall, the NorESM2-MM climate model displayed superior applicability for predicting future climate changes in the Hanjiang River basin.
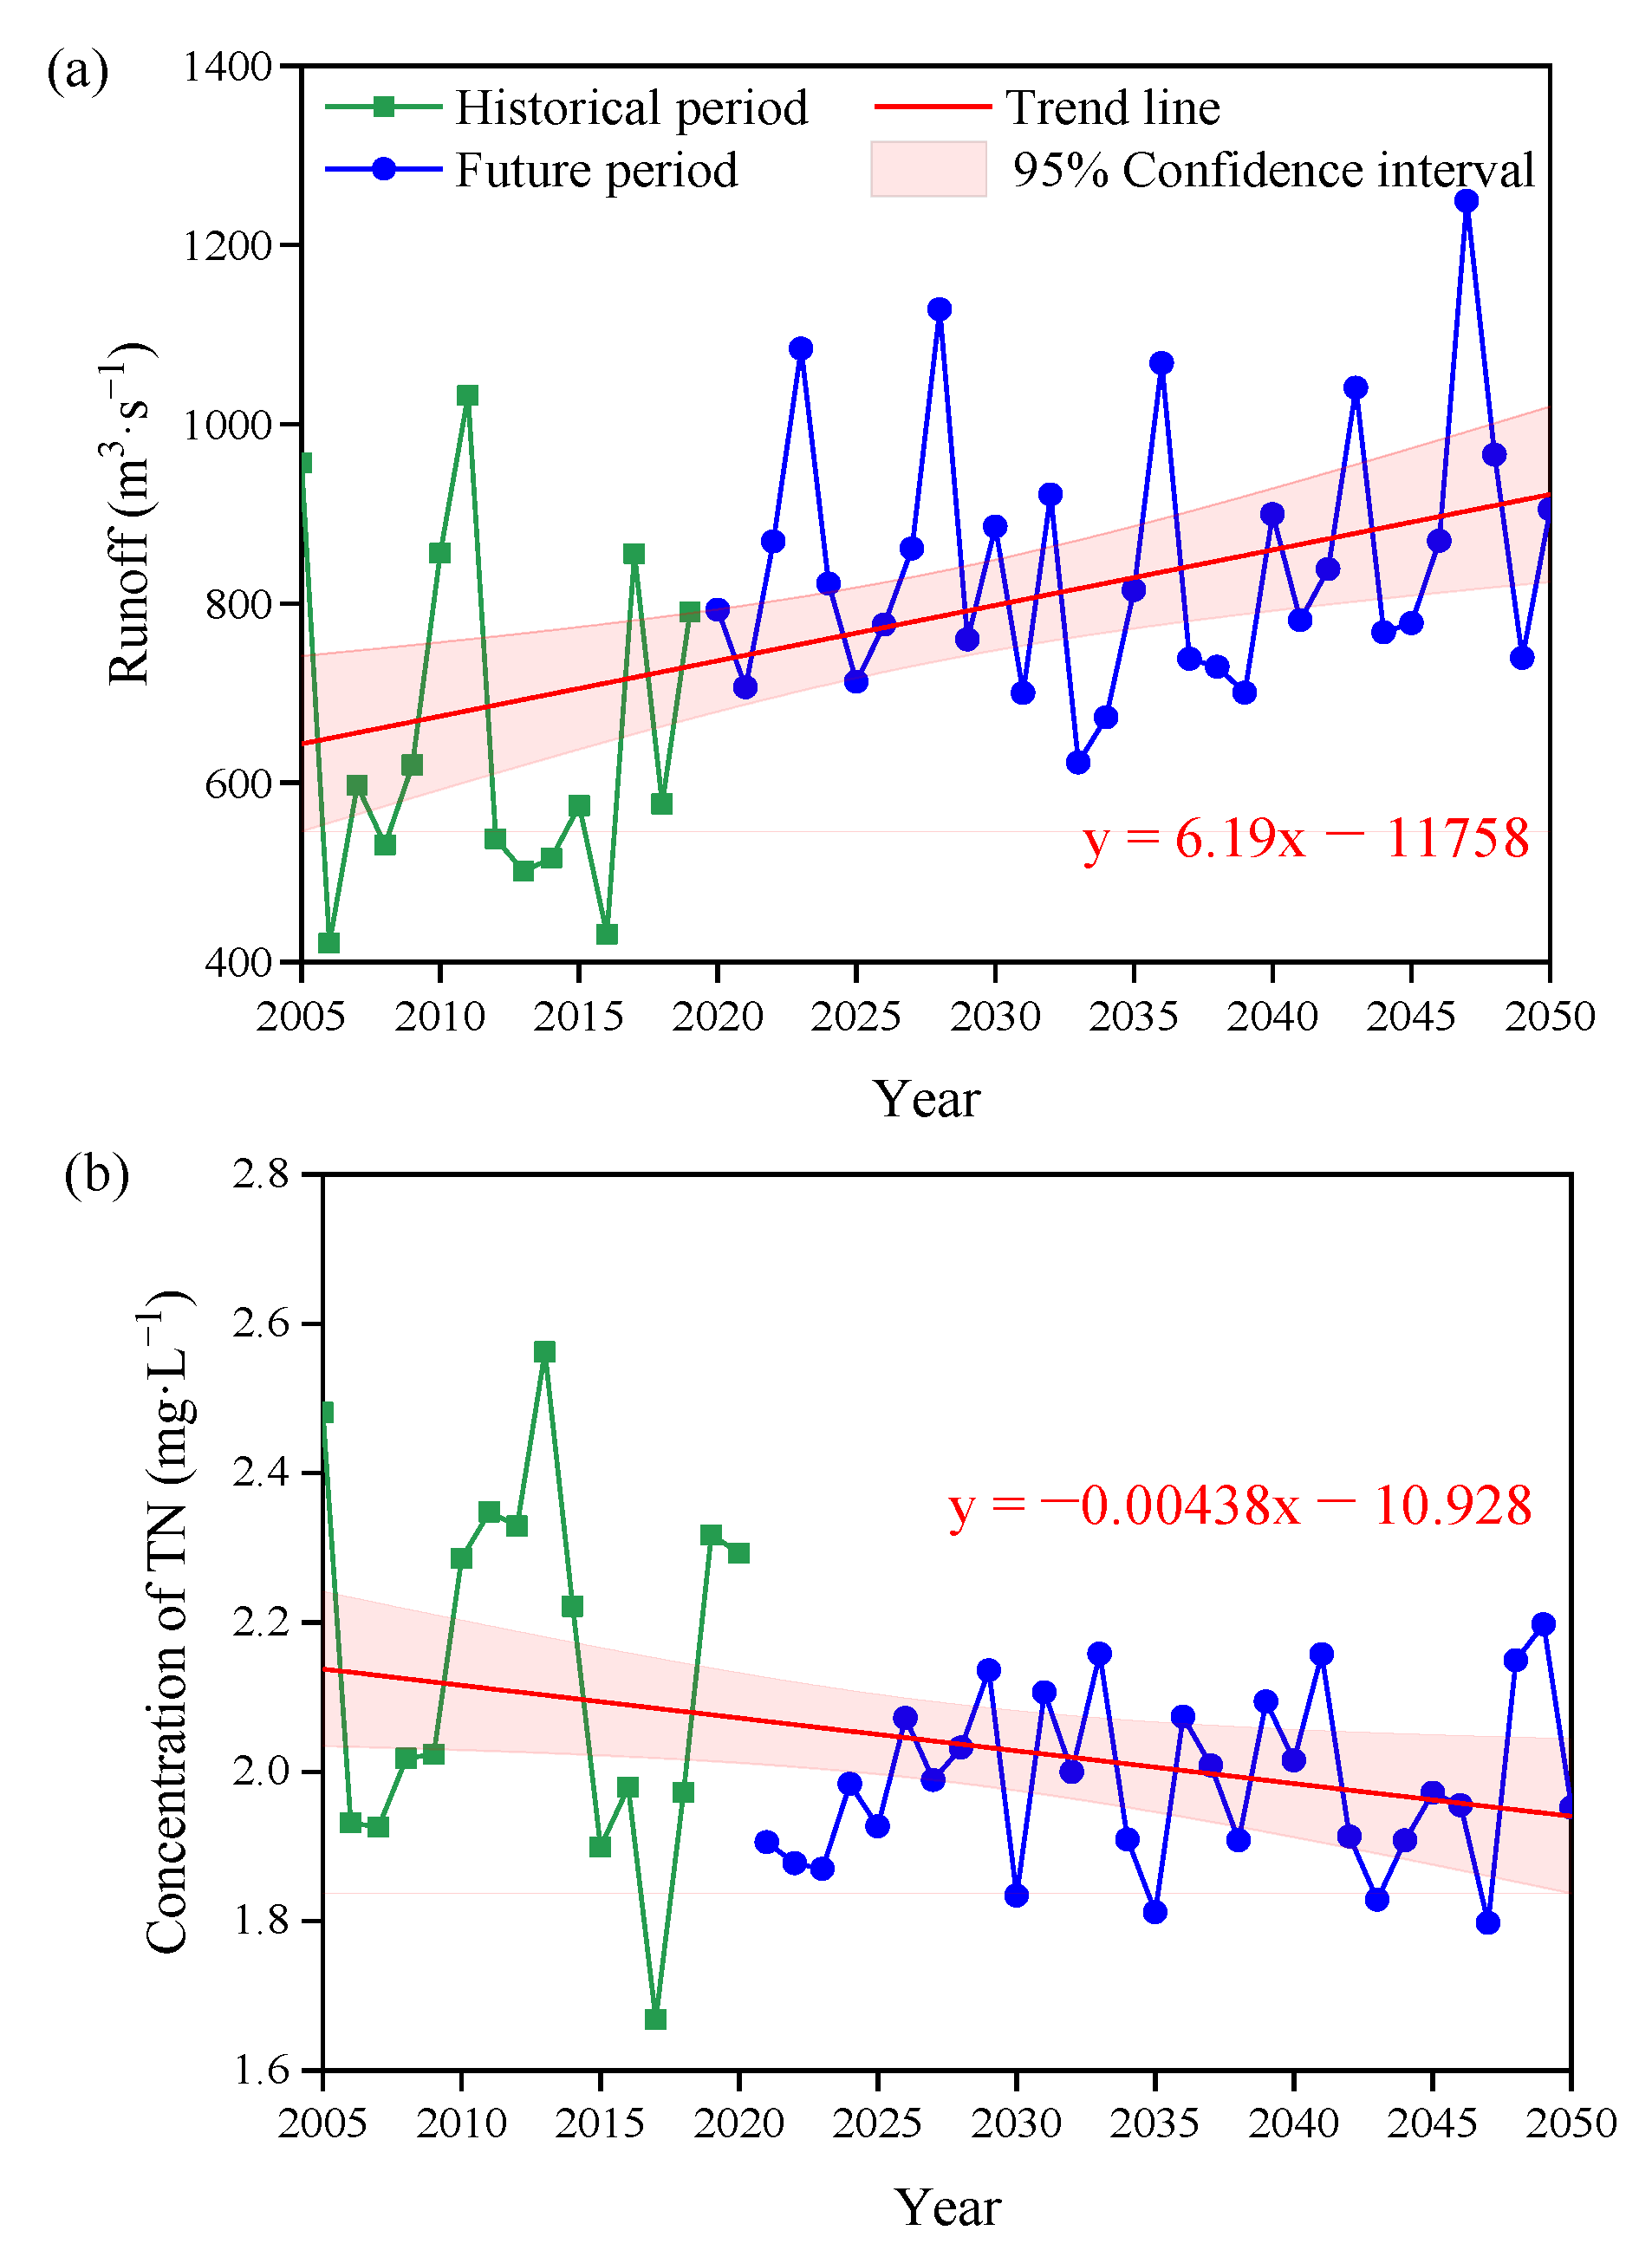
By 2050, many water sources are projected to exhibit a similar trend of increasing runoff. Due to the impact of glacier melting and precipitation changes, the total runoff in the source region of the Yangtze River is expected to increase at an annual rate of 4.2 m3/s [73]. The annual runoff in the Changbai Mountain basin is projected to increase by 1.5 to 1.7 m3/s [74]. Additionally, Ethiopia’s Lake Tana basin may experience an unprecedented runoff increase of up to 220% [75]. After integrating four distinct climate scenarios, it was predicted that the average annual runoff in the Hanjiang River basin would increase by 6.19 m3/s (Figure 7a), indicating that the sustainability of water resources in the region would be improved in the future and water resources supply would be more abundant.
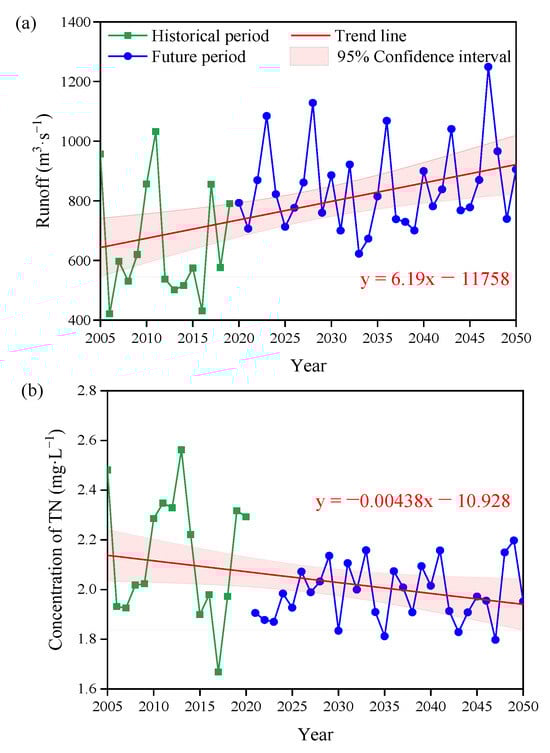
Figure 7.
The changes of runoff tendency (a) and TN tendency (b) in the Hanjiang River basin under global climate change. The green dots are historical modeled values, the blue dots are future predicted values, and the red line is linear fitting curves.
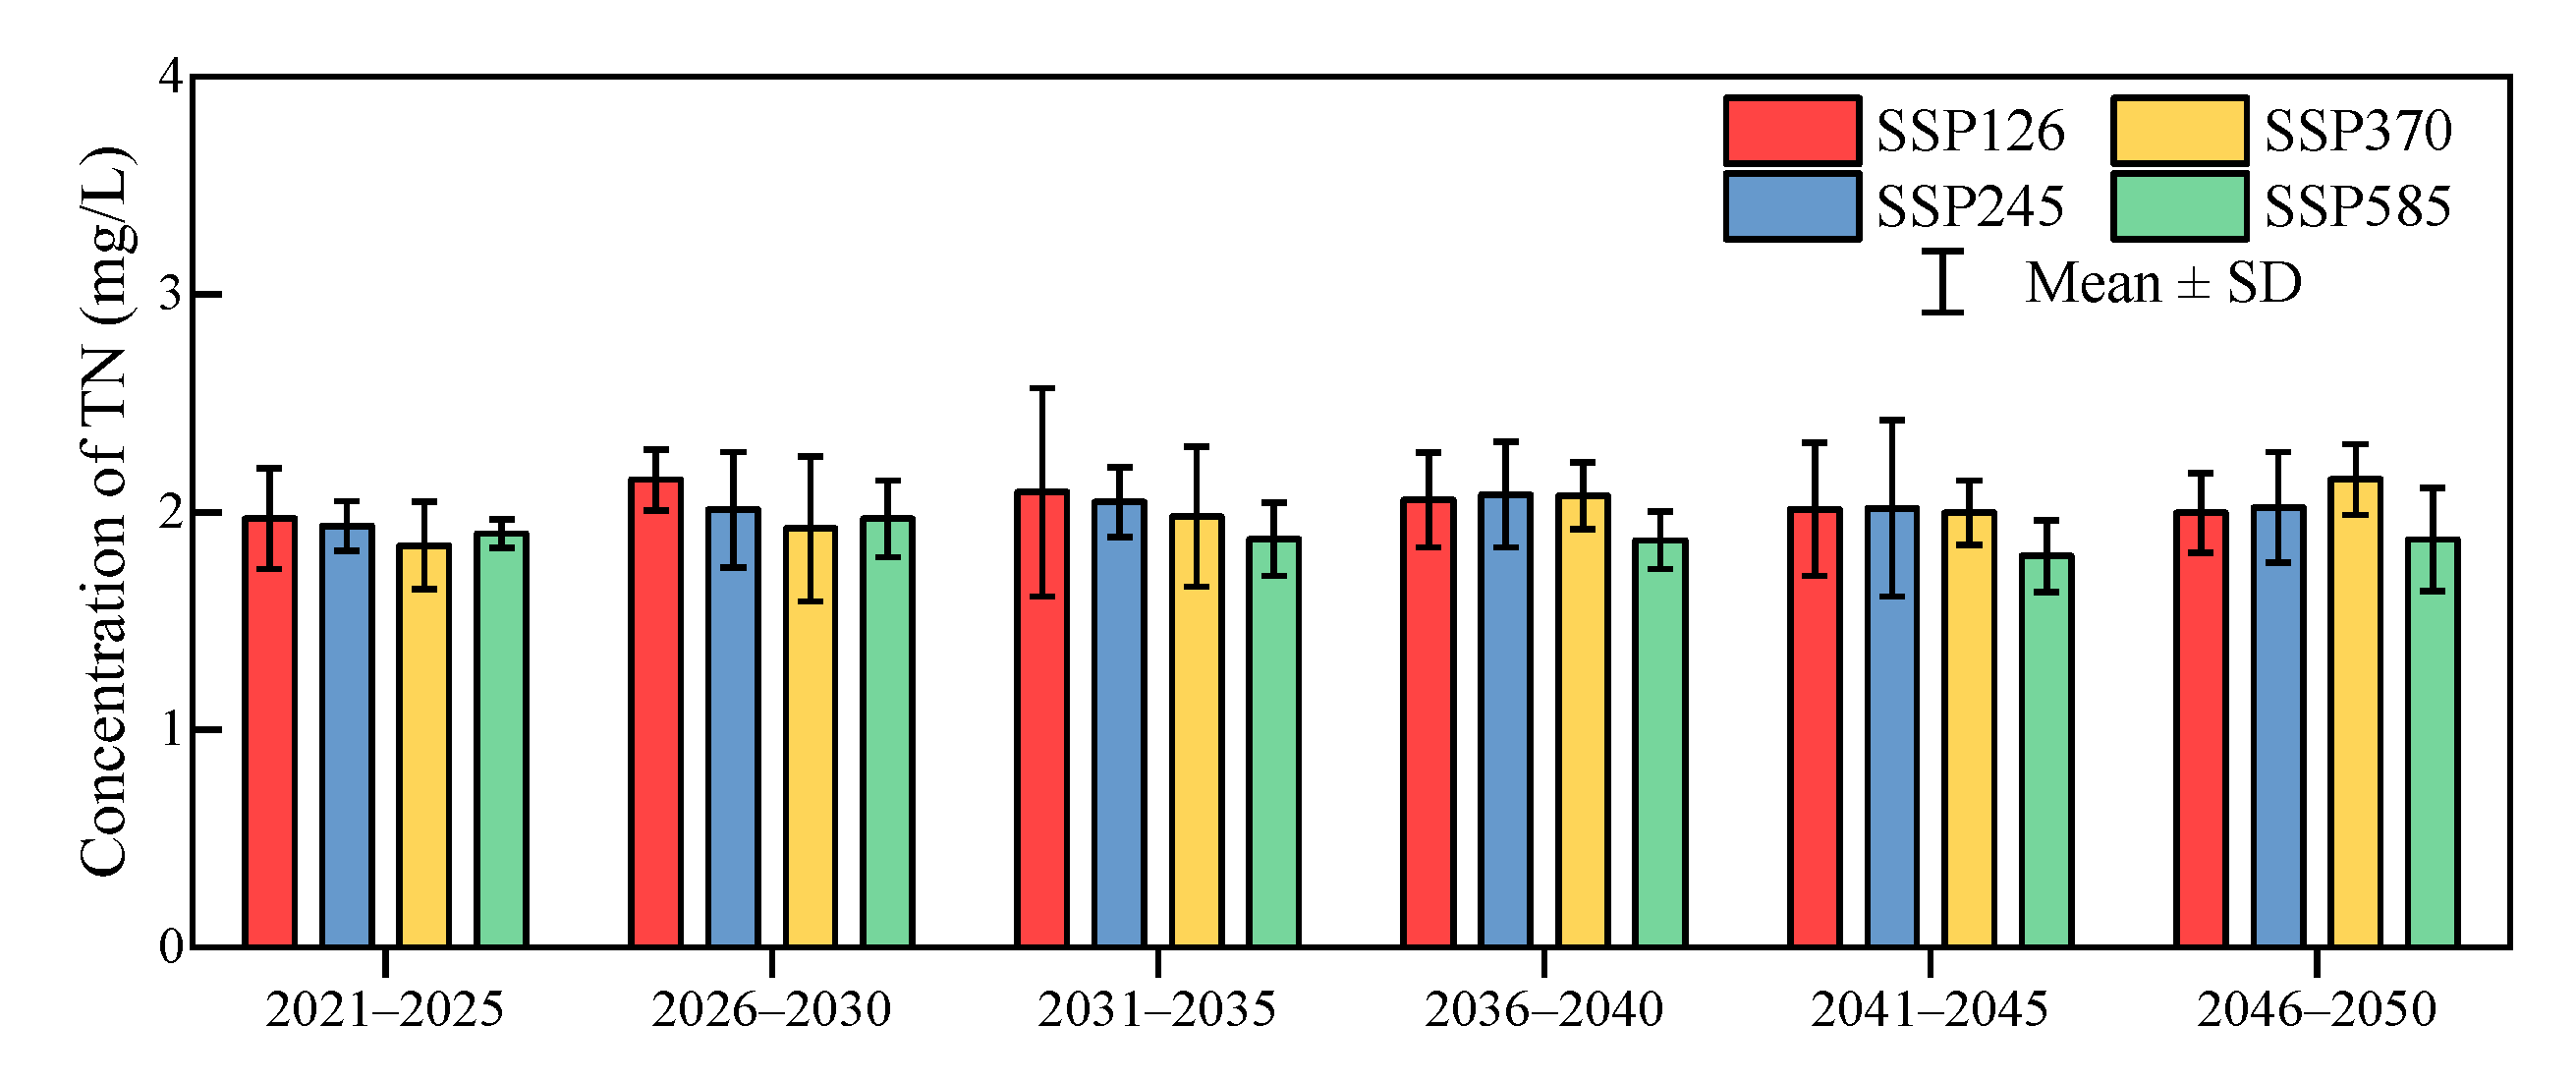
In contrast to the anticipated runoff trends, TN concentration in the Hanjiang River basin exhibited a slight downward trend under global climate change (Figure 7b), with an average annual decrease of approximately 0.004 mg/L. Mann–Kendall trend test (Figure S4) found that the UF statistics (p = 0.12) were predominantly below zero, except for the period from 2012 to 2014, indicating a decreasing trend of TN concentration throughout the study period. Based on the SSP126, SSP245, SSP370, and SSP585 climate scenarios, the average TN concentrations in the basin from 2021 to 2050 were predicted to be 2.045 ± 1.275 mg/L, 2.018 ± 1.198 mg/L, 1.995 ± 1.237 mg/L and 1.881 ± 1.044 mg/L, respectively (Figure 8). These projections were lower than the historical average of 2.161 ± 1.087 mg/L from 2005 to 2020, suggesting that TN levels in water quality are expected to remain favorable across various climate scenarios. Similarly, Mack et al. [76] found that under SSP245 and SSP585 scenarios, total nitrogen concentrations in European surface waters are projected to decrease by 2060 but emphasize that more aggressive measures are needed to alleviate the impacts of human activities. Overall, under future climate change projections, nitrogen sustainability in the Hanjiang River basin is anticipated to improve. Moreover, since 2014, the intensity of nitrogen fertilizer use in China has been declining year by year. China has been making unremitting efforts to reduce fertilizer application, steadily promote precision agriculture, and continue to follow the path of green development. People can control agricultural non-point source pollution through active policies and measures, which will certainly help to improve the quality of the water environment. Thus, the future water storage and quality in the Han River basin are relatively optimistic.
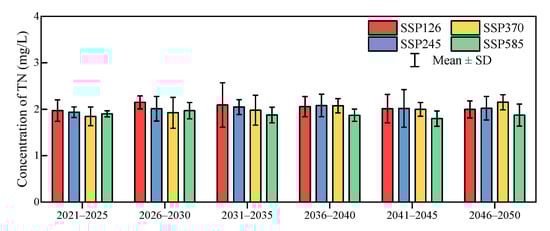
Figure 8.
Changes in TN pollution under different climate scenarios.
This study also has several limitations. Specifically, the nitrogen legacy issue in the Hanjiang River basin necessitates a long-term remediation process. Future research could further explore appropriate agricultural management practices to improve soil nitrogen legacy. Additionally, this study did not account for the impact of human activities on water resources in the Hanjiang River basin. Future research should consider the effects of human policies, such as the reduction of fertilizer application, on the control of agricultural non-point source pollution and water environment management.
4. Conclusions
In summary, the SWAT simulation analysis of the Hanjiang River basin indicated an average TN concentration of 2.16 mg/L from 2005 to 2020. Notably, pollution levels were lower during the dry season compared to the wet season, with slightly higher concentrations observed on the north bank than on the south bank. Further source analysis highlighted the significance of the soil nitrogen pool in nitrogen emissions, accounting for 92.78% of the total emissions. Meanwhile, sampling data indicated that during the wet season, the concentration of inorganic nitrogen was relatively lower, likely due to the dilution effect of increased rainfall. Under global climate change, precipitation was forecasted to significantly influence nitrogen emissions in the Hanjiang River basin. Projections suggested that between 2020 and 2050, the annual average runoff in the Hanjiang River would increase by 6.19 m3/s annually, while the average TN concentration was anticipated to decrease by 0.004 mg/L annually. Overall, this trend indicated that the Hanjiang River basin would provide more abundant and cleaner water resources in the future, supporting enhanced sustainability. Implementing precision agriculture practices can help reduce nitrogen and phosphorus emissions into the Hanjiang River associated with precipitation events. By prioritizing these strategies, we may effectively mitigate pollution and promote the long-term health of the Hanjiang River ecosystem, ultimately benefiting both the environment and local society. In summary, ongoing efforts to improve the sustainability of water resources will be vital in ensuring water security for the sustainable economic and social development of the Beijing–Tianjin–Hebei region.
Supplementary Materials
The following supporting information can be downloaded at: https://www.mdpi.com/article/10.3390/su17041523/s1, Figure S1. Variation trend of interannual precipitation in Hanzhong (a), Yangxian (b), Ankang (c), and Baihe (d) in the last 18 years, where the blue dot is the annual precipitation, and the black dotted line is the average precipitation. Figure S2. The variation of tributary TN (a) and main stream TN (b), tributary –N (c) and main stream –N (d), tributary –N (e) and main stream –N (f), tributary –N (g) and main stream –N (h), and tributary DON (i) and main stream DON (j) in the Hanjiang River basin during wet and dry seasons in 2021 and 2023. a and b indicate significant differences (p < 0.05) of different nitrogen forms between wet and dry seasons. Figure S3. Taylor diagram (correlation, standard deviation, and normalized root mean square error) of precipitation, maximum temperature, and minimum temperature from different GEMs after downscaling during 2000-2013. (a) Precipitation, (b) maximum temperature, and (c) minimum temperature. Figure S4. Mann–Kendall trend test for TN pollution in Hangjiang River basin. Where the UF statistic (red line) greater than 0 indicates an upward trend, and less than 0 indicates a downward trend. The significance between the purple dotted lines is p > 0.10, and the significance between the purple dashed lines is p < 0.10. Table S1. The sensitive parameters were calibrated by SWAT-CUP.
Author Contributions
Data curation, software, visualization, writing—original Draft, Y.Z. (Yuchen Zhang); methodology, writing—review and editing, funding acquisition, Y.Z. (Yan Zhao); conceptualization, writing—review and editing, funding acquisition, supervision, Y.C. All authors have read and agreed to the published version of the manuscript.
Funding
This research was funded by the Science and Technology Program of Shaanxi Academy of Science, grant number NO. 2023k-02, and Shaanxi Youth Science and Technology New Star Project, grant number NO. 2023KJXX-100.
Institutional Review Board Statement
Not applicable.
Informed Consent Statement
Not applicable.
Data Availability Statement
The data are available upon reasonable request.
Acknowledgments
We are thankful for the help in implementing the experiment by Yuanyuan Zhang, and the useful discussions and valuable comments from Jiahong Guo, Yao Jiang and Hanwen Tian.
Conflicts of Interest
The authors declare no conflicts of interest.
Abbreviations
The following abbreviations are used in this manuscript:
| TN | total nitrogen |
| –N | nitrate nitrogen |
| –N | nitrite nitrogen |
| –N | ammonia nitrogen |
| DON | dissolved organic nitrogen |
| SWAT | soil and water assessment tool |
| SSP | shared socioeconomic pathways |
| DEM | digital elevation model |
| GCM | general circulation models |
| r | correlation coefficient |
| NRMSE | normalized root mean square error |
| R2 | coefficient of determination |
| NSE | Nash efficiency coefficient |
References
- UNESCO World Water Assessment Programme. The United Nations World Water Development Report 2018: Nature-Based Solutions for Water; UNESCO: Paris, France, 2018. [Google Scholar]
- Partnership Water Partnership. Towards Water Security: A Framework for Action; Global Water Partnership: Stockholm, Sweden; London, UK, 2000. [Google Scholar]
- UNESCO World Water Assessment Programme. The United Nations World Water Development Report 2024: Water for Prosperity and Peace; UNESCO: Paris, France, 2024. [Google Scholar]
- Zhang, J.J.; Li, J.X.; Wu, R.; Liu, X.Y.; Song, Y.H. Recycling of reclaimed water in china: Current situation, development trend, and countermeasures. Environ. Sci. 2024, 45, 7031–7040. (In Chinese) [Google Scholar]
- Hoang, H.G.; Lin, C.; Chiang, C.F.; Bui, X.T.; Lukkhasorn, W.; Bui, T.P.T.; Tran, H.T.; Vo, T.D.H.; Le, V.G.; Nghiem, L.D. The individual and synergistic indexes for assessments of heavy metal contamination in global rivers and risk: A review. Curr. Pollut. Rep. 2021, 7, 247–262. [Google Scholar] [CrossRef]
- Kumar, R.; Sharma, P.; Manna, C.; Jain, M. Abundance, interaction, ingestion, ecological concerns, and mitigation policies of microplastic pollution in riverine ecosystem: A review. Sci. Total Environ. 2021, 782, 146695. [Google Scholar] [CrossRef]
- Huang, J.; Zhang, Y.; Bing, H.; Peng, J.; Dong, F.; Gao, J. Characterizing the river water quality in china: Recent progress and on-going challenges. Water Res. 2021, 201, 117309. [Google Scholar] [CrossRef]
- UN. Secretary-General, World Commission on Environment and Development. Report of the World Commission on Environment and Development: Note/by the Secretary-General. 1987. Available online: https://digitallibrary.un.org/record/139811?v=pdf&ln=en (accessed on 2 January 2025).
- Sinha, E.; Michalak, A.M.; Balaji, V. Eutrophication will increase during the 21st century as a result of precipitation changes. Science 2017, 357, 405–408. [Google Scholar] [CrossRef] [PubMed]
- Hou, Y.; Xu, C.D.; Liu, W.; Yin, Q. Prediction of nitrogen emission in the upper reaches of the huai river basin under climate change scenarios. J. Geo-Inf. Sci. 2022, 24, 1558–1574. (In Chinese) [Google Scholar]
- Akhtar, N.; Syakir Ishak, M.I.; Bhawani, S.A.; Umar, K. Various natural and anthropogenic factors responsible for water quality degradation: A review. Water 2021, 13, 2660. [Google Scholar] [CrossRef]
- Santy, S.; Mujumdar, P.; Bala, G. Increased risk of water quality deterioration under climate change in ganga river. Front. Water 2022, 4, 971623. [Google Scholar] [CrossRef]
- Li, S.; Gu, S.; Liu, W.; Han, H.; Zhang, Q. Water quality in relation to land use and land cover in the upper han river basin, china. Catena 2008, 75, 216–222. [Google Scholar] [CrossRef]
- Zhang, J.; Zhang, Y.; Sun, G.; Song, C.; Dannenberg, M.P.; Li, J.; Liu, N.; Zhang, K.; Zhang, Q.; Hao, L. Vegetation greening weakened the capacity of water supply to china’s south-to-north water diversion project. Hydrol. Earth Syst. Sci. 2021, 25, 5623–5640. [Google Scholar] [CrossRef]
- National Development and Reform Commission. Hanjiang River Ecological Economic Belt Development Plan. China 2018. Available online: https://www.gov.cn/zhengce/zhengceku/2018-12/31/content_5434959.htm (accessed on 15 July 2024). (In Chinese)
- Zhao, K.; Li, J.; Ma, X.; Deng, C. The effects of land-use and climatic changes on the hydrological environment in the qinling mountains of shaanxi province. Forests 2022, 13, 1776. [Google Scholar] [CrossRef]
- Yue, Z.Y.; Deng, Y.; Ni, F.Q.; Kang, W.D.; Xiang, J.; Wu, M.Y.; Jiang, N. Change of runoff volume in the middle and upper reaches of han river basin under future climate scenarios. Chin. J. Agrometeorol. 2024, 45, 715–728. (In Chinese) [Google Scholar]
- Li, H.; Zhao, B.; Wang, D.; Zhang, K.; Tan, X.; Zhang, Q. Effect of multiple spatial scale characterization of land use on water quality. Environ. Sci. Pollut. Res. 2023, 30, 7106–7120. [Google Scholar] [CrossRef] [PubMed]
- Zhang, J.; Wang, M.; Ren, K.; Yan, K.; Liang, Y.; Yuan, H.; Yang, L.; Ren, Y. The relationship between mountain wetland health and water quality: A case study of the upper hanjiang river basin, china. J. Environ. Manag. 2023, 346, 118998. [Google Scholar] [CrossRef] [PubMed]
- Zhang, S.; Hou, X.; Wu, C.; Zhang, C. Impacts of climate and planting structure changes on watershed runoff and nitrogen and phosphorus loss. Sci. Total Environ. 2020, 706, 134489. [Google Scholar] [CrossRef] [PubMed]
- Yang, Y.; Li, J. Simulation of non-point source pollution in watershed above ankang section of the han river based on hype model. Water Resour. Prot. 2024, 40, 140–148. (In Chinese) [Google Scholar]
- Li, S.; Li, J.; Hao, G.; Li, Y. Evaluation of best management practices for non-point source pollution based on the swat model in the hanjiang river basin, china. Water Supply 2021, 21, 4563–4580. [Google Scholar] [CrossRef]
- Kim, Y.; Yu, J.; Lee, S.; Jeon, S. Efficiency analysis of best management practices under climate change conditions in the so-okcheon watershed, south korea. Front. Environ. Sci. 2024, 12, 1297289. [Google Scholar] [CrossRef]
- Xu, X.L.; Liu, J.Y.; Zhang, S.W.; Li, R.D.; Yan, C.Z.; Wu, S.X. CNLUCC Resources and Environment Science Data Registration and Publication System. Available online: http://www.resdc.cn/DOI (accessed on 15 July 2024).
- Wang, J.F.; Li, X.H.; Christakos, G.; Liao, Y.L.; Zhang, T.; Gu, X.; Zheng, X.Y. Geographical detectors-based health risk assessment and its application in the neural tube defects study of the heshun region, china. Int. J. Geogr. Inf. Sci. 2010, 24, 107–127. [Google Scholar] [CrossRef]
- Wang, J.F.; Zhang, T.L.; Fu, B.J. A measure of spatial stratified heterogeneity. Ecol. Indic. 2016, 67, 250–256. [Google Scholar] [CrossRef]
- Li, W.; Li, X.; Tan, M.; Wang, Y. Influences of population pressure change on vegetation greenness in china’s mountainous areas. Ecol. Evol. 2017, 7, 9041–9053. [Google Scholar] [CrossRef] [PubMed]
- Peng, W.; Kuang, T.; Tao, S. Quantifying influences of natural factors on vegetation ndvi changes based on geographical detector in sichuan, western china. J. Clean. Prod. 2019, 233, 353–367. [Google Scholar] [CrossRef]
- Zhu, L.; Meng, J.; Zhu, L. Applying geodetector to disentangle the contributions of natural and anthropogenic factors to ndvi variations in the middle reaches of the heihe river basin. Ecol. Indic. 2020, 117, 106545. [Google Scholar] [CrossRef]
- Navarro-Racines, C.; Tarapues, J.; Thornton, P.; Jarvis, A.; Ramirez-Villegas, J. High-resolution and bias-corrected cmip5 projections for climate change impact assessments. Sci. Data 2020, 7, 7. [Google Scholar] [CrossRef] [PubMed]
- Anand, V.; Oinam, B.; Wieprecht, S. Synergistic impact of climate and land use land cover change dynamics on the hydrological regime of loktak lake catchment under cmip6 scenarios. J. Hydrol.-Reg. Stud. 2024, 53, 101851. [Google Scholar] [CrossRef]
- Lenderink, G.; Buishand, A.; van Deursen, W. Estimates of future discharges of the river rhine using two scenario methodologies: Direct versus delta approach. Hydrol. Earth Syst. Sci. 2007, 11, 1145–1159. [Google Scholar] [CrossRef]
- Toosi, A.S.; Doulabian, S.; Ghasemi Tousi, E.; Calbimonte, G.H.; Alaghmand, S. Large-scale flood hazard assessment under climate change: A case study. Ecol. Eng. 2020, 147, 105765. [Google Scholar] [CrossRef]
- Tuo, Y.; Duan, Z.; Disse, M.; Chiogna, G. Evaluation of precipitation input for swat modeling in alpine catchment: A case study in the adige river basin (italy). Sci. Total Environ. 2016, 573, 66–82. [Google Scholar] [CrossRef] [PubMed]
- Gashaw, T.; Tulu, T.; Argaw, M.; Worqlul, A.W. Modeling the hydrological impacts of land use/land cover changes in the andassa watershed, blue nile basin, ethiopia. Sci. Total Environ. 2018, 619–620, 1394–1408. [Google Scholar] [CrossRef] [PubMed]
- Zhang, X.; Qi, Y.; Li, H.; Wang, X.; Yin, Q. Assessing the response of non-point source nitrogen pollution to land use change based on swat model. Ecol. Indic. 2024, 158, 111391. [Google Scholar] [CrossRef]
- Bhatta, B.; Shrestha, S.; Shrestha, P.K.; Talchabhadel, R. Evaluation and application of a swat model to assess the climate change impact on the hydrology of the himalayan river basin. Catena 2019, 181, 104082. [Google Scholar] [CrossRef]
- Aghsaei, H.; Dinan, N.M.; Moridi, A.; Asadolahi, Z.; Delavar, M.; Fohrer, N.; Wagner, P.D. Effects of dynamic land use/land cover change on water resources and sediment yield in the anzali wetland catchment, gilan, iran. Sci. Total Environ. 2020, 712, 136449. [Google Scholar] [CrossRef]
- Anand, J.; Gosain, A.K.; Khosa, R.; Srinivasan, R. Regional scale hydrologic modeling for prediction of water balance, analysis of trends in streamflow and variations in streamflow: The case study of the ganga river basin. J. Hydrol.-Reg. Stud. 2018, 16, 32–53. [Google Scholar] [CrossRef]
- Ni, X.; Parajuli, P.B.; Ouyang, Y.; Dash, P.; Siegert, C. Assessing land use change impact on stream discharge and stream water quality in an agricultural watershed. Catena 2021, 198, 105055. [Google Scholar] [CrossRef]
- Omer, A.; Zhuguo, M.; Zheng, Z.; Saleem, F. Natural and anthropogenic influences on the recent droughts in yellow river basin, china. Sci. Total Environ. 2020, 704, 135428. [Google Scholar] [CrossRef]
- Moriasi, D.N.; Gitau, M.W.; Pai, N.; Daggupati, P. Hydrologic and water quality models: Performance measures and evaluation criteria. Trans. ASABE 2015, 58, 1763–1785. [Google Scholar]
- Chen, Y.P.; Fu, B.J.; Zhao, Y.; Wang, K.B.; Zhao, M.M.; Ma, J.F.; Wu, J.H.; Xu, C.; Liu, W.G.; Wang, H. Sustainable development in the yellow river basin: Issues and strategies. J. Clean. Prod. 2020, 263, 121223. [Google Scholar] [CrossRef]
- Bonisławska, M.; Nędzarek, A.; Rybczyk, A.; Tański, A. The influence of anthropogenic pollution on the physicochemical conditions of the waters of the lower section of the sąpólna river. Water 2023, 16, 35. [Google Scholar] [CrossRef]
- Shrestha, N.K.; Wang, J. Water quality management of a cold climate region watershed in changing climate. J. Environ. Inform. 2019, 35, 56–80. [Google Scholar] [CrossRef]
- Drake, T.W.; Hemingway, J.D.; Kurek, M.R.; Peucker-Ehrenbrink, B.; Brown, K.A.; Holmes, R.M.; Galy, V.; Moura, J.M.S.; Mitsuya, M.; Wassenaar, L.I.; et al. The pulse of the amazon: Fluxes of dissolved organic carbon, nutrients, and ions from the world’s largest river. Glob. Biogeochem. Cycles 2021, 35, e2020GB006895. [Google Scholar] [CrossRef]
- Allafta, H.; Opp, C. Understanding the combined effects of land cover, precipitation and catchment size on nitrogen and discharge—A case study of the mississippi river basin. Water 2022, 14, 865. [Google Scholar] [CrossRef]
- da Silva Anjinho, P.; Barbosa, M.A.G.A.; Neves, G.L.; dos Santos, A.R.; Mauad, F.F. Integrated empirical models to assess nutrient concentration in water resources: Case study of a small basin in southeastern brazil. Environ. Sci. Pollut. Res. 2021, 28, 23349–23367. [Google Scholar] [CrossRef] [PubMed]
- Hu, Y.; Peng, Z.; Zhang, Y.; Liu, G.; Zhang, H.; Hu, W. Air temperature effects on nitrogen and phosphorus concentration in lake chaohu and adjacent inflowing rivers. Aquat. Sci. 2022, 84, 33. [Google Scholar] [CrossRef]
- Li, Q.; Ouyang, W.; Zhu, J.; Lin, C.; He, M. Discharge dynamics of agricultural diffuse pollution under different rainfall patterns in the middle yangtze river. J. Environ. Manag. 2023, 347, 119116. [Google Scholar] [CrossRef] [PubMed]
- Hu, Y.; Xing, Z.; Zhang, F.; Tian, Q.; Badreldin, N.; Zhao, J. Analysis and estimation of nonpoint source pollution under different land use in anjiagou watershed, gansu, china. Environ. Sci. Pollut. Res. 2022, 29, 77428–77447. [Google Scholar] [CrossRef]
- Chen, W.; Zhang, X.; Wu, N.; Yuan, C.; Liu, Y.; Yang, Y.; Chen, Z.; Dahlgren, R.A.; Zhang, M.; Ji, X. Sources and transformations of riverine nitrogen across a coastal-plain river network of eastern china: New insights from multiple stable isotopes. Sci. Total Environ. 2024, 924, 171671. [Google Scholar] [CrossRef]
- Ye, H.; Tang, C.; Cao, Y. Sources and transformation mechanisms of inorganic nitrogen: Evidence from multi-isotopes in a rural-urban river area. Sci. Total Environ. 2021, 794, 148615. [Google Scholar] [CrossRef]
- Mo, X.; Peng, H.; Xin, J.; Wang, S. Analysis of urea nitrogen leaching under high-intensity rainfall using hydrus-1d. J. Environ. Manag. 2022, 312, 114900. [Google Scholar] [CrossRef]
- Van Meter, K.J.; Basu, N.B.; Veenstra, J.J.; Burras, C.L. The nitrogen legacy: Emerging evidence of nitrogen accumulation in anthropogenic landscapes. Environ. Res. Lett. 2016, 11, 035014. [Google Scholar] [CrossRef]
- Liu, X.; Beusen, A.H.W.; van Grinsven, H.J.M.; Wang, J.; van Hoek, W.J.; Ran, X.; Mogollón, J.M.; Bouwman, A.F. Impact of groundwater nitrogen legacy on water quality. Nat. Sustain. 2024, 7, 891–900. [Google Scholar] [CrossRef]
- Chinese Ministry of Agriculture. Circular of the Chinese Ministry of Agriculture on Printing and Distributing the Action Plan for Zero Growth in the Application of Fertilizer by 2020 and the Action Plan for Zero Growth in the Application of Pesticide by 2020. Available online: http://www.moa.gov.cn/nybgb/2015/san/201711/t20171129_5923401.htm (accessed on 2 January 2025). (In Chinese)
- Hu, K.; Zhao, Q.L.; Chen, W.; Wang, W.; Han, F.; Shen, X.H. Appropriate technologies for upgrading wastewater treatment plants: Methods review and case studies in china. J. Environ. Sci. Health A 2018, 53, 1207–1220. [Google Scholar] [CrossRef] [PubMed]
- Roman, M.; Dovi, R.; Yoder, R.; Dias, F.; Warden, B. Determination by ion chromatography and spectrophotometry of the effects of preservation on nitrite and nitrate. J. Chromatogr. A 1991, 546, 341–346. [Google Scholar] [CrossRef]
- Oktavia, M.; Indah, S.; Helard, D. Spatial variability of ammonium, nitrite and nitrate concentrations in water of batang arau river, west sumatera, indonesia. Water Supply 2020, 20, 1484–1492. [Google Scholar]
- Minareci, O.; Koruk, M. Assessment of the surface water quality in the kucuk menderes river, tÜrkİye. Appl. Ecol. Environ. Res. 2024, 22, 1563–1575. [Google Scholar] [CrossRef]
- Li, Y.; Abegunrin, T.P.; Guo, H.; Huang, Z.; Are, K.S.; Wang, H.; Gu, M.; Wei, L. Variation of dissolved nutrient exports by surface runoff from sugarcane watershed is controlled by fertilizer application and ground cover. Agric. Ecosyst. Environ. 2020, 303, 107121. [Google Scholar] [CrossRef]
- Bu, H.; Meng, W.; Zhang, Y.; Wan, J. Relationships between land use patterns and water quality in the taizi river basin, china. Ecol. Indic. 2014, 41, 187–197. [Google Scholar] [CrossRef]
- Shi, P.; Zhang, Y.; Li, Z.; Li, P.; Xu, G. Influence of land use and land cover patterns on seasonal water quality at multi-spatial scales. Catena 2017, 151, 182–190. [Google Scholar] [CrossRef]
- Lorite-Herrera, M.; Hiscock, K.; Jiménez-Espinosa, R. Distribution of dissolved inorganic and organic nitrogen in river water and groundwater in an agriculturally-dominated catchment, south-east spain. Water Air Soil. Pollut. 2009, 198, 335–346. [Google Scholar] [CrossRef]
- Badr, E.S.A. Spatio-temporal variability of dissolved organic nitrogen (don), carbon (doc), and nutrients in the nile river, egypt. Environ. Monit. Assess. 2016, 188, 580. [Google Scholar] [CrossRef] [PubMed]
- Anderson, R.L.; Rowntree, K.M.; Roux, J.J.L. An interrogation of research on the influence of rainfall on gully erosion. Catena 2021, 206, 105482. [Google Scholar] [CrossRef]
- Zhang, M.; Li, D.J.; Yue, Z. Effects of rainfall intensity and slope gradient on soil erosion, nitrogen and potassium loss on loess slope. J. Soil Water Conserv. 2018, 32, 85–90. (In Chinese) [Google Scholar]
- Tan, S.; Xie, D.; Ni, J.; Chen, L.; Ni, C.; Ye, W.; Zhao, G.; Shao, J.; Chen, F. Output characteristics and driving factors of non-point source nitrogen (n) and phosphorus (p) in the three gorges reservoir area (tgra) based on migration process: 1995–2020. Sci. Total Environ. 2023, 875, 162543. [Google Scholar] [CrossRef] [PubMed]
- Xu, G.; Xiao, J.; Oliver, D.M.; Yang, Z.; Xiong, K.; Zhao, Z.; Zheng, L.; Fan, H.; Zhang, F. Spatio-temporal characteristics and determinants of anthropogenic nitrogen and phosphorus inputs in an ecologically fragile karst basin: Environmental responses and management strategies. Ecol. Indic. 2022, 133, 108453. [Google Scholar] [CrossRef]
- Balu, A.; Ramasamy, S.; Sankar, G. Assessment of climate change impact on hydrological components of ponnaiyar river basin, tamil nadu using cmip6 models. J. Water Clim. Change 2023, 14, 730–747. [Google Scholar] [CrossRef]
- Jia, H.; Li, X.; Wen, J.; Chen, Y. Runoff change simulation and future trend projection in the source area of the yellow river. Resour. Sci. 2022, 44, 1292–1304. (In Chinese) [Google Scholar] [CrossRef]
- Gao, T.; Li, J.; Tang, Y.; Jiang, X.; Huo, J. Response of runoff and its components to climate change and its future trend in the source region of the yangtze river. Hydrol. Process 2024, 38, e15180. [Google Scholar] [CrossRef]
- Tigabu, T.B.; Wagner, P.D.; Hörmann, G.; Kiesel, J.; Fohrer, N. Climate change impacts on the water and groundwater resources of the lake tana basin, ethiopia. J. Water Clim. Chang. 2021, 12, 1544–1563. [Google Scholar] [CrossRef]
- Li, Z.; Cao, Y.; Duan, Y.; Jiang, Z.; Sun, F. Simulation and prediction of the impact of climate change scenarios on runoff of typical watersheds in changbai mountains, china. Water 2022, 14, 792. [Google Scholar] [CrossRef]
- Mack, L.; Andersen, H.E.; Beklioğlu, M.; Bucak, T.; Couture, R.M.; Cremona, F.; Ferreira, M.T.; Hutchins, M.G.; Mischke, U.; Molina-Navarro, E.; et al. The future depends on what we do today—Projecting europe’s surface water quality into three different future scenarios. Sci. Total Environ. 2019, 668, 470–484. [Google Scholar] [CrossRef]

Disclaimer/Publisher’s Note: The statements, opinions and data contained in all publications are solely those of the individual author(s) and contributor(s) and not of MDPI and/or the editor(s). MDPI and/or the editor(s) disclaim responsibility for any injury to people or property resulting from any ideas, methods, instructions or products referred to in the content. |
© 2025 by the authors. Licensee MDPI, Basel, Switzerland. This article is an open access article distributed under the terms and conditions of the Creative Commons Attribution (CC BY) license (https://creativecommons.org/licenses/by/4.0/).