Article

Ecological Assessment of Polluted Soils: Linking Ecological Risks, Soil Quality, and Biota Diversity in Contaminated Soils

1
Soil and Water Department, Faculty of Agriculture, Tanta University, Tanta 31527, Egypt
2
Department of Biology, College of Science, Princess Nourah bint Abdulrahman University, P.O. Box 84428, Riyadh 11671, Saudi Arabia
3
Department of Zoology, Faculty of Science, Tanta University, Tanta 31111, Egypt
4
Soil Microbiology Research Department, Soils, Water, and Environment Research Institute (SWERI), Agriculture Research Center (ARC), Giza 12112, Egypt
*
Authors to whom correspondence should be addressed.
Sustainability 2025, 17(4), 1524; https://doi.org/10.3390/su17041524
Submission received: 11 January 2025 / Revised: 7 February 2025 / Accepted: 10 February 2025 / Published: 12 February 2025

Abstract

:
Understanding the correlation between soil pollution, environmental indices, humic substances, and soil biota diversity is critical for assessing ecological health, particularly in areas with prolonged contamination. In this study, 90 soil samples were collected from ten locations in El-Mahla El-Kobra area, Egypt, affected by industrial pollution and unsustainable agricultural practices. Significant variations in organic matter, humic substances, microbial biomass carbon, and microbial populations were observed. Heavy metal contamination was highest in site S3, with a contamination degree (CD) of 29.45 and a pollution load index (PLI) of 1.67. Self-organizing maps showed the possible need for targeted remediation to mitigate ecological risk. Biodiversity analysis identified Oribatida as the dominant species, with shifts in diversity indices indicating species adaptation to pollution levels. Positive correlations between soil contamination (CD, PLI) and both Shannon–Wiener and Simpson indices, alongside negative correlations between MCD, PLI, and the Berger–Parker dominance index, suggest a complex shift toward species dominance in polluted environments. The findings highlight the complex interplay between soil contamination and biodiversity, offering critical insights for ecological risk assessment and sustainable soil management in contaminated regions.

1. Introduction

Heavy metal pollution is a growing environmental concern globally, particularly in regions undergoing rapid industrialization, such as Egypt. Heavy metals like aluminum (Al), cobalt (Co), copper (Cu), iron (Fe), manganese (Mn), nickel (Ni), thallium (Tl), zinc (Zn), cadmium (Cd), chromium (Cr), and lead (Pb) are of significant interest due to their toxic effects on ecosystems and human health [1,2,3]. In Egypt, the increasing use of industrial effluents, poor waste disposal practices, and agricultural runoff have contributed to the accumulation of these metals in soils, particularly near urban and industrial zones [4,5,6]. The El-Mahla El-Kobra region, for example, has been identified as a hotspot for heavy metal contamination [7] due to its dense industrial activity, including textile and dyeing industries, which release hazardous chemicals and heavy metals into the environment [8]. This poses severe ecological risks, affecting not only soil and water quality but also biodiversity in the region.
Heavy metal contamination disturbs the natural balance of ecosystems by altering soil properties and impacting organismal activity [9,10]. The diversity of soil species, including oribatid mites (Orbatida), prostigmatid mites (Prostigmata), mesostigmatid mites (Mesostigmata), springtails (Collembola), and nematodes, is particularly sensitive to these changes [11]. These soil organisms play crucial roles in nutrient cycling, decomposition, and maintaining soil structure [12]. Diversity measures such as species richness and evenness are critical indicators of ecosystem health [13]. When diversity is high, ecosystems tend to be more resilient, but heavy metal contamination can shift these dynamics, often leading to reduced richness and evenness, with pollution-tolerant species becoming dominant [14].
Research has shown that higher levels of heavy metal pollution correlate negatively with species diversity. For instance, organisms such as oribatid and mesostigmatid mites tend to decrease in polluted environments [15], while more pollution-tolerant organisms, such as Prostigmata mites and nematodes, often dominate contaminated soils [16]. This shift in species composition signals ecological stress, as it reduces the functional biodiversity required for ecosystem processes like decomposition and nutrient cycling.
The region of El-Mahla El-Kobra faces significant ecological risks due to heavy metal accumulation, particularly Cu, Zn, Pb, and Cd, as documented in several studies [7]. The potential ecological risks are raised by using untreated industrial effluents and improper management of agricultural practices, including the use of contaminated drainage water for irrigation. The pollution in this region has been linked to declines in soil biodiversity, with nematode populations showing signs of stress due to elevated concentrations of heavy metals [17]. These changes may affect not only soil health but also crop productivity and, ultimately, human health, highlighting the urgent need for effective remediation strategies. This study aims to (1) assess the heavy metals levels and their pollution indices in ten sites located in El-Mahla El-Kobra area, Middle Nile Delta, Egypt, and evaluate their impact on potential ecological risks, (2) assess the diversity of soil organisms, to derive the effects of heavy metal contamination on biodiversity, and (3) correlate the heavy metals assessment with diversity measures such as species richness, evenness, and dominance, to explore the relationships between pollution levels and soil biota. This comprehensive approach aims to link the intensity of contamination with changes in ecosystem health, providing insights for environmental risk assessments and guiding potential remediation strategies.

2. Materials and Methods
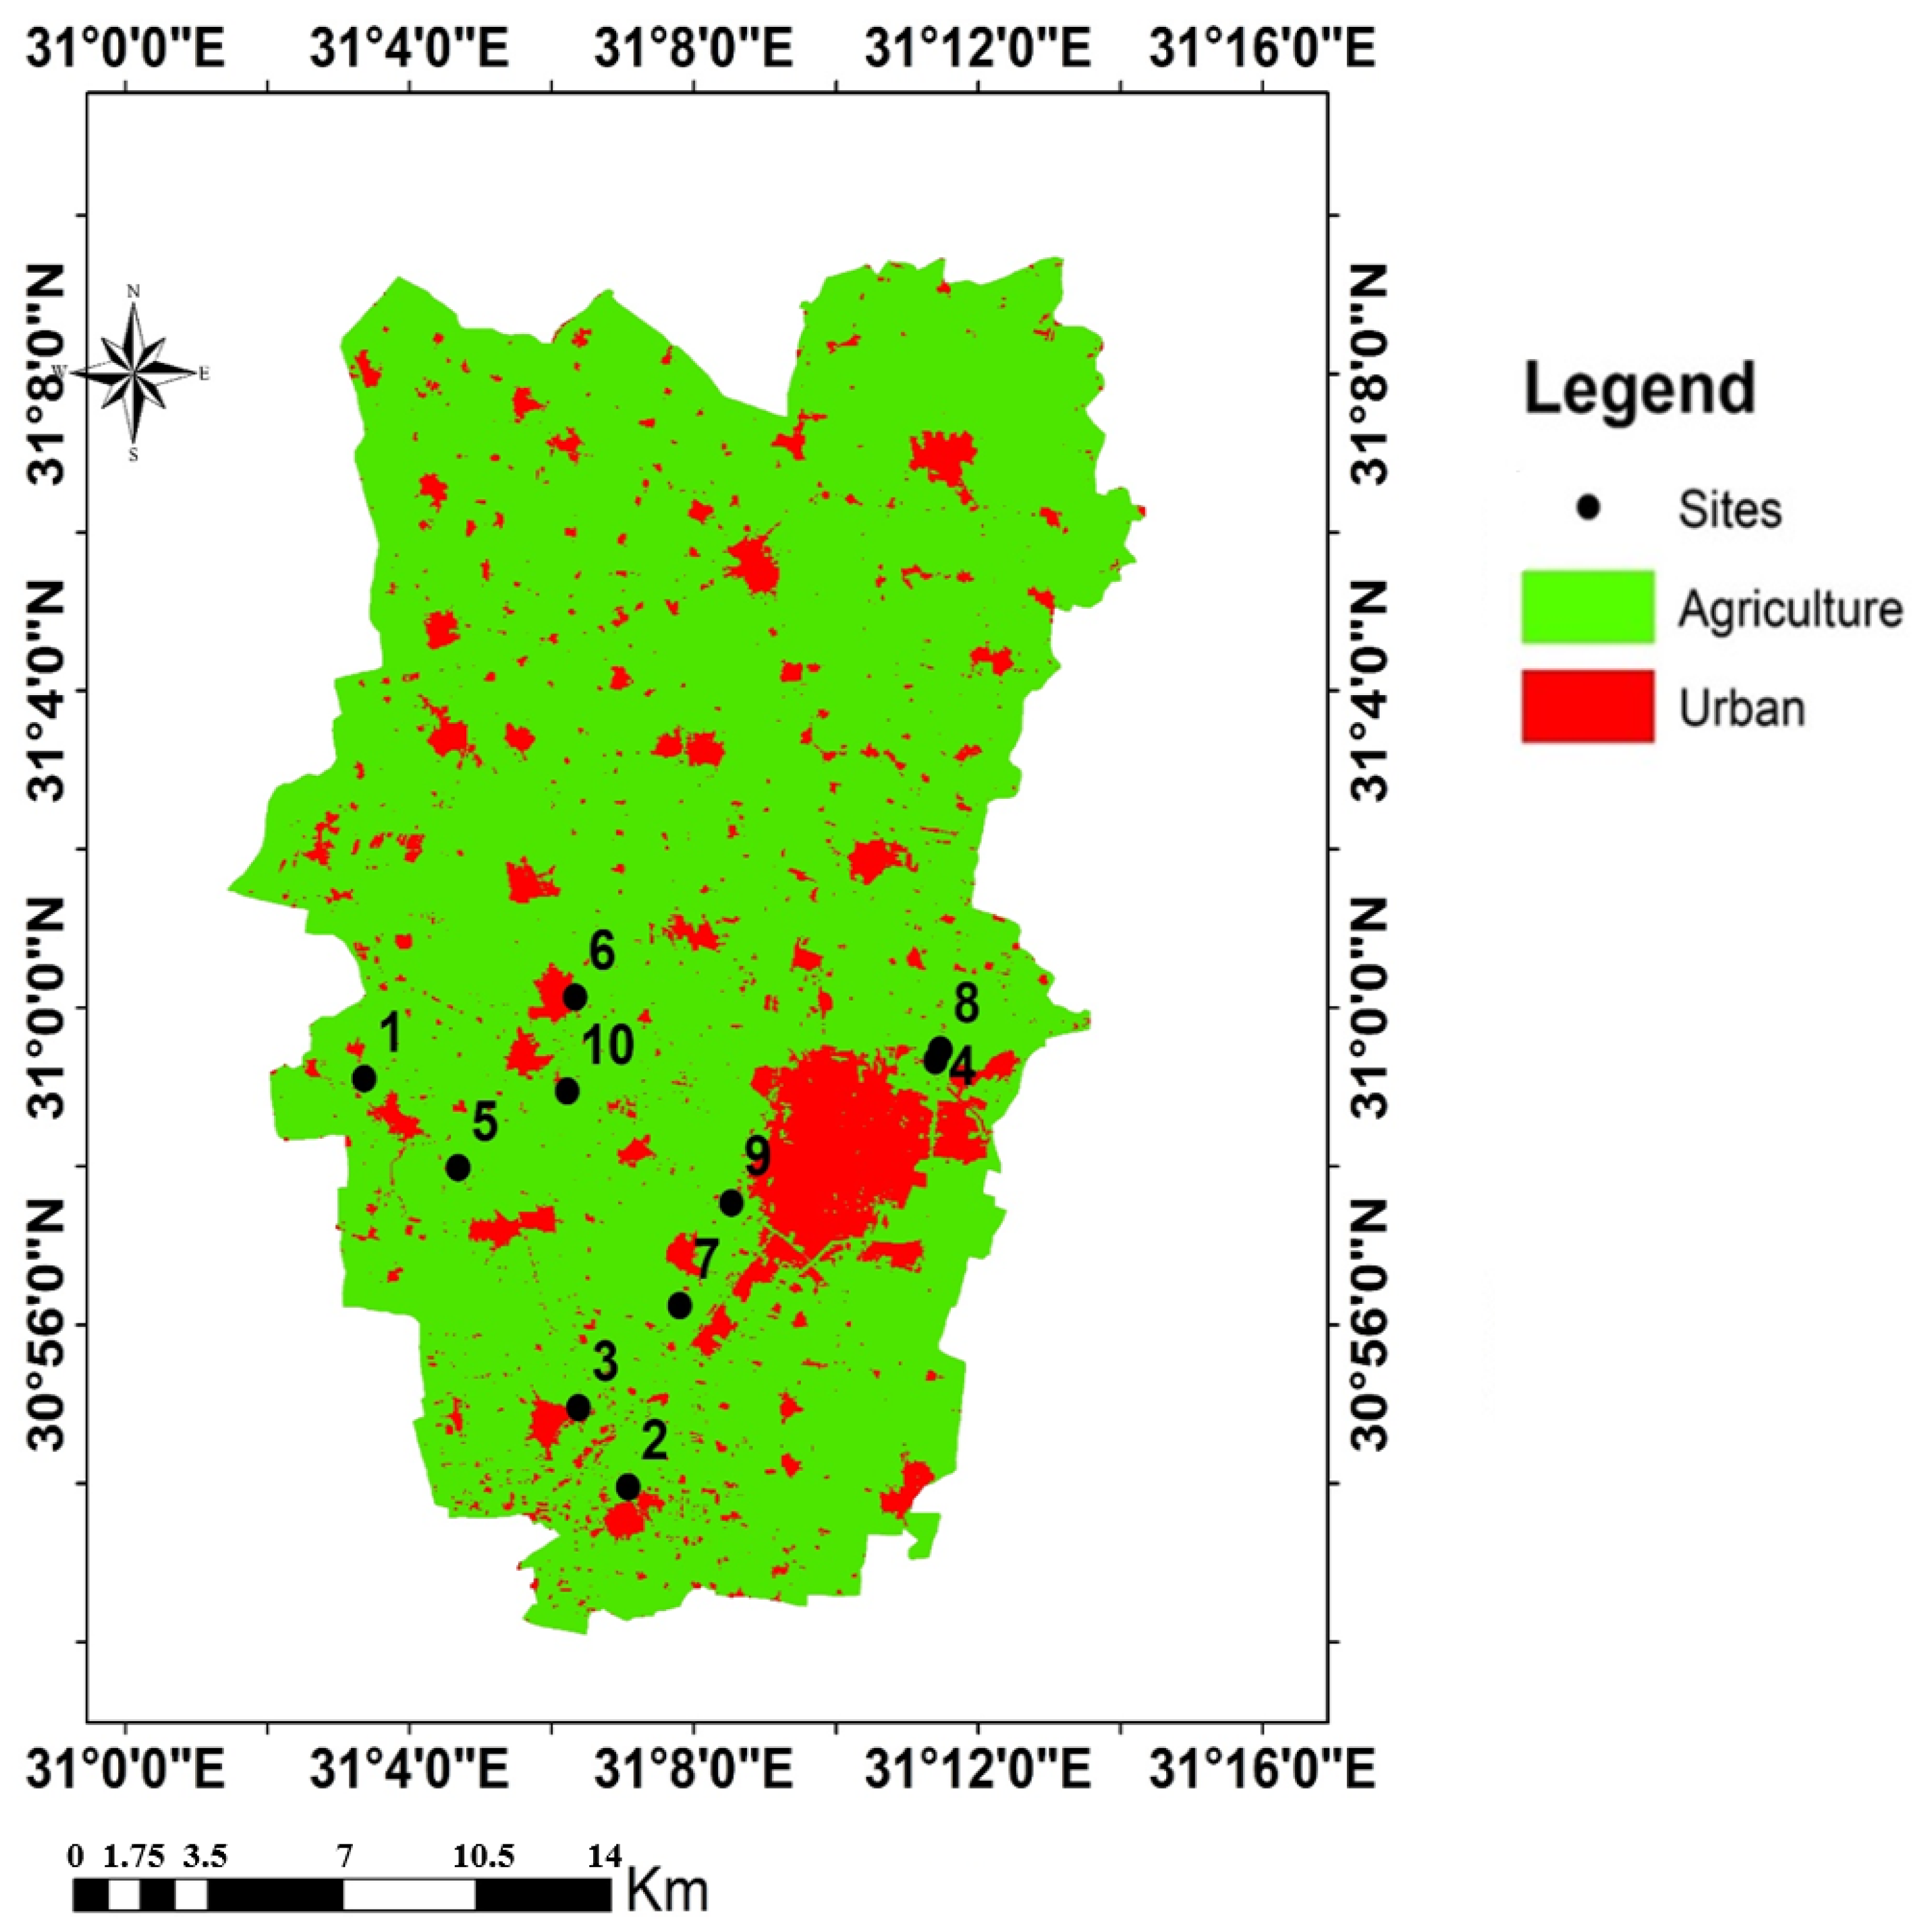
2.1. Study Area

Ninety soil samples (0–30 cm) were gathered in July 2023 from 10 location sites in El-Mahla El-Kobra area (30°34′ N Latitude and 30°45′ E Longitude with 6.10 m altitude), El-Gharbia governorate, Egypt. These samples are located in different 10 villages nominated as follows: Al Dwakhleyah (S1), Al Hayatem (S2), Al Sigaeyah (S3), Bulkena (S4), Butainah 1 (S5), Butainah 2 (S6), Denoshr (S7), Ezbet Al Burullusi (S8), Kafr Al Abayda (S9), and Saft turab (S10). These sites have been suffering from different kinds of heavy metals pollution for more than 30 years, including irrigation with drainage water, wastes from pigment manufacturing plants, urbanization residues, and imbalances in pesticide and fertilizer use. The experimental site locations of soil samples are presented in Figure 1. Nine samples from each village were collected, and divided into three portions, and the first portion was air-dried at room temperature (25 °C) and sieved through a 2 mm screen in preparation for chemical analysis. The other two portions of the soil samples were kept in the refrigerator for diversity and microbial analysis.

2.2. Soil Analysis

The pH of the soil samples was measured in 1:2.5 (soil:water) suspension by a pH meter (model H12211-02, Thermofisher, HANNA, Staten Island, NY, USA). In soil paste, the electrical conductivity was analyzed using an EC-meter (model CON2700, EUTECH, Thermofisher Scientific, Vernon Hills, IL, USA). Using the Walkley and Black method, the soil organic carbon (SOC) was determined and consequently, the organic matter was computed regarding the conversion factor of 1.724 used to convert organic carbon to organic matter according to the method described by Cottenie et al. [18]. The soil microbial biomass carbon (MBC) was measured using the chloroform fumigation–extraction method according to Ladd and Amato [19]. The humic substances were fractionated using the method of Schnitzer [20] and Stevenson [21]. Soil samples were acidified with 0.1 M HCl (pH 1) to remove the fulvic fraction, then neutralized and extracted overnight with 1 M NaOH (pH > 12). The total bacterial counts in the soil were counted using the soil agar medium method as described by Allen [22]. The soil characteristics are presented in Table 1. The concentration of different heavy metals including Al, Co, Cu, Fe, Mn, Ni, Ti, Zn, Cd, Cr, and Pb was analyzed using ICP spectroscopy (ICP-ISO Prodigy 7 Plus, Teledyne LABS, Stillwater, OK, USA) after digestion by concentrated H2SO4 +HNO3+ HClO4 according to Siddique et al. [23].

2.3. Soil Contamination Indices

The contamination indices used in this study are divided into two categories: the indices that evaluate only one contaminant are called single indices, and indices that are used to assess several metal contaminations are called complex indices, as mentioned by Weissmannová and Pavlovský [24]. The single indices include contamination factor (CF), and geo-accumulation index (Igeo), while the complex indices contain degree of contamination (DC), modified degree of contamination (MCD), pollution load index (PLI), and potential ecological risk index (PER).
The contamination factor (CF) is used to assess the level of contamination by comparing the concentration of a metal (Ci) in the sediment to its background concentration [25].
C F = C i C b a c k g r o u n d
The geo-accumulation index (Igeo) assesses metal pollution by comparing current concentrations to pre-industrial levels (Bn).
I g e o = L o g 2 C i 1.5 ×   B n
where the factor 1.5 accounts for natural fluctuations and anthropogenic influences, and Bn is the concentrations of elements in the Earth’s crust as reported by El-Sharkawy et al. [9]. As for the complex indexes, the contamination degree (CD) is the sum of contamination factors for all metals studied.
CD = i = 1 i = n C F
While the modified degree of contamination (MCD) refines the CD by considering the mean of contamination factors as follows:
M C D = C D n      
The pollution load index (PLI) provides a cumulative indication of the overall level of metal pollution as:
P L I = C F 1 .   C F 2 . C F n 1 n
While the potential ecological risk index (PER) evaluates the risk posed by toxic metals, considering both contamination and toxicity as follows:
P E R = i n   T r × C F  
Tr represents the toxic response factor for each heavy metal corresponding to 7 heavy metals composed of Co, Cu, Ni, Zn, Cd, Cr, and Pd as 5, 5, 5, 1, 30, 2, and 5, while Al, Fe, Mn, and Ti are not commonly used in Tr values because of low toxicity in environmental risk assessments.

2.4. Soil Diversity Assessment Indices

Soil fauna was extracted using modified Berlese funnels as shown in Figure 2 according to [26]. Each soil sample was subdivided into 6 layers of 5 cm depth (i.e., 0–5 cm, 5–10 cm and 10–15 cm, 15:20 cm, 20–25 cm, 25–30 cm). Species diversity is conceptualized as the count of distinct species existing within a particular ecosystem, coupled with the proportional representation of each species in an ecosystem and the relative abundance of each of those species. The level of diversity reaches its zenith when the various species present exhibit an equal level of abundance within the designated area. In contrast, species evenness is a measure of the relative abundance of species within a community.

2.5. Statistical and Data Analysis

2.5.1. Soil Chemical and Biological Data

The data were presented to ANOVA analysis using IBM-SPSS statistics (version 29). Replications from different sites were considered random, while both soil chemical and microbiological variables were considered fixed factors with significant levels of 0.05. The Duncan multiple range test (DMRT) was employed with a significance set at p < 0.05 to compare the means of each variable. The self-organizing map (SOM) as a part of an artificial neural network (ANN) for unsupervised data was used to cluster the data based on the optimum similarity, providing an in-depth understanding of the measured variables concerning the input parameters.

2.5.2. Diversity Analysis

Species diversity values were evaluated using the Shannon–Wiener function, Simpson’s index (D), and their evenness index as follows:
The Shannon–Wiener diversity (H) index is a mathematical measure used to characterize quantitative species diversity in a community. It considers both the number of species present (richness) and the evenness of their abundances. It is the most widely used index of heterogeneity as reported by Silver [27], and the formula for the Shannon–Wiener diversity index is:
H = 3.3219   L o g N 1 N   n i   L o g   n i
where N: Total number of individuals of all species, ni: Number of individuals of a species.
The Shannon index varies from a value of 0 for communities containing only a single species to high values for communities containing many species, each with a small number of individuals. The Shannon’s evenness evaluates the proportional representation of various species within a given community. Values approaching 1 suggest a more equitable distribution of species.
The Simpson’s index (D) is a measure of diversity that considers both the number of species present (richness) and the relative abundance of each species (evenness). It provides an estimation of the probability that two individuals randomly selected from a sample will belong to the same species [28]. Simpson’s index (D) is calculated using the following formula:
N 2 = N   N 1 n   n 1
where N2 is diversity index, N is the total number of individuals of all species, and n is the number of individuals of a species.
This index increases from a value of 1.0 for a community containing only one species to an infinite value for a community in which every individual belongs to a different species.
The evenness index was calculated according to Pielou [29] from the following equation:
E = H S
where H is the Shannon index, and S is the number of species.

2.5.3. Species Similarity

The qualitative similarity was conducted using Sorensen’s index of similarity [30] as the following equation:
Q s = 2 J i + j
where “J” represents the number of species occurring in all sites, “i” is the number of species in site A, and “j” is the number of species in site B.
The quantitative similarity (CN) was determined according to Magurran [31] using the following equation:
C N = 2 JN iN + jN
where iN is the number of individuals in site A, jN is the number of individuals in site B, and JN is the sum of the lower of the two abundances of species that occur in the two sites.
The Bray–Curtis similarity index was used for assessing the variances in species populations across two distinct ecological sites. It accounts for both presence–absence and abundance differences between samples as follows:
B C i j = 1 2 C i j S i + S j
where Cij is the sum of only the lesser counts for each species found in both sites, Si is the total number of specimens counted on site i. and Sj is the total number of specimens counted on site j.

2.5.4. Dominance

Dominance represents the degree to which species have a major influence controlling other species in their ecological community. Both the composition and abundance of species within an ecosystem can be affected by the dominant species present. The concentration of dominance (C) was calculated according to the equation:
C =   n i   / N 2
where ni is the number of individuals of species I, and N is the total number of all species.
To indicate the proportional importance of the most abundant type, the Berger and Parker index, which focuses on the dominance of the most abundant species in a community, was used. It is useful for highlighting dominance patterns in a community.
B P I = N m n
where Nm is the number of individuals in the most abundant species, and n is the number of individuals in the sample.

3. Results

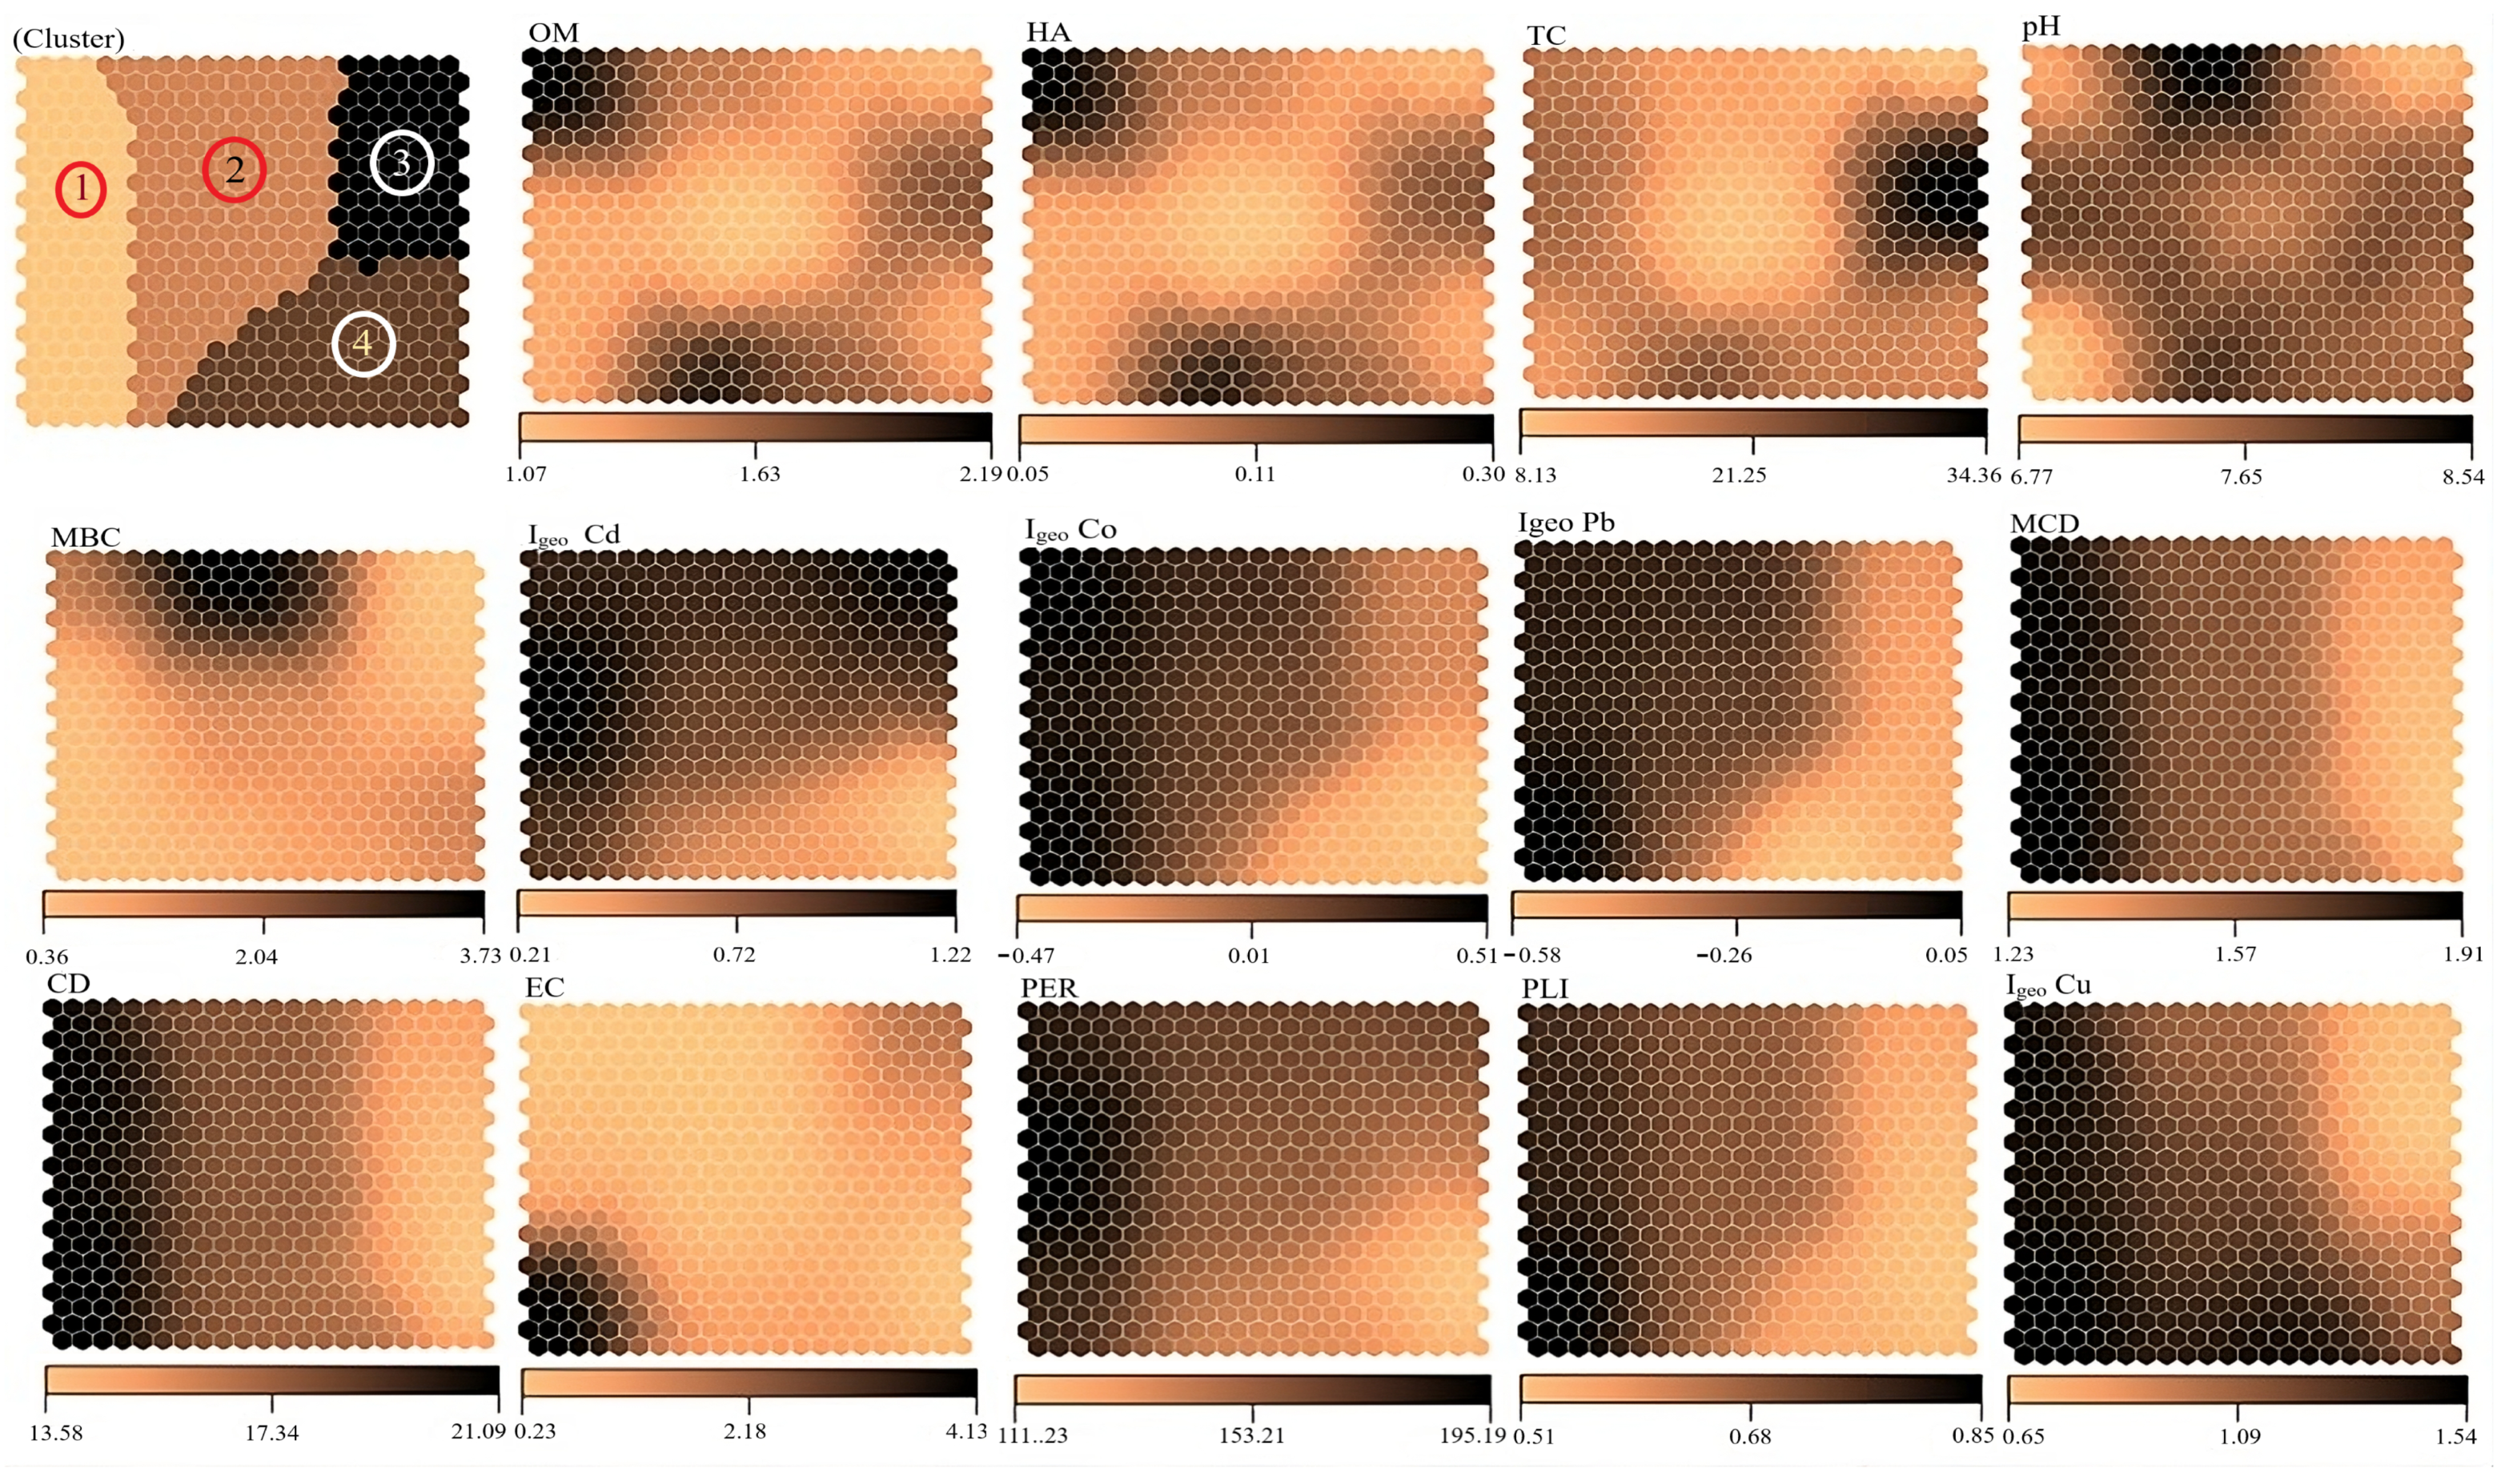
3.1. Soil Properties

All ten soil sites located in the El-Mahla El-Kobra region are characterized as slight-alkaline non-saline (Entisols) with pH varies between 7.38 to 8.26 and EC 0.21 to 2.16 dS m−1, except for the S1 site which considered saline with EC 4.63 dS m−1 as presented in Table 1.
All sites demonstrated significant organic matter as well as organic carbon with S2 recording the highest values (2.48% and 1.44%), respectively. The S4 site showed the highest value of microbial biomass carbon (MBC) at 3.60% followed by the S10 site at 1.70%. The total counts of bacteria were recorded as the highest in the S9 site (39 × 106 CFU g−1) and the lowest in the S8 site (6 × 10⁶ CFU g−1).
Table 2 shows the heavy metals concentrations in different soil sites. The data illustrate that S3 recorded the highest concentrations of Al, Co, Cu, Fe, and Pb compared to the other sites with values of 209,621.93, 37.96, 110.44, 2259.97, and 31.77 mg kg−1. While S9 recorded the lowest levels of Fe, Mn, Ni, Ti, and Zn, it recorded the highest concentration of Cr. Sites S2, S5, and S10 registered the highest concentration of Cd with no significant difference.

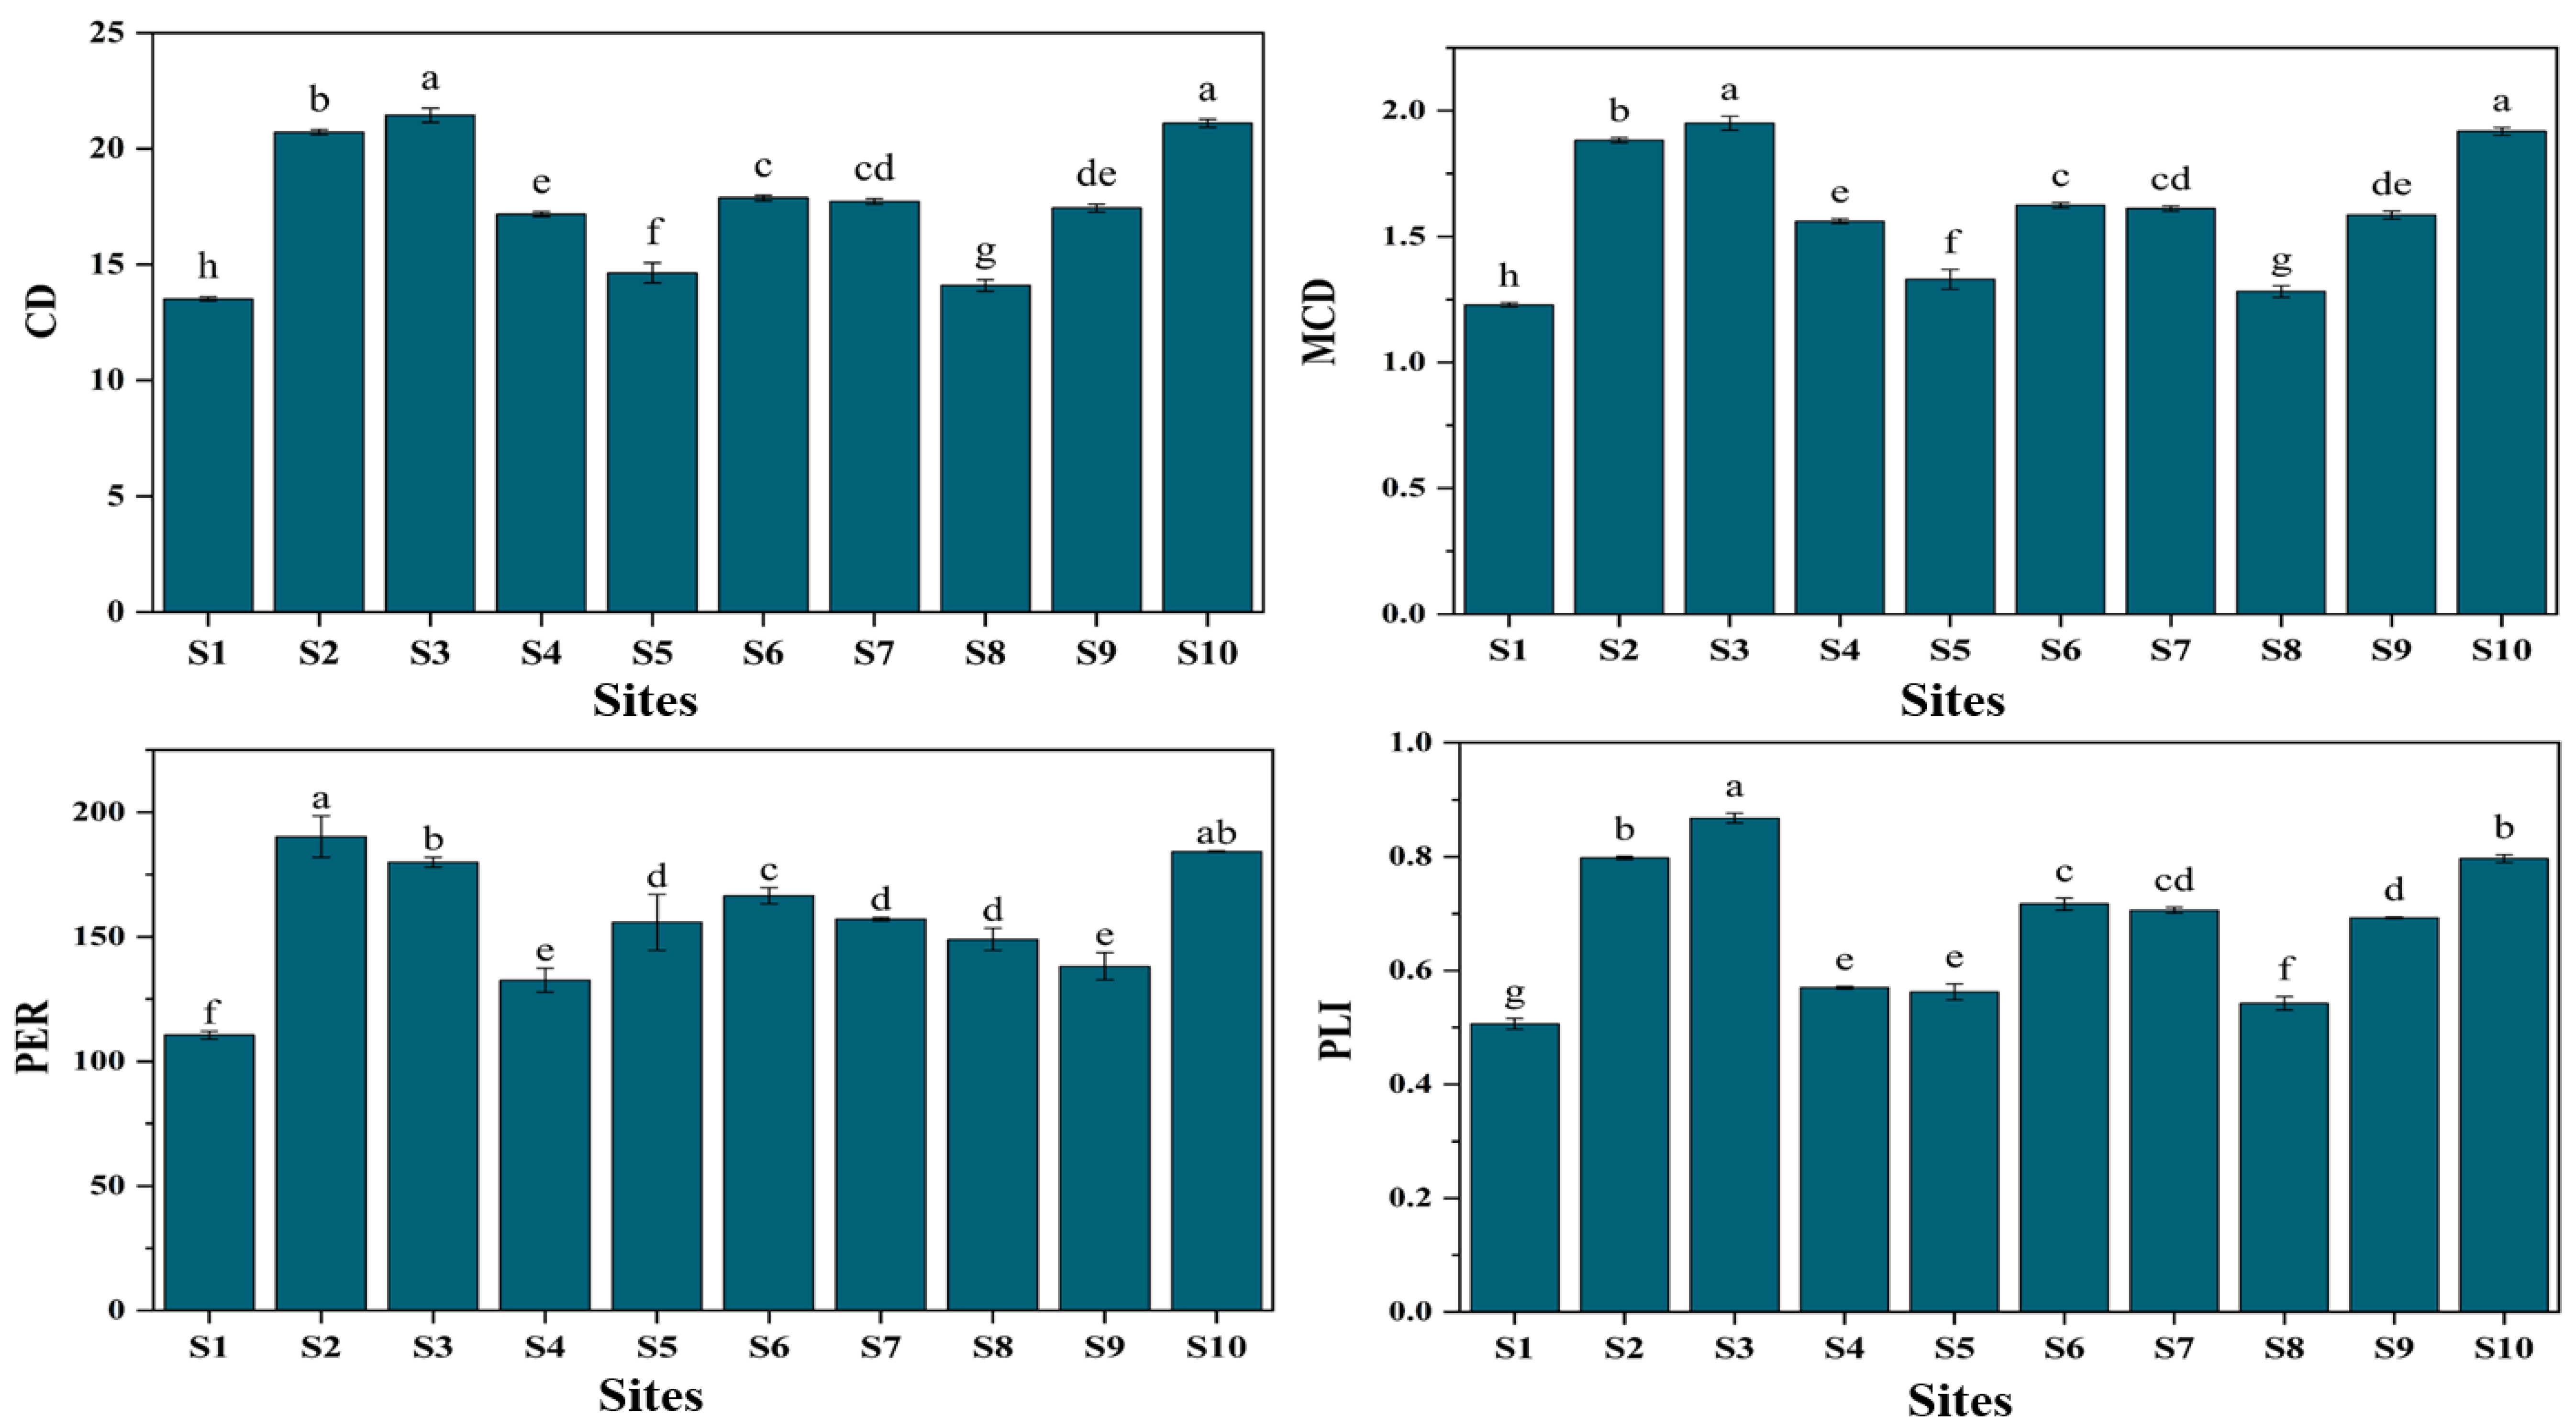
3.2. Pollution Indices

Table 3 represents the contamination factors (CF) for all heavy metals (11 elements) in the studied sites. The data take the same pattern as the heavy metal concentrations with S3 recording the highest CF of Al, Co, Cu, Fe, and Pb compared to the other sites with values of 4.46, 4.265, 10.040, 0.088, and 0.53. S9 recorded the lowest CF levels of Fe, Mn, Ni, Ti, and Zn with values 0.054, 0.273, 0.712, 0.231, and 0.07, while it recorded the highest CF with Cr, recording 1.40. S2, S5, and S10 sites registered the highest CF of Cd with no significant difference.
The geo-accumulation index is used to assess the contamination levels of trace metals in soil. The Igeo is specific to each element in every region. The data in Table 4 show that the Igeo showed no significant impacts for Fe, Mn, Ni, Zn, and Cr. The S3 site showed significant levels of Igeo recording the highest levels of Al (0.72), Co (0.53), Cu (1.56), and Cd (0.95), while it registered the only site affected by Pb (0.08). S2, S5, S6, S8, and S10 sites displayed no significant differences in Igeo for Cd with S2 recording the highest site with a value of 1.16. Additionally, S10, S2, and S6 registered the highest Igeo for Ti with no significant differences valued at 0.71, 0.69, and 0.67, respectively.
Pollution indices such as CD, MCD, PER, and PLI are essential tools for pollution across different contaminated sites, providing a comprehensive evaluation of environmental health risks and guiding remediation efforts. The S3 site showed high values in CD, MCD, and PLI recording 29.45, 2.68, and 1.67, respectively, as appears in Figure 3. On the other hand, the S2 and S10 sites recorded the highest PER with no significant differences with values of 190.24 and 184.23, respectively. It is clearly observed that S1 recorded, compared to other sites, the lowest site in all pollution indices.

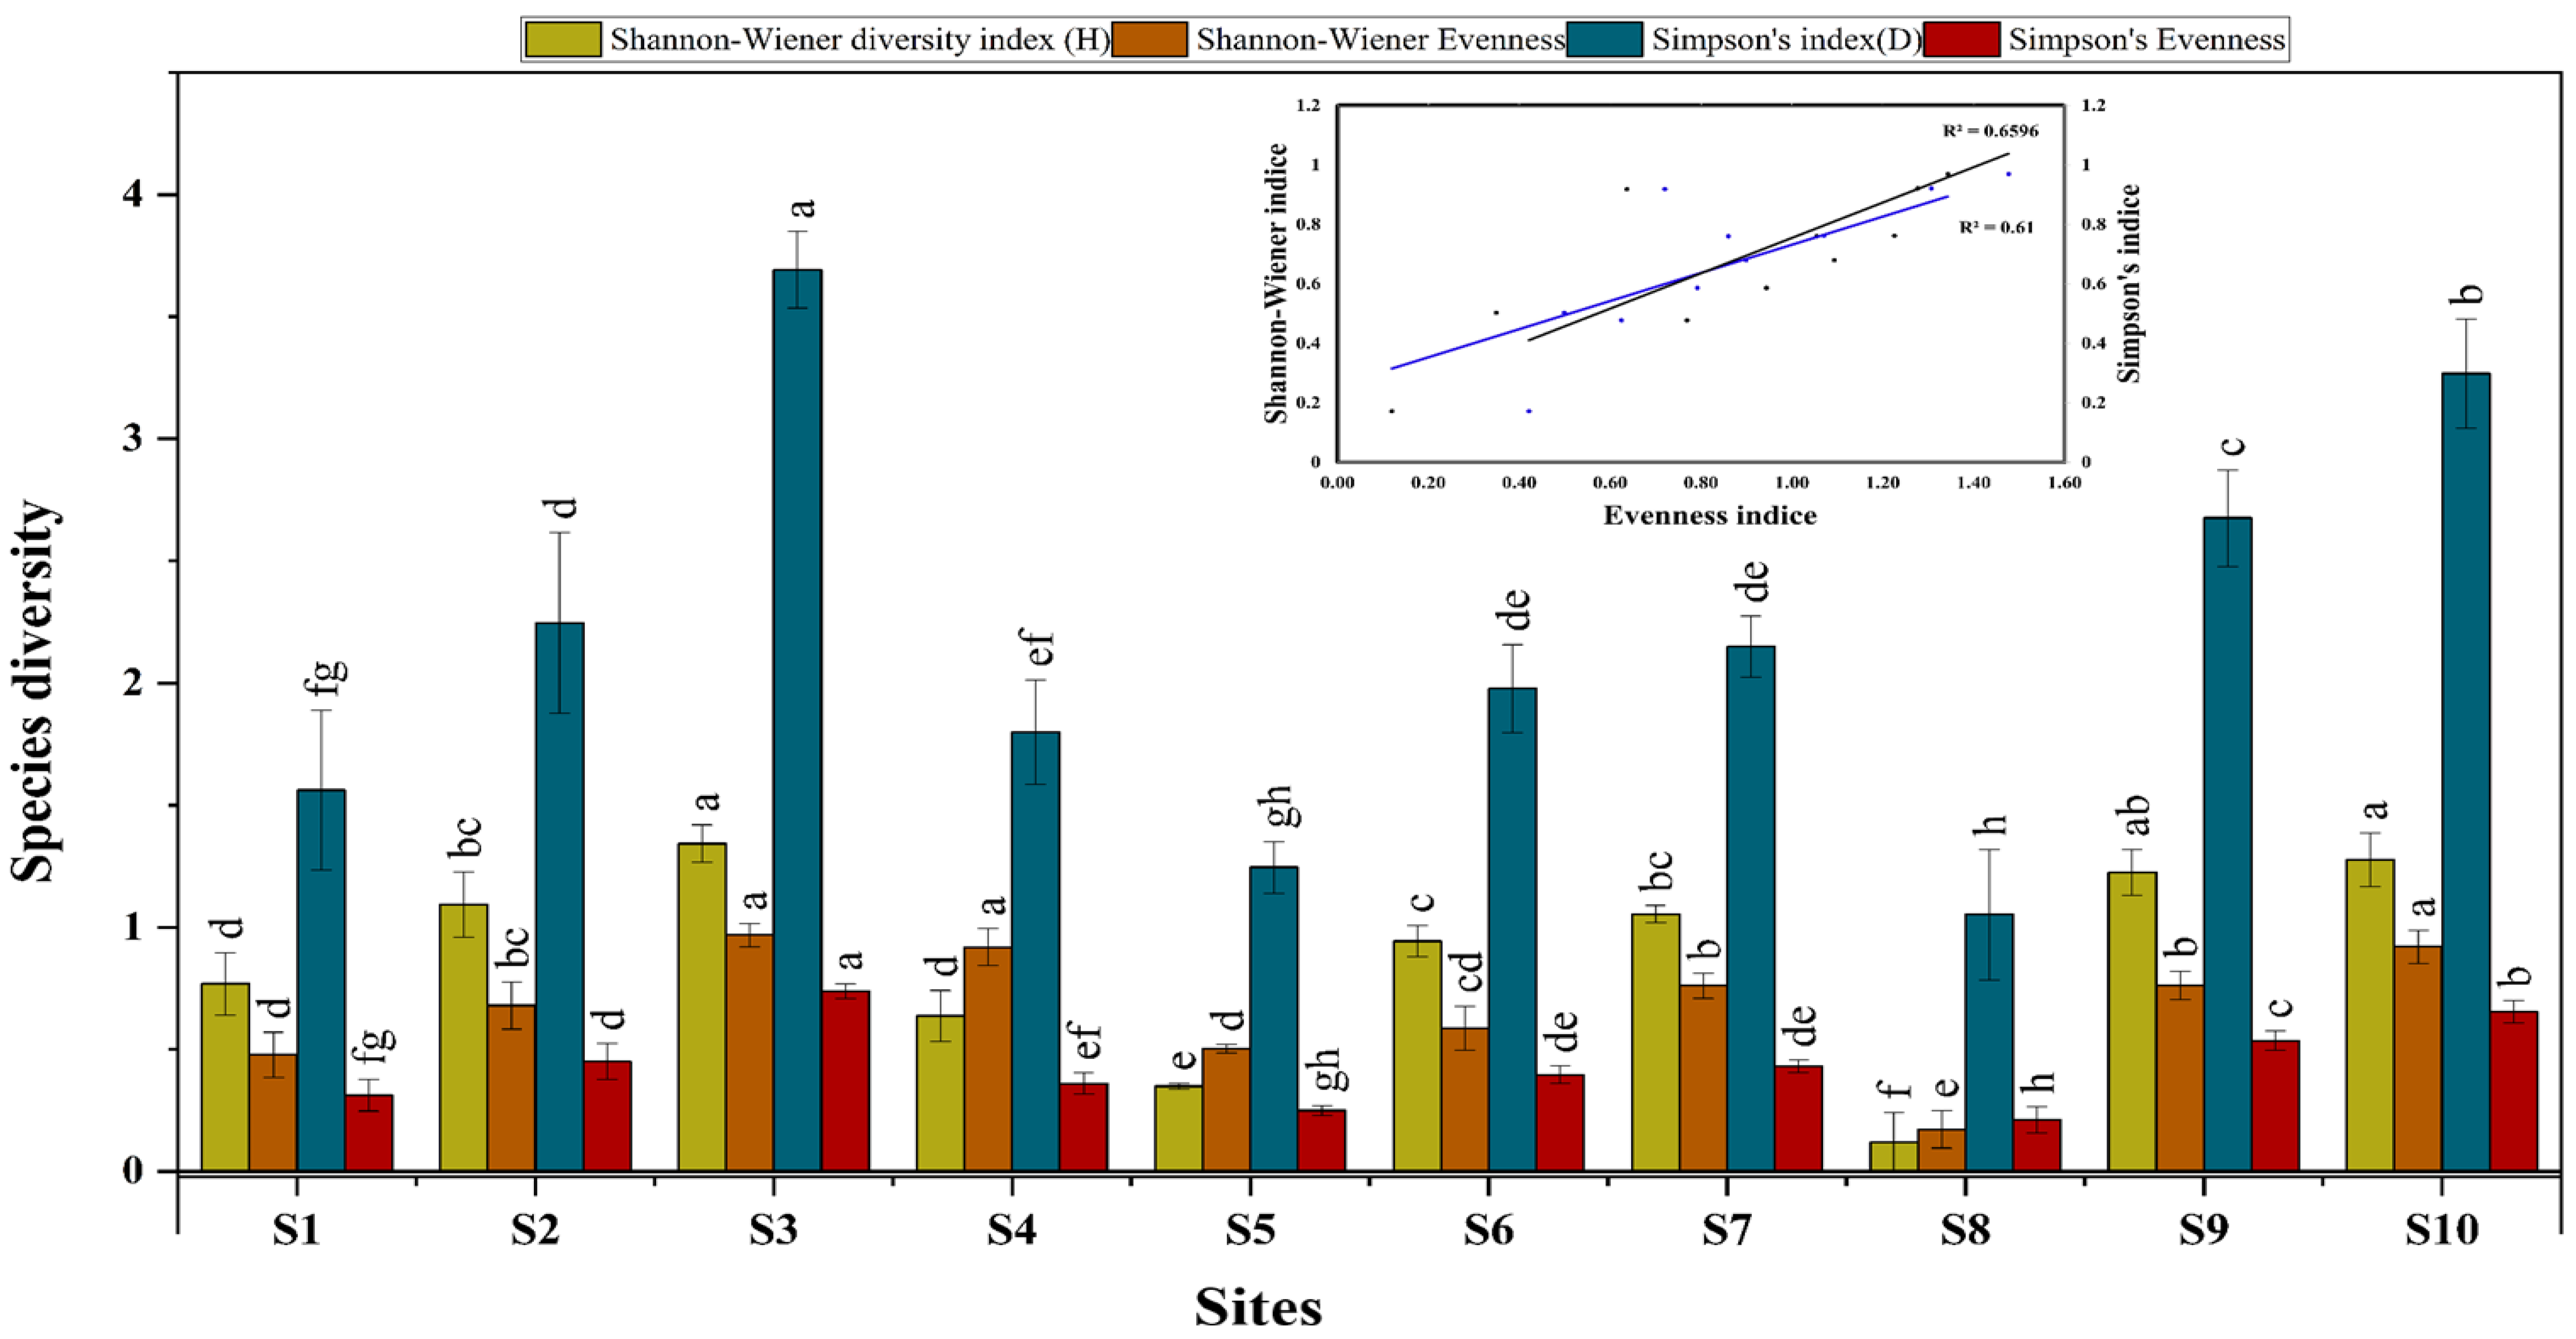
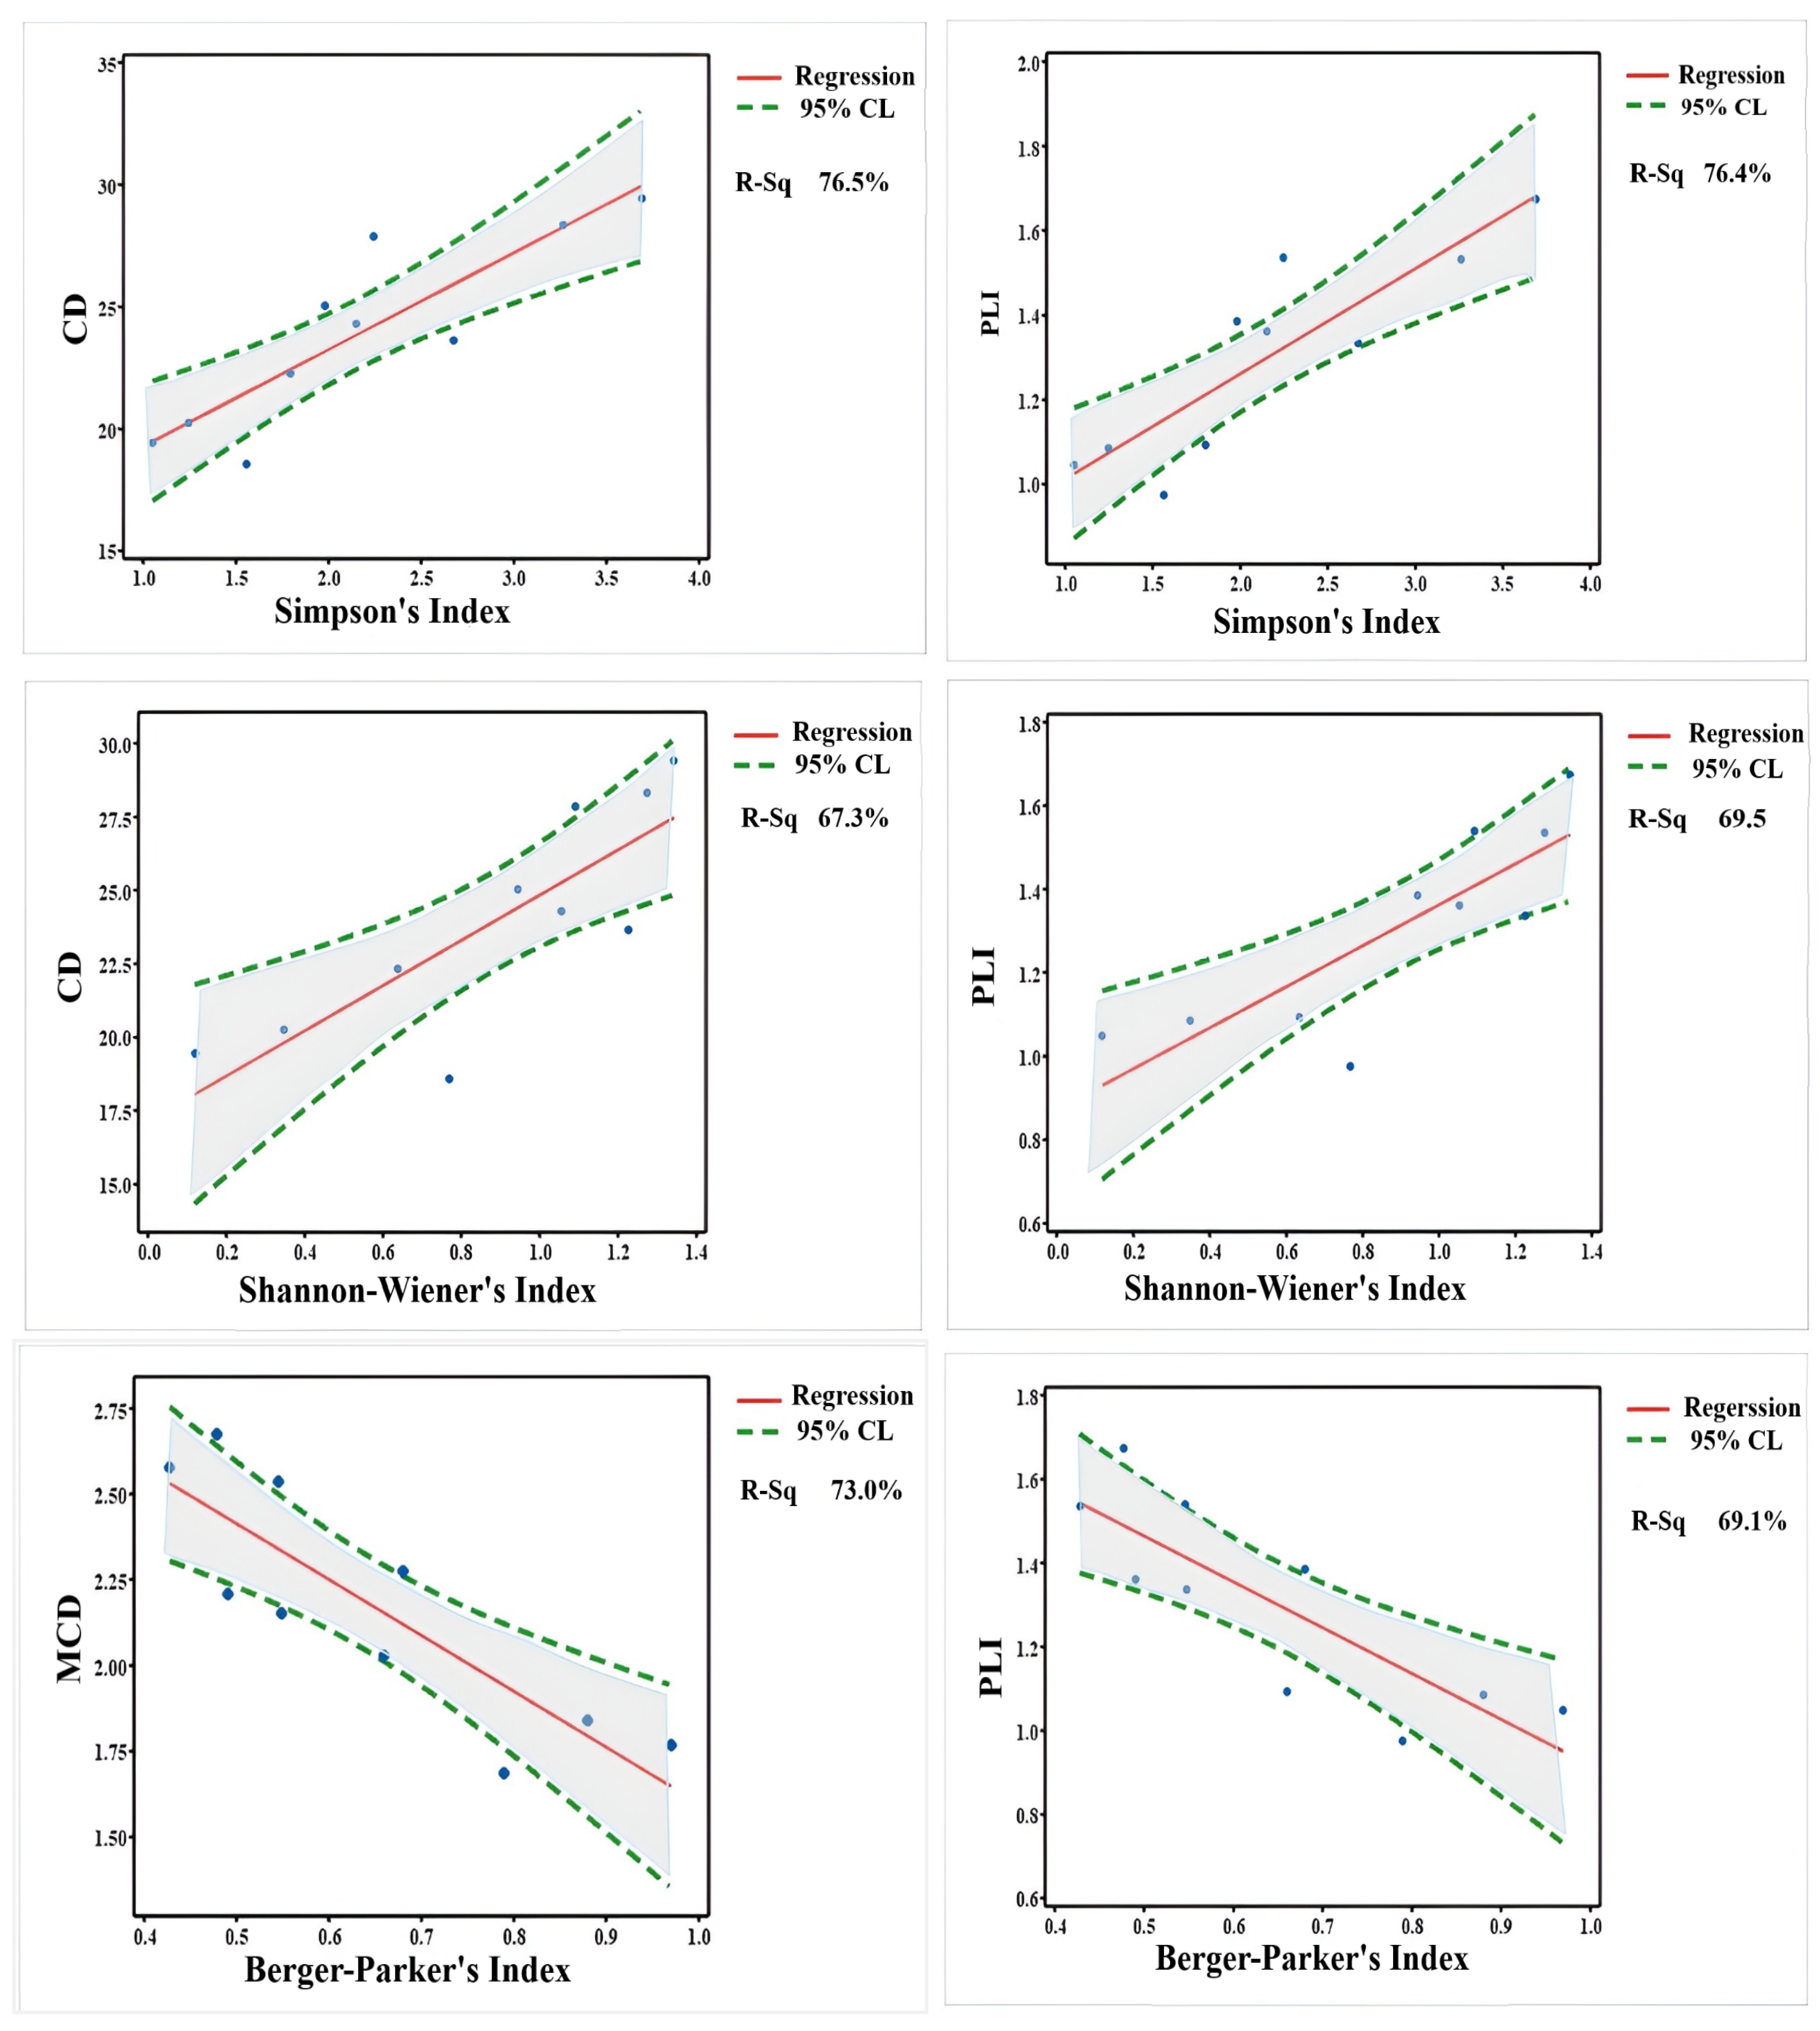
3.3. Species Diversity

Table 5 shows the evaluation of soil fauna in the studied sites in the El-Mahla El-Kobra area. The total number of species recorded the highest value of 239 counts in site S9, while the lowest value was recorded in site S4. Orbatida recorded the highest value of 129 counts in site S1, while the lowest value was recorded in site S8. The number of Prostigmata in the studied site samples ranged from 1 to 65 counts. The relative abundance of Mesostigmata was 3%, and was absent in four sites, namely S4, S5, S6 and S8. The highest average number of Collembola in the soil samples was found in site S9, followed by S3 = S2, S6 = S1 and S10 = S7, and the lowest abundance was in sites S4 and S5. The descending order of relative abundance is as follows: Orbatida > Prostigmata > Collembola > Mesostigmata.
To assess the community and diversity structure of soil fauna, the Shannon–Wiener index (H), Simpson index (D), and evenness index are employed and presented in Figure 4. Although the S3 region exhibited the most elevated Shannon–Wiener index alongside the highest Simpson’s index, this site showed the highest variance between both indices, signifying the highest level of overall biodiversity, followed by the S10 site. Sites S3, S10, and S4 demonstrate comparatively high Shannon–Wiener evenness values, implying more distributions of species. Sites characterized by diminished Shannon–Wiener indices and elevated Simpson’s indices (for instance, S1 and S5) likely feature a predominant species or a limited number of species that are significantly more prevalent than their counterparts. There exists a general correlation between the Shannon–Wiener index and Simpson’s index and evenness, as shown in Figure 4. Increased evenness values frequently align with heightened diversity indices. Environments with elevated diversity indices may possess greater resilience to disturbances and fluctuations in environmental conditions.

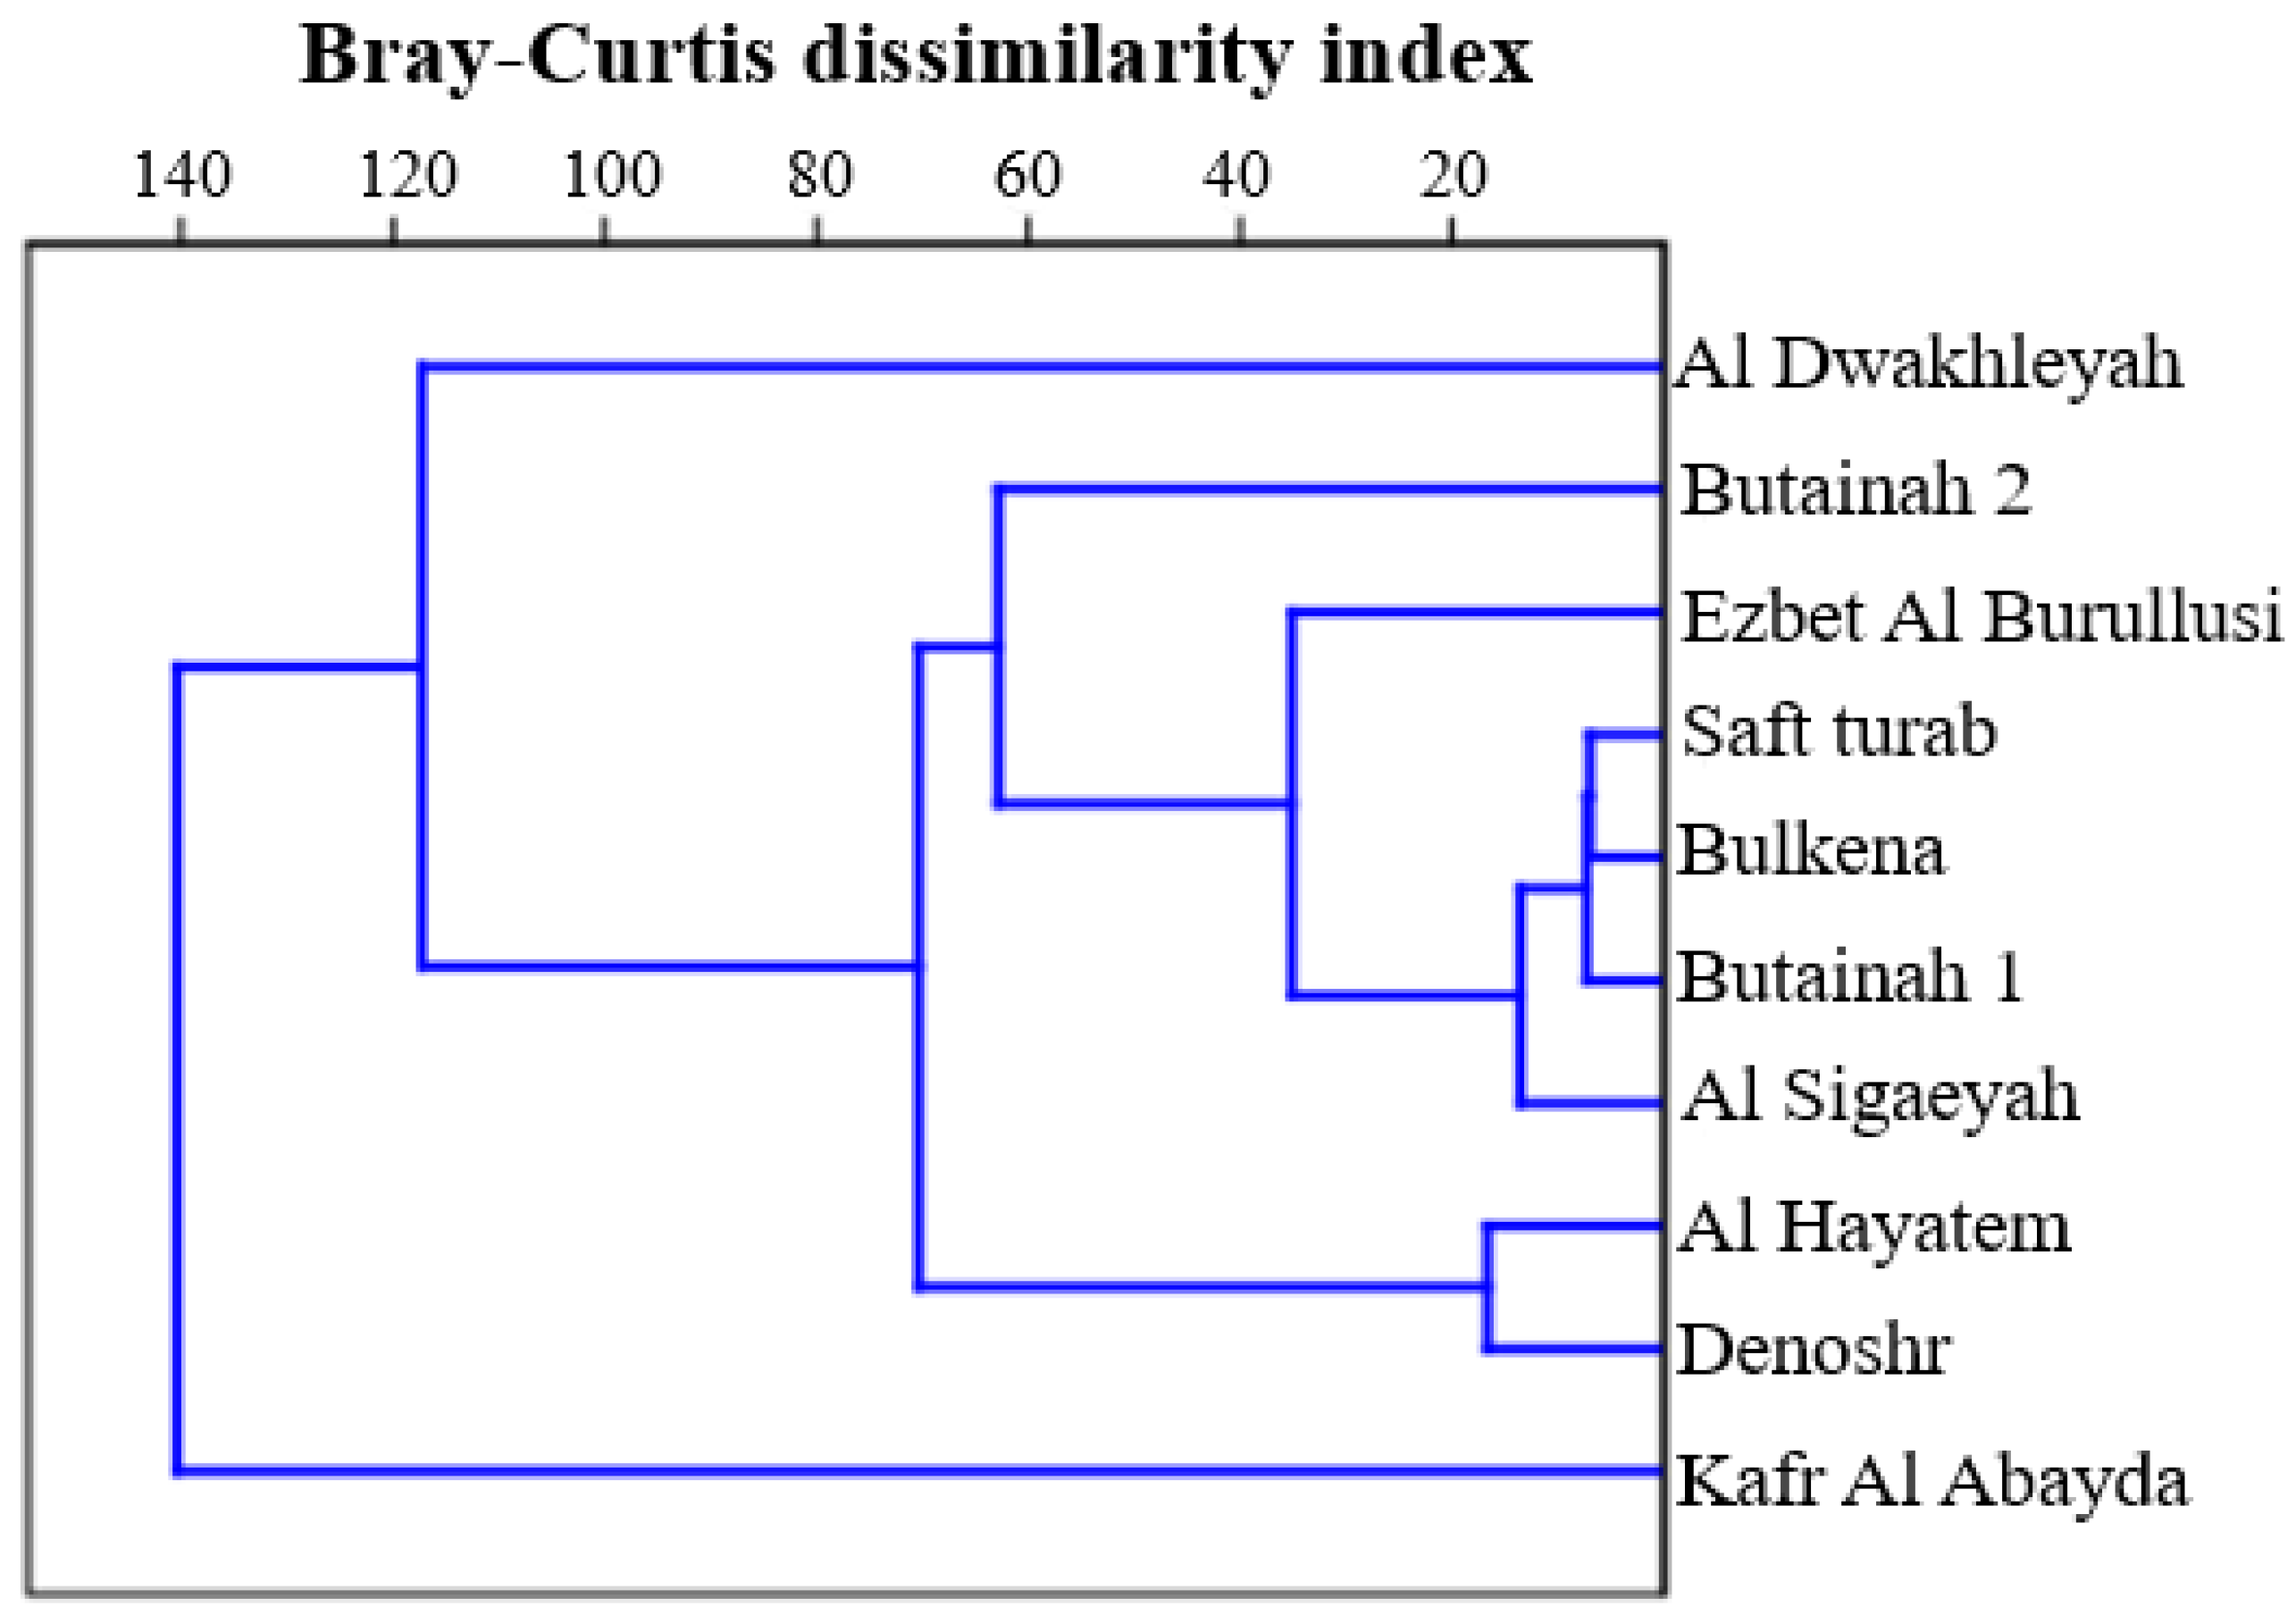
3.4. Species Similarity

The Bray–Curtis similarity index serves as a metric for assessing the variances in species populations across two distinct ecological sites. This index is particularly useful in ecological studies for comparing diversity between different habitats or treatment groups. The dendrogram in Figure 5 illustrates the clustering of different soil sites based on their species composition into three clusters. S1 and S9 show significant dissimilarity from other sites, as it is the inaugural entity that integrates into the dendrogram to form a distinct cluster, which might indicate unique environmental conditions or management practices. S6, S8, S10, S4, S5, and S3, are closely related, indicating similar ecological conditions or management practices. S2 and S7 also show a degree of similarity, forming a separate cluster. The greater the horizontal distance between branches, the higher the dissimilarity. Table 6 exhibited the similarity and distribution of all five soil faunal species within 10 sites. The similarity degree was divided into four group values from the highest color intensity to the least, respectively (>0.75, 0.50–0.75, 0.25–0.50, and ˂0.25). Certain clusters of locations demonstrate elevated similarity indices, implying that these sites may share analogous environmental conditions. For example, S2 and S7 present a notably high similarity index (0.873), suggesting a potential closer association regarding the variables being analyzed in species diversity with a value of >0.75 Certain pairs of locations exhibit minimal similarity coefficients, thereby suggesting a significant degree of dissimilarity. For instance, the comparison between S9 and S4 yields a similarity coefficient of 0.0247, which signifies a comparatively low degree of resemblance. It is clear from Table 6 that the similarity (0.25–0.5) was recorded between sites S3 and S10, S7 and S8, and S7 and S1.

3.5. Dominance and Abundance

The dominance represents the degree to which species have a major influence controlling other species in their ecological community, and both the composition and abundance of species within an ecosystem can be affected by the dominant species present. Figure 6 designs the data related to the abundance and relative abundance of the five distinct soil mite species. Orbatida emerges as the predominant species, constituting 39.50% of the overall population. Prostigmata and Collembola also exhibit considerable relative abundances, whereas Mesostigmata and Nematoda display diminished levels of abundance. The superiority of Orbatida implies its significant contribution to the soil ecosystem. The existence of multiple species, including those with lesser abundance, signifies a discernible degree of biodiversity.
The numerical dominance classification scheme as described by Engelmann [32] was applied categorizing the species into five groups: Eudominant as group A (over 30% of individuals), dominant as group B (10–30% of individuals), subdominant as group C (5–10% of individuals), minor as group D (1–5% of individuals), and rare as group E (less than 1% of individuals). On the other hand, a categorical assessment of abundance (ACFOR) was divided into four categories (abundant, common, frequent, and rare).
According to Figure 6, Orbatida, considered Eudominant, counted over 30% of individuals, whilst Prostigmata, Collembola, and Nematode are registered dominant species, with Prostigmata accounting for 26.1% of the total population. The Mesostigmata, being the least abundant species, followed group (E) as minor dominant. The ACFOR and dominance categories align with the relative abundance data. Orbatida and Prostigmata are both abundant, while Mesostigmata is registered as rare. Collembola and Nematode are both classified as frequent, indicating that they are moderately abundant.
The Berger–Parker index is another measure of species’ diversity, which focuses on the dominance of the most abundant species in a community. Berger and Parker’s index expresses the proportional importance of the most abundant type [33]. It is simpler than the Shannon–Wiener index and is particularly useful for highlighting dominance patterns in a community. This metric is highly linked to sample size and richness; moreover, it does not make use of all the information available from the sample. The Berger–Parker index showed in Figure 7 that the S8 region recorded the highest Berger–Parker index (0.97) with no significant difference from the S5 region, indicating that a single species dominates the community at this location, while the S10 region registered the lowest value (0.48), with no significant difference with both S7 and S3 regions, indicating a reasonably equal distribution of species. The S4 and S6 sites, as well as S2 and S9, have similar index values, indicating that they may have similar species dominance patterns. There is a wide variety of index values, showing different levels of species dominance throughout the sites. Sites with lower Berger–Parker indices might be more ecologically stable due to their diverse species composition.

4. Discussion

4.1. Soil Properties and Pollution Indices

The study of soil properties across different sites in the El-Mahla El-Kobra region reveals important insights into their soil quality and its potential correlation with heavy metal pollution. Soil pH is a critical factor that affects the mobility, solubility, and bioavailability of heavy metals in soils. Generally, heavy metals are less soluble in alkaline soils (pH > 7), which can reduce their mobility and uptake by plants [34]. In the present study, the soil being slightly alkaline (7.38:8.26) might limit the bioavailability of heavy metals, potentially reducing the risk of heavy metal contamination in crops. However, despite the alkalinity, the presence of organic matter and microbial activity can significantly alter the dynamics of metal availability [35] in various sites, which pose high OM, OC, and MBC activities such as S2 (2.48% OM, 1.44% OC, 1.66% MBC), S6 (2.16% OM, 1.25% OC) and S4 (3.6% MBC). Organic matter and microbial activities in those sites play a vital role in binding heavy metals, which impact heavy metal behavior through mechanisms such as metal transformation, immobilization, and solubilization [36,37,38,39]. Furthermore, the high microbial counts (S9 and S6) generally indicate healthy soil conditions, which can enhance the breakdown of organic contaminants, suggesting a great capacity for degrading contaminants and reducing the bioavailability of heavy metals through processes like bioremediation [40]. Conversely, the lower microbial activity at S8 and S5 may indicate reduced soil fertility and a diminished ability to mitigate heavy metal pollution [41].
The ecological threats of heavy metals were assessed based on two fundamental strategies: single pollution indices including CF, and Igeo, and complex pollution indices including CD, MCD, PLI, and PER. The heavy metal concentrations in the studied sites varied exceeding their threshold concentration level. Based on the concentration range limits [42,43,44] for Al (10 g kg−1), Co (15.2 mg kg−1), Cu (56.5 mg kg−1), Fe (14.4 g kg−1), Mn (209 mg kg−1), Ni (30 mg kg−1), Ti (5 g kg−1), Zn (22.1 mg kg−1), Cd (0.2 mg kg−1), Cr (40 mg kg−1), and Pb (13.1 mg kg−1), the heavy metal concentrations across the sites in Table 2 reveal that all sites crossed the limitation levels for Al, Co, Cu, Ti, Cd, and Pb, while they were within the limit levels with Fe, Ni, and Zn. The S4 region recorded the only site that was below the maximum level of Mn, recording 171.95 mg kg−1, while five sites (S2, S5, S6, S8, and S10) were within the limit level of Cr. The data show that S3 had the highest concentrations of Al, Co, Cu, Fe, and Pb, indicating potential risks for contamination and toxicity in this area. High concentrations of heavy metals can result from natural processes [45] or anthropogenic activities such as industrial discharge, use of pesticides, or wastewater irrigation [46,47,48]. For example, elevated Fe (2.25 g kg−1) and Al (209.62 g kg−1) in S3 could be linked to both the parent material of the soil, irrigation with wastewater from polluted drains, or industrial emissions. On the other hand, S4 had the lowest levels of Fe, Mn, Ni, Ti, and Zn, but the highest concentration of chromium (Cr). These variations in metal concentrations suggest localized differences in soil formation processes, pollution sources, and management practices [7]. Additionally, cadmium (Cd) was high in the S2, S5, and S10 sites, with no significant difference between them. Cadmium is highly toxic even at low concentrations, and its presence in agricultural soils is a serious concern for food safety and crop health [49]. The elevated levels of Cd across these sites could be produced by the use of phosphate fertilizers or wastewater irrigation, both of which are known to contribute to soil Cd contamination [50].
The pollution indices of heavy metals provide critical insights into soil pollution and the potential environmental risks posed by these elements. The contamination factor (CF) and geo-accumulation index (Igeo) are essential tools (as single indices) used to assess the level of heavy metal pollution in soils. Based on the classification standard levels demonstrated in Table S1, heavy metal contamination in the El-Mahla El-Kobra region shows significant variability across different sites. Regarding CF data, most sites demonstrated low contamination levels for Fe, Mn, Zn, Pb, and Cr, suggesting minimal pollution from these metals. However, S9 showed a moderate CF level for Cr (1.40), indicating a degree of pollution that warrants further investigation, potentially linked to anthropogenic activities such as industrial waste or agricultural practices [51]. Chromium, especially in its hexavalent form, poses significant health risks and is often associated with industrial effluents [52,53]. The data show that S3 recorded the highest CF for several metals, including Al, Co, Cu, Fe, and Pb, with a considerable level of contamination for Cu (CF = 10.04) and moderate contamination for Al and Co, highlighting this site as a hotspot for pollution. The high CF values in this site indicate the need for targeted pollution control measures [54], particularly for Cu, which is likely linked to industrial or agricultural activities. The Igeo results completed the CF findings, revealing very low contamination levels for Fe, Mn, Ni, and Cr across all sites. This suggests that these elements are not significantly accumulating in the soil and may be present in concentrations close to their natural background levels [55]. Aluminum (Al), Co, Ti, and Pb also exhibited very low to low contamination levels, as indicated by the Igeo values. Given the proximity of these areas to pigment industries, other manufacturing facilities, the use of drainage water for irrigation, and poor fertilizer management practices, the low to very low contamination levels of Al, Co, Ti, and Pb indicated by the Igeo values may not fully reflect the potential for localized pollution. While the overall contamination may appear minimal, these factors suggest the presence of localized hotspots where contamination could be higher than average, leading to progressive contamination over time [56]. Therefore, although current Igeo values suggest low contamination, ongoing industrial activities and poor agricultural practices could cause a buildup of these metals, elevating environmental and health risks [57]. In contrast, Cu contamination presented some variabilities, as S5 and S8 showed low contamination levels for Cu, while all other sites demonstrated moderate contamination according to their Igeo values. This pattern highlights the widespread presence of Cu in soils, potentially from sources like agricultural pesticides, fertilizers, or industrial discharge [17]. The toxicity of Cu to plants and its persistence in the environment make it a metal of concern, and its moderate accumulation in several sites may have long-term ecological consequences [58]. Cadmium (Cd) contamination is particularly noteworthy across the sites. The Igeo values for Cd ranged from low to moderate contamination, with S2 recording the highest value of 1.16. Cadmium is a highly toxic element, often introduced into soils through fertilizers or industrial emissions, and it poses significant risks due to its bioaccumulation potential and toxicity [59]. The moderate Igeo levels of Cd in several sites underscore the need for mitigation measures to prevent its further accumulation and potential entry into the food chain [60]. The S3 site, which recorded levels of Igeo for Al, Co, Cu, and Cd and particularly elevated levels of Cu (1.56), suggests a moderate contamination level that could pose ecological risks. S2 recorded the highest Igeo for Cd (1.16), indicating moderate contamination, while the other sites exhibited low to moderate contamination. The persistence of Cd in soils and its potential for long-term environmental and health impacts make this a critical concern [61].
As for complex pollution indices, these indices offer a comprehensive approach to evaluating the severity of contamination and identifying priority sites for remediation. By integrating multiple contamination factors, they provide a clearer understanding of the ecological risks posed by heavy metals and guide targeted environmental management strategies [62]. All sites fall within the category of considerable contamination based on CD standards. The highest CD value was recorded at S3 (29.45), indicating substantial contamination, likely due to the elevated concentrations of metals such as Al, Co, Cu, and Pb, which suggest a need for urgent remediation detection. S1, on the other hand, recorded the lowest CD value (18.56), indicating a relatively lower contamination level compared to other sites [63]. Modified contamination degree (MCD) provides a refined assessment of contamination by giving more weight to the pollutants with the highest concentrations [64]. S1, S5, and S8 registered low MCD values, reflecting low contamination levels, while S3 recorded the highest MCD value (2.68), reinforcing its status as a site with significant pollution issues. Pollution load index (PLI) is another critical metric that provides an overall indication of the pollution status of a site by taking the geometric mean of CFs for all metals [65]. PLI values across most sites were assigned of low contamination, with S1 recording the lowest PLI (0.98), reflecting a relatively unpolluted state. However, S3 had a PLI value of 1.67, indicating moderate pollution. The PLI is important because it allows for a comparative assessment of the overall pollution load across different sites, enabling decision-makers to prioritize locations for remediation [66]. The potential ecological risk index (PER) assesses the risk posed by heavy metals to the ecosystem, considering both the contamination levels and the ecological sensitivity of the metals [67]. In this study, PER values varied from considerable to very high contamination levels which means ecological threats and necessity considerations need to be considered [68]. S2 and S10 recorded the highest PER values (190.24 and 184.23, respectively), indicating very high ecological risk. These high values are concerning as they reflect a significant threat to local ecosystems, possibly impacting soil health, plant growth, and biodiversity [69]. The presence of heavy metals such as Cd, known for their high toxicity and mobility in soils, likely contributes to these elevated PER values [70]. Overall, these indices highlight that S2, S10, and S3 are among the most contaminated and ecologically risky sites, while S1 and S8 are relatively less affected. These findings can guide prioritization in environmental management and remediation efforts.
To investigate the correlation between soil chemical properties and both single and complex pollution indices, the self-organizing map (SOM) was conducted and is presented in Figure 8. Self-organizing maps (SOM) are kinds of neural networks known as an unsupervised model that visualizes complex environmental data by organizing it into clusters based on similarities [71,72]. In this analysis, various parameters (across all sites) are examined, including OM, OC, TC, pH, EC, and MBC as soil properties, alongside environmental parameters including geochemical indices (Igeo) for most polluted heavy metals (Cd, Co, Pb, and Cu), CD, MCD, PER, and PLI. The SOM reveals distinct four clusters, indicating variability in environmental quality across different areas. Cluster 1, for example, displays lower contamination levels, while Cluster 3 shows higher contamination and risk, as indicated by darker shades representing higher values in indices such as PER and PLI. Decreasing OM, OC, and TC incorporated with differentiation with soil fertility and the potential ecological hazards from geochemical accumulation (Igeo) for Cd, Co, Pb, and Cu, along with serious ecological threads linked to elevation of CD and MCD. Notably, EC in all sites reported no environmental threads, as all sites were considered not saline, except for S3, which appears in the lower left corner. The pH showed a regression with MBC, revealing that possible organic pollution occurred with pH around 7 and MBC about 2% correlating with bacterial activity with TC over 34 × 106 CFU g−1. High values in certain clusters of Igeo for Cd, Co, Pb, and Cu suggest industrial activities or improper waste disposal as potential sources of pollution. These areas may require targeted remediation to reduce ecological risk. The pH and EC maps reveal spatial differences in soil chemistry. Areas with extreme pH values can increase metal mobility, affecting bioavailability and toxicity [73,74]. Additionally, it is noted that the increase occurred in S3 correlated significantly with the increasing toxicity of Co, Pb, Cu, CD, MCD, and PLI, which require immediate attention to mitigate ecological and health impacts. This analysis aids in prioritizing remediation efforts and informs policy decisions on environmental management.

4.2. Soil Fauna and Biota Diversity

Soil fauna plays vital roles in biological processes such as decomposition and transformation of organic matter and thus improves its properties. It is an important indicator of soil health and is used as a biological indicator. Changes in numbers are linked to soil pollution with heavy metals [75]. The activity of soil fauna improves the structure of the soil and increases its fertility because of the decomposition of organic matter and the formation of microbial communities [76]. This leads to enhancing the soil’s ability to increase plant growth and reduce the content of heavy metals in the soil [77]. Soil heavy metal content leads to a decrease in the number and diversity of soil fauna (e.g., springtails, mites, and nematodes) and has a direct impact on the survival and reproduction of soil fauna [78]. In the current study, we found that the lowest total average abundance of faunal species in the S4 area was due to its high Cd and Cu concentrations, which is consistent with the low total bacterial counts. In contrast, the highest total average abundance of faunal species in the S9 area was due to its high OM and moderate contamination [79]. These findings are consistent with those reported by Ding et al. [80], who investigated that Cd causes severe damage to many soil fauna by inhibiting the activities of important enzymes and metabolic processes, changing cell membrane permeability [81]. According to van Noordwijk et al. [82], the organic matter in the soil provides food for the local soil fauna, promoting biodiversity and the accumulation of faunal biomass.

4.3. Correlations Between Pollution Indices and Biota Diversity

Our results indicated fluctuating relationships between soil fauna indices and pollution indices, indicating that the total biological activity, richness, and diversity of soil fauna were impacted by increasing heavy metal concentrations. This is consistent with other studies [83]. In this study, the number of soil fauna decreased with increasing heavy metal concentrations, supporting that microorganisms differ in their sensitivity to heavy metal toxicity.
To delve into the relationships between various diversity indices and environmental variables, Figure 9 is employed. Each plot displays a different regression interaction, with notable trends and implications. A strong positive correlation is observed between the contamination degree (CD) and Simpson’s diversity index, with an R2 value of 76.5%, suggesting that biodiversity responds to the contamination level. Similarly, the relationship between the pollution load index (PLI) and Simpson’s index shows close alignment, with an R2 of 76.4%, reinforcing the idea that lower biodiversity coincides with elevated PLI. This aligns with Magurran [84], who emphasized the importance of these indices in understanding species diversity and their ecological impacts. The positive correlations between diversity indices and contamination indices reflect ecosystem responses to pollution, supporting theories proposed by Cardinale et al. [85], which highlights the role of species richness and evenness in regulating ecosystem functions. This suggests that environments with greater biodiversity might buffer or distribute pollutants across various species, leading to higher contamination metrics [86]. Further analysis reveals that both CD and PLI exhibit moderate positive correlations with the Shannon–Wiener index, with R2 values of 67.3% and 69.5%, respectively. This indicates that ecosystems with greater species diversity (as measured by the Shannon–Wiener index) tend to have higher contamination and pollution loads. This indicates that as soil contamination increases, certain tolerant species may thrive, increasing their dominance. This trend could be due to the complex interactions between species and pollutants, where increased diversity potentially reflects the system’s ability to support different species despite environmental stressors. Pollution can act as a disturbance, potentially leading to successional processes where more species establish themselves over time. In contrast, the regression between MCD and PLI versus Berger–Parker dominance index reveals a negative correlation, with R2 values of 70.3% and 69.1%, respectively. This suggests that environments with higher species dominance (i.e., fewer species dominating the ecosystem) tend to exhibit lower MCD and PLI values. This could be attributed to the dominance of pollution-tolerant species in degraded environments, where reduced species diversity reflects lower overall contamination levels, as fewer species are left to distribute the pollutants. These findings indicate that diversity indices, particularly the Simpson and Shannon–Wiener indices, are strongly linked to environmental contamination levels, underscoring the complex relationship between biodiversity and pollution. As species richness and evenness increase, so do contamination and pollution loads, supporting the theory that diverse ecosystems are more resilient to environmental stressors but are also more prone to accumulating contaminants.

5. Conclusions

This study presents an extensive analysis of soil quality, heavy metal contamination, and species diversity across ten sites in El-Mahla El-Kobra, Egypt, a region long impacted by industrial pollution and improper agricultural practices. Variations in soil OM, MBC, and microbial populations suggest local differences in organic activity and soil health. The highest contamination levels for heavy metals such as Al, Co, and Pb, correlated with high contamination factors (CF) for these elements, particularly Cu (10.04) and Pb (0.53). In terms of pollution indices, S3 recorded the highest values for contamination degree (CD) at 29.45, modified contamination degree (MCD) at 2.68, and pollution load index (PLI) at 1.67, indicating a pronounced level of heavy metal pollution. Conversely, S1 registered the lowest pollution indices, including CD, MCD, PLI, and PER, with 18.56, 1.69, 0.98, and 110.53 values, respectively. The SOM analysis illustrated that the reduction in OM, OC, and TC correlated to soil fertility changes and the potential ecological hazards from Igeo for Cd, Co, Pb, and Cu, besides high ecological risks linked to increments of CD and MCD. Biodiversity assessments revealed the following descending order of relative abundance: Orbatida > Prostigmata > Collembola > Mesostigmata with site S9 having the richest fauna diversity (239 species) whereas Site S4 had the lowest diversity, while S3 region exhibited the most elevated Shannon–Wiener index and Simpson’s index. Strong positive correlations between soil CD and PLI with both Simpson’s diversity index and Shannon–Wiener index and negative correlations between MCD and PLI versus Berger–Parker dominance index suggest a complex interaction with a shift towards dominance by fewer species in polluted environments.

Supplementary Materials

The following supporting information can be downloaded at: https://www.mdpi.com/article/10.3390/su17041524/s1, Table S1: Standards of pollution levels by different pollution indices. References [7,69,87,88,89,90] are cited in Supplementary Materials.

Author Contributions

Conceptualization G.E.-S., R.Z. and A.E.B.; methodology, G.E.-S., A.E.-D.O., R.Z. and A.E.B.; software, M.E.-S., M.O.A. and R.Z.; validation, M.E.-S., A.E.-D.O. and R.Z.; formal analysis, G.E.-S., R.Z. and A.E.-D.O.; investigation, M.E.-S. and E.M.; resources, G.E.-S., R.Z. and A.E.B.; data curation, G.E.-S., R.Z. and A.E.B.; writing—original draft preparation, M.E.-S., G.E.-S. and R.Z.; writing—review and editing, E.M, M.O.A. and M.E.-S.; visualization, E.M, M.O.A. and M.E.-S.; supervision, E.M, A.E.-D.O., A.E.B. and M.E.-S.; project administration, G.E.-S., R.Z. and E.M.; funding acquisition, M.O.A. All authors have read and agreed to the published version of the manuscript.

Funding

This work was supported by Princess Nourah bint Abdulrahman University Researchers Supporting Project number (PNURSP2025R101), Princess Nourah bint Abdulrahman University, Riyadh, Saudi Arabia.

Data Availability Statement

The authors confirm that the data supporting the findings of this study are available within the article and Supplementary Materials.

Acknowledgments

The authors would like to appreciate Princess Nourah bint Abdulrahman University, Riyadh, Saudi Arabia for supporting this study. Also, appreciate the Laboratory of Soil, Water and Plant Analysis, Faculty of Agriculture, Tanta University, Egypt.

Conflicts of Interest

The authors declare no conflicts of interest.

References

  1. Teschke, R. Aluminum, Arsenic, Beryllium, Cadmium, Chromium, Cobalt, Copper, Iron, Lead, Mercury, Molybdenum, Nickel, Platinum, Thallium, Titanium, Vanadium, and Zinc: Molecular Aspects in Experimental Liver Injury. Int. J. Mol. Sci. 2022, 23, 12213. [Google Scholar] [CrossRef] [PubMed]
  2. Fred-Ahmadu, O.H.; Ayejuyo, O.O.; Tenebe, I.T.; Benson, N.U. Occurrence and Distribution of Micro(Meso)Plastic-Sorbed Heavy Metals and Metalloids in Sediments, Gulf of Guinea Coast (SE Atlantic). Sci. Total Environ. 2022, 813, 152650. [Google Scholar] [CrossRef] [PubMed]
  3. Hu, H.; Zheng, H.; Liu, F.; Ding, Z.; Wang, Z.; Peng, Y.; Zhang, D.; Zhang, Y.; Zheng, Y.; Ding, A. Heavy Metal Contamination Assessment and Source Attribution in the Vicinity of an Iron Slag Pile in Hechi, China: Integrating Multi-Medium Analysis. Environ. Res. 2024, 263, 120206. [Google Scholar] [CrossRef] [PubMed]
  4. Hussein, M.H.A.; Ali, M.; Abbas, M.H.H.; Bassouny, M.A. Effects of Industrialization Processes in Giza Factories (Egypt) on Soil and Water Quality in Adjacent Territories. Egypt. J. Soil Sci. 2022, 62, 253–266. [Google Scholar] [CrossRef]
  5. Goher, M.E.; Mangood, A.H.; Mousa, I.E.; Salem, S.G.; Hussein, M.M. Ecological Risk Assessment of Heavy Metal Pollution in Sediments of Nile River, Egypt. Environ. Monit. Assess. 2021, 193, 703. [Google Scholar] [CrossRef]
  6. EL-Sharkawy, M.; Sleem, M.; Du, D.; El Baroudy, A.; Li, J.; Mahmoud, E.; Ali, N. Nano-water Treatment Residuals: Enhancing Phosphorus Kinetics and Optimization in Saline Soils. Land Degrad. Dev. 2024, 35, 3314–3329. [Google Scholar] [CrossRef]
  7. El-Sharkawy, M.; Li, J.; Kamal, N.; Mahmoud, E.; Omara, A.E.-D.; Du, D. Assessing and Predicting Soil Quality in Heavy Metal-Contaminated Soils: Statistical and ANN-Based Techniques. J. Soil Sci. Plant Nutr. 2023, 23, 6510–6526. [Google Scholar] [CrossRef]
  8. Mohammed, A.M.F.; Saleh, I.A.; Zahran, H.R.; Abdel-Latif, N.M. Ecological and Risk Assessment of Heavy Metals in a Diverse Industrial Area of Al-Akrasha, Egypt. Atmosphere 2023, 14, 1745. [Google Scholar] [CrossRef]
  9. El-Sharkawy, M.; Alotaibi, M.O.; Li, J.; Du, D.; Mahmoud, E. Heavy Metal Pollution in Coastal Environments: Ecological Implications and Management Strategies: A Review. Sustainability 2025, 17, 701. [Google Scholar] [CrossRef]
  10. Zheng, J.; Weng, C.; Tian, C.; Zhang, W.; Qin, J.; Li, X.; Liu, W.; Zhang, J.; Lin, Z. Ingenious Approach for Retrieving Valuable Metals from Gypsum via Dehydration–Rehydration Two-Step Phase Transition. Chem. Eng. J. 2024, 491, 152122. [Google Scholar] [CrossRef]
  11. Behan-Pelletier, V.; Lindo, Z. Oribatid Mites: Biodiversity, Taxonomy and Ecology, 1st ed.; CRC Press: Boca Raton, FL, USA, 2023; ISBN 1003214649. [Google Scholar]
  12. Neemisha. Role of Soil Organisms in Maintaining Soil Health, Ecosystem Functioning, and Sustaining Agricultural Production. In Soil Health; Giri, B., Varma, A., Eds.; Springer International Publishing: Cham, Switzerland, 2020; ISBN 978-3-030-44364-1. [Google Scholar]
  13. Brown, E.D.; Williams, B.K. Ecological Integrity Assessment as a Metric of Biodiversity: Are We Measuring What We Say We Are? Biodivers. Conserv. 2016, 25, 1011–1035. [Google Scholar] [CrossRef]
  14. Pennekamp, F.; Pontarp, M.; Tabi, A.; Altermatt, F.; Alther, R.; Choffat, Y.; Fronhofer, E.A.; Ganesanandamoorthy, P.; Garnier, A.; Griffiths, J.I.; et al. Biodiversity Increases and Decreases Ecosystem Stability. Nature 2018, 563, 109–112. [Google Scholar] [CrossRef] [PubMed]
  15. Manu, M.; Honciuc, V.; Neagoe, A.; Băncilă, R.I.; Iordache, V.; Onete, M. Soil Mite Communities (Acari: Mesostigmata, Oribatida) as Bioindicators for Environmental Conditions from Polluted Soils. Sci. Rep. 2019, 9, 20250. [Google Scholar] [CrossRef] [PubMed]
  16. Walter, D.E.; Proctor, H.C. Mites in Soil and Litter Systems. In Mites: Ecology, Evolution & Behaviour: Life at a Microscale; Walter, D.E., Proctor, H.C., Eds.; Springer: Dordrecht, The Netherlands, 2013; pp. 161–228. ISBN 978-94-007-7164-2. [Google Scholar]
  17. Ali, H.; Khan, E.; Ilahi, I. Environmental Chemistry and Ecotoxicology of Hazardous Heavy Metals: Environmental Persistence, Toxicity, and Bioaccumulation. J. Chem. 2019, 2019, 6730305. [Google Scholar] [CrossRef]
  18. Cottenie, A.; Verloo, M.; Kiekens, L. Chemical Analysis of Plants and Soils; RUG Laboratory of Analytical and Agrochemistry: Gent, Belgium, 1982; Volume 42. [Google Scholar]
  19. Ladd, J.N.; Amato, M. Relationship between Microbial Biomass Carbon in Soils and Absorbance (260 Nm) of Extracts of Fumigated Soils. Soil Biol. Biochem. 1989, 21, 457–459. [Google Scholar] [CrossRef]
  20. Schnitzer, M. Chapter 1 Humic Substances: Chemistry and Reactions. In Soil Organic Matter; Schnitzer, M., Khan, S.U., Eds.; Developments in Soil Science; Elsevier: Amsterdam, The Netherlands, 1978; Volume 8, pp. 1–64. ISBN 0166-2481. [Google Scholar]
  21. Stevenson, F.J. Humus Chemistry: Genesis, Composition, Reactions, 2nd ed.; Wiley: New York, NY, USA, 1994; ISBN 9780471594741. [Google Scholar]
  22. Allen, O.N. Experiments in Soil Bacteriology. Soil Sci. 1958, 85, 172. [Google Scholar] [CrossRef]
  23. Siddique, M.A.B.; Alam, M.K.; Islam, S.; Diganta, M.T.M.; Akbor, M.A.; Bithi, U.H.; Chowdhury, A.I.; Ullah, A.K.M.A. Apportionment of Some Chemical Elements in Soils around the Coal Mining Area in Northern Bangladesh and Associated Health Risk Assessment. Environ. Nanotechnol. Monit. Manag. 2020, 14, 100366. [Google Scholar] [CrossRef]
  24. Weissmannová, H.D.; Pavlovský, J. Indices of Soil Contamination by Heavy Metals–Methodology of Calculation for Pollution Assessment (Minireview). Environ. Monit. Assess. 2017, 189, 616. [Google Scholar] [CrossRef]
  25. IAEA AQCS Catalogue for Reference Materials and Intercomparison Exercises 1998/1999; International Atomic Energy Agency: Vienna, Austria, 1998.
  26. Al-Assiuty, A.I.M.; Bayoumi, B.M.; Khalil, M.A.; Van Straalen, N.M. The Influence of Vegetational Type on Seasonal Abundance and Species Composition of Soil Fauna at Different Localities in Egypt. Pedobiologia 1993, 37, 210–222. [Google Scholar] [CrossRef]
  27. Silver, J.B. (Ed.) Indices of Association and Species Diversity Indices. In Mosquito Ecology: Field Sampling Methods; Springer: Dordrecht, The Netherlands, 2008; pp. 1445–1467. ISBN 978-1-4020-6666-5. [Google Scholar]
  28. Roberts, F.S. Measurement of Biodiversity: Richness and Evenness. In Mathematics of Planet Earth: Protecting Our Planet, Learning from the Past, Safeguarding for the Future; Kaper, H.G., Roberts, F.S., Eds.; Springer International Publishing: Cham, Switzerland, 2019; pp. 203–224. ISBN 978-3-030-22044-0. [Google Scholar]
  29. Pielou, E.C. The Measurement of Diversity in Different Types of Biological Collections. J. Theor. Biol. 1966, 13, 131–144. [Google Scholar] [CrossRef]
  30. Sorensen, T. A Method of Establishing Groups of Equal Amplitude in Plant Sociology Based on Similarity of Species Content and Its Application to Analyses of the Vegetation on Danish Commons. Biol. Skr. 1948, 5, 1–34. [Google Scholar] [CrossRef]
  31. Magurran, A.E. A Variety of Diversities. In Ecological Diversity and Its Measurement; Magurran, A.E., Ed.; Springer: Dordrecht, The Netherlands, 1988; pp. 81–99. ISBN 978-94-015-7358-0. [Google Scholar]
  32. Engelmann, H.-D. Zur Dominanzklassifizierung von Bodenarthropoden. Pedobiologia 1978, 18, 378–380. [Google Scholar] [CrossRef]
  33. Berger, W.H.; Parker, F.L. Diversity of Planktonic Foraminifera in Deep-Sea Sediments. Science 1970, 168, 1345–1347. [Google Scholar] [CrossRef] [PubMed]
  34. Bolan, N.; Kunhikrishnan, A.; Thangarajan, R.; Kumpiene, J.; Park, J.; Makino, T.; Kirkham, M.B.; Scheckel, K. Remediation of Heavy Metal(Loid)s Contaminated Soils—To Mobilize or to Immobilize? J. Hazard. Mater. 2014, 266, 141–166. [Google Scholar] [CrossRef] [PubMed]
  35. Stefanowicz, A.M.; Kapusta, P.; Zubek, S.; Stanek, M.; Woch, M.W. Soil Organic Matter Prevails over Heavy Metal Pollution and Vegetation as a Factor Shaping Soil Microbial Communities at Historical Zn–Pb Mining Sites. Chemosphere 2020, 240, 124922. [Google Scholar] [CrossRef]
  36. Gao, J.; Han, H.; Gao, C.; Wang, Y.; Dong, B.; Xu, Z. Organic Amendments for in Situ Immobilization of Heavy Metals in Soil: A Review. Chemosphere 2023, 335, 139088. [Google Scholar] [CrossRef]
  37. Li, Q.; Wang, Y.; Li, Y.; Li, L.; Tang, M.; Hu, W.; Chen, L.; Ai, S. Speciation of Heavy Metals in Soils and Their Immobilization at Micro-Scale Interfaces among Diverse Soil Components. Sci. Total Environ. 2022, 825, 153862. [Google Scholar] [CrossRef]
  38. Zhuo, T.; He, L.; Chai, B.; Zhou, S.; Wan, Q.; Lei, X.; Zhou, Z.; Chen, B. Micro-Pressure Promotes Endogenous Phosphorus Release in a Deep Reservoir by Favouring Microbial Phosphate Mineralisation and Solubilisation Coupled with Sulphate Reduction. Water Res. 2023, 245, 120647. [Google Scholar] [CrossRef]
  39. Pan, X.-R.; Shang-Guan, P.-K.; Li, S.-H.; Zhang, C.-H.; Lou, J.-M.; Guo, L.; Liu, L.; Lu, Y. The Influence of Carbon Dioxide on Fermentation Products, Microbial Community, and Functional Gene in Food Waste Fermentation with Uncontrol PH. Environ. Res. 2025, 267, 120645. [Google Scholar] [CrossRef]
  40. Zhang, H.; Yuan, X.; Xiong, T.; Wang, H.; Jiang, L. Bioremediation of Co-Contaminated Soil with Heavy Metals and Pesticides: Influence Factors, Mechanisms and Evaluation Methods. Chem. Eng. J. 2020, 398, 125657. [Google Scholar] [CrossRef]
  41. Khan, S.; El-Latif Hesham, A.; Qiao, M.; Rehman, S.; He, J.-Z. Effects of Cd and Pb on Soil Microbial Community Structure and Activities. Environ. Sci. Pollut. Res. 2010, 17, 288–296. [Google Scholar] [CrossRef] [PubMed]
  42. Lester, L.A. Statistical Analysis: Metal Concentrations in Soil; Department of Environmental Protection and Energy, Division of Science and Research: Trenton, NJ, USA, 2020; pp. 1–40.
  43. Mahey, S.; Kumar, R.; Sharma, M.; Kumar, V.; Bhardwaj, R. A Critical Review on Toxicity of Cobalt and Its Bioremediation Strategies. SN Appl. Sci. 2020, 2, 1279. [Google Scholar] [CrossRef]
  44. Barałkiewicz, D.; Siepak, J. Chromium, Nickel and Cobalt in Environmental Samples and Existing Legal Norms. Pol. J. Environ. Stud. 1999, 8, 201–208. [Google Scholar]
  45. Kiran; Bharti, R.; Sharma, R. Effect of Heavy Metals: An Overview. Mater. Today Proc. 2022, 51, 880–885. [Google Scholar] [CrossRef]
  46. Khatri, N.; Tyagi, S. Influences of Natural and Anthropogenic Factors on Surface and Groundwater Quality in Rural and Urban Areas. Front. Life Sci. 2015, 8, 23–39. [Google Scholar] [CrossRef]
  47. Akhtar, N.; Syakir Ishak, M.I.; Bhawani, S.A.; Umar, K. Various Natural and Anthropogenic Factors Responsible for Water Quality Degradation: A Review. Water 2021, 13, 2660. [Google Scholar] [CrossRef]
  48. Yu, K.; Chai, B.; Zhuo, T.; Tang, Q.; Gao, X.; Wang, J.; He, L.; Lei, X.; Chen, B. Hydrostatic Pressure Drives Microbe-Mediated Biodegradation of Microplastics in Surface Sediments of Deep Reservoirs: Novel Findings from Hydrostatic Pressure Simulation Experiments. Water Res. 2023, 242, 120185. [Google Scholar] [CrossRef]
  49. Suhani, I.; Sahab, S.; Srivastava, V.; Singh, R.P. Impact of Cadmium Pollution on Food Safety and Human Health. Curr. Opin. Toxicol. 2021, 27, 1–7. [Google Scholar] [CrossRef]
  50. Soleimani, H.; Mansouri, B.; Kiani, A.; Omer, A.K.; Tazik, M.; Ebrahimzadeh, G.; Sharafi, K. Ecological Risk Assessment and Heavy Metals Accumulation in Agriculture Soils Irrigated with Treated Wastewater Effluent, River Water, and Well Water Combined with Chemical Fertilizers. Heliyon 2023, 9, e14580. [Google Scholar] [CrossRef]
  51. Kabata-Pendias, A. Trace Elements in Soils and Plants, 3rd ed.; CRC Press: Boca Raton, FL, USA, 2000; ISBN 9780429191121. [Google Scholar]
  52. Ukhurebor, K.E.; Aigbe, U.O.; Onyancha, R.B.; Nwankwo, W.; Osibote, O.A.; Paumo, H.K.; Ama, O.M.; Adetunji, C.O.; Siloko, I.U. Effect of Hexavalent Chromium on the Environment and Removal Techniques: A Review. J. Environ. Manag. 2021, 280, 111809. [Google Scholar] [CrossRef]
  53. Prasad, S.; Yadav, K.K.; Kumar, S.; Gupta, N.; Cabral-Pinto, M.M.S.; Rezania, S.; Radwan, N.; Alam, J. Chromium Contamination and Effect on Environmental Health and Its Remediation: A Sustainable Approaches. J. Environ. Manag. 2021, 285, 112174. [Google Scholar] [CrossRef] [PubMed]
  54. Yang, Q.; Li, Z.; Lu, X.; Duan, Q.; Huang, L.; Bi, J. A Review of Soil Heavy Metal Pollution from Industrial and Agricultural Regions in China: Pollution and Risk Assessment. Sci. Total Environ. 2018, 642, 690–700. [Google Scholar] [CrossRef] [PubMed]
  55. Nweke, M.O.; Ukpai, S.N. Use of Enrichment, Ecological Risk and Contamination Factors with Geoaccumulation Indexes to Evaluate Heavy Metal Contents in the Soils around Ameka Mining Area, South of Abakaliki, Nigeria. J. Geogr. Environ. Earth Sci. Int. 2016, 5, 1–13. [Google Scholar] [CrossRef]
  56. Wuana, R.A.; Okieimen, F.E. Heavy Metals in Contaminated Soils: A Review of Sources, Chemistry, Risks and Best Available Strategies for Remediation. Int. Sch. Res. Not. 2011, 2011, 402647. [Google Scholar] [CrossRef]
  57. Tóth, G.; Hermann, T.; Da Silva, M.R.; Montanarella, L. Heavy Metals in Agricultural Soils of the European Union with Implications for Food Safety. Environ. Int. 2016, 88, 299–309. [Google Scholar] [CrossRef]
  58. Saxena, G.; Purchase, D.; Mulla, S.I.; Saratale, G.D.; Bharagava, R.N. Phytoremediation of Heavy Metal-Contaminated Sites: Eco-Environmental Concerns, Field Studies, Sustainability Issues, and Future Prospects. In Reviews of Environmental Contamination and Toxicology; de Voogt, P., Ed.; Springer International Publishing: Cham, Switzerland, 2020; Volume 249, pp. 71–131. ISBN 978-3-030-20194-4. [Google Scholar]
  59. Hayat, M.T.; Nauman, M.; Nazir, N.; Ali, S.; Bangash, N. Chapter 7—Environmental Hazards of Cadmium: Past, Present, and Future. In Cadmium Toxicity and Tolerance in Plants; Hasanuzzaman, M., Prasad, M.N.V., Fujita, M., Eds.; Academic Press: Cambridge, MA, USA, 2019; pp. 163–183. ISBN 978-0-12-814864-8. [Google Scholar]
  60. Soni, S.; Jha, A.B.; Dubey, R.S.; Sharma, P. Mitigating Cadmium Accumulation and Toxicity in Plants: The Promising Role of Nanoparticles. Sci. Total Environ. 2024, 912, 168826. [Google Scholar] [CrossRef]
  61. Rahman, Z.; Singh, V.P. The Relative Impact of Toxic Heavy Metals (THMs) (Arsenic (As), Cadmium (Cd), Chromium (Cr)(VI), Mercury (Hg), and Lead (Pb)) on the Total Environment: An Overview. Environ. Monit. Assess. 2019, 191, 419. [Google Scholar] [CrossRef]
  62. Qiao, D.; Wang, G.; Li, X.; Wang, S.; Zhao, Y. Pollution, Sources and Environmental Risk Assessment of Heavy Metals in the Surface AMD Water, Sediments and Surface Soils around Unexploited Rona Cu Deposit, Tibet, China. Chemosphere 2020, 248, 125988. [Google Scholar] [CrossRef]
  63. Chen, T.-B.; Zheng, Y.-M.; Lei, M.; Huang, Z.-C.; Wu, H.-T.; Chen, H.; Fan, K.-K.; Yu, K.; Wu, X.; Tian, Q.-Z. Assessment of Heavy Metal Pollution in Surface Soils of Urban Parks in Beijing, China. Chemosphere 2005, 60, 542–551. [Google Scholar] [CrossRef]
  64. Nawrot, N.; Wojciechowska, E.; Mohsin, M.; Kuittinen, S.; Pappinen, A.; Rezania, S. Trace Metal Contamination of Bottom Sediments: A Review of Assessment Measures and Geochemical Background Determination Methods. Minerals 2021, 11, 872. [Google Scholar] [CrossRef]
  65. Lee, H.; Kim, H.-K.; Noh, H.-J.; Byun, Y.J.; Chung, H.-M.; Kim, J.-I. Source Identification and Assessment of Heavy Metal Contamination in Urban Soils Based on Cluster Analysis and Multiple Pollution Indices. J. Soils Sediments 2021, 21, 1947–1961. [Google Scholar] [CrossRef]
  66. Proshad, R.; Abedin Asha, S.M.A.; Abedin, M.A.; Chen, G.; Li, Z.; Zhang, S.; Tan, R.; Lu, Y.; Zhang, X.; Zhao, Z. Pollution Area Identification, Receptor Model-Oriented Sources and Probabilistic Health Hazards to Prioritize Control Measures for Heavy Metal Management in Soil. J. Environ. Manag. 2024, 369, 122322. [Google Scholar] [CrossRef] [PubMed]
  67. Zerizghi, T.; Guo, Q.; Tian, L.; Wei, R.; Zhao, C. An Integrated Approach to Quantify Ecological and Human Health Risks of Soil Heavy Metal Contamination around Coal Mining Area. Sci. Total Environ. 2022, 814, 152653. [Google Scholar] [CrossRef] [PubMed]
  68. Huang, L.; Rad, S.; Xu, L.; Gui, L.; Song, X.; Li, Y.; Wu, Z.; Chen, Z. Heavy Metals Distribution, Sources, and Ecological Risk Assessment in Huixian Wetland, South China. Water 2020, 12, 431. [Google Scholar] [CrossRef]
  69. Hakanson, L. An Ecological Risk Index for Aquatic Pollution Control.a Sedimentological Approach. Water Res. 1980, 14, 975–1001. [Google Scholar] [CrossRef]
  70. Kubier, A.; Wilkin, R.T.; Pichler, T. Cadmium in Soils and Groundwater: A Review. Appl. Geochem. 2019, 108, 104388. [Google Scholar] [CrossRef]
  71. Licen, S.; Astel, A.; Tsakovski, S. Self-Organizing Map Algorithm for Assessing Spatial and Temporal Patterns of Pollutants in Environmental Compartments: A Review. Sci. Total Environ. 2023, 878, 163084. [Google Scholar] [CrossRef]
  72. Zhao, Y.; Yi, J.; Yao, R.; Li, F.; Hill, R.L.; Gerke, H.H. Dimensionality and Scales of Preferential Flow in Soils of Shale Hills Hillslope Simulated Using HYDRUS. Vadose Zone J. 2024, 23, e20367. [Google Scholar] [CrossRef]
  73. Kicińska, A.; Pomykała, R.; Izquierdo-Diaz, M. Changes in Soil PH and Mobility of Heavy Metals in Contaminated Soils. Eur. J. Soil Sci. 2022, 73, e13203. [Google Scholar] [CrossRef]
  74. Wu, X.; Zhao, Y. A Novel Heat Pulse Method in Determining “Effective” Thermal Properties in Frozen Soil. Water Resour. Res. 2024, 60, e2024WR037537. [Google Scholar] [CrossRef]
  75. Ertiban, S.M. Soil Fauna as Webmasters, Engineers and Bioindicators in Ecosystems: Implications for Conservation Ecology and Sustainable Agriculture. Am. J. Life Sci. 2019, 7, 17–26. [Google Scholar] [CrossRef]
  76. Edwards, C.A.; Arancon, N.Q. (Eds.) Earthworms, Soil Structure, Fertility, and Productivity. In Biology and Ecology of Earthworms; Springer: New York, NY, USA, 2022; pp. 303–334. ISBN 978-0-387-74943-3. [Google Scholar]
  77. Zhao, L.; Zhang, F.-S.; Wang, K.; Zhu, J. Chemical Properties of Heavy Metals in Typical Hospital Waste Incinerator Ashes in China. Waste Manag. 2009, 29, 1114–1121. [Google Scholar] [CrossRef] [PubMed]
  78. Yin, X.; Song, B.; Dong, W.; Xin, W.; Wang, Y. A Review on the Eco-Geography of Soil Fauna in China. J. Geogr. Sci. 2010, 20, 333–346. [Google Scholar] [CrossRef]
  79. El-Kahawy, R.; El-Shafeiy, M.; Helal, S.; Aboul-Ela, N.; Abd El-Wahab, M. Benthic Ostracods (Crustacean) as a Nearshore Pollution Bio-Monitor: Examples from the Red Sea Coast of Egypt. Environ. Sci. Pollut. Res. 2021, 28, 31975–31993. [Google Scholar] [CrossRef] [PubMed]
  80. Ding, J.; Zhu, D.; Wang, H.-T.; Lassen, S.B.; Chen, Q.-L.; Li, G.; Lv, M.; Zhu, Y.-G. Dysbiosis in the Gut Microbiota of Soil Fauna Explains the Toxicity of Tire Tread Particles. Environ. Sci. Technol. 2020, 54, 7450–7460. [Google Scholar] [CrossRef]
  81. Shah, K.; Dubey, R.S. Cadmium Elevates Level of Protein, Amino Acids and Alters Activity of Proteolytic Enzymes in Germinating Rice Seeds. Acta Physiol. Plant. 1998, 20, 189–196. [Google Scholar] [CrossRef]
  82. van Noordwijk, M.; Schoonderbeek, D.; Kooistra, M.J. Root—Soil Contact of Field-Grown Winter WheatααCommunication No. 45 of the Dutch Programme on Soil Ecology of Arable Farming Systems. In Soil Structure/Soil Biota Interrelationships; Brussaard, L., Kooistra, M.J., Eds.; Elsevier: Amsterdam, The Netherlands, 1993; pp. 277–286. ISBN 978-0-444-81490-6. [Google Scholar]
  83. Roane, T.M.; Kellogg, S.T. Characterization of Bacterial Communities in Heavy Metal Contaminated Soils. Can. J. Microbiol. 1996, 42, 593–603. [Google Scholar] [CrossRef]
  84. Magurran, A.E. Ecological Diversity and Its Measurement, 1st ed.; Springer: Dordrecht, The Netherlands, 1988; p. 179. [Google Scholar] [CrossRef]
  85. Cardinale, B.J.; Nelson, K.; Palmer, M.A. Linking Species Diversity to the Functioning of Ecosystems: On the Importance of Environmental Context. Oikos 2000, 91, 175–183. [Google Scholar] [CrossRef]
  86. Cachada, A.; Rocha-Santos, T.; Duarte, A.C. Chapter 1—Soil and Pollution: An Introduction to the Main Issues. In Soil Pollution; Duarte, A.C., Cachada, A., Rocha-Santos, T., Eds.; Academic Press: Cambridge, MA, USA, 2018; pp. 1–28. ISBN 978-0-12-849873-6. [Google Scholar]
  87. Rahman, S.H.; Khanam, D.; Adyel, T.M.; Islam, M.S.; Ahsan, M.A.; Akbor, M.A. Assessment of Heavy Metal Contamination of Agricultural Soil around Dhaka Export Processing Zone (DEPZ), Bangladesh: Implication of Seasonal Variation and Indices. Appl. Sci. 2012, 2, 584–601. [Google Scholar] [CrossRef]
  88. Jorfi, S.; Maleki, R.; Jaafarzadeh, N.; Ahmadi, M. Pollution Load Index for Heavy Metals in Mian-Ab Plain Soil, Khuzestan, Iran. Data Br. 2017, 15, 584–590. [Google Scholar] [CrossRef]
  89. Srinivasa Gowd, S.; Ramakrishna Reddy, M.; Govil, P.K. Assessment of Heavy Metal Contamination in Soils at Jajmau (Kanpur) and Unnao Industrial Areas of the Ganga Plain, Uttar Pradesh, India. J. Hazard. Mater. 2010, 174, 113–121. [Google Scholar] [CrossRef] [PubMed]
  90. Guan, Y.; Shao, C.; Ju, M. Heavy Metal Contamination Assessment and Partition for Industrial and Mining Gathering Areas. Int. J. Environ. Res. Public Health 2014, 11, 7286–7303. [Google Scholar] [CrossRef] [PubMed]
Figure 1. The locations of soil sample sites.
Sustainability 17 01524 g001
Figure 2. Sampling soil samples for biodiversity studies including (a) illustration of a basic Berlese funnel apparatus, (b) soil core sampling procedure, (c) array of Berlese–Tullgren funnels in laboratory setup, and (d) diagram of a Berlese funnel apparatus with annotations.
Sustainability 17 01524 g002
Figure 3. Pollution indices include contamination degree (CD), modified contamination degree (MCD), potential ecological risk index (PER), and pollution load index (PLI) in different contaminated sites. Column values with the different letters are statistically different according to the Duncan multiple range test (DMRT) at p < 0.05.
Sustainability 17 01524 g003
Figure 4. Species diversity in contaminated sites. Column values with the different letters are statistically different according to the Duncan multiple range test (DMRT) at p < 0.05.
Sustainability 17 01524 g004
Figure 5. Hierarchical clustering dendrogram of the degree of similarities between studied sites.
Sustainability 17 01524 g005
Figure 6. Average relative abundance of different soil mite species included in the soil sites.
Sustainability 17 01524 g006
Figure 7. Berker–Parker index in different soil sites. Column values with the different letters are statistically different according to the Duncan multiple range test (DMRT) at p < 0.05.
Sustainability 17 01524 g007
Figure 8. Self-organizing maps (SOM) for soil characteristics and contamination indices.
Sustainability 17 01524 g008
Figure 9. Regressions between some pollution indices (contamination degree, and pollution load index) and diversity indexes.
Sustainability 17 01524 g009
Table 1. Soil characteristics of different soil samples located in different sites.
SitespHEC OM OC HAFAMBCTotal Bacterial Count × 106
-dS m−1%%%%%CFU g−1
S17.400.621.330.770.150.400.5515.50
S27.600.272.481.440.290.741.6621.50
S38.034.631.220.710.140.370.4421.50
S48.060.211.400.810.160.423.6012.50
S57.960.371.090.630.130.331.358.00
S67.850.792.161.250.250.650.5526.00
S77.701.041.710.990.200.510.9918.00
S87.382.161.190.690.140.360.326.00
S97.691.011.811.050.210.540.4839.00
S108.260.211.310.760.150.391.7017.00
pH (1:2.5, soil:water), EC (1:5, soil:water), O.M: organic matter, OC: organic carbon, MBC: microbial biomass carbon, CFU: colony-forming unit.
Table 2. Heavy metals concentrations (mg kg−1) in soil samples in different location sites.
SitesAlCoCuFeMnNiTIZnCdCrPb
S1136,905.60 h18.72 h76.06 f1398.52 f209.95 e7.11 d7213.81 f6.81 g0.52 e42.23 c20.27 f
S2150,616.08 f35.38 b104.51 b2038.76 b332.52 c11.13 b13,353.51 ab17.77 b1.00 a29.24 f29.33 b
S3209,621.93 a37.96 a110.44 a2259.97 a376.11 b11.36 b11,936.98 c14.98 e0.87 bc49.62 b31.77 a
S4145,476.75 g20.89 g104.50 b1394.03 f171.95 f6.94 d6918.79 f7.25 g0.58 de83.98 a19.92 f
S5129,275.75 i23.94 f61.21 g1532.30 e333.73 c11.25 b9616.85 e19.30 a0.94 ab6.16 h22.16 e
S6153,285.47 d32.29 c80.31 e2044.30 b487.32 a12.73 a13,106.47 b16.86 bc0.91 b10.61 g28.56 b
S7162,324.01 b29.60 d89.05 d1898.77 c328.13 c10.45 b10,565.50 d11.84 f0.81 c34.07 d27.22 c
S8114,825.60 j23.60 f57.13 h1530.00 e365.35 b11.53 b9708.53 e15.60 de0.90 b6.16 h21.61 e
S9160,880.06 c27.76 e96.40 c1775.64 d258.05 d8.90 c9504.86 e16.48 cd0.63 d49.86 b25.13 d
S10151,972.13 e37.75 a109.14 a2026.64 b328.33 c11.02 b13,523.25 a15.27 e0.92 ab32.20 e29.38 b
LSD (0.05)1025.861.051.6074.4211.791.08334.020.990.081.430.78
Column values with the different letters are statistically different according to the Duncan multiple range test (DMRT) at p < 0.05.
Table 3. Contamination factor (CF) of heavy metals in soil samples located at different location sites.
SitesAlCoCuFeMnNiTIZnCdCrPb
S12.91 h2.103 h6.915 f0.054 f0.333 e0.730 d2.40 f0.065 g2.003 e0.704 c0.338 f
S23.20 f3.976 b9.501 b0.079 b0.527 c1.143 b4.45 ab0.171 b3.861 a0.487 f0.489 b
S34.46 a4.265 a10.040 a0.088 a0.596 b1.166 b3.98 c0.144 e3.351 bc0.827 b0.530 a
S43.10 g2.347 g9.500 b0.054 f0.273 f0.712 d2.31 f0.070 g2.223 de1.400 a0.332 f
S52.75 i2.690 f5.565 g0.060 e0.529 c1.155 b3.21 e0.186 a3.630 ab0.103 h0.369 e
S63.26 d3.628 c7.301 e0.080 b0.772 a1.307 a4.37 b0.162 bc3.501 b0.177 g0.476 b
S73.45 b3.326 d8.095 d0.074 c0.520 c1.073 b3.52 d0.114 f3.109 c0.568 d0.454 c
S82.44 j2.652 f5.194 h0.060 e0.579 b1.183 b3.24 e0.150 de3.470 b0.103 h0.360 e
S93.42 c3.119 e8.764 c0.069 d0.409 d0.913 c3.17 e0.158 cd2.405 d0.831 b0.419 d
S103.23 e4.242 a9.922 a0.079 b0.520 c1.132 b4.51 a0.147 e3.545 ab0.537 e0.490 b
LSD (0.05)0.020.120.150.0020.010.110.10.0090.310.020.01
Column values with the different letters are statistically different according to the Duncan multiple range test (DMRT) at p < 0.05.
Table 4. The geo-accumulation (Igeo) index of heavy metals contaminations in different locations sites.
SitesAlCoCuFeMnNiTIZnCdCrPb
S10.10 h−0.49 h1.02 f−5.23 f−2.22 e−2.88 d−0.19 e−4.05 f0.21 e−1.59 c−0.57 f
S20.24 f0.43 b1.48 b−4.69 b−1.55 c−2.24 b0.69 a−2.66 ab1.16 a−2.12 f−0.03 b
S30.72 a0.53 a1.56 a−4.54 a−1.37 b−2.21 b0.53 b−2.91 d0.95 bc−1.36 b0.08 a
S40.19 g−0.33 g1.48 b−5.23 f−2.50 f−2.92 d−0.25 f−3.96 f0.36 de−0.60 a−0.59 f
S50.02 i−0.13 f0.71 g−5.10 e−1.55 c−2.22 b0.22 d−2.54 a1.07 ab−4.37 h−0.44 e
S60.27 d0.30 c1.10 e−4.68 b−1.00 a−2.04 a0.67 a−2.74 bc1.02 ab−3.59 g−0.07 b
S70.35 b0.17 d1.25 d−4.79 c−1.57 c−2.33 b0.36 c−3.25 e0.84 c−1.90 d−0.14 c
S8−0.15 j−0.15 f0.61 h−5.10 e−1.42 b−2.19 ab0.23 d−2.85 cd1.00 ab−4.37 h−0.47 e
S90.34 c0.08 e1.36 c−4.89 d−1.92 d−2.56 c0.20 d−2.77 bcd0.47 d−1.35 b−0.26 d
S100.25 e0.52 a1.54 a−4.70 b−1.57 c−2.25 b0.71 a−2.88 cd1.03 ab−1.99 e−0.03 b
LSD (0.05)0.0090.050.020.060.040.150.040.140.140.060.05
Column values with the different letters are statistically different according to the Duncan multiple range test (DMRT) at p < 0.05.
Table 5. The total average abundance IND/m3 of soil faunal diversity throughout different study areas.
SiteOrbatidaProstigmataMesostigmataCollembolaNematodeTotal No. of Sp.
S1129133513163
S24565171119
S3101157033
S4120003
S5810009
S6158056088
S75452220110
S803801039
S957211013120239
S104262014
Table 6. Similarity and distribution of all 5 soil faunal species within 10 sites of study by computed Bray–Curtis similarities between all sites.
Sites S1S2S3S4S5S6S7S8S9S10Similarity Degree Keys
S11 >0.75
S20.4609931 0.50.75
S30.2959180.3815791 0.250.5
S40.0361450.049180.1666671 <0.25
S50.1046510.1406250.4285710.3333331
S60.3266930.2801930.3801650.0659340.1855671
S70.5201470.8733620.349650.0530970.1512610.2525251
S80.1386140.4936710.3333330.0247930.0725810.1417320.523491
S90.4527360.4189940.2426470.0952380.0416670.2935780.4527220.1582731
S100.1242940.1353380.5531910.3529410.4347830.1568630.161290.1132080.1106721
Disclaimer/Publisher’s Note: The statements, opinions and data contained in all publications are solely those of the individual author(s) and contributor(s) and not of MDPI and/or the editor(s). MDPI and/or the editor(s) disclaim responsibility for any injury to people or property resulting from any ideas, methods, instructions or products referred to in the content.

