Abstract
Global CO2 concentrations continue to rise despite significant efforts to decarbonize and reduce greenhouse gas emissions. This paper examines the role of sustainable business in reducing and limiting global CO2 concentrations based on daily CO2 data from the Mauna Loa Observatory. Based on the theory of the carbon cycle, factors considered significant in determining global CO2 concentrations include emissions, affected by economic variables like the crude oil price and Dow Jones Sustainability Index but also absorption capacity, affected through biomass growth by astronomical variables such as total solar irradiance and cosmic rays. Considering pair-wise correlations between variables, particular attention is drawn to the fact that in the COVID-19 pandemic, when everyone was working from home, cars were not allowed on the roads, and planes were not flying, the correlation between the Dow Jones Sustainability Index and the global CO2 concentration was negative. The article tests the hypothesis that business can be a force for good and make a meaningful contribution towards reducing global CO2 concentrations. To this end, it offers an integrated model of global CO2 concentrations built according to the theory of the carbon cycle based on 2195 daily observations, including all the variables outlined above. The results confirm the hypothesis that business, expressed in the form of Dow Jones Sustainability Index, can play a role in reducing the global CO2 concentrations. A range of policy conclusions is drawn.
1. Introduction
The transformation of business models for sustainability, the role of impact investment as a transformational force and the role of business in driving sustainable progress have been embraced by a whole number of advocates including Cohen (2020) [1], Eccles, Ioannou, and Serafeim (2014) [2], Elkington (2021) [3], Carney (2021) [4], and Polman (2022) [5]. In this paper, we establish if sustainable business performance, as expressed in the Dow Jones Sustainability Index, impacts the global concentrations of CO2 and can be ultimately considered a force for good. For the purposes of this paper, we define a “force for good” as the ability of businesses to create measurable positive impacts on societal and environmental outcomes beyond merely generating profit. This encompasses actions that contribute to reducing global CO2 concentrations, fostering equitable economic development, and enhancing long-term sustainability [6,7,8,9,10,11,12]. To this end, we review recent contributions to the field of ESG investment, build a comprehensive econometric model of global CO2 concentrations, and try to explain the variance in CO2 emissions based on a whole range of variables. By doing so, we aim to determine whether sustainable business practices, as reflected in the Dow Jones Sustainability Index (DJSI), can substantively reduce CO2 levels and be considered a true “force for good”. The policy conclusions will follow.
2. Literature Review
Environmental, social, and governance (ESG) investment has become an important player in the global financial markets. According to Bloomberg Intelligence, the projected ESG assets under management of USD 53 trillion will represent approximately 36.9% of the total global assets under management by 2025, assuming a steady growth rate of 6.5%. The UN Principles for Responsible Investment define ESG as “the key factors used to measure the sustainability and societal impact of an investment in a company or business” [13]. ESG factors are increasingly important for investors, companies, and other stakeholders to assess risks, opportunities, and long-term performance. Many studies have examined various dimensions of ESG investing and reporting and have been predominantly focused on measuring the impact on financial performance. We conducted a rigorous and structured literature review of the major contributions to the ESG field, as shown in Table 1. In the table, the major studies are described in terms of the country of focus, methodology used, and the key findings. Below, we examine some of the contributions in more detail.
The findings indicate that ESG investing has, on average, performed similarly to conventional investing and sometimes even better [10,14,15,16,17,18,19,20,21,22,23,24,25,26,27,28,29,30,31,32]. More specifically, recent research demonstrates that there is a positive relationship between ESG and financial performance for 58% of the studies focused on operational metrics, such as ROE, ROA, or stock price, with 13% showing neutral impact, 21% showing mixed results, and only 8% showing a negative relationship (Whelan et al., 2021) [33]. According to some studies, ESG investing has been found to provide asymmetric benefits, particularly during social or economic crises, while in other studies, it has been demonstrated that companies with high engagement with ESG managed to perform better in periods of crisis thanks to high levels of resilience and lower volatility in the market [34]. Overall, ESG integration as a strategy has been shown to be more effective than screening or divestment (Krosinsky and Purdom, 2016) [35].
ESG is clearly a strategic priority for many businesses and interested stakeholders nowadays; indeed, it has been found that many studies were focused on analyzing the internal and external drivers of ESG engagement. According to Crace and Gehman (2023) [36], the most significant drivers came from within the firm and directly from the CEO. Furthermore, the authors indicate that negative ESG performance is usually correlated with external factors, whereas positive ESG performance has to deal with internal ones. These findings support a previous analysis of internal drivers made by Eccles et al. (2011) [37], who stated the significant influence of the board of directors and firm’s governance on the level of ESG engagement. In more sustainably-minded corporations, boards are more keen on overseeing environmental and social issues, while management compensation may include sustainability metrics alongside financial ones.

Table 1.
Literature review table.
Table 1.
Literature review table.
| Title | Authors | Year | Ref | Country | Methodology | Findings and Discussion |
|---|---|---|---|---|---|---|
| What Really Explains ESG Performance? Disentangling the Asymmetrical Drivers of the Triple Bottom Line | Crace, L., Gehman, J. | 2023 | [36] | Canada | The study employs the MSCI ESG KLD STATS dataset for its extensive coverage and historical evaluation. Variance partitioning analysis, using two samples from 2003 to 2010 and 1993 to 2010, examines categorical variables’ impact on ESG performance. Multilevel modeling with cross-classified structures and MCMC estimation in MLwiN software ensure robust analysis. | The article examines ESG performance in strategic management, debating whether it is influenced more by external factors or internal traits. It highlights challenges in quantifying social impacts and suggests negative ESG indicators are driven by external factors, while positive ones reflect internal strategies. The firm and CEO effects significantly shape ESG performance across dimensions. The article advocates for nuanced measures over aggregated indicators to capture true sustainability practices, contributing to a better understanding of ESG performance variation among firms. |
| The use of ESG scores in academic literature: a systematic literature review | Clement, A., Robinot, E., & Trespeuch, L. | 2023 | [38] | Canada | The study follows Xiao and Watson’s (2019) methodology for systematic qualitative systematic reviews. It collects and describes definitions of ESG scores in the academic literature using systematic meta-analysis. Initial data comprises 6685 articles, narrowed down to 342 after systematic procedures and analysis of definitions. Various classification themes emerge from the analysis. | The reviewed article offers a qualitative systematic examination of environmental, social, and governance (ESG) scores in the academic literature, focusing on their diverse definitions and applications. ESG scores serve as key financial tools for constructing green portfolios and evaluating companies’ responsible performances, with investments projected to exceed USD 53 trillion by 2025. ESG scores encompass environmental, social, and governance aspects, providing quantitative assessments through tangible and intangible data published by commercial firms. Initially tailored for financial companies, ESG scores have expanded to aid reputation enhancement and risk reduction. However, challenges persist in measuring sustainable practices, especially regarding community and environmental impacts. While significant for aligning with the UN sustainable development goals, ESG scores primarily focus on financial risk rather than comprehensive corporate social responsibility (CSR) performance. Academic research diverges across sustainability, CSR, disclosure, finance, and transdisciplinary analyses of ESG scores, revealing inconsistencies in definitions and utilization. The review underscores the necessity for the cautious use of ESG scores beyond financial risk assessment and calls for improved methodologies to evaluate environmental and social impacts. It advocates for standardization and increased representation of small and medium-sized businesses in ESG assessments while suggesting a roadmap for future research to refine ESG score definitions and applications. |
| How do ESG practices create value for businesses? Research review and prospects | Wang, N., Pan, H., & Du, S. | 2022 | [39] | China | Bibliometric method is used to analyze literature co-citation, burst detection, and keyword co-occurrence, and the literature review method is used to condense important ideas from the existing literature. | The text examines the rising importance of ESG (environmental, social, and governance) factors in business, reflecting changing investor and stakeholder priorities. ESG criteria now gauge a company’s sustainability and viability, influencing investment decisions and demanding transparency. Investors increasingly prefer firms with strong ESG performance, recognizing its significance for financial success. ESG practices extend beyond financial metrics, impacting societal resilience and market value while reducing risks. The text highlights theoretical frameworks explaining how ESG practices signal positive information, manage risks and offer strategic advantages. It stresses the critical link between ESG performance and disclosure for transparency and accountability despite challenges like greenwashing. External factors such as regulations and market dynamics, alongside internal factors like governance structures, shape ESG practices and corporate value. Embracing ESG as a strategic imperative is crucial for long-term value creation and stakeholder trust in businesses. |
| Effective ESG Transformation of Russian Companies in the New Environment: Current Challenges and Priorities | Babynina, L., Kartashov L., Busalov, D., ChernitsovK., & Akhmedov, F. | 2023 | [40] | Russia | The article employs a comprehensive methodology, blending theoretical insights with empirical data to develop ESG-rating methodologies for businesses. | The article examines ESG (environmental, social, and governance) awareness and transformation in Russian businesses, tracing its evolution from state-regulated to corporate norms. Despite economic shifts, ESG remains relevant as companies target Asian markets and restructure supply chains. Tasks include analyzing domestic and foreign studies on sustainable development, comparing Russian ESG rating methodologies, and assessing ESG factor significance. Benefits like risk reduction are acknowledged, but conflicting views exist on efficiency and reporting costs. Challenges include corporate understanding, skill shortages, and financial limitations, influenced by geopolitics and regulations. ESG disclosure is vital for confidence, but inconsistencies in rating agency practices persist. Proposed initiatives aim to promote collaboration and transparency, such as the National ESG Alliance and an ESG Infrastructure Atlas. The article calls for clearer regulations and increased stakeholder engagement to advance sustainable development in Russia. |
| Environmental, social and governance (ESG) performance in the context of multinational business research | Linnenluecke, M. K | 2021 | [41] | Australia | The paper outlines the emerging literature on global ESG ratings. It covers research on ESG–financial links in emerging markets, multinational ESG performance, and country-level ESG risks. | The article explores the complex landscape of monitoring firms’ ESG performance, crucial in socially responsible investment strategies. It notes investors’ shift toward aligning investments with societal values, necessitating robust ESG frameworks. Challenges arise when applying Western-centric ESG models to emerging markets due to weaker institutions and limited data. Research on ESG performance’s financial impact yields varied results, especially in emerging markets, indicating nuanced patterns across jurisdictions. The text identifies diverse metrics and challenges in studying the ESG–financial performance relationship, including incomplete disclosures and cultural factors. Concerns also arise about the accuracy of ESG ratings, biases, and failures to capture material issues in emerging markets. The article suggests exploring supply chain analysis and incorporating local community concerns into ESG ratings for comprehensive sustainability assessments. In conclusion, it calls for enhanced research to address unresolved issues in ESG assessment, especially in emerging markets and multinational operations. It advocates for improved methodologies and stakeholder integration, emphasizing the importance of indigenous community perspectives in corporate sustainability evaluation. |
| ESG and financial performance: aggregated evidence from more than 2000 empirical studies | Friede, G., Busch T., & Bassen, A. | 2015 | [42] | Germany | Two methods aggregate primary and secondary study results, each with distinct calculation approaches. Analysis includes distributions, correlation effect sizes, and subgroup analyses. | The article analyzes the evolving role of environmental, social, and governance (ESG) criteria in investment decisions, noting slow mainstream adoption despite significant assets managed under Principles for Responsible Investment (PRI) signatories. It highlights the limited integration of ESG information by investment professionals and minimal formal training in ESG analysis. Debates persist over the compatibility of ESG criteria with Corporate Financial Performance (CFP), with studies presenting ambiguous or contradictory results. A review of over 2000 empirical studies since the 1970s reveals a positive correlation between ESG criteria and CFP across various assets and regions, except for portfolio-related studies. Using a two-step method, the authors analyze findings from 60 review studies, concluding empirical support for the business case for ESG investing. Despite limitations, such as publication delays and diverse methodologies, ESG outperformance opportunities exist, particularly in non-equity assets and regions like North America and emerging markets. The article advocates deeper ESG integration into investment processes to align with broader societal goals, calling for further research into ESG criteria interaction and long-term performance impacts on portfolios. |
| ESG dimensions and bank performance: an empirical investigation in Italy | Menicucci, E. & Paolucci, G. | 2022 | [43] | Italy | This study examines a sample of 105 Italian banks and develops three econometric models to verify the effect of ESG initiatives on BP indicators. The independent variables are the ESG dimensions collected from the Refinitiv database, whereas the explanatory variables are performance indicators measured through accounting and market variables | The article examines ESG integration in Italy’s banking sector driven by client, investor, and regulatory pressures post the global financial crisis. It assesses the feasibility of enhanced corporate governance, reduced environmental impact, and social responsibility programs. Environmental commitments positively impact efficiency and trust, while social initiatives may challenge profitability. Corporate governance, especially board diversity and risk governance, correlates positively with performance. The empirical findings suggest varying impacts of ESG dimensions on bank performance, highlighting the complex relationship between ESG factors and profitability. The study contributes insights for practitioners and policymakers in sustainable finance and responsible banking. |
| The role of environmental social and governance in achieving sustainable development goals: evidence from ASEAN countries | Sadiqa, M., Ngob, T. Q., Pantameec, A. A., Khudoykulovd, K., Ngane, T. T., & Tan, L. P. | 2022 | [44] | ASEAN countries (Brunei, Cambodia, Laos, Indonesia, Malaysia, Myanmar, Philippines, Thailand, Singapore, and Vietnam) | The study employs Panel Autoregressive Distributed Lag (ARDL) modeling to analyze the relationships between ESG scores, economic growth (GDP), and sustainable development goals (SDGs) in ASEAN countries. Secondary data from SDG reports and World Development Indicators are used, with descriptive statistics, correlation analysis, and Augmented Dickey–Fuller tests applied for data assessment and model selection. | The article explores global challenges arising from industrial expansion and limited engagement in environmental and social initiatives despite increasing awareness. It discusses the 2030 Agenda for Sustainable Development, comprising 17 SDGs targeting environmental, social, and economic sustainability. ESG criteria are pivotal in evaluating firms’ commitment to these goals, emphasizing environmental protection, social welfare, and corporate governance. Collaborative efforts from businesses are crucial to achieving SDGs, with effective environmental policies and social governance practices facilitating progress. Corporate governance ensures accountability and transparency, enhancing financial and social performance. In ASEAN countries, progress varies across social, environmental, and economic indicators. While strides have been made in poverty reduction and gender equality, environmental challenges persist. The article stresses the need for enhanced environmental, social, and corporate governance to accelerate SDG attainment. The Section 5 further examines the intersection of ESG dimensions and SDG achievement. It highlights the positive impact of environmental practices on ecosystem preservation and social criteria on poverty alleviation. Corporate governance and economic growth also play vital roles in driving sustainable development initiatives. In conclusion, the study advocates for integrated approaches to address environmental, social, economic, and governance challenges, emphasizing the importance of ongoing research and evidence-based policy decisions to advance sustainable development agendas globally. |
| How ESG Issues Become Financially Material to Corporations and Their Investors | Freiberg, D., Rogers, J., & Serafeim, G. | 2020 | [45] | USA | Qualitative analysis. | The article explores the journey of ESG issues from being financially immaterial to becoming material, using the Purdue Pharma opioid crisis as a case study. It presents a framework comprising five stages: Status Quo, Catalyst Events, Stakeholder Reaction, Company Reaction, and Regulatory Reaction/Innovation. Catalyst events and stakeholder actions trigger a reassessment of ESG issue materiality, leading to regulatory changes and industry-wide responses. The text illustrates this framework through case studies, like JUUL and Facebook. Stakeholders engage with companies, potentially influencing regulators and public perception. The document also discusses a theory of change and action, emphasizing the role of impact-first investors and NGOs in driving corporate responsibility. It advocates for forward-looking frameworks to identify emerging material issues and flexible ESG disclosure regulations. Understanding materiality dynamics is vital for corporate management, investment decisions, and regulatory effectiveness. |
| The Value Relevance of Environmental, Social, and Governance Performance: The Brazilian Case | Miralles-Quirós, M. M., Miralles-Quirós, J. L., & Valente Gonçalves, L. M. | 2018 | [46] | Brazil | It employs a modified Ohlson’s asset valuation model, panel data methodology, and regression analysis. Four CSR measures are examined, including environmental, social, and corporate governance factors, alongside a composite ESG score. An interaction term accounts for the impact of environmentally sensitive industries. The methodology aims to understand how CSR influences stock prices, informing investors, managers, and policymakers about CSR’s strategic implications. | The study explores the value relevance of Corporate Social Responsibility (CSR) practices in Brazilian listed companies during 2010–2015. Despite sustainable development’s global priority, research on CSR in emerging economies like Brazil is limited. The research introduces a novel measure of CSR activities and uses ESG performance scores from Thomson Reuters Eikon to analyze shareholder value creation. The findings suggest that investors positively value firms with higher ESG performance, particularly in environmentally sensitive industries. While environmental practices are significantly valued, social and corporate governance practices, although positively valued, lack statistical significance. The study fills a crucial gap in the CSR literature by examining the long-term relationship between ESG performance and stock prices in the São Paulo securities markets. It highlights the importance of analyzing the Brazilian market due to its unique resources and proposes a methodology to overcome biases associated with self-reported information. The results support the value-enhancing theory and have implications for investors, managers, and policymakers. Investors can consider CSR practices in investment decisions, while managers can view CSR as a differentiation strategy contributing to shareholder value. The study underscores the strategic mandate for Brazilian listed firms to conduct business in alignment with ESG principles and calls for policymakers to develop supportive public policies for sustainable development in Brazil. Future research directions include expanding the analysis to other stock markets to deepen the understanding of shareholder commitment to CSR globally. |
| The Impact of ESG Ratings on Financial Performance of the Companies: Evidence from BRICS Countries | Strekalina, A., Zakirova, R., Shinkarenko, A., & Vatsaniuk, E. | 2023 | [47] | BRICs countries | The study investigates the ESG (environmental, social, and governance) scores’ impact on financial performance in BRICS countries. It employs ESG scores as the independent variable and financial performance metrics (ROA, TSR, and EVA) as dependent variables, considering control variables. The research spans 2017–2021, aiming to address gaps in understanding ESG-FP relations in emerging markets, particularly in BRICS nations. | The paper explores the complex relationship between ESG performance and financial outcomes, highlighting the evolving landscape where sustainability increasingly influences business practices. It emphasizes the multidimensional nature of ESG, driven by global concerns like climate change and social inequality, and the emergence of frameworks like the SDGs. While some studies suggest a positive correlation between ESG and financial performance, others indicate a neutral or negative relationship, underscoring the complexity of assessing sustainability’s financial implications. Geographical variations in ESG-FP dynamics are discussed, considering differences between developed and emerging economies. Methodological considerations in studying the ESG-FP nexus are explored, including metrics and research approaches. The conclusion emphasizes the need for nuanced approaches and further research to inform business practices and investment decisions. Recommendations for BRICS countries include strengthening regulatory frameworks, enhancing transparency in data disclosure, and addressing social aspects of sustainable development. Despite limitations such as data quality and methodology variations, the study contributes to understanding sustainability’s impact on financial performance, offering insights for investors, regulators, and company managers. Future research directions include broader sample coverage, longer time horizons, and comparative analyses of statistical methods and ESG databases, enriching the literature on sustainable development and financial performance, particularly in emerging markets like the BRICS countries. |
| The role of ESG performance during times of financial crisis: Evidence from COVID-19 in China | Broadstock, D. C., Chan, K., Cheng, L. T.W., & Wang, X. | 2020 | [34] | China | The study analyzes ESG performance’s systematic pricing during the COVID-19 pandemic using stock price data and firm characteristics from the WIND database. It consists of three main parts: assessing ESG investment strategies’ materiality, conducting an event study on ESG factors during COVID-19, and testing ESG factors’ importance during the crisis. The methodology integrates regression analyses, event studies, and portfolio backtesting to evaluate the relationship between ESG performance and stock market dynamics, particularly during times of crisis. | The text explores the surge in ESG (environmental, social, and governance) investing, surpassing USD 30 trillion globally by 2019, driven by ethical considerations and potential portfolio performance enhancements. While the early evidence on financial benefits was mixed, recent studies suggest investors increasingly consider sustainability factors, with high-ESG firms showing resilience during crises. Limited research on ESG’s role in crises led to an investigation of the COVID-19 pandemic’s impact on high-ESG stocks in China, where ESG investing is nascent. Governance dominates ESG concerns, and Syntao Green Finance provides ESG data. The empirical evidence from the study supports the systematic pricing of ESG during the pandemic, with high-ESG firms showing lower trading activity, higher returns, smaller stock declines, and lower volatility. Industry-neutral portfolios based on ESG scores performed better for high-ESG firms. The analysis indicates heightened investor importance of ESG during crises, suggesting the resilience of high-ESG firms. Overall, the study underscores ESG’s growing significance in investment decisions, particularly during crises, shedding light on its role in financial markets and emphasizing sustainability’s importance in portfolio management. |
| The wages of social responsibility—where are they? A critical review of ESG investing | Halbritter, G. & Dorfleitner, G. | 2015 | [48] | Germany | The methodology entails constructing ESG portfolios and employing cross-sectional regressions. ESG portfolios are formed based on ratings from three providers spanning 1991–2012, categorized into high and low portfolios. Performance is evaluated using the Carhart model, with adjustments for sectors and sub-periods. Cross-sectional regressions analyze ESG variables’ direct impact, controlling for factors like market capitalization. Robustness checks include pooled OLS regressions with SIC-clustered standard errors. | The paper delves into Socially Responsible Investments (SRIs) and the relevance of environmental, social, and governance (ESG) ratings in investment decisions. It explores the nuanced relationship between ESG ratings and financial performance, analyzing data from three providers. Contrary to previous findings, it suggests a nuanced relationship influenced by rating methodology and time period. The study highlights the importance of a cautious interpretation of ESG ratings for investors and researchers in socially responsible investing. |
| Environmental, social and governance (ESG) activity and firm performance: a review and consolidation | Huang, D. Z. X. | 2019 | [49] | Australia | The study employs a systematic approach to explore the link between environmental, social, and governance performance (ESGP) and Corporate Financial Performance (CFP). Researchers conduct a thorough literature search, screening 69 studies for eligibility based on specific criteria, including the use of ESGP and CFP metrics. They exclude studies with event analyses or probit models and focused only on those providing clear statistical information. After screening, 21 studies are chosen for analysis, ensuring a rigorous and comprehensive examination of the ESGP-CFP relationship. | The article provides a comprehensive review of the relationship between environmental, social, and governance performance (ESGP) and Corporate Financial Performance (CFP) through a meta-analytical approach spanning 1980 to 2019. It explores theoretical perspectives, historical contexts, and contemporary debates surrounding ESG issues in business. While studies confirm a positive relationship between ESGP and CFP, the strength and nature of this relationship vary across different measures and moderating factors. Operational CFP measures exhibit the strongest correlation with ESGP, followed by accounting and market-based measures. However, the economic significance of the relationship appears modest, capturing only about 2.0 percent of the explained variance in CFP. Environmental measures tend to show a stronger relationship with operational CFP compared to social or governance measures. Additionally, ESGP measures exhibit a higher correlation with accounting-based CFP compared to market-based CFP. Moderators and mediators, such as firm size, location, and stakeholder engagement, influence the relationship but remain inconclusive. The review underscores the complexity of the ESGP-CFP relationship and calls for further research to elucidate these intricacies and inform both theory and practice in the realm of ESG performance and financial outcomes. |
| Corporate ESG reporting quantity, quality and performance: Where to now for environmental policy and practice? | Arvidsson, S. & Dumay, J. | 2021 | [50] | Sweden, Australia, Denmark | The methodology analyzes ESG reporting trends among 27 Swedish companies listed on NasdaqOMXS30 from 2008 to 2018. Sustainability reports from 2008, 2013, 2015, and 2018 are examined for quantity, quality, and impact of ESG reporting. Data from corporateregister.com track report numbers, while content analysis assesses quality. Triangulation and longitudinal analysis ensure robustness, capturing changes and effects over time. | The excerpt highlights the growing importance of ESG (environmental, social, and governance) issues in corporate reporting and performance, driven by factors like climate change and regulatory changes. It discusses the changing marketplace tone, with investors demanding improved ESG performance and regulatory requirements compelling more ESG disclosures. Despite increased reporting, empirical research on the ESG reporting and performance relationship yields conflicting results, challenging companies to demonstrate tangible ESG progress. The analysis focuses on the Swedish context, noting historical leadership in sustainability reporting and the influence of regulatory changes and investor demands. The study investigates trends in ESG reporting quantity, quality, and corporate performance, leveraging data from sustainability reports and methodologies like the Analytical ESG Information Quality Framework. The findings indicate a surge in ESG reporting but plateauing performance trends after 2015, suggesting a need for sustained efforts to drive ESG improvements. The study underscores the importance of aligning ESG reporting with global standards and addressing sustainability challenges through proactive policies and enhanced reporting practices. It suggests avenues for future research, including exploring consumer and investor influences on corporate ESG behavior and considering alternative policy solutions. |
| ESG Integration in Investment Management: Myths and Realities | Kotsantonis, S., Pinne, C., & Serafeim, G. | 2016 | [51] | USA | Qualitative analysis. | The text discusses the evolution and significance of integrating environmental, social, and governance (ESG) considerations into business practices and investment decision-making. It notes the increasing interest among investors and companies in assessing the financial viability of sustainable approaches, supported by the emergence of ESG data. Recent studies suggest that companies with high ESG scores tend to outperform competitors, although the relationship varies across industries and does not imply causation. Challenges remain in integrating material ESG issues into investment management, but efforts by organizations like the Sustainability Accounting Standards Board (SASB) aim to address this. Sustainable practices, such as waste reduction and effective risk management, can enhance corporate value by attracting investors and improving brand reputation. While negative screening remains common, there is growing interest in ESG integration and corporate engagement. Despite challenges, progress in ESG reporting standards and data availability is notable, with regulators also promoting better ESG disclosure. Efforts to address misconceptions about ESG integration are underway, emphasizing its relevance to economic value. Overall, the text highlights advancements in ESG reporting, data availability, and regulatory frameworks, underscoring the importance of integrating ESG factors into investment decisions for long-term value creation. |
| On the value relevance of information on environmental, social, and governance (ESG): an evidence from Indonesia | Setyahuni, S. W. & Handayani, R. S. | 2020 | [52] | Indonesia | The study population includes 467 public-listed companies in Indonesia, forming 3.789 firm–year observations. Purposive sampling selects 70 companies with ESG disclosure out of 467. The sectors focused on are mining, agriculture, and manufacture due to environmental sensitivity, resulting in a final sample of 34 companies and 281 firm–year observations. | The text highlights the critical role of environmental, social, and governance (ESG) factors in financial reporting and investment decisions, with a focus on Indonesia’s regulatory environment. Investors now consider ESG metrics alongside financial indicators, recognizing their insights into sustainability, risk management, and societal impact. Indonesian regulations mandate ESG disclosures, aligning with global trends. Studies suggest a positive correlation between ESG disclosures and share prices, indicating investors’ perception of ESG’s relevance in financial performance. Transparent ESG reporting enhances trust and credibility, attracting capital and mitigating risks. ESG factors also gauge a company’s adaptability to market dynamics and societal needs, fostering innovation and resilience. Meaningful engagement with stakeholders through ESG disclosures aligns corporate strategies with societal goals. Globally, companies recognize the importance of integrating ESG principles to stay competitive and resilient. In conclusion, ESG factors are pivotal in financial markets, regulation, and corporate strategies. Embracing ESG principles enhances transparency and resilience, fostering sustainable growth and societal well-being in a changing world. |
| Four things no one will tell you about ESG data | Kotsantonis, S., Pinne, C., & Serafeim, G. | 2019 | [53] | USA | The study examines ESG metrics and corporate reporting by analyzing sustainability reports from 50 Fortune 500 companies. It identifies over 20 reporting methods for Employee Health and Safety, revealing significant inconsistencies. Four key limitations of ESG data are highlighted: data inconsistency, benchmarking challenges, ESG data imputation, and disagreement among providers. Visual aids illustrate these challenges. | The text explores the purpose, challenges, and implications of environmental, social, and governance (ESG) metrics in corporate performance evaluation. ESG metrics aim to quantify a company’s performance beyond financial indicators, providing stakeholders with holistic insights. Challenges include data accuracy, benchmarking complexities, peer group selection, data imputation, and the need for disclosure standardization. Transparent benchmarking and peer group selection are crucial, while data imputation methods impact ESG ratings. Standardization and collaboration among stock exchanges and data providers are vital for improving ESG reporting reliability and comparability. The text underscores the importance of addressing these complexities to enhance the understanding and application of ESG metrics in corporate decision-making. |
| Stock price reactions to ESG news: the role of ESG ratings and disagreement | Serafeim, G. & Yoon, A. | 2022 | [54] | USA | The study employs TruValue Labs Pulse data to track ESG-related news across companies sourced from various reputable sources. It also utilizes ESG ratings from MSCI, Sustainalytics, and Thomson Reuters Asset 4. Regression analysis tests hypotheses on the predictive power of ESG ratings on future news and market reactions. Factors like consensus ratings, disagreement among raters, and financial materiality of events are considered. The study explores whether different ESG ratings have varying predictive abilities and if future stock returns can be forecasted based on the most accurate ESG rating, especially in high disagreement scenarios. In conclusion, the study provides insights into the relationship between ESG ratings, market reactions, and investor decision-making processes, offering implications for investment strategies and understanding ESG rating quality. | This study examines how environmental, social, and governance (ESG) ratings predict future ESG-related news and stock returns. Despite challenges in assessing ESG rating quality due to disagreement among raters and the multidimensional nature of ESG issues, consensus ratings can forecast future news. Positive ESG news prompts a market response, although firms with high ESG ratings show smaller reactions, suggesting such news is already priced in. Firms with low rating disagreements experience stronger stock price reactions, indicating higher expectations for future news. ESG ratings from different providers vary in predictive ability, with the most predictive rating influencing future stock returns, particularly in cases of high disagreement. Overall, ESG ratings serve as proxies for market expectations and can forecast future news and stock returns despite rating disagreement. While acknowledging that predictive ability is just one aspect of rating quality, the findings highlight the importance of ratings in reflecting organizational commitments to ESG outcomes and suggest avenues for further research. |
| Where ESG fails? | Porter, M. E., Serafeim, G., & Kramer, M. | 2019 | [41] | USA | The article utilizes Michael Porter’s Five Forces model to assess industry dynamics and profitability, emphasizing the impact of social and environmental factors. It showcases case studies, like Enel and Generation Investment Management, to demonstrate how integrating social considerations into investment strategies can drive competitive advantage and superior returns. Critiquing traditional ESG analysis, it advocates for merging societal impact with a competitive strategy for long-term value creation. Additionally, it underscores investors’ social responsibility to allocate capital to companies that contribute to societal progress profitably. The methodology involves combining theoretical frameworks, empirical evidence, and practical insights to promote holistic investment analysis. By considering social and environmental factors alongside financial metrics, investors can make informed decisions that align with financial goals and societal well-being, fostering a more sustainable investment landscape. | The article challenges the dominance of environmental, social, and governance (ESG) metrics in driving shareholder returns, advocating for a shift toward shared-value investing. It critiques the limitations of traditional ESG rankings and Socially Responsible Investing (SRI) funds, highlighting the superior performance of companies creating tangible societal value, often overlooked by conventional metrics. The article questions the efficacy of the existing ESG framework and emphasizes the need for a more holistic approach that integrates social impact with economic performance. Central to the argument is the concept of shared-value investing, asserting that social impact can directly contribute to competitive advantage and shareholder returns. Through case studies of companies like Discovery, MasterCard, and Nike, the article illustrates how integrating social innovation into business models can lead to shared value and strategic differentiation. It calls for a fundamental shift in investor mindset, urging recognition and reward for companies that contribute meaningfully to social progress while delivering sustained economic value. Additionally, the article discusses the transformative impact of social and environmental factors on industry competition and shareholder returns, using Michael Porter’s Five Forces framework. It underscores the need for investors to consider social factors alongside financial metrics, promoting effective communication between companies and investors regarding the economic value of social impact. Ultimately, the article advocates for a return to fundamental investing with a social purpose, unlocking growth, fostering innovation, and contributing to a more equitable and prosperous future. |
| Which Corporate ESG News Does the Market React To? | Serafeim, G. & Yoon, A. | 2022 | [55] | USA | The article employs a comprehensive methodology to study market reactions to environmental, social, and governance (ESG) news. It utilizes data from TVL, which monitors ESG-related information across companies and classifies news as positive or negative based on its financial impact. The study also incorporates ESG performance data from MSCI ESG Ratings, assessing key issues relevant to investors. By categorizing news based on SASB standards and analyzing sentiment scores, the study captures market perceptions of ESG-related events. It examines market-adjusted and industry-adjusted returns around news events from January 2010 to June 2018, totaling 109,014 observations. In essence, the methodology combines data collection, classification, and analysis techniques to understand how markets respond to ESG news, considering its financial materiality and sentiment. | The article investigates how environmental, social, and governance (ESG) news shapes investor behavior and market dynamics, utilizing a rich dataset spanning from January 2010 to June 2018. It scrutinizes market reactions to diverse ESG news items and assesses the predictive power of ESG performance scores. The key findings reveal substantial market reactions to financially material ESG news, particularly positive news related to social capital issues like product impact. The study challenges traditional assumptions about investor responses to ESG news and underscores the evolving role of ESG considerations in investment strategies. Positive ESG news, especially regarding product quality and safety, drives significant market reactions, while negative news impacts market performance, particularly concerning customer welfare and GHG emissions. The research highlights the importance of unexpected news in influencing market dynamics and emphasizes the selective nature of market reactions to ESG news. In conclusion, the study sheds light on the intricate relationship between ESG news and investor behavior, offering valuable insights for sustainable investing. It calls for the further exploration of global variations in market reactions to ESG news and the relationship between firm disclosures and ESG news to inform informed investment strategies and policy decisions. |
| Market Interest in Nonfinancial Information | Eccles, R.G., Serafeim, G., and Krzus, M.P. | 2011 | [56] | USA | The methodology used in the article involves analyzing market interest in nonfinancial information by examining data from Bloomberg across various asset classes and firm types. The analysis involves comparing the preferences and priorities of different investor groups, including equity investors, fixed-income investors, broker-dealers, money managers, insurance companies, pension funds, and hedge funds. The researchers study the frequency and distribution of hits for different nonfinancial metrics to understand the relative importance placed on various environmental, social, and governance (ESG) factors by different types of investors. This methodology allows for a detailed exploration of market trends and investor preferences regarding nonfinancial information. | The article explores market interest in nonfinancial information across asset classes and firm types, highlighting the growing importance of environmental, social, and governance (ESG) factors in investment decisions. Equity investors prioritize environmental metrics, like carbon emissions, anticipating regulatory impacts, while fixed-income investors focus on metrics affecting cash flows, such as waste and energy consumption. Broker-dealers prioritize greenhouse gas emissions, while money managers adopt a broader approach, considering environmental and governance metrics. Asset owners, like insurance companies, prioritize transparency, while pension funds focus on governance to mitigate management risks. Hedge funds prioritize ESG disclosure and energy consumption metrics. Executives are advised to enhance transparency and tailor communication strategies to meet investor expectations. The article predicts increased market interest in nonfinancial data, driven by corporate disclosures and sophisticated valuation methodologies, presenting opportunities for companies to align with sustainable practices. |
| The Performance Frontier: Innovation for a sustainable strategy | Eccles, R. G. & Serafeim, G. | 2013 | [57] | USA | Qualitative analysis. | Investments in sustainability programs often require trade-offs in companies’ financial performance, but this does not have to be the case. By strategically focusing on the environmental, social, and governance issues that are the most relevant to shareholder value, firms can simultaneously boost both financial and ESG performance. Firms must do four things to achieve this: (1) identify which ESG issues are most critical in their particular business. Materiality maps, which the SASB is creating for 88 industries, can aid this process; (2) quantify the financial impact that improvements on those issues would have; (3) undertake major innovation in products, processes, and business models to achieve the improvements; and (4) communicate with stakeholders about those innovations. Integrated reporting, which combines financial and ESG performance information in one document, is an effective way to do this. To facilitate the process, companies must break down barriers to change, namely, incentive systems and investor pressure that emphasize short-term performance, a shortage of required expertise, and capital-budgeting limitations that fail to account for projects’ environmental and social value. |
| The impact of corporate sustainability on Organizational Processes and performance | Eccles, R., Ioannou, I., and Serafeim, G. | 2014 | [2] | USA | Identification: High-sustainability and low-sustainability firms are identified based on their environmental and social policies since the mid-1990s. Data Collection and Analysis: Data on governance, stakeholder engagement, measurement systems, and performance implications are collected and analyzed. Statistical methods are used to compare the performance of high-sustainability firms with low-sustainability firms over 18 years. Sector Analysis: The study analyzes how the performance of high-sustainability firms varies across different sectors. Addressing Alternative Explanations: Potential alternative explanations for performance differences are considered and addressed through robustness checks. | The discussion explores the evolving perspective on corporations, moving beyond traditional profit-maximization models to consider long-term goals, stakeholder interests, and sustainability practices. Over the past two decades, companies increasingly integrate social and environmental concerns into their operations, raising questions about governance, performance implications, and stakeholder engagement. The study compares 90 “High Sustainability” firms with extensive sustainability policies to similar “Low Sustainability” firms. High-sustainability companies exhibit robust governance, stakeholder engagement, and disclosure practices. Statistical analyses reveal that high-sustainability firms consistently outperform low-sustainability firms in both stock market and accounting performance over 18 years, attracting long-term investors and communicating a strategic, long-term approach effectively. The findings suggest that integrating sustainability practices can yield long-term financial benefits and enhance stakeholder relationships. Short-termism in decision-making may hinder value creation and stakeholder engagement. High-sustainability firms, committed to stakeholder engagement, tend to adopt longer-term perspectives, attracting investors aligned with such values. Measurement and disclosure play crucial roles in assessing corporate performance. High-sustainability firms emphasize transparency, integrate environmental and social information, and balance financial and nonfinancial disclosures. High-sustainability firms tend to outperform low-sustainability firms over the long term, attributed to factors such as attracting better human capital, establishing reliable supply chains, and engaging in sustainability-aligned innovations. The study underscores the importance of understanding the conditions and mechanisms influencing sustainability integration, with implications for corporate decision-making and stakeholder relationships. Areas for future research include exploring variations across countries and assessing the optimal degree of sustainability policy adoption. |
| The Impact of a Corporate Culture of Sustainability on Corporate Behavior and Performance | Eccles, R. Ioannou, I., and Serafeim, G | 2011 | [37] | USA | Firstly, the researchers gather data from a sample of 180 companies, dividing them into two groups: high-sustainability firms and low-sustainability firms, based on their sustainability initiatives and policies. Secondly, they utilize propensity score matching techniques to pair high-sustainability firms with comparable low-sustainability firms. This matching process aims to balance out potential confounding variables and ensure a fair comparison between the two groups. Next, extensive statistical analyses are conducted to scrutinize various aspects of corporate behavior, governance structures, stakeholder engagement practices, and performance metrics across the 18-year study period spanning from 1993 to 2010. The empirical examination delves into both stock market and accounting performance metrics to assess the financial implications of integrating sustainability into corporate strategies. Furthermore, multivariate analysis techniques are employed to explore the underlying factors driving the superior performance of high-sustainability firms. This analysis considers factors such as industry sectors and the extent of stakeholder engagement practices. | The article explores the rise of sustainability-focused policies in corporations and their impact on governance, stakeholder engagement, and performance. The key findings include the following. 1. Governance and Stakeholder Engagement: high-sustainability firms have distinct governance structures, with boards overseeing environmental and social objectives; they prioritize stakeholder engagement, fostering transparency and accountability throughout various phases. 2. Measurement and Disclosure Practices: high-sustainability firms emphasize nonfinancial performance measures and exhibit greater transparency in external reporting; they integrate environmental and social information into financial reporting and issue global sustainability reports. 3. Performance Implications: empirical analysis from 1993 to 2010 shows that high-sustainability firms significantly outperform low-sustainability firms in both stock market and accounting performance; sustainable firms exhibit higher annual abnormal performance and lower volatility in performance metrics. Overall, the study suggests that sustainability integration may confer a competitive advantage, leading to higher profits and stock returns over the long term. However, further research is needed to understand causality and optimal sustainability levels across different contexts. |
| The Consequences of Mandatory Corporate Sustainability Reporting | Serafeim, G. & Yoon, A. | 2011 | [58] | USA | The methodology applied in the study includes a differences-in-differences approach, propensity score matching, and instrumental variable specifications. These methods are used to assess the impact of sustainability disclosure regulations on firms’ reporting practices and valuations. | The introduction underscores the global trend of companies adopting governance processes to measure, analyze, and communicate sustainability efforts. It notes a significant increase in the number of S&P 500 companies with sustainability committees and those releasing sustainability reports, indicating a growing emphasis on environmental, social, and governance (ESG) performance. The article explores the implications of mandatory sustainability disclosure regulations on firms’ disclosure strategies and subsequent valuations. It examines how such regulations may influence companies positively by enhancing transparency and motivating improvements in socio-environmental performance while also potentially leading to costly efforts to differentiate themselves and erode shareholder value. To address these questions, the study analyzes data from four countries—China, Denmark, Malaysia, and South Africa—before and after the enforcement of disclosure regulations. Using the differences-in-differences methodology, it assesses the regulation’s impact on treated firms compared to control groups. The results indicate that treated firms significantly increase ESG disclosure following the regulation, accompanied by improvements in the credibility and comparability of disclosures. Instrumental variable models suggest a positive correlation between ESG disclosure and firms’ valuations, challenging the notion that disclosure regulations destroy shareholder value. The historical background provides insights into the evolution of sustainability reporting, emphasizing the shift from voluntary to mandatory disclosure driven by societal pressures, investor demands, and regulatory changes. It outlines the regulatory frameworks adopted by the four focus countries, highlighting diverse approaches to sustainability reporting and disclosure requirements. In conclusion, the study reveals that sustainability disclosure regulations have led to substantial changes in firms’ disclosure practices, with a positive economic impact on firm value. The findings underscore the importance of the qualitative attributes of information and offer valuable insights for policymakers, investors, and corporate stakeholders. Despite certain limitations, the research suggests avenues for further exploration, emphasizing the profound impact of sustainability disclosure regulations on corporate behavior and firm value. |
| Sustainable entrepreneurship and B corps | Stubbs, W. | 2017 | [59] | Australia | Qualitative analysis. | The paper aims to contribute to the understanding of business models for sustainable entrepreneurship by exploring the practices of B Corps in Australia. The findings reveal insights into how B Corps combines market and social logic to pursue social, environmental, and economic outcomes. Unlike traditional market logic, where profitability is the primary focus, B Corps incorporates practices from the social logic to achieve “profit with a purpose”, prioritizing positive social and environmental impacts alongside financial gains. The study identifies that B Corps strives for an aligned organizational form, integrating goals, values, and practices associated with both market and social logic. While conflicts and tensions between market and social logic were minimal in the examined cases, further research is needed to understand the extent of integration across various aspects of hybrid organizing, such as inter-organizational relationships, organizational culture, and workforce composition. Combining market and social logic in B Corps can lead to innovation, generating novel organizational forms aimed at creating public benefit. However, mainstream adoption of the B Corp model is hindered by limited interest from large publicly-listed companies. The study suggests that while early adopters align well with B Corp values, companies primarily focused on financial returns may experience conflicts between market and social logic. The research raises questions for future investigation, including understanding the dynamics of combining market and social logic in sustainable entrepreneurship, exploring the founders of B Lab and the creation of the B Corp model, and examining the visibility and legitimacy of B Corps within mainstream business and the general public. Overall, further research is needed to evaluate the potential for B Corps to become a mainstream form of business and expand its influence globally. |
| The triple bottom line: does it all add up? Chapter 1: Enter the Triple Bottom line. | Elkington, J. | 2004 | [60] | UK | Qualitative analysis. | It introduces a framework for evaluating business performance that incorporates three dimensions: economic, social, and environmental. Elkington argues that traditional measures of business success, which focus solely on financial performance, are insufficient for assessing the overall impact of businesses on society and the environment. The TBL framework encourages businesses to consider not only their economic profitability but also their social and environmental impacts. By doing so, businesses can better understand their overall contributions to society and the planet. |
| Impact: Reshaping Capitalism to Drive Real Change | Cohen, R. | 2020 | [1] | UK | Qualitative analysis. | It is a comprehensive exploration of impact investing and its potential to revolutionize capitalism. Cohen examines the evolution of impact investing, tracing its roots from traditional philanthropy to a more dynamic approach that integrates financial returns with social and environmental impact. He emphasizes the importance of measuring impact rigorously and advocates for the mobilization of capital on a global scale to address pressing societal challenges such as poverty, inequality, and climate change. Throughout the book, Cohen highlights real-world examples and offers practical guidance for investors, entrepreneurs, and policymakers interested in leveraging capital for positive change. “Impact” serves as a roadmap for reshaping capitalism to create a more sustainable and equitable world. |
Eccles and Serafim (2013) [57] provide a step-by-step approach that helps in defining materiality in the ESG context. To achieve this aim, companies need to take four steps: establish which ESG issues are most important for their specific economic sector; estimate the potential financial savings stemming from resolving these issues; achieve the improvements and implement significant innovations in products, procedures, and, ultimately, business models; and finally share the innovations with stakeholders. Naturally, integrated reporting, which combines financial and ESG performance data into a single document, is a powerful tool to assist this process [25]. Freiberg et al. (2020) [16] investigated how ESG issues become material in financial fields in the context of the Purdue Pharma business case. The authors designed a framework that follows five steps on a journey that starts with the identification of a particular externality (related to an ESG issue) and reaches the disclosure of a specific regulation that tries to manage that specific ESG issue. Thus, the concept of materiality, as well as the level of impact, have a high relevance in this context.
Porter et al. (2019) [61] indicated that investors must consider social factors alongside financial metrics, recognizing their influence on long-term competitive advantage (shared-value investing), but in the article, they also criticize the efficiency of traditional ESG rankings and particularly its link with alpha generations or those born in the 21st century. The importance of effective communication between companies and investors regarding the economic value of social impact has increased noticeably; examples of the success of this type of investment are Generation Investment Management and Summa Equity.
Several authors acknowledge that investors should allocate capital toward companies driving social progress profitability, where capitalism is harnessed to address society’s most pressing needs while generating sustainable shareholder returns. The new movement called the B-Corp movement is built entirely around the idea that business could be a force for good. By embracing shared-value thinking, investors can unlock growth, foster innovation, and contribute to a more equitable and prosperous future for all stakeholders. ESG scores have gained prominence as primary financial tools for constructing green portfolios and evaluating companies’ performances in the field of responsible investment, as well as for enhancing transparency, trust, and credibility among stakeholders [38,41]. ESG scores mitigate risks associated with environmental or social scandals by anticipating potential negative impacts on investments. Companies that prioritize ESG considerations stand to gain not only enhanced market value but also improved financial performance and reduced risk exposure, which are, indeed, integral components of corporate strategy and value creation [38,39]. Friede et al. [42] also discussed the evolving landscape of environmental, social, and governance criteria within investment decisions and highlighted the slow adoption of sustainable investment practices among mainstream investors despite the significant assets managed under Principles for Responsible Investment signatories. Liennenluecke (2021) [41] argues that even if there is a shift toward sustainable investments, there are many challenges in the market due to weaker institutions, less stringent regulatory environments, and limited transparency.
Although there has been a higher interest in nonfinancial information since the late 1990s [25,62] (with the observed growth from 20 reporting organizations in 1999 to over 12,000 companies today), it has been noticed that the correlation between financial returns and such practices is not equivalent among environmental, governance, and social issues. Indeed, Huang (2019) [49] argues that environmental ESG measures tend to exhibit a stronger relationship with operational financial performance measures compared to social or governance ESG measures. Eccles et al. (2011) [56] instead state that environmental and governance metrics are the ones which investors are more interested in. Equity investors show more interest in ESG disclosure and GHG emissions data compared to fixed-income investors. This study also highlights disparities between broker–dealers and money managers with the same distinction as the previous ones. Serafim and Yoon (2022) [55] studied market reactions to diverse ESG news items and assessed the predictive power of ESG performance scores. The key findings reveal substantial market reactions to financially material ESG news, particularly positive news related to social capital issues like product impact. The study challenges traditional assumptions about investor responses to ESG news and underscores the evolving role of ESG considerations in investment strategies. Positive ESG news, especially regarding product quality and safety, drives significant market reactions, while negative news impacts market performance, particularly concerning customer welfare and GHG emissions. The research highlights the importance of unexpected news in influencing market dynamics and emphasizes the selective nature of market reactions to ESG news.
Menicucci and Paolucci (2022) [43] pointed out the effects of ESG in the banking sector. They assessed the feasibility of enhanced corporate governance, reduced environmental impact, and social responsibility programs. Environmental commitments positively impact efficiency and trust, while social initiatives may challenge profitability. Corporate governance, especially board diversity and risk governance, correlates positively with performance [63]. The empirical findings suggest varying impacts of ESG dimensions on bank performance, highlighting the complex relationship between ESG factors and profitability.
One of the consequences of the increase in engagement with ESG activities has been the development of ESG reporting and integration [63]. Organizations like Global Reporting Initiatives (GRIs), the Sustainability Accounting Standard Board (SASB), the International Integrated Reporting Committee (IIRC), and the Carbon Disclosure Project (CDP) are playing a crucial role in promoting disclosure and accountability [53,56]. Efforts by organizations like the Global Sustainable Investment Alliance and sustainable stock exchanges aim to improve ESG data availability and quality. There is still skepticism about the data’s accuracy, specifically in relation to data imputation methods that should be transparent to ensure the consistency and reliability of the data [53]. Linked to this trend, although there has been an increase in the number of sustainability reports published to enhance transparency, there is still the need for improvements in ESG reporting. Arvidsson et al. (2021) [50] underscore the importance of aligning ESG reporting with global standards and addressing sustainability challenges through proactive policies and enhanced reporting practices.
Eccles et al. (2014) [2] studied the difference in performance between 90 high-sustainability firms of the mid-1990s with similar low-sustainability firms. The main conclusions of their research are that high-sustainability firms exhibit a stronger governance structure, link executive compensation to sustainability metrics, engage stakeholders more proactively, and disclose more nonfinancial data. This suggests that integrating social and environmental issues into business strategies may yield long-term financial benefits and improve stakeholder relationships. Regarding corporate performance, high-sustainability firms tend to outperform low-sustainability firms over the long term. Overall, the results show that high-sustainability firms exhibit superior performance, with ESG activities as a source of competitive advantage, which helps companies in the SRI in the long term [37]. However, Eccles et al. argue that high-sustainability firms may underperform due to constraints imposed by their sustainability culture, or they may outperform due to better human capital, supply chains, community relations, and innovation. However, in the study proposed, high-sustainability firms significantly outperform low-sustainability firms, with annual abnormal performances higher by 4.8% on a value-weighted basis and 2.3% on an equal-weighted basis and exhibiting lower volatility in their performance.
Serafim and Yoon (2011) [58] examined the effects of sustainability disclosure regulations on corporate practices and valuations, and they highlighted that while the disclosure of ESG information could enhance firm value through improved management practices and stakeholder perceptions, it also imposes potential costs and risks on firms. In fact, they individualized positive aspects: improvement in management practices, operational efficiency, enhanced stakeholder trust, the attraction of socially responsible investors, and improved access to capital. The negative effects are that compliance costs could strain financial resources, and mandatory disclosure may reveal proprietary or competitively sensitive information, potentially causing strategic risks or disadvantages negatively affecting firm value. In another study, Serafim and Yoon (2022) [55] investigated whether consensus ESG ratings predict future ESG-related news and how disagreement among raters affects this predictive ability. Despite challenges in assessing ESG rating quality due to disagreement among raters and the multidimensional nature of ESG issues, consensus ratings can forecast future news. Positive ESG news prompts a market response, although firms with high ESG ratings show smaller reactions, suggesting such news is already priced in. Firms with low rating disagreements experience stronger stock price reactions, indicating higher expectations for future news. ESG ratings from different providers vary in predictive ability, with the most predictive rating influencing future stock returns, particularly in cases of high disagreements. Overall, ESG ratings serve as proxies for market expectations and can forecast future news and stock returns despite rating disagreements. While acknowledging that predictive ability is just one aspect of rating quality, the findings highlight the importance of ratings in reflecting organizational commitments to ESG outcomes. Furthermore, Broadsrock et al. (2020) [34] found that firms with higher ESG ratings experience smaller stock price declines and lower volatility during periods of crisis, with a specific study about stock prices during the pandemic period (COVID-19).
In contrast with the previous findings, Halbritter and Dorfleitner (2015) [48] state that ESG portfolios do not exhibit significant return differences between companies with high and low ESG ratings. The study finds that the influence of ESG variables on returns is inconsistent across different ESG rating providers, indicating that the relationship is highly dependent on the specific rating methodology. Over time, there appears to be a diminishing impact of ESG variables on returns, therefore suggesting a potential weakening of the relationship between CSP and CFP.
The article provided by Babynina et al. (2023) [40] identifies significant ESG issues within the Russian business landscape, highlighting that the main challenges include a lack of understanding at the corporate level regarding the real impact of sustainable development projects, insufficient skills among employees, and limited financial resources, as well as external factors like geopolitical dynamics and regulatory frameworks. That is why the solution proposed is the creation of the National ESG Alliance and the development of an ESG Infrastructure Atlas.
A study by Sadiqa et al. (2022) [24] explores global challenges arising from industrial expansion and limited engagement in environmental and social initiatives despite increasing awareness. It discusses the 2030 Agenda for Sustainable Development, comprising 17 SDGs targeting environmental, social, and economic sustainability. ESG criteria are pivotal in evaluating firms’ commitment to these goals, emphasizing environmental protection, social welfare, and corporate governance. Collaborative efforts from businesses are crucial to achieving the SDGs, with effective environmental policies and social governance practices facilitating progress. Corporate governance ensures accountability and transparency, enhancing financial and social performance. In ASEAN countries, progress varies across social, environmental, and economic indicators. While strides have been made in poverty reduction and gender equality, environmental challenges persist. The article stresses the need for enhanced environmental, social, and corporate governance to accelerate SDG attainment [24].
The Brazilian case studied by Miralles-Quirós et al. (2018) [46] states that investors positively value CSR practices in Brazilian listed firms according to the value-enhancing theory. However, while the market significantly values environmental practices, it does not equally value all three pillars of ESG. Specifically, social and corporate practices in environmentally sensitive industries generate significant added value in stock prices.
The analysis conducted by Strekalina et al. (2023) [47] delves into the intricate dynamics between ESG performance and financial outcomes, reflecting the evolving landscape where businesses increasingly integrate sustainability into their operations, pointing out that there is not a universally accepted positive/negative impact of ESGP on FP. Furthermore, the paper points out geographical variations in the ESG-FP relationship, noting differences between developed and emerging economies. While advanced economies may have stronger regulatory frameworks and shareholder activism, emerging markets face unique challenges related to institutional capacity and information dissemination. It is, therefore, important to study geographical influences on the ESG financial performance relationships, particularly within emerging markets like the BRICS countries, where each country adapts the sustainable development agenda differently. The studies reviewed here are summarized in Table 1.
3. Analysis
In this paper, we attempt to connect the global CO2 concentrations with a range of variables, including corporate sustainability performance, to understand if businesses could really be a force for good. CO2 concentrations are defined as the amount of carbon dioxide present in a given volume of air, typically expressed in parts per million (ppm), representing the ratio of CO2 molecules to every one million air molecules, providing a standardized metric for scientific, environmental, and industrial applications. We obtained the data on atmospheric CO2 concentrations from the National Oceanic and Atmospheric Administration (NOAA) Global Monitoring Laboratory, specifically from their Mauna Loa Observatory dataset, which provides long-term measurements of monthly mean CO2 levels [64].
The key hypothesis of our study H0 can be formulated as follows: sustainable business can be considered a force for good in relation to one of the key challenges of our time, climate change, expressed through the global CO2 concentrations in the atmosphere. The additional hypothesis H1 to be tested will address the feasibility of building an econometric model of global CO2 concentrations using daily data, “explaining” these concentrations through a range of astronomical variables (total solar irradiance and cosmic rays), economic variables (oil prices and the Dow Jones Sustainability Index) and a possible autoregressive component.
3.1. Dow Jones Sustainability Index
The Dow Jones Sustainability Index (DJSI) is a global benchmark that tracks the performance of the top 10% of companies (325 companies in 2023) from various sectors based on their sustainability practices, evaluated using criteria such as economic, environmental, and social performance, corporate governance, and transparency.
The index is structured as follows: The Capital Goods sector represents 11.16% of the total, followed by Banks with 9.71%, Materials and Financial Services each at 8.63% and 6.12%, respectively. Pharmaceuticals, Biotechnology, and Life Sciences also make up 6.12%, while Equity Real Estate Investment Trusts (REITs) and Energy contribute 4.68% each. The Food, Beverage and Tobacco, Health Care Equipment and Services, Insurance, Semiconductors and Semiconductor Equipment, Technology Hardware and Equipment, Transportation, and Utilities sectors each represent 4.32%. Software and Services accounts for 5.76%, while Commercial and Professional Services, Consumer Discretionary Distribution and Retail, Consumer Staples Distribution and Retail, and Semiconductors and Semiconductor Equipment are each represented at 3.24%. Media and Entertainment has 3.96%, and Consumer Durables and Apparel stands at 2.88%, the same as Consumer Services and Consumer Staples Distribution and Retail. The Automobiles and Components sector accounts for 2.16%, and Household and Personal Products is the smallest at 1.08%. The index represents companies headquartered in the following countries: USA (54), Japan (37), Taiwan (30), Republic of Korea (22), France (21), UK (16), Italy (15), Spain (15), Thailand (15), Germany (13), Australia (10), Brazil (8), Netherlands (8), Switzerland (8), Canada (4), Sweden (5), Colombia (4), and Finland (4).
The index was pioneered in 1999 and has become the benchmark for assessing the sustainability of companies worldwide. Figure 1 presents the dynamics of the daily Dow Jones Sustainability Index between 2012 and 2021. We see an overall positive trend, with downward spikes in the middle of the COVID-19 pandemic.

Figure 1.
Daily Dow Jones Sustainability Index, 2012–2021.
3.2. Brent Crude Oil Price
The dynamics of Brent crude oil prices are influenced by a range of factors, including the decisions made by the OPEC (Organization of the Petroleum Exporting Countries) regarding production quotas and geopolitical events such as wars or crises, like the Middle East Crisis of the 1970s and the Iranian Revolution, which can disrupt supply and lead to price volatility, as well as shifts in global demand and economic conditions that further impact the price of oil. One can hypothesize that the DJSI is positively correlated with the oil price, providing a safe haven for investors who experience oil price shocks.
Further analysis reveals that the Dow Jones Sustainability Index is inversely correlated with the Brent crude oil price (Figure 2) when the years 2012, 2013, and 2014 are taken into consideration and positively correlated when the years 2012, 2013, and 2014 are excluded (Figure 3). The regression model that describes the relationship between crude oil price and the Dow Jones Sustainability Index with the years 2012, 2013, and 2014 taken into account (Figure 3) is statistically significant, and the coefficient is negative. If the time horizon changes, however, the relationship becomes strongly positive, as one would expect. In this way, companies are investing in sustainability to avoid the shocks of the high oil price. This is particularly relevant for the period 2014–2022, as Figure 4 outlines.
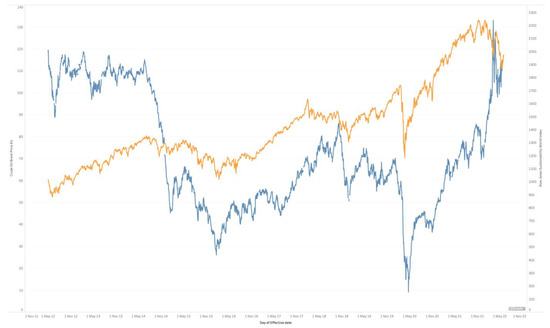
Figure 2.
Daily Down Jones Sustainability Index and oil price, 2012–2022 (blue line corresponding to the left hand axis: oil price; orange line corresponding the right-hand axis—DJSI).

Figure 3.
Brent crude oil price and Dow Jones Sustainability Index.
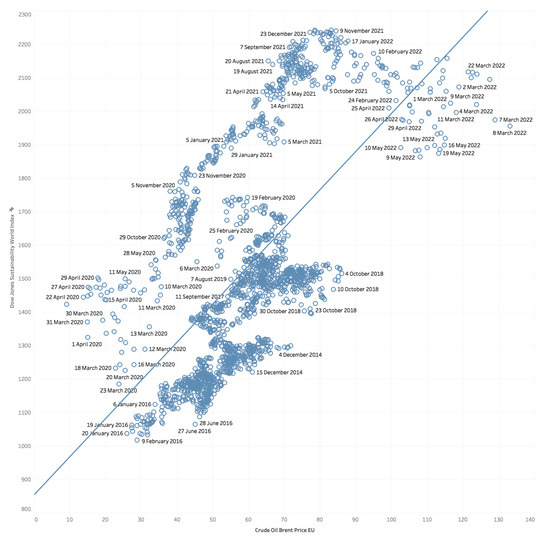
Figure 4.
Crude oil Brent price and the Dow Jones Sustainability Index (2014–2022).
So, what is actually going on here? What makes the years 2012, 2013, and 2014 so different (Figure 5)? In mid-2014, the hedge fund positions in Brent and WTI futures dropped rapidly, approximately around the month of July. At the same time, in the USA, 2013 and 2014 resulted in the fastest growth in the production of oil in history. The US output increased from 5 mln bpd in 2008 to approximately 8.5 mln bpd in 2014, with output increasing by 160,000 bpd in 2011, 850,000 bpd in 2012, 950,000 bpd in 2013, and 1.2 mln bpd in 2014. On 27 November 2014, the OPEC announced that it would keep its current production at 30mln bpd. The oil price by that time had already fallen to USD 77 per barrel and dropped even further to USD 59.
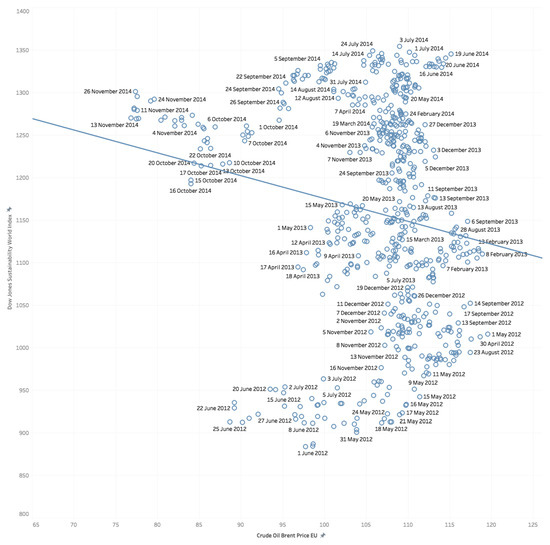
Figure 5.
Dow Jones Sustainability Index and the crude oil price (2012, 2013, and 2014).
3.3. Global CO2 Concentrations
In its Synthesis Report, the IPCC states that “atmospheric CO2 concentrations reached 410 parts per million (ppm) in 2019, higher than at any time in at least 2 million years”. The global concentrations of CO2 in the atmosphere continue to increase (Figure 6). This is a powerful illustration that the problem of climate change is far from being solved.
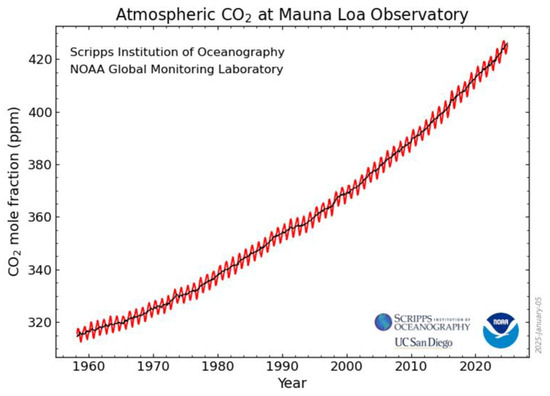
Figure 6.
Global CO2 concentrations, 1960–2025. Source: NOAA.
Global concentrations of CO2 are primarily driven by human activities that release large amounts of carbon dioxide into the atmosphere. The major sources include the burning of fossil fuels for transportation (air, land, and sea), energy production, heating, industrial processes, and the agriculture sector, which contributes significantly through practices such as deforestation, livestock production, and the use of synthetic fertilizers. Additionally, resource-intensive sectors, like manufacturing and construction, further exacerbate CO2 emissions through energy consumption and material extraction. These activities contribute to the accumulation of greenhouse gases, which trap heat in the atmosphere and drive climate change. Potential remedies to reduce CO2 emissions include transitioning to cleaner energy sources, such as nuclear and renewable technologies (wind, solar, and hydro), adopting sustainable agricultural practices, embracing sustainability in production and consumption, and transforming business models to prioritize environmental responsibility. These measures aim to reduce dependence on fossil fuels, promote energy efficiency, and foster a more sustainable, low-carbon global economy.
When we explore the connections between the Dow Jones Sustainability Index and the global CO2 concentrations depicted in Figure 7, we clearly see that increases in the Dow Jones Sustainability Index have been associated with increases in global CO2 concentrations (Figure 7).

Figure 7.
DJSI and CO2 concentrations.
On the other hand, the correlation we see between the oil price and global CO2 concentrations is indeed very curious (Figure 8). What we see is a clear negative relationship where rising oil prices imply a lower CO2 concentration in the atmosphere, which emphasizes the potential value of carbon and energy taxes, which we explored in [65]. This is particularly striking because the data were collected on a daily basis.

Figure 8.
Oil price and CO2 concentrations at Mauna Loa Observatory.
During the pandemic, however, when nobody was allowed to use their private cars and the global travel industry collapsed, the situation changed. During the months of the pandemic, the increases in the Dow Jones Sustainability Index were negatively correlated with the global CO2 emissions, confirming the role of sustainable business as a force for good; however, this was only during the pandemic when we did not consume petrol or fly across the oceans.
3.4. Total Solar Irradiance
Total solar irradiance (TSI) refers to the amount of solar energy that reaches the Earth’s atmosphere per unit area, typically measured in watts per square meter (W/m²). It represents the total energy output of the sun, including all wavelengths of electromagnetic radiation. TSI is not constant; it varies slightly over time due to solar cycles, with small fluctuations that can influence the Earth’s climate.
TSI is crucial for plant growth because it provides the energy necessary for photosynthesis, the process by which plants convert light energy into chemical energy to fuel their growth and development. Photosynthesis relies on light absorption by chlorophyll in plant cells, and TSI directly affects the intensity of this light. Higher solar irradiance typically leads to more efficient photosynthesis, promoting stronger plant growth. On a larger scale, variations in TSI can influence agricultural productivity, ecosystems, and the global carbon cycle, as plants play a vital role in carbon sequestration.
Figure 9 clearly illustrates a negative relationship between the total solar irradiance and the CO2 concentrations in the atmosphere, which points toward the role of photosynthesizing biomass as a decarbonization force.
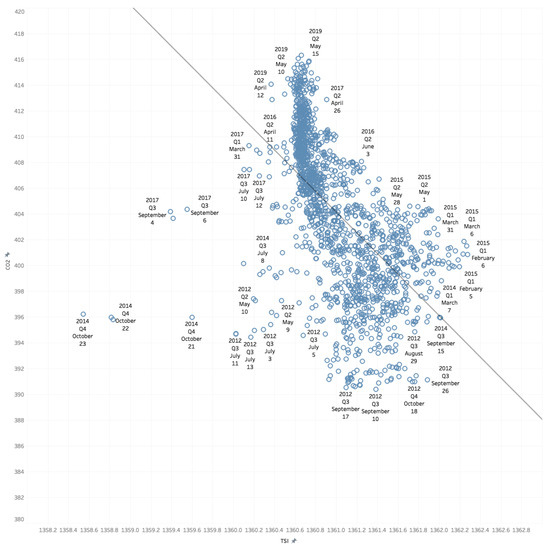
Figure 9.
TSI (total solar irradiance) and CO2 concentrations from 2012 to 2020.
3.5. Cosmic Rays
Cosmic rays are high-energy particles from outer space that reach Earth’s surface and influence atmospheric and biological processes. According to Svensmark (2000) [66], cosmic rays can help form cloud condensation nuclei, which influence cloud formation and precipitation patterns. This indirect effect on weather, particularly rain, is crucial for plant growth, as water is essential for seed germination and overall plant health. Research by Ormes (2018) [67] also suggests that cosmic ray activity can influence long-term weather patterns, potentially altering rainfall and, thereby, affecting agricultural productivity.
Furthermore, cosmic rays have been shown to influence plant growth at the genetic level. Studies suggest that exposure to cosmic rays can enhance seed germination rates by inducing genetic mutations, which may improve stress resistance and growth in certain plant species. A study referenced in Frontiers in Plant Science (2023) [68] supports this, showing that exposure to radiation, including cosmic rays, can trigger faster germination and stronger seedling development in certain plants.
Additionally, research by Dengel (2009) [69] found that galactic cosmic rays could increase photosynthesis in tree canopies and affect tree ring growth, suggesting that cosmic rays can influence both tree vitality and long-term growth patterns. These effects, although subtle, demonstrate the potential role of cosmic rays in enhancing plant productivity, influencing genetic adaptations, and promoting healthier ecosystems over time.
As our previous research indicates [70], TSI and cosmic rays undoubtedly are connected with the global climate variables, and here, we try to establish if daily concentrations of CO2 emissions respond to these aggregates (Figure 10).
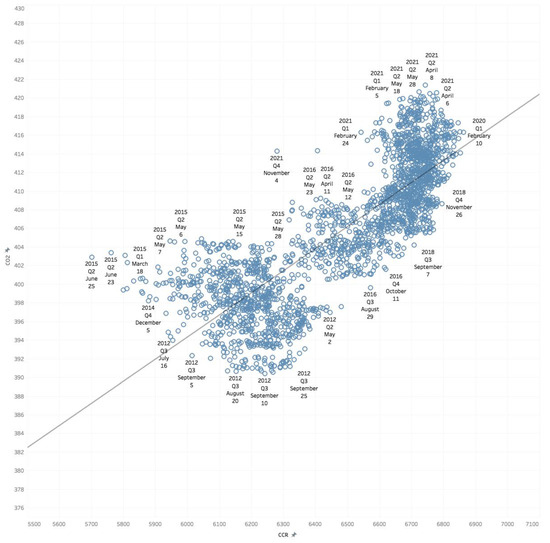
Figure 10.
Daily CO2 concentrations and cosmic rays.
Figure 10 illustrates that there is an undoubted correlation between cosmic rays and global CO2 concentrations, and this correlation tends to be positive.
In order to understand all the potential factors involved, we built a full-scale econometric model of global daily CO2 concentrations and examined the role of sustainable business as a force for good.
4. Model Building
4.1. Modeling CO2 Concentrations in Levels
We built a dynamic econometric model aimed at explaining the daily fluctuations in global CO2 concentrations in the atmosphere. The model building rested on the theoretical understanding of which factors should affect CO2 concentration both at the level of emissions and at the level of absorption, and this process combines two phases: modeling relationships in levels and modeling the relationships in differences and combining the models following the so-called error–correction modeling [71,72,73,74].
The methodological framework we used in our modeling (Figure 11) is largely based on the understanding of the carbon cycle. It is characterized by sources of CO2 emissions, represented by the economy, which is influenced by the Dow Jones Sustainability Index of most sustainable companies and the oil price, among other factors. The resulting emissions will be higher or lower depending on the combination of these factors, with one of the crucial factors being the efforts by the largest companies to reduce their CO2 emissions. The opposite side of the equation affecting the concentrations of CO2 in a positive way is the biomass represented by the Plants box. This is, in turn, influenced by astronomical factors such as solar energy and cosmic rays, which have already been illustrated in our previous work [70]. Although this framework might be seen as a simplification of reality, every model is a reasonable simplification of reality with the crucial elements and connections emphasized and the less relevant omitted.
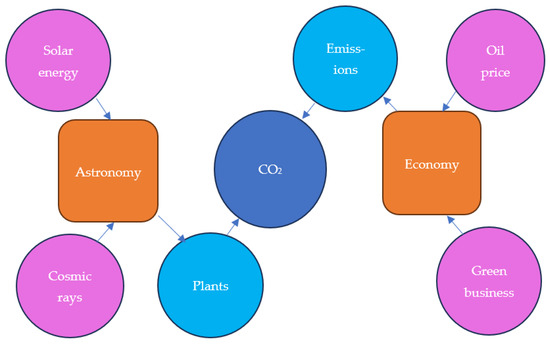
Figure 11.
Methodological framework.
The modeling was carried out with the help of the advanced econometric analysis package OxMetrics. The first step in the modeling process was to model the relationships in levels. This initial model is illustrated in Figure 12. We can see that the modeled CO2 concentrations follow the observed in quite a close way, with the observed shown by the red line and the fitted by the blue line. Based on 2195 observations, we established that daily CO2 concentrations in the global atmosphere are very auto-correlated, have a positive impact from the Dow Jones Sustainability Index, a negative impact from the oil price, a positive impact from cosmic rays, and a positive impact from total solar irradiance (Table 2 and Figure 12).
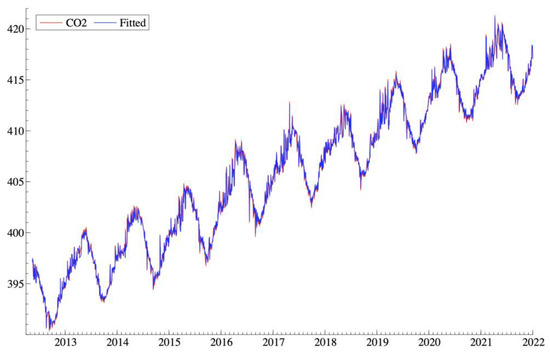
Figure 12.
Model of CO2 concentrations in levels using daily data.
Table 2.
Coefficients in the CO2 model in levels.
We note the good values of Adjusted R2 (0.990716), the AIC of −0.692693, and some issues with the autocorrelation, normality, and heteroskedasticity of residuals. We note that the Dow Jones Sustainability Index tends to contribute approximately 1% to the explanation of the variance in daily CO2 concentrations. Figure 13 presents the residuals in the levels model.

Figure 13.
Residuals in the levels model.
4.2. Modeling CO2 Concentrations in Differences
Modeling the process at hand in differences to examine the short-run dynamics, we obtained the model presented in Figure 14 and Table 3.
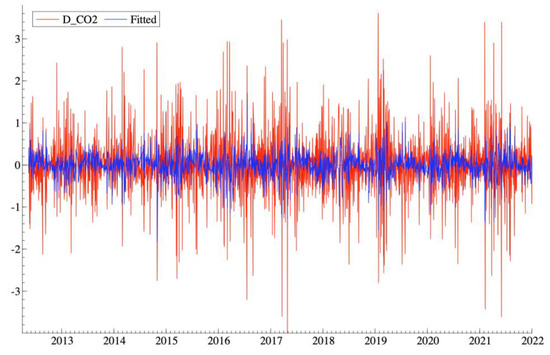
Figure 14.
Differences model of D (CO2).
Table 3.
Coefficients in the differences model.
We note the R2 of 0.155267 and the AIC of −0.834095.
4.3. Final Combined Model
When we combined all the elements into the integrated model to build a model examining both the long-run and the short-run, we obtained the model depicted in Figure 15 and Table 4. We can definitely observe a much closer fit between the actual CO2 concentrations data and the fitted data.
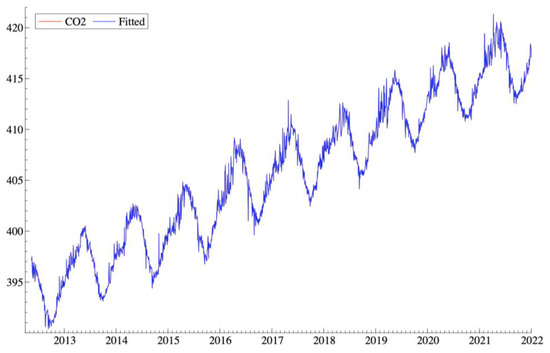
Figure 15.
Integrated model of global CO2 concentrations (2012–2022).
Table 4.
Model coefficients in the integrated model.
In the integrated model (Figure 15 and Table 4), we still observe autocorrelation of CO2 concentrations, which is to be expected, as it represents the inertia in the system. Crude Brent oil now features a positive coefficient, the TSI square features a negative coefficient, and the CCR square features a negative coefficient, while the Dow Jones Sustainability Index also features a negative coefficient, confirming our H0 hypothesis that a sustainable business can be a force for good. We have improved the residuals (Figure 16), our Adjusted R2 to 0.999993 and the AIC to −7.82265, which is excellent. The inclusion of the decimal date variable allowed us to make sure that the model has much more stable coefficients than before (Figure 17).

Figure 16.
Residuals in the final model.
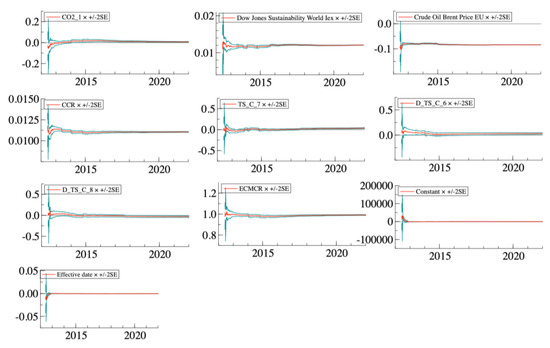
Figure 17.
Coefficient stability in the final model. Red line represents cumulative sum of recursive residuals (CUSUM), the green lines are critical bounds for the stability test, at a 95% confidence level. If the red line (test statistic) stays within the green bounds, it indicates that the model parameters are stable over the sample period.
The reduction in the Akaike Information Criterion (AIC) from −0.692693 in the levels model to −7.82265 in the combined short-run and long-run final model indicates a substantial improvement in the model’s performance. The AIC is a widely used metric for evaluating the quality of statistical models, balancing the goodness of fit with model complexity. A lower AIC value reflects a model that better explains the observed data without overfitting.
The initial levels model, with an AIC of −0.692693, primarily captured the long-run relationships between variables. While this approach provided some insights, the relatively higher AIC suggests limitations in its ability to fully account for the dynamics of the system. By contrast, the final model incorporates both short-run dynamics and long-run relationships, leading to a significantly lower AIC of −7.82265. This marked reduction demonstrates that the inclusion of short-term adjustments, such as fluctuations or lagged effects, substantially enhances the explanatory power of the model.
Importantly, this improvement in the AIC signifies that the added complexity of the combined model is justified by its ability to capture more of the variability in the data. The short-run components complement the long-run framework, allowing the model to better reflect real-world processes, such as immediate responses to external factors or transient deviations from equilibrium.
Overall, the reduction in the AIC highlights the superior performance of the combined model, making it a more robust and reliable tool for understanding the dynamics of the system under study.
The residual analysis displayed in the top panels confirms that the model is highly robust and well-specified. The residual plot over time (top right) exhibits no visible trends or patterns, indicating that the errors are randomly distributed and the model effectively captures the underlying data dynamics. The histogram of residuals (bottom left) aligns closely with a normal distribution, centered at zero with minimal skewness, further validating that the model errors are unbiased and normally distributed. Additionally, the autocorrelation (ACF) and partial autocorrelation (PACF) functions (bottom right) show no significant lags, suggesting that the residuals are not autocorrelated and the model has successfully accounted for time-dependent structures in the data.
The long-term stability of the model’s coefficients, as illustrated in the bottom series of charts, underscores its reliability. All coefficients remain stable over the examined period, with confidence intervals tightly surrounding the point estimates. This stability signifies that the relationships captured by the model between predictors and the response variable are consistent over time, even in the presence of external variations. The absence of significant deviations or abrupt changes further confirms the robustness of the model, making it an excellent tool for forecasting and interpreting long-term dynamics.
5. Discussion
Let us take some steps to interpret the model that we managed to obtain, considering the meaning of each term in detail and its possible implications. To understand this model comprehensively, it is essential to consider the relationships between the variables, their statistical significance, and the underlying implications for atmospheric CO2 levels.
5.1. The Negative Constant
The negative constant of −6.17092 suggests an interesting starting point for the model. In the context of the equation, the negative constant can be seen as a baseline adjustment in the absence of all other influencing factors (e.g., CO2 from the previous day, economic activities, or commodity prices). This value may symbolize a potential long-term equilibrium in the Earth’s natural carbon cycle, one that existed before the rise of human industrialization.
Historically, before humans began significantly influencing the atmosphere, the Earth’s natural processes maintained relatively stable CO2 levels. As the planet’s ecosystems evolved, particularly with the rise of photosynthetic organisms, the amount of CO2 absorbed and emitted was approaching the state of dynamic equilibrium, creating a balance between carbon emissions and carbon sequestration. This natural equilibrium may be represented by the negative constant, signaling a period when nature operated in harmony and the Earth’s biosphere and geosphere functioned to stabilize atmospheric CO2 concentrations.
However, the negative constant also reflects the fragility of this equilibrium. It indicates that while natural systems may have once been capable of absorbing more CO2 than they emitted, this balance is no longer in place due to human activities. The overwhelming emissions from fossil fuel combustion, industrial processes, deforestation, and other anthropogenic activities are now pushing CO2 levels far above this natural baseline.
5.2. Decimal Date
The decimal date coefficient (0.00387243) suggests a gradual increase in CO2 concentrations over time, where the passage of time itself (as represented by the date) is positively correlated with increasing CO2 levels. This could indicate that, over the period under study, global CO2 concentrations have been steadily rising due to long-term trends like industrialization, increased human activity, and fossil fuel consumption. The statistical significance (p-value = 0.0002) confirms the reliability of this relationship.
5.3. CO2(t − 1) or Lagged CO2
The coefficient for CO2 (t − 1): 1.00034 is striking in its magnitude and statistical significance, which shows a very strong autoregressive effect, meaning that today’s CO2 concentrations are heavily influenced by the concentrations of the previous day. This makes sense given the nature of CO2 dynamics: concentrations do not change abruptly on a daily basis, and past emissions from human or natural sources influence present levels. The very high Part.R2 (0.9999) suggests that past CO2 concentrations account for a substantial portion of today’s CO2 levels, reflecting the inertia in the system and the persistence of atmospheric CO2.
5.4. Dow Jones Sustainability World Index (DJSI)
The Dow Jones Sustainability World Index coefficient (−0.0000160759) shows a negative relationship with global CO2 concentrations. This means that as the DJSI rises, indicating improvements in sustainability practices by businesses, CO2 concentrations tend to decrease. This finding aligns with the idea that more sustainable business practices, such as increased energy efficiency, a shift toward renewable energy sources, and better waste management, may help mitigate CO2 emissions and confirms our H0 hypothesis. The statistical significance (p-value = 0.0047) further confirms that this relationship is meaningful, though the effect size is modest, as indicated by the Part.R2 (0.0036).
This relationship suggests that a transition toward more sustainable business practices, the transformation of business models, and increased focus on ESG dimensions, as reflected in the DJSI, could have a tangible impact on reducing global CO2 levels, but they are not the sole factors influencing these concentrations [25,65,75,76].
5.5. Brent Crude Oil Price
The Brent crude oil price coefficient (0.000110840) shows a positive relationship between oil prices and CO2 concentrations. This suggests that as oil prices increase, global CO2 concentrations also rise. This could be interpreted in two ways: higher oil prices might lead to greater investment in fossil fuel extraction and related activities, or they may reflect increased energy consumption due to global demand. The statistical significance (p-value = 0.0019) and moderate Part.R2 (0.0044) suggest that this is a noteworthy, but not overwhelming, relationship.
This could be indicative of the economic structure, where fossil fuel reliance remains strong despite efforts to reduce emissions. Alternatively, this may point to a supply–demand effect in the energy markets, where higher prices lead to shifts in extraction and consumption behaviors.
5.6. CCR_SQUARE (Squared Terms of Cosmic Rays)
The coefficient for CCR_SQUARE (−0.00000000262072) reveals a significant nonlinear relationship between cosmic ray intensity and CO2 concentrations, with a highly significant t-value of −7.47 (p-value = 0.0000) and a Part.R2 of 0.0249. This indicates that cosmic rays influence CO2 levels in a manner that is not strictly linear, likely due to their role in cloud formation, which has indirect effects on CO2 dynamics.
Cosmic rays are known to affect cloud nucleation, and, in turn, this impacts rainfall patterns and atmospheric conditions favorable to plant growth. The negative sign of the coefficient suggests that increased cosmic ray activity could enhance cloud cover, leading to more favorable conditions for vegetation, which helps in reducing CO2 concentrations through increased photosynthesis and carbon sequestration. The squared term emphasizes that small changes in cosmic ray activity may have amplified effects on CO2 levels, possibly through the feedback loop where more cloud cover and rainfall lead to more plant growth, which, in turn, absorbs more CO2 from the atmosphere.
This result supports previous studies suggesting that cosmic rays, by influencing cloud formation and plant growth, can indirectly contribute to a reduction in atmospheric CO2 concentrations.
5.7. TSI_SQUARE (Squared Terms of Total Solar Irradiance)
The TSI_SQUARE coefficient −0.000000890689) is statistically insignificant (p-value = 0.1286) and has a very low Part.R2 (0.0011). This suggests that, within the scope of this model, total solar irradiance (TSI) does not have a strong influence on global CO2 concentrations when squared. However, the relationship might still warrant further investigation, especially when considering the cosmic ray effects that affect cloud formation and subsequent rainfall, which can indirectly impact plant growth and carbon sequestration.
5.8. D_CCR_4 (Differenced CCR Terms)
The D_CCR_4 coefficient (0.0000316413) represents the differenced term for carbon cycle dynamics over a four-day lag, and it shows a positive relationship with CO2 concentrations. This suggests that short-term variations in the carbon cycle can influence CO2 concentrations in the immediate term. The statistical significance (p-value = 0.0012) and moderate Part.R2 (0.0024) indicate that these short-term changes in the carbon cycle are relevant for daily CO2 dynamics.
5.9. ECM_DIFF (Error Correction Term)
The ECM_DIFF coefficient (0.999205) is highly significant (p-value = 0.0000) and demonstrates that error correction dynamics play a major role in the system. The coefficient’s value close to 1 indicates that the system is highly persistent, and deviations from the equilibrium state (whether caused by human activity or natural factors) are corrected very quickly. This suggests that global CO2 concentrations exhibit path dependence and tend to revert to a long-term trend or equilibrium once short-term disturbances are accounted for.
6. Conclusions
This model of global CO2 concentrations reveals several insightful relationships between human activity, economic variables, and natural processes. While the negative constant hints at a potential historical equilibrium in the carbon cycle, human-driven emissions have clearly disrupted this balance. The model suggests that business sustainability and oil prices play significant roles, but autocorrelation and cosmic rays dynamics have the most substantial impact on explaining daily CO2 concentrations. The presence of error correction mechanisms also reinforces the idea that, despite fluctuations, CO2 concentrations tend to revert to long-term trends influenced by natural and anthropogenic factors.
Our hypothesis H1 is, therefore, confirmed as well, and we have been able to build a comprehensive model of daily CO2 concentrations examining the role of multiple factors. One of these factors, and this confirms our H0 hypothesis, is sustainable business, expressed by the Dow Jones Sustainability Index. By improving sustainability practices, reducing fossil fuel reliance, and understanding the complexities of the carbon cycle, it is possible to mitigate the rise in CO2 concentrations and work toward restoring a more balanced and sustainable atmospheric state.
Discussing the ways to make sure that businesses make an even greater contribution toward decarbonization globally, we need to touch upon several interconnected issues. The first set of questions relate to what is actually inside the Dow Jones Sustainability Index and how truly sustainable these companies are. Estimating the market capitalization in brackets, we note that the index still includes oil giants like Total Energies (USD 158.64 bln), Exxon Mobil (USD 542.20 bln), Chevron Corporation (USD 305.93 bln), and the mining giant Rio Tinto (USD 104.73 bln), as well as truly more sustainable and lower impact companies like Apple (USD 2.76 trln), Microsoft (USD 2.45 trln), Salesforce (USD 186.75 bln), Alphabet Inc. (USD 1.7 trln), Meta Platforms Inc. (USD 779 bln), Tesla (USD 836.59 bln), SAP (USD 158.25 bln), Vestas Wind Systems A/S (USD 23.71 bln), NextEra Energy, Inc. (USD 103.80 bln), Ørsted (USD 43.29 bln), Enel S.p.A. (USD 77.72 bln), JinkoSolar Holding Co., Ltd. (USD 2.90 bln), Iberdrola S.A (USS 90.03 bln), Munich Re (USD 32.7 bln), and Zurich Insurance (USD 60.65 bln). So the biggest question is what are the criteria for inclusion of the companies into the Dow Jones Sustainability Index, and should this be based on their Scope 3 CO2 emissions or emissions to turnover ratios, so that oil companies cannot be part of the index? The performance of companies that could be considered as a backbone of sustainability transition, e.g., solar panel suppliers Jinko Solar or Ørsted, has been less than spectacular, indicating a market myopia, which is highly surprising.
The second issue in relation to how to make sure businesses are playing a larger role is regulation. Focusing on the subject of our paper, we can remark not all countries in the world have introduced a carbon tax, with only several countries fully embracing it like Sweden [65]. A universal global carbon market has not yet been built. At the same time, there is no consistent regulation in the field of circular economy, with even European countries exhibiting conflicting signals. Many countries in Western Europe introduced landfill taxes; however, many continue to export waste abroad, and very few, if at all, supported them with incineration taxes to truly promote the circular economy. There is still very little in the way of regulation in the field of ecosystems and biodiversity impacts. In the EU, there are some signs of a growing impact of new standards and EU cross-border regulations. In the United States, there are multiple examples where whole states have legislated against using ESG criteria for the assessment of investment fund performance, trying to defend the infamous quote from Milton Friedman that “the business of business is to do business”. Robert Eccles has discussed these instances at length: they seem to be clear violations of the principles of the free market because if the customers demand ESG focus, the investment community should follow.
A more general question could be posed regarding how markets really value sustainability and whether there is an obstacle that we face in this context. How does business education embrace sustainability worldwide and how much do business leaders care? What could be said about the values and the deeply held beliefs of business leaders? There are, however, voluntary schemes, like the B-Corp, which encourage its members to make a legal change in their statutes to introduce the principle of respect to all stakeholders, not just the shareholders, thereby, changing the nature of conducting business itself. This example is very much in line with the sustainable business ideas presented by John Elkington, Ronald Cohen, and Robert Eccles.
Examining the connection between the sustainable business expressed in the Dow Jones Sustainability Index and global CO2 concentrations, we notice a high degree of auto-correlation in the global CO2 concentrations, with some impact of astronomical variables, like cosmic rays and total solar irradiance, and the limited but statistically significant impact of the oil price and the Dow Jones Sustainability Index. The fact that the Dow Jones Sustainability Index comes with a negative coefficient gives us some hope that businesses could be a force for good; however, many questions arise. The hypotheses we formulated at the start of the paper, namely, hypothesis H1 that business can be a force for good and make a positive contribution toward global decarbonization effort, as well as H2 that it is feasible to build a dynamic econometric model based on daily data on atmospheric CO2 concentrations and a range of economic and astronomic factors have both been confirmed.
It is obvious that without the involvement of businesses, it is very unlikely that a sustainability transition will ever take place. If we are going to see businesses as a true force for good, we need clearer regulations, better sustainability education for top managers, and a deep transformation of the business models addressing the most pressing issues of our time: climate change, biodiversity loss, and the waste crisis.
Author Contributions
Conceptualization, S.E.S.; methodology, S.E.S.; validation, S.E.S.; formal analysis, S.E.S.; investigation, S.E.S.; data curation, S.E.S.; writing—original draft preparation, E.G. and S.E.S.; writing—review and editing, S.E.S.; visualization, S.E.S.; supervision, S.E.S.; project administration, S.E.S. All authors have read and agreed to the published version of the manuscript.
Funding
This research received no external funding.
Institutional Review Board Statement
Not applicable.
Informed Consent Statement
Not applicable.
Data Availability Statement
The data presented in this study are available on request from the corresponding author.
Conflicts of Interest
The authors declare no conflicts of interest.
References
- Cohen, R. Impact: Reshaping Capitalism to Drive Real Change; Ebury Press: London, UK, 2020; p. 256. [Google Scholar]
- Eccles, R.G.; Ioannou, I.; Serafeim, G. The Impact of Corporate Sustainability on Organizational Processes and Performance. Manag. Sci. 2014, 60, 2835–2857. [Google Scholar] [CrossRef]
- Elkington. Green Swans: The Coming Boom in Regenerative Capitalism; Fast Company Press: Austin, TX, USA, 2021. [Google Scholar]
- Carney, M. Value(s): The Must-Read Book on How to Fix Our Politics, Economics and Values; William Collins: Glasgow, Scotland, 2021; p. 608. [Google Scholar]
- Polman, P. Net Positive: How Courageous Companies Thrive by Giving More Than They Take; Harvard Business Review Press: Brighton, MA, USA, 2022. [Google Scholar]
- Catalyst. The Bottom Line: Connecting Corporate Performance and Gender Diversity; Catalyst: New York, NY, USA, 2020. [Google Scholar]
- Ferri, G.; Pini, M. Environmental vs. Social Responsibility in the Firm. Evidence from Italy. Sustainability 2019, 11, 4277. [Google Scholar] [CrossRef]
- Kell, G. The Remarkable Rise of ESG, Forbes. 2018. Available online: https://www.forbes.com/sites/georgkell/2018/07/11/the-remarkable-rise-of-esg/#549a69021695 (accessed on 1 June 2024).
- Khan, M.; Serafeim, G.; Yoon, A. Corporate Sustainability: First Evidence on Materiality. Account. Rev. 2016, 91, 1697–1724. Available online: http://www.aaajournals.org/doi/abs/10.2308/accr-51383 (accessed on 1 June 2024). [CrossRef]
- Sparkes, R. Socially Responsible Investment: A Global Revolution; Wiley: Hoboken, NJ, USA, 2002. [Google Scholar]
- UN Global Compact. Who Cares Wins: Connecting Financial Markets to a Changing World; UN Global Compact: New York, NY, USA, 2005. [Google Scholar]
- UNDESA. A Briefing Note on Addis Ababa Agenda on Financing Sustainable Development and Developing Sustainable Finance; UNDESA: New York, NY, USA, 2015. [Google Scholar]
- UN. Principles for Responsible Investment. 2025. Available online: https://www.unpri.org/ (accessed on 21 January 2025).
- Cheng, B.; Ioannou, I.; Serafeim, G. Corporate social responsibility and access to finance. Strat. Manag. J. 2014, 35, 1–23. Available online: https://onlinelibrary.wiley.com/doi/abs/10.1002/smj.2131 (accessed on 1 June 2024). [CrossRef]
- El Ghoul, S.; Guedhami, O.; Kwok, C.C.; Mishra, D.R. Does corporate social responsibility affect the cost of capital? J. Bank. Finance 2011, 35, 2388–2406. Available online: https://econpapers.repec.org/article/eeejbfina/v_3a35_3ay_3a2011_3ai_3a9_3ap_3a2388-2406.htm (accessed on 1 June 2024). [CrossRef]
- Fulton, M.; Kahn, B.; Sharples, C. Sustainable Investing: Establishing Long-Term Value and Performance. 2012. Available online: http://dx.doi.org/10.2139/ssrn.2222740 (accessed on 1 June 2024).
- Gabriel, V. Environmentally sustainable investment: Dynamics between global thematic indices. Cuad. De Gest. 2019, 19, 41–62. [Google Scholar] [CrossRef]
- Giese, G.; Lee, L.E.; Melas, D.; Nagy, Z.; Nishikawa, L. Performance and risk analysis of index-based ESG portfolios. J. Index Investig. 2019, 9, 46–57. [Google Scholar] [CrossRef]
- Giese, G.; Lee, L.E.; Melas, D.; Nagy, Z.; Nishikawa, L. Foundations of ESG Investing: How ESG Affects Equity Valuation, Risk, and Performance. J. Portf. Manag. 2019, 45, 1–15. [Google Scholar] [CrossRef]
- Giese, G.; Nagy, Z.; Lee, L.E. Deconstructing ESG Ratings Performance Risk and Return for E, S and G by Time Horizon, Sector and Weighting. J. Portf. Manag. 2020, 47, 94–111. [Google Scholar] [CrossRef]
- Hartzmar, S.M.; Sussman, A.B. Do Investors Value Sustainability? A Natural Experiment Examining Ranking and Fund Flows. J. Financ. 2019, 74, 2789–2837. [Google Scholar] [CrossRef]
- Maiti, M. Is ESG the succeeding risk factor? J. Sustain. Finance Invest. 2020, 11, 199–213. [Google Scholar] [CrossRef]
- Nguyen-Taylor, K.; Martindale, M. Financial Performance of ESG Integration in US Investing (Principles for Responsible Investment, London). 2018. Available online: https://cdn2.hubspot.net/hubfs/4256284/PRI_Financial-performance-of-ESG-integration-in-US-investing_2018.pdf (accessed on 1 June 2024).
- Sadiqa, M.; Ngob, T.Q.; Pantameec, A.A.; Khudoykulovd, K.; Ngane, T.T.; Tan, L.P. The role of environmental social and governance in achieving sustainable development goals: Evidence from ASEAN countries. Econ. Res. Ekon. Istraživanja 2022, 36, 170–190. [Google Scholar] [CrossRef]
- Shmelev, S.E. Ecological Economics: Sustainability in Practice; Springer: Berlin/Heidelberg, Germany, 2012; p. 248. [Google Scholar]
- Fiskerstrand, S.R.; Fjeldavli, S.; Leirvik, T.; Antoniuk, Y.; Nenadić, O. Sustainable investments in the Norwegian stock market. J. Sustain. Finance Invest. 2020, 10, 294–310. [Google Scholar] [CrossRef]
- UK Government Actuary’s Department. Investment Bulletin; UK Government Actuary’s Department: London, UK, 2019.
- UNDESA. SDG Investing: Advancing a New Normal in Capital Markets; UNDESA: New York, NY, USA, 2017. [Google Scholar]
- UNDP. The SDG Impact Practice Standards for Private Equity Funds; UNDP: New York, NY, USA, 2019. [Google Scholar]
- UNEP FI. SDG Investment Case; UNEP FI: Geneva, Switzerland, 2019. [Google Scholar]
- UNEP FI. Fiduciary Duty in the 21st Century; UNEP FI: Geneva, Switzerland, 2020. [Google Scholar]
- University of Oxford and Arabesque Partners. From the Stockholder to the Stakeholder: How Sustainability Can Drive Financial Outperformance (March 2015). Available online: https://arabesque.com/research/From_the_stockholder_to_the_stakeholder_web.pdf (accessed on 1 June 2024).
- Whelan, T.; Atz, U.; Van Holt, T.; Clark, C. ESG and Financial Performance: Uncovering the Relationship by Aggregating Evidence from 1000 Plus Studies Published between 2015–2020; NYU Centre for Sustainable Business: New York, NY, USA, 2021; p. 19. [Google Scholar]
- Broadstock, D.C.; Chan, K.; Cheng, L.T.; Wang, X. The role of ESG performance during times of financial crisis: Evidence from COVID-19 in China. Finance Res. Lett. 2021, 38, 101716. [Google Scholar] [CrossRef]
- Krosinsky, C.; Purdom, S. Sustainable Investing: Revolutions in Theory and Practice; Routledge: Abingdon, UK, 2016. [Google Scholar]
- Crace, L.; Gehman, J. What Really Explains ESG Performance. In Disentangling the Asymmetrical Drivers of the Triple Bottom Line; Organization & Environment: Washington, DC, USA, 2023; Volume 36. [Google Scholar]
- Eccles, R.; Ioannou, I.; Serafeim, G. The Impact of a Corporate Culture of Sustainability on Corporate Behaviour and Performance, National Bureau of Economic Research, Working Paper 17950. 2011. Available online: http://www.nber.org/papers/w17950 (accessed on 1 June 2024).
- Clément, A.; Robinot, É.; Trespeuch, L. The use of ESG scores in academic literature: A systematic literature review. J. Enterprising Communities: People Places Glob. Econ. 2023, 19, 92–110. [Google Scholar] [CrossRef]
- Wang, N.; Pan, H.; Feng, Y.; Du, S. How do ESG practices create value for businesses? Research review and prospects. Sustain. Accounting, Manag. Policy J. 2022, 15, 1155–1177. [Google Scholar] [CrossRef]
- Babynina, L.; Kartashova, L.; Busalov, D.; Chernitsova, K.; Akhmedov, F. Effective ESG Transformation of Russian Companies in the New Environment: Current Challenges and Priorities. Acad. J. Interdiscip. Stud. 2023, 12, 113–128. [Google Scholar] [CrossRef]
- Linnenluecke, M.K. Environmental, social and governance (ESG) performance in the context of multinational business research. Multinatl. Bus. Rev. 2021, 30, 1–16. [Google Scholar] [CrossRef]
- Friede, G.; Busch, T.; Bassen, A. ESG and financial performance: Aggregated evidence from more than 2000 empirical studies. J. Sustain. Finance Invest. 2015, 5, 210–233. [Google Scholar] [CrossRef]
- Menicucci, E.; Paolucci, G. ESG Dimensions and Bank Performance: An Empirical Investigation in Italy; Emerald Publishing Limited: Bradford, UK, 2022. [Google Scholar]
- Schoenmaker, D.; Schramade, W. Investing for long-term value creation. J. Sustain. Finance Invest. 2019, 9, 356–377. [Google Scholar] [CrossRef]
- Freiberg, D.; Rogers, J.; Serafeim, G. How ESG Issues Become Financially Material to Corporations and Their Investors; Harvard Business School: Boston, MA, USA, 2020. [Google Scholar]
- Miralles-Quirós, M.M.; Miralles-Quirós, J.L.; Gonçalves, L.M.V. The Value Relevance of Environmental, Social, and Governance Performance: The Brazilian Case. Sustainability 2018, 10, 574. [Google Scholar] [CrossRef]
- Strekalina, A.; Zakirova, R.; Shinkarenko, A.; Vatsaniuk, E. The Impact of ESG Ratings on Financial Performance of the Companies: Evidence from BRICS Countries. J. Corp. Financ. Res. 2023, 17, 93–113. [Google Scholar] [CrossRef]
- Halbritter, G.; Dorfleitner, G. The wages of social responsibility—Where are they? A critical review of ESG investing. Rev. Financial Econ. 2015, 26, 25–35. [Google Scholar] [CrossRef]
- Huang, D.Z.X. Environmental, social and governance (ESG) activity and firm performance: A review and consolidation. Account. Finance 2021, 61, 335–360. [Google Scholar] [CrossRef]
- Arvidsson, S.; Dumay, J. Corporate ESG reporting quantity, quality and performance: Where to now for environmental policy and practice? Bus. Strat. Environ. 2022, 31, 1091–1110. [Google Scholar] [CrossRef]
- Kotsantonis, S.; Pinney, C.; Serafeim, G. ESG Integration in Investment Management: Myths and Realities. J. Appl. Corp. Finance 2016, 28, 10–16. [Google Scholar] [CrossRef]
- Setyahuni, S.W.; Handayani, R.S. On the value relevance of information on environmental, social, and governance (ESG): An evidence from Indonesia. J. Crit. Rev. 2020, 7, 50–58. [Google Scholar]
- Kotsantonis, S.; Serafeim, G. Four Things No One Will Tell You About ESG Data. J. Appl. Corp. Finance 2019, 31, 50–58. [Google Scholar] [CrossRef]
- Serafeim, G.; Yoon, A. Stock price reactions to ESG news: The role of ESG ratings and disagreement. Rev. Account. Stud. 2023, 28, 1500–1530. [Google Scholar] [CrossRef]
- Serafeim, G.; Yoon, A. Which Corporate ESG News Does the Market React To? Financial Anal. J. 2022, 78, 59–78. [Google Scholar] [CrossRef]
- Eccles, R.G.; Serafeim, G.; Krzus, M.P. Market Interest in Nonfinancial Information. J. Appl. Corp. Finance 2011, 23, 113–127. [Google Scholar] [CrossRef]
- Eccles, R.G.; Serafeim, G. The Performance Frontier: Innovating for a Sustainable Strategy, Harvard Business Review. 2013. Available online: https://hbr.org/2013/05/the-performance-frontier-innovating-for-a-sustainable-strategy (accessed on 1 June 2024).
- Serafeim, G.; Yoon, A. The Consequences of Mandatory Corporate Sustainability Reporting, Harvard Business School Working Paper. 2011. Available online: http://www.hbs.edu/research/pdf/11-100.pdf (accessed on 1 June 2024).
- Stubbs, W. Sustainable Entrepreneurship and B Corps. Bus. Strat. Environ. 2017, 26, 331–344. [Google Scholar] [CrossRef]
- Elkington, J. Enter the Triple Bottom Line. In The Triple Bottom Line: Does It All Add up; Henriques, A., Richardson, J., Eds.; Routledge: Abingdon, UK, 2004. [Google Scholar]
- Porter, M.E.; Serafeim, G.; Kramer, M. Where ESG Fails? Institutional Investor. Available online: https://www.institutionalinvestor.com/article/2bswdin8nvg922puxdzwg/opinion/where-esg-fails (accessed on 16 October 2019).
- MSCI. MSCI World ESG Leaders Index; MSCI: New York, NY, USA, 2021. [Google Scholar]
- McKinsey & Company. Diversity Wins: How Inclusion Matters; McKinsey & Company: New York, NY, USA, 2020. [Google Scholar]
- NOAA (National Oceanic and Atmospheric Administration). Trends in Atmospheric Carbon Dioxide: Mauna Loa CO2 Monthly Mean Data; NOAA: Silver Spring, ML, USA, 2025. Available online: https://gml.noaa.gov/ccgg/trends/mlo.html (accessed on 18 January 2025).
- Shmelev, S.E.; Speck, S.U. Green fiscal reform in Sweden: Econometric assessment of the carbon and energy taxation scheme. Renew. Sustain. Energy Rev. 2018, 90, 969–981. [Google Scholar] [CrossRef]
- Svensmark, H. Cosmic Rays and Earth’s Climate. Space Sci. Rev. 2000, 93, 175–185. [Google Scholar] [CrossRef]
- Ormes, J.F. Cosmic Rays and Climate. Adv. Space Res. 2018, 62, 2880–2891. [Google Scholar] [CrossRef]
- Dixit, A.R.; Meyers, A.D.; Richardson, B.; Richards, J.T.; Richards, S.E.; Neelam, S.; Levine, H.G.; Cameron, M.J.; Zhang, Y. Simulated galactic cosmic ray exposure activates dose-dependent DNA repair response and down regulates glucosinolate pathways in arabidopsis seedlings. Front. Plant Sci. 2023, 14, 1284529. [Google Scholar] [CrossRef]
- Dengel, S.; Aeby, D.; Grace, J. A relationship between galactic cosmic radiation and tree rings. New Phytol. 2009, 184, 545–551. [Google Scholar] [CrossRef]
- Shmelev, S.E.; Salnikov, V.; Turulina, G.; Polyakova, S.; Tazhibayeva, T.; Schnitzler, T.; Shmeleva, I.A. Climate Change and Food Security: The Impact of Some Key Variables on Wheat Yield in Kazakhstan. Sustainability 2021, 13, 8583. [Google Scholar] [CrossRef]
- Engle, R.F.; Granger, C.W.J. Co-Integration and Error Correction: Representation, Estimation, and Testing. Econometrica 1987, 55, 251–276. [Google Scholar] [CrossRef]
- Hendry, D. Dynamic Econometrics; Oxford University Press: Oxford, UK, 1995. [Google Scholar]
- Hendry, D.; Nielsen, B. Ecomometric Modelling. In A Likelihood Approach; Princeton University Press: Princeton, NJ, USA, 2007. [Google Scholar]
- Hendry, D.; Doornik, J. Empirical Model Discovery and Theory Evaluation; MIT Press: Cambridge, MA, USA, 2014. [Google Scholar]
- Shmelev, S.E.; Shmeleva, I.A. Global urban sustainability assessment: A multidimensional approach. Sustain. Dev. 2018, 26, 904–920. [Google Scholar] [CrossRef]
- Shmelev, S. (Ed.) Sustainable Cities Reimagined: Multidimensional Assessment and Smart Solutions; Routledge: Abingdon, UK, 2019. [Google Scholar]


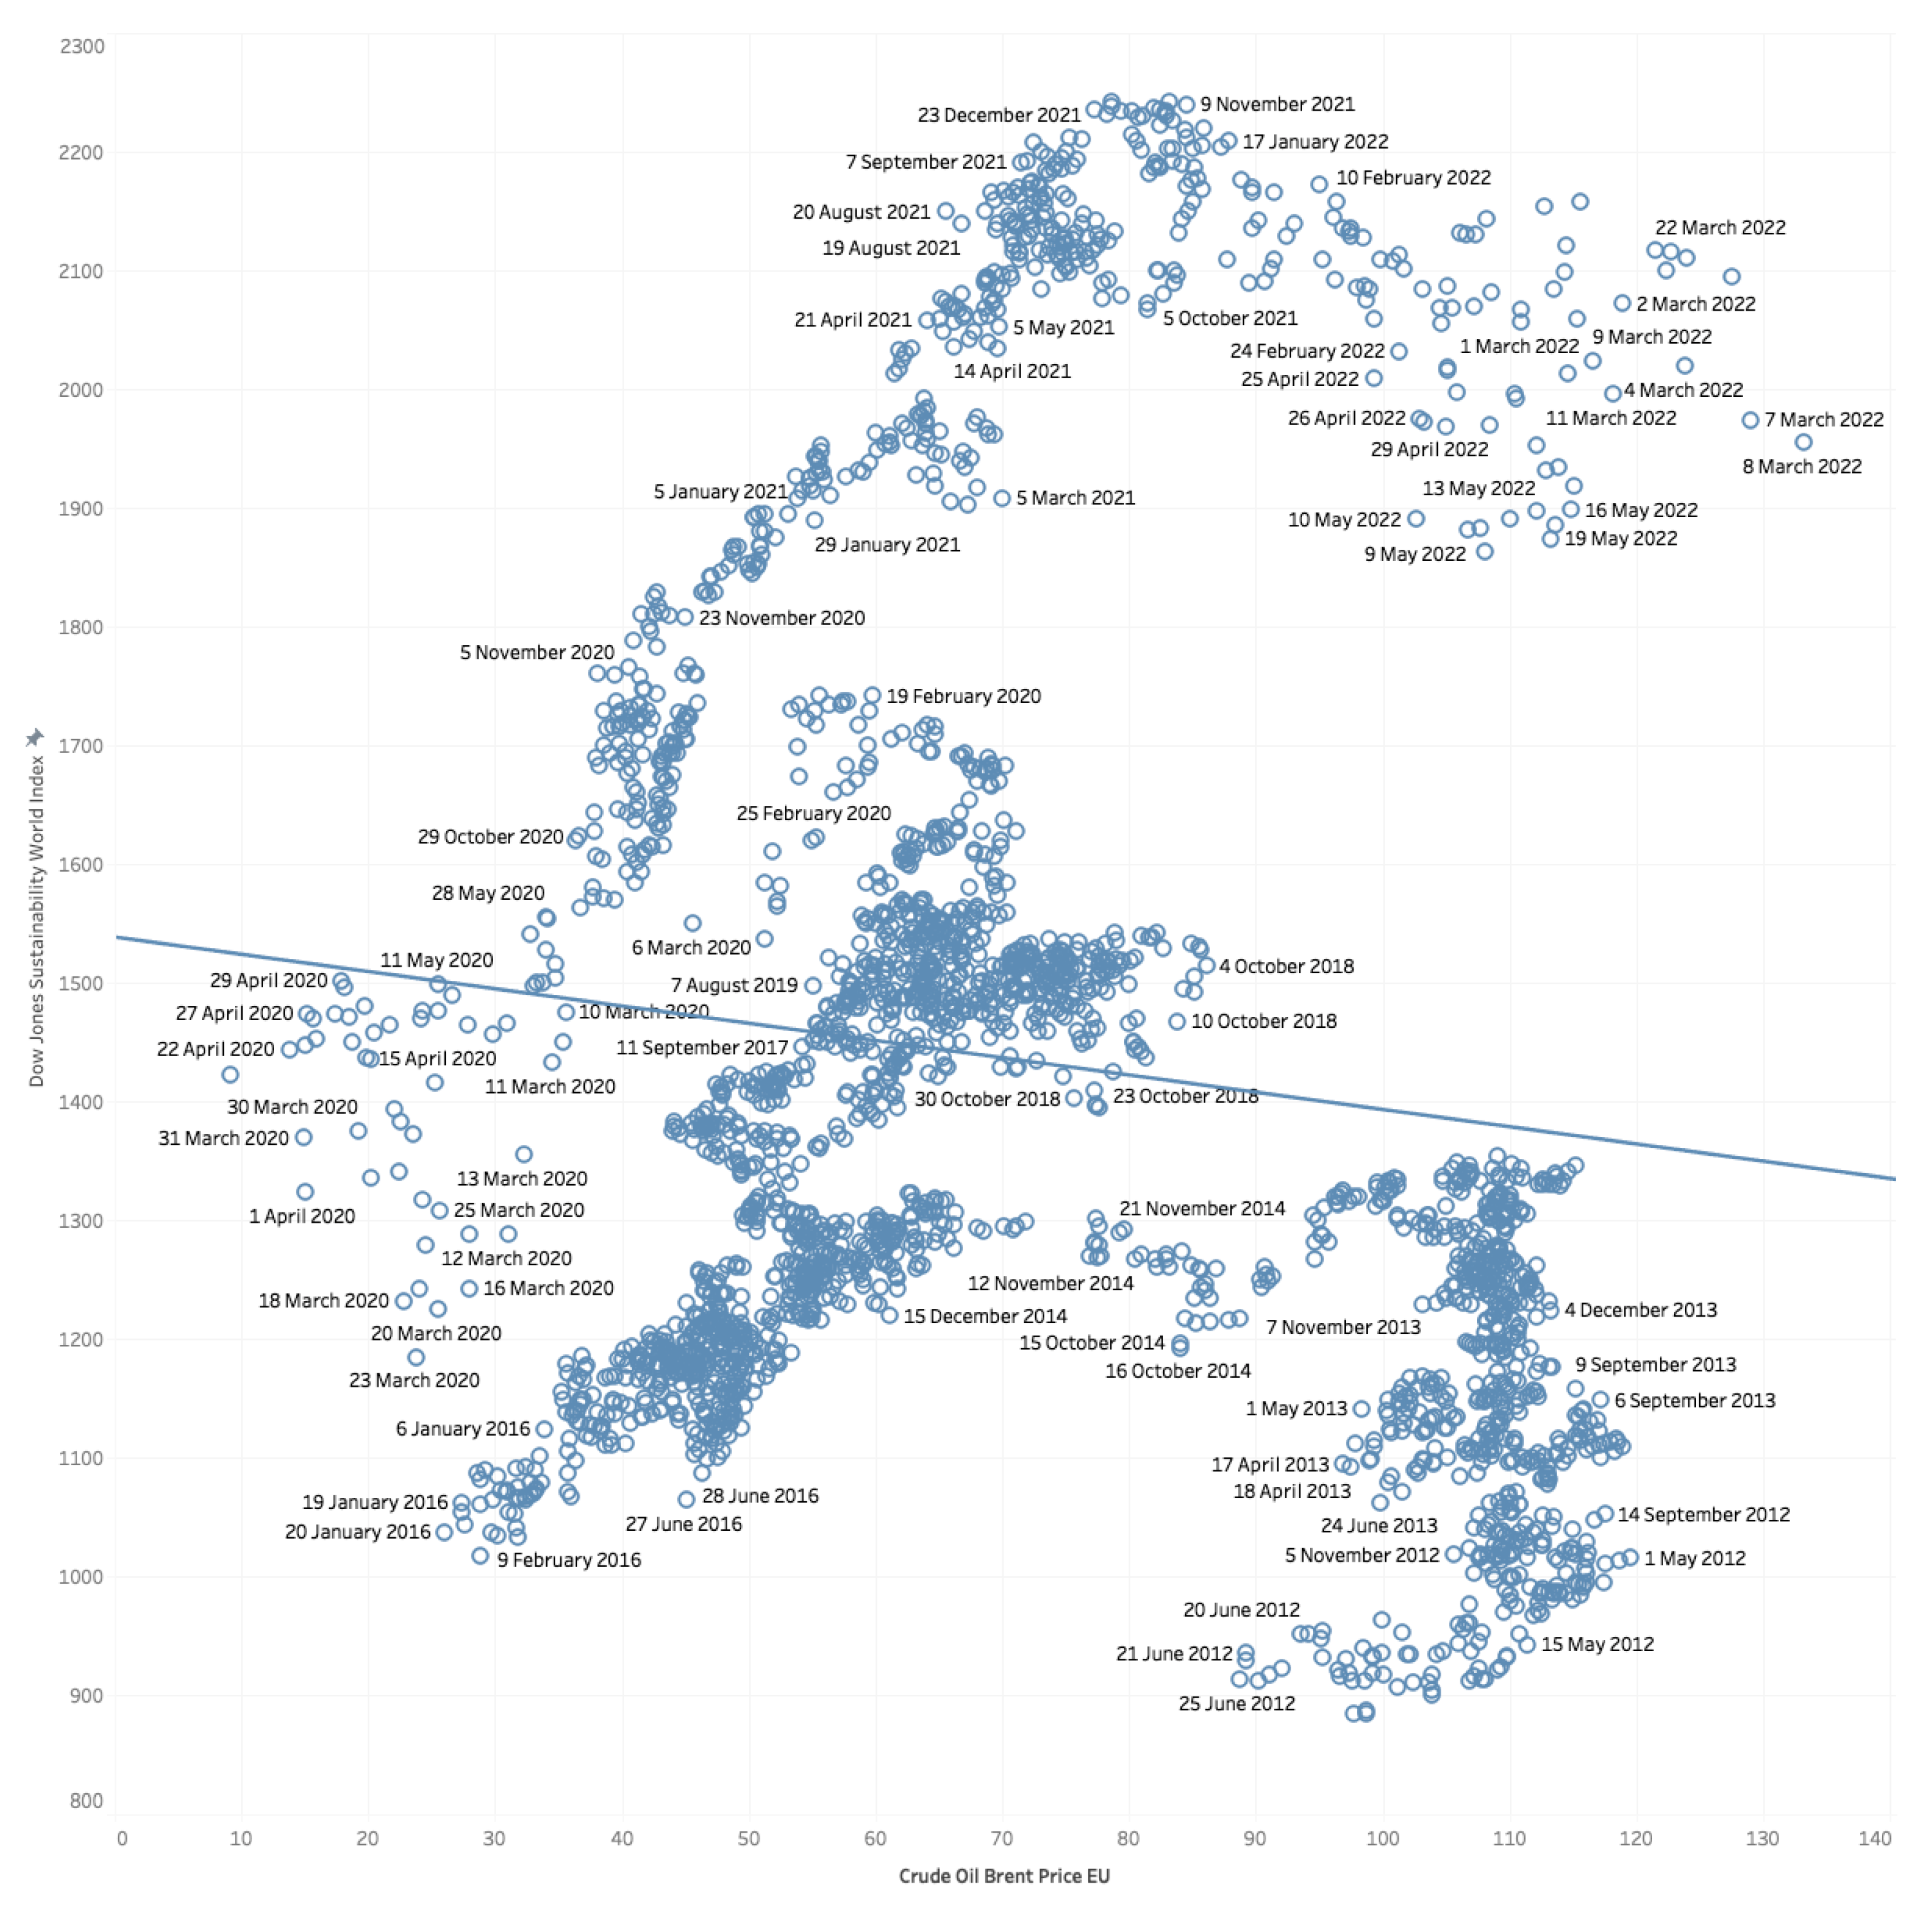
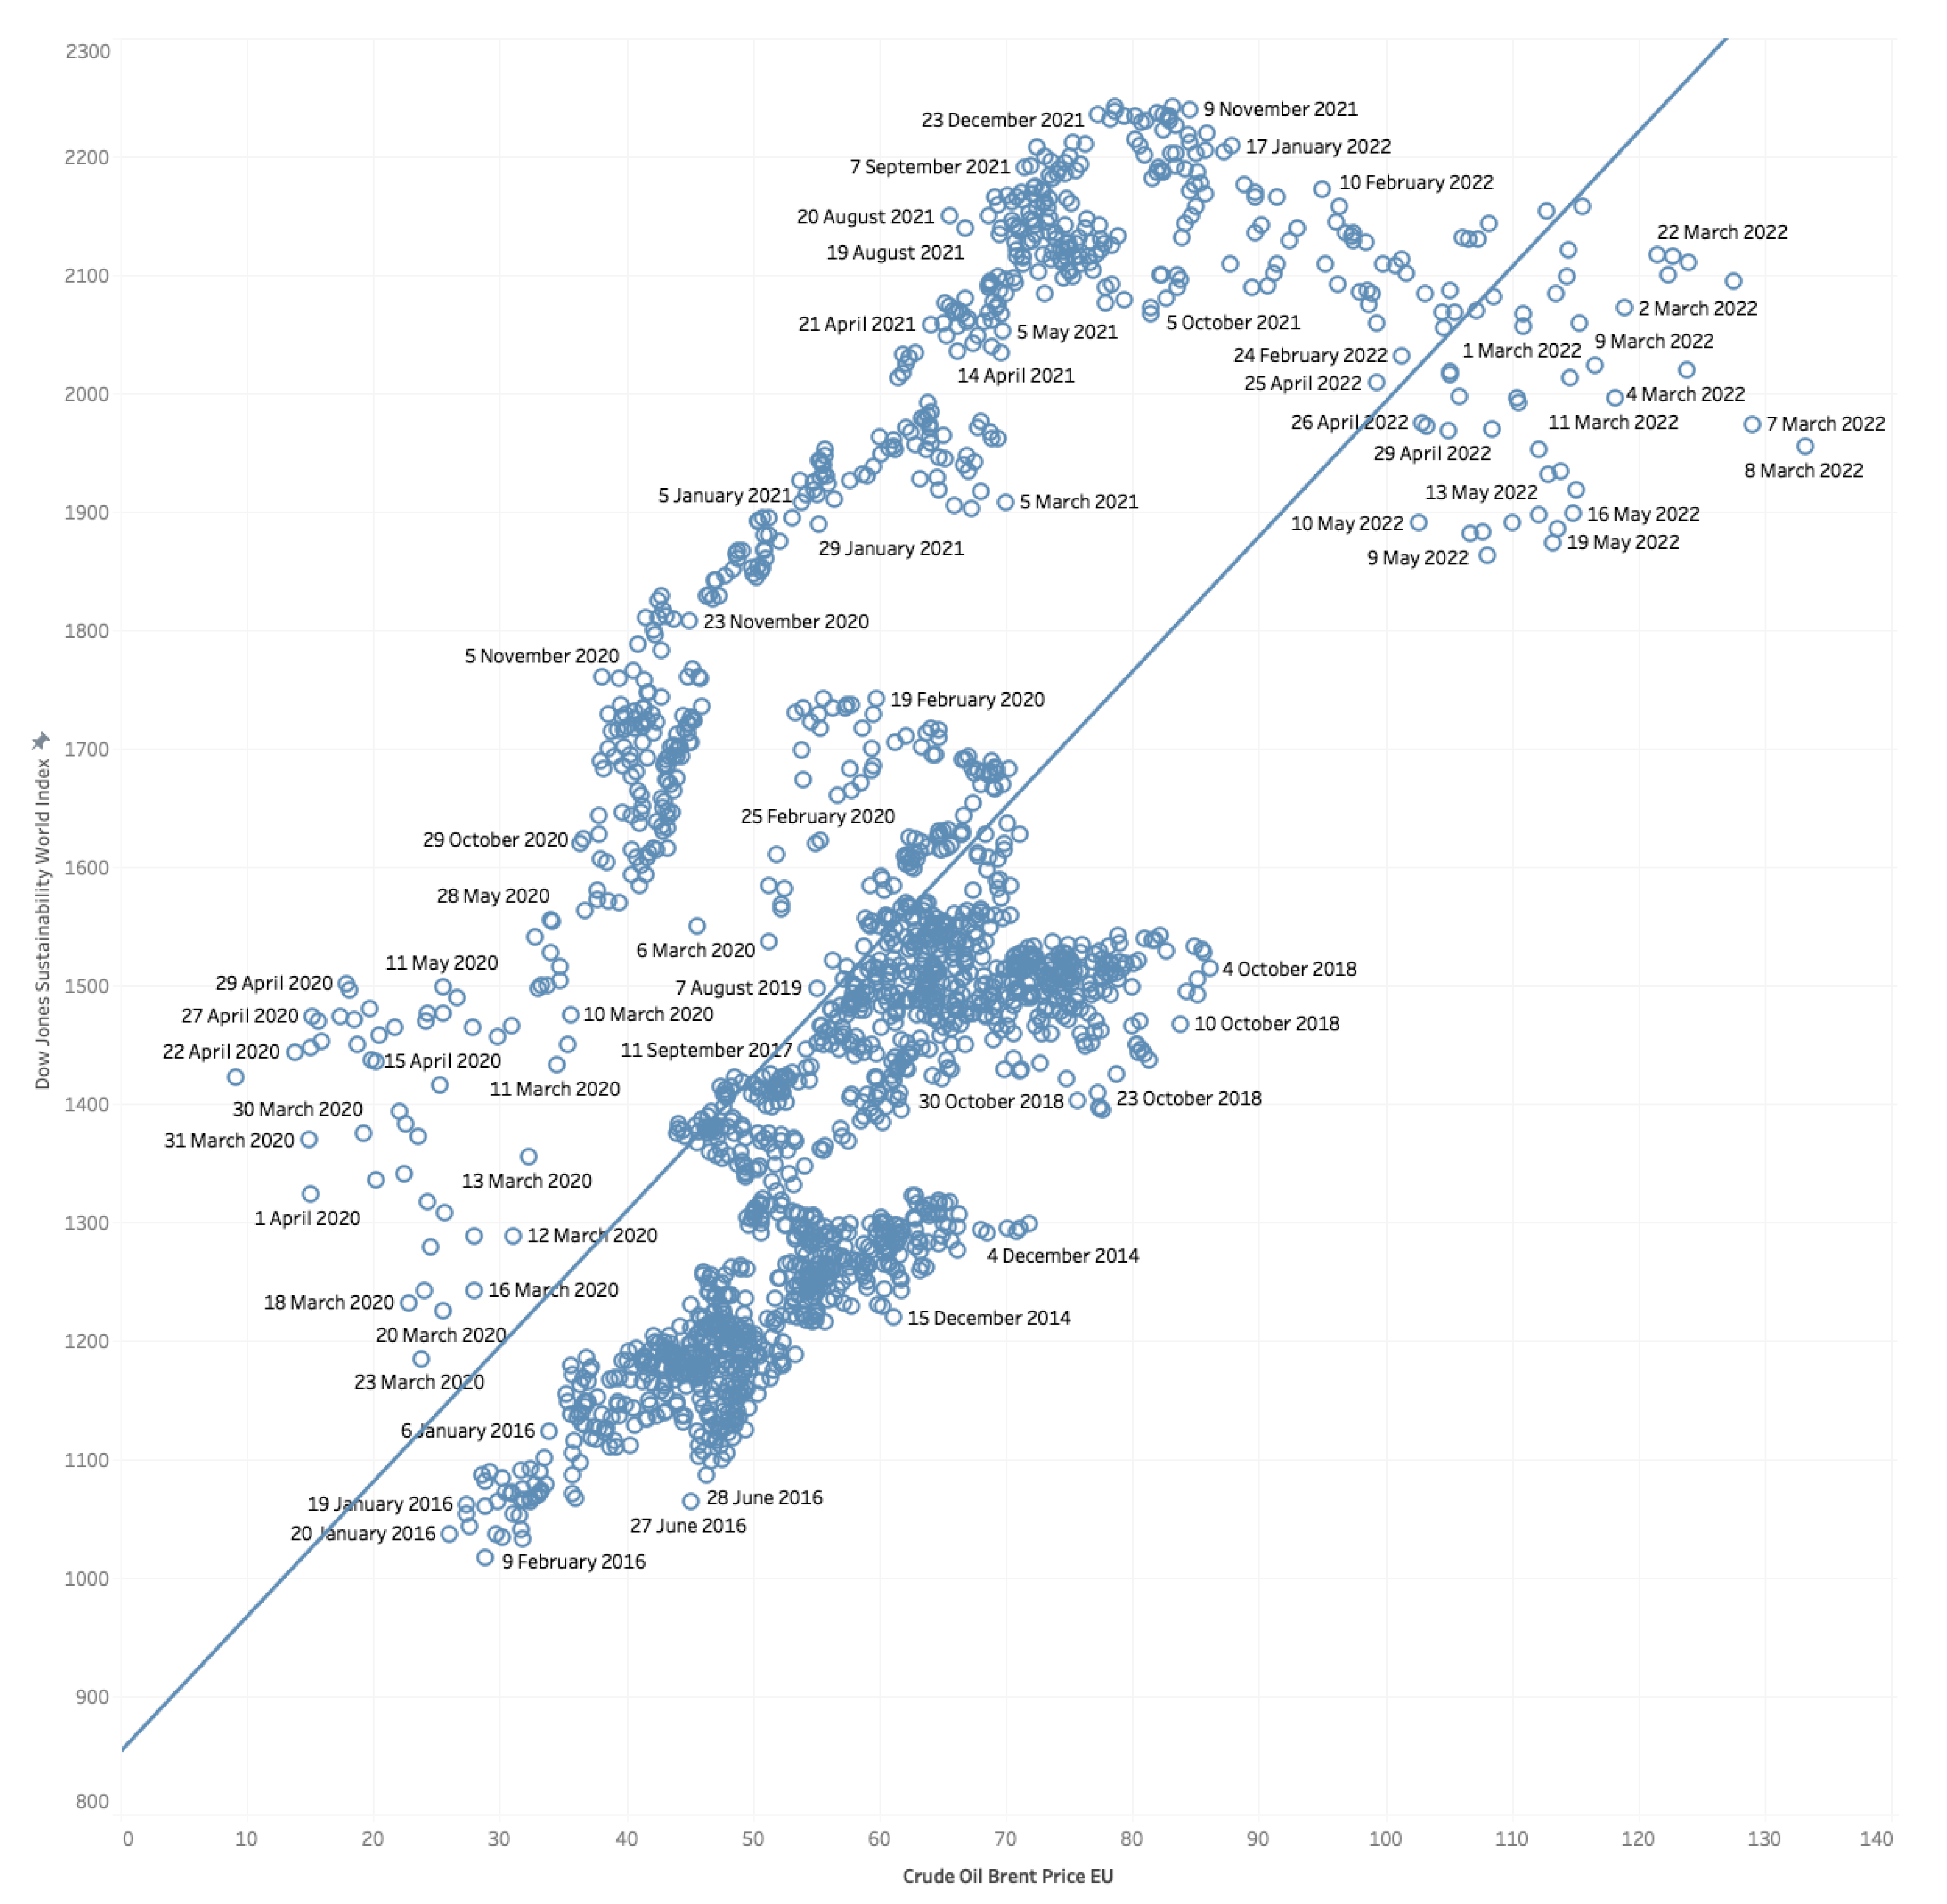

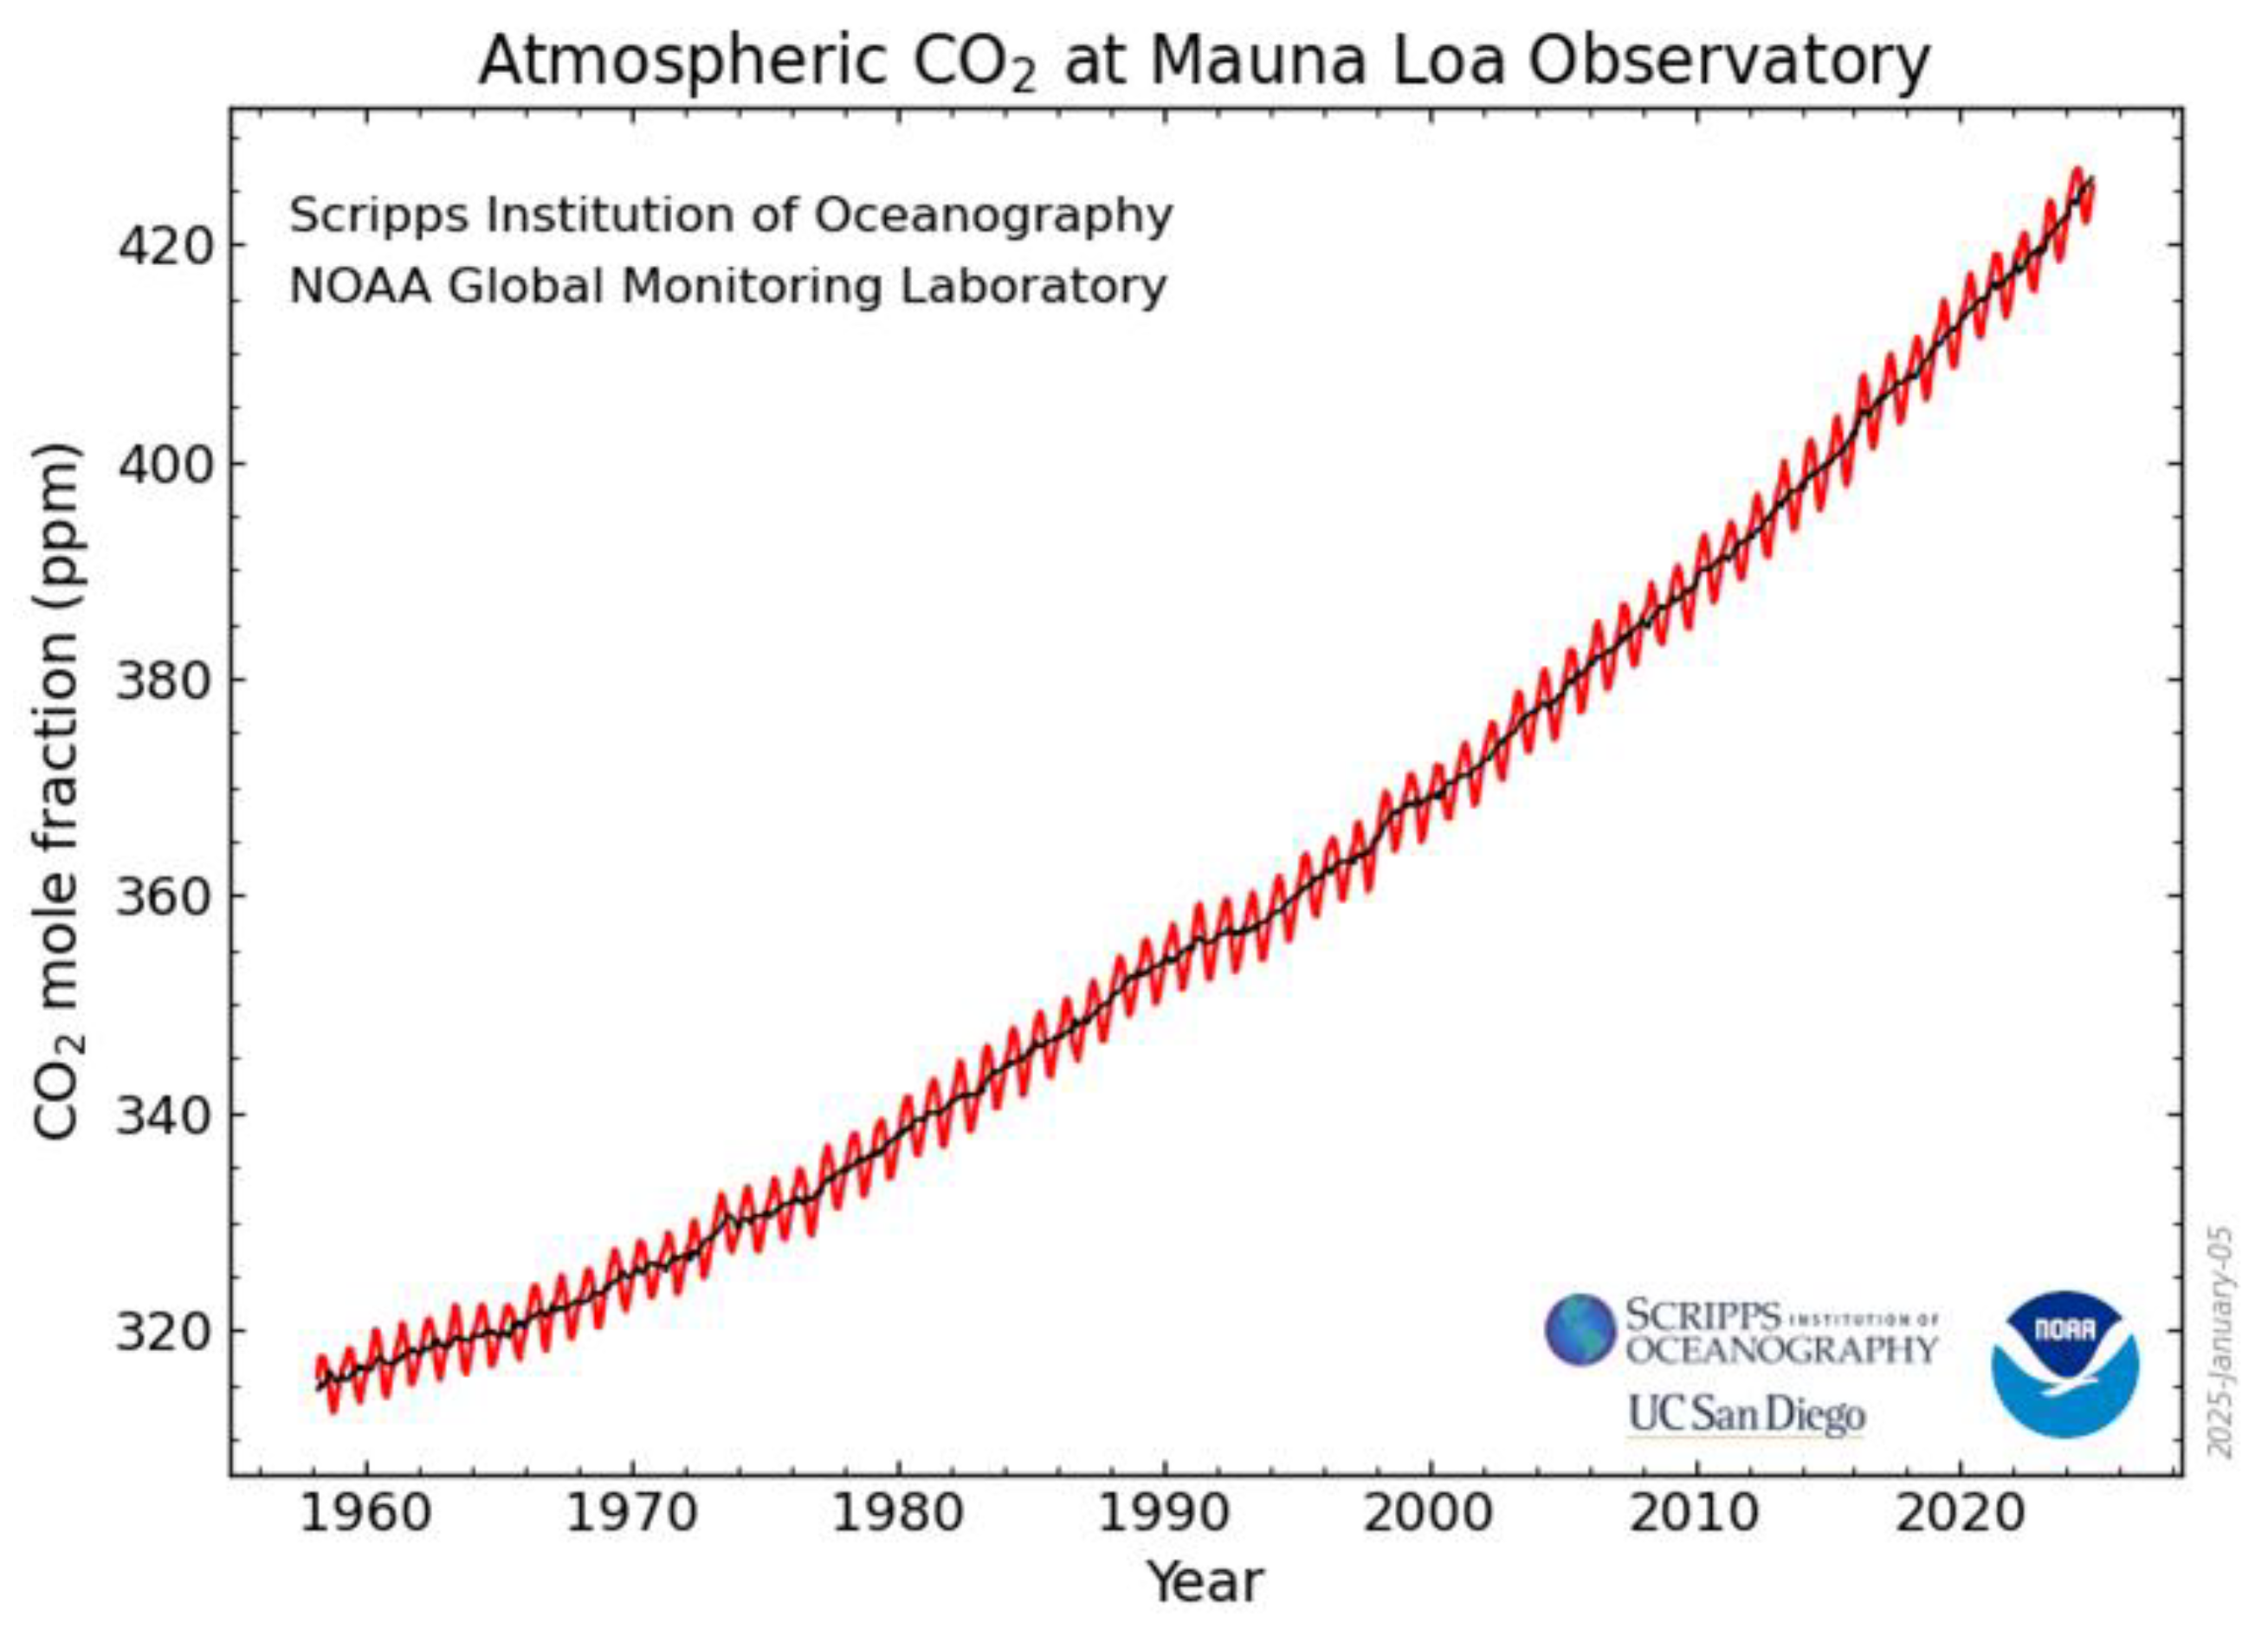
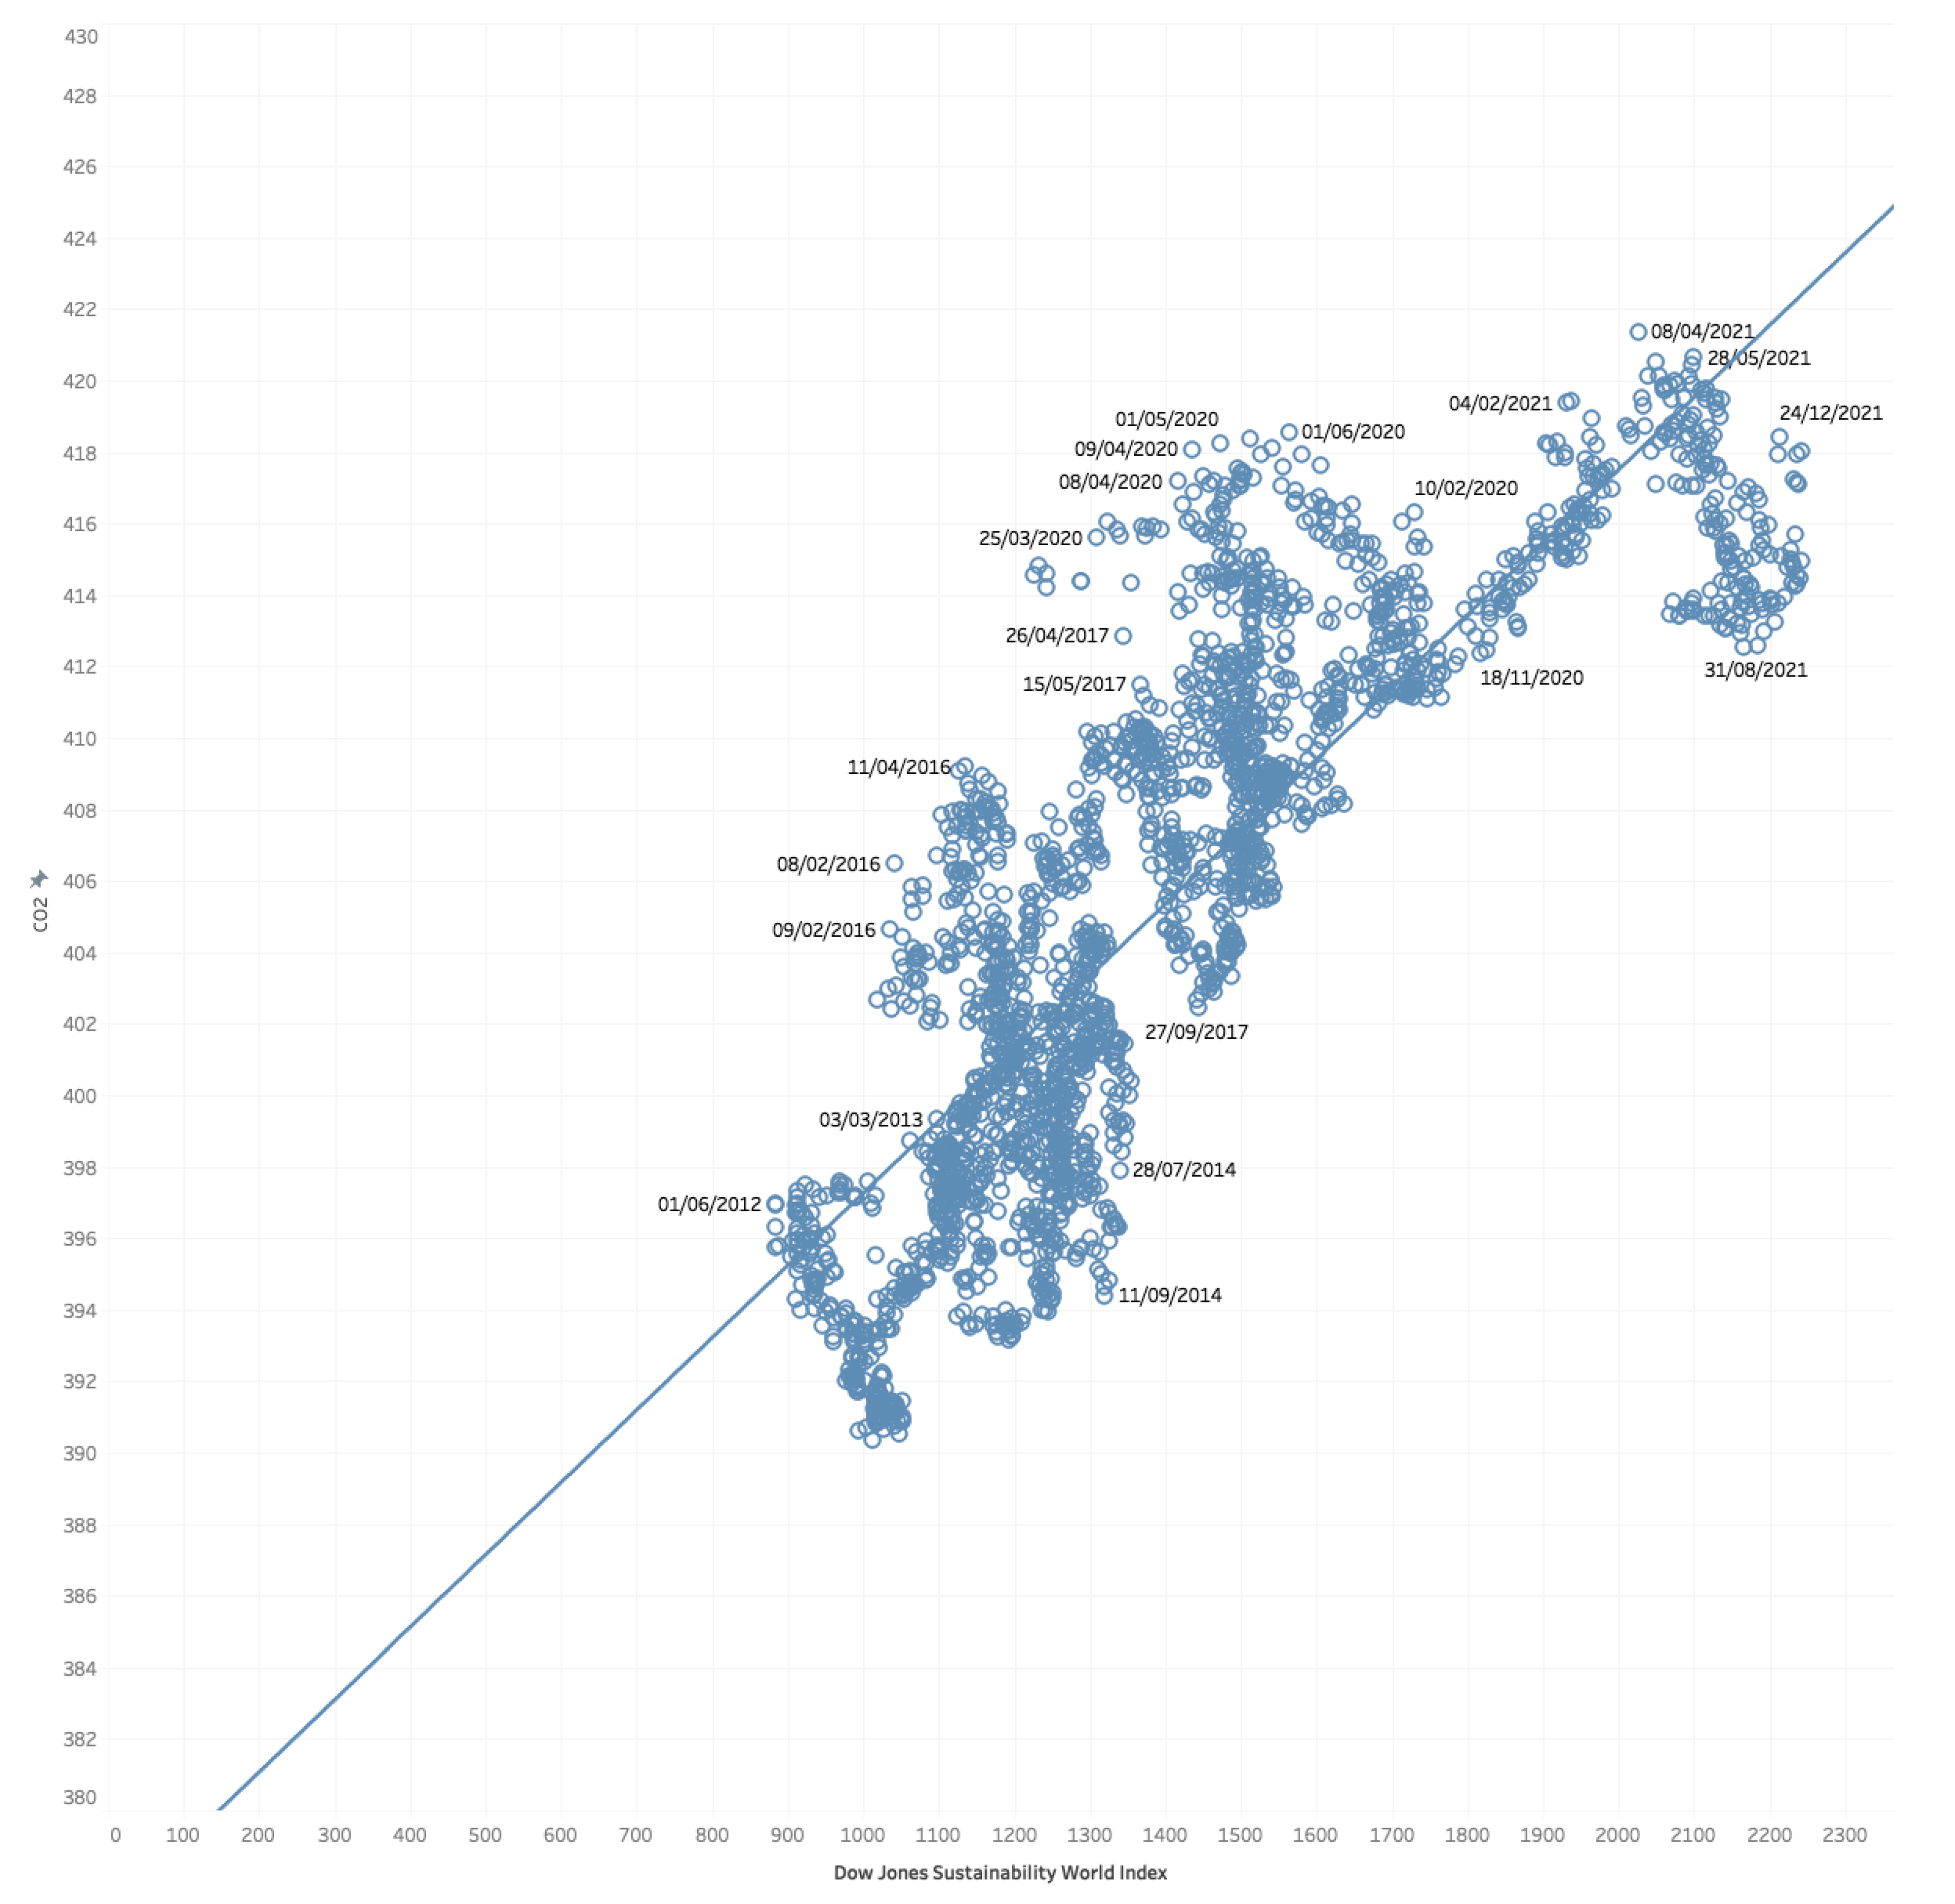
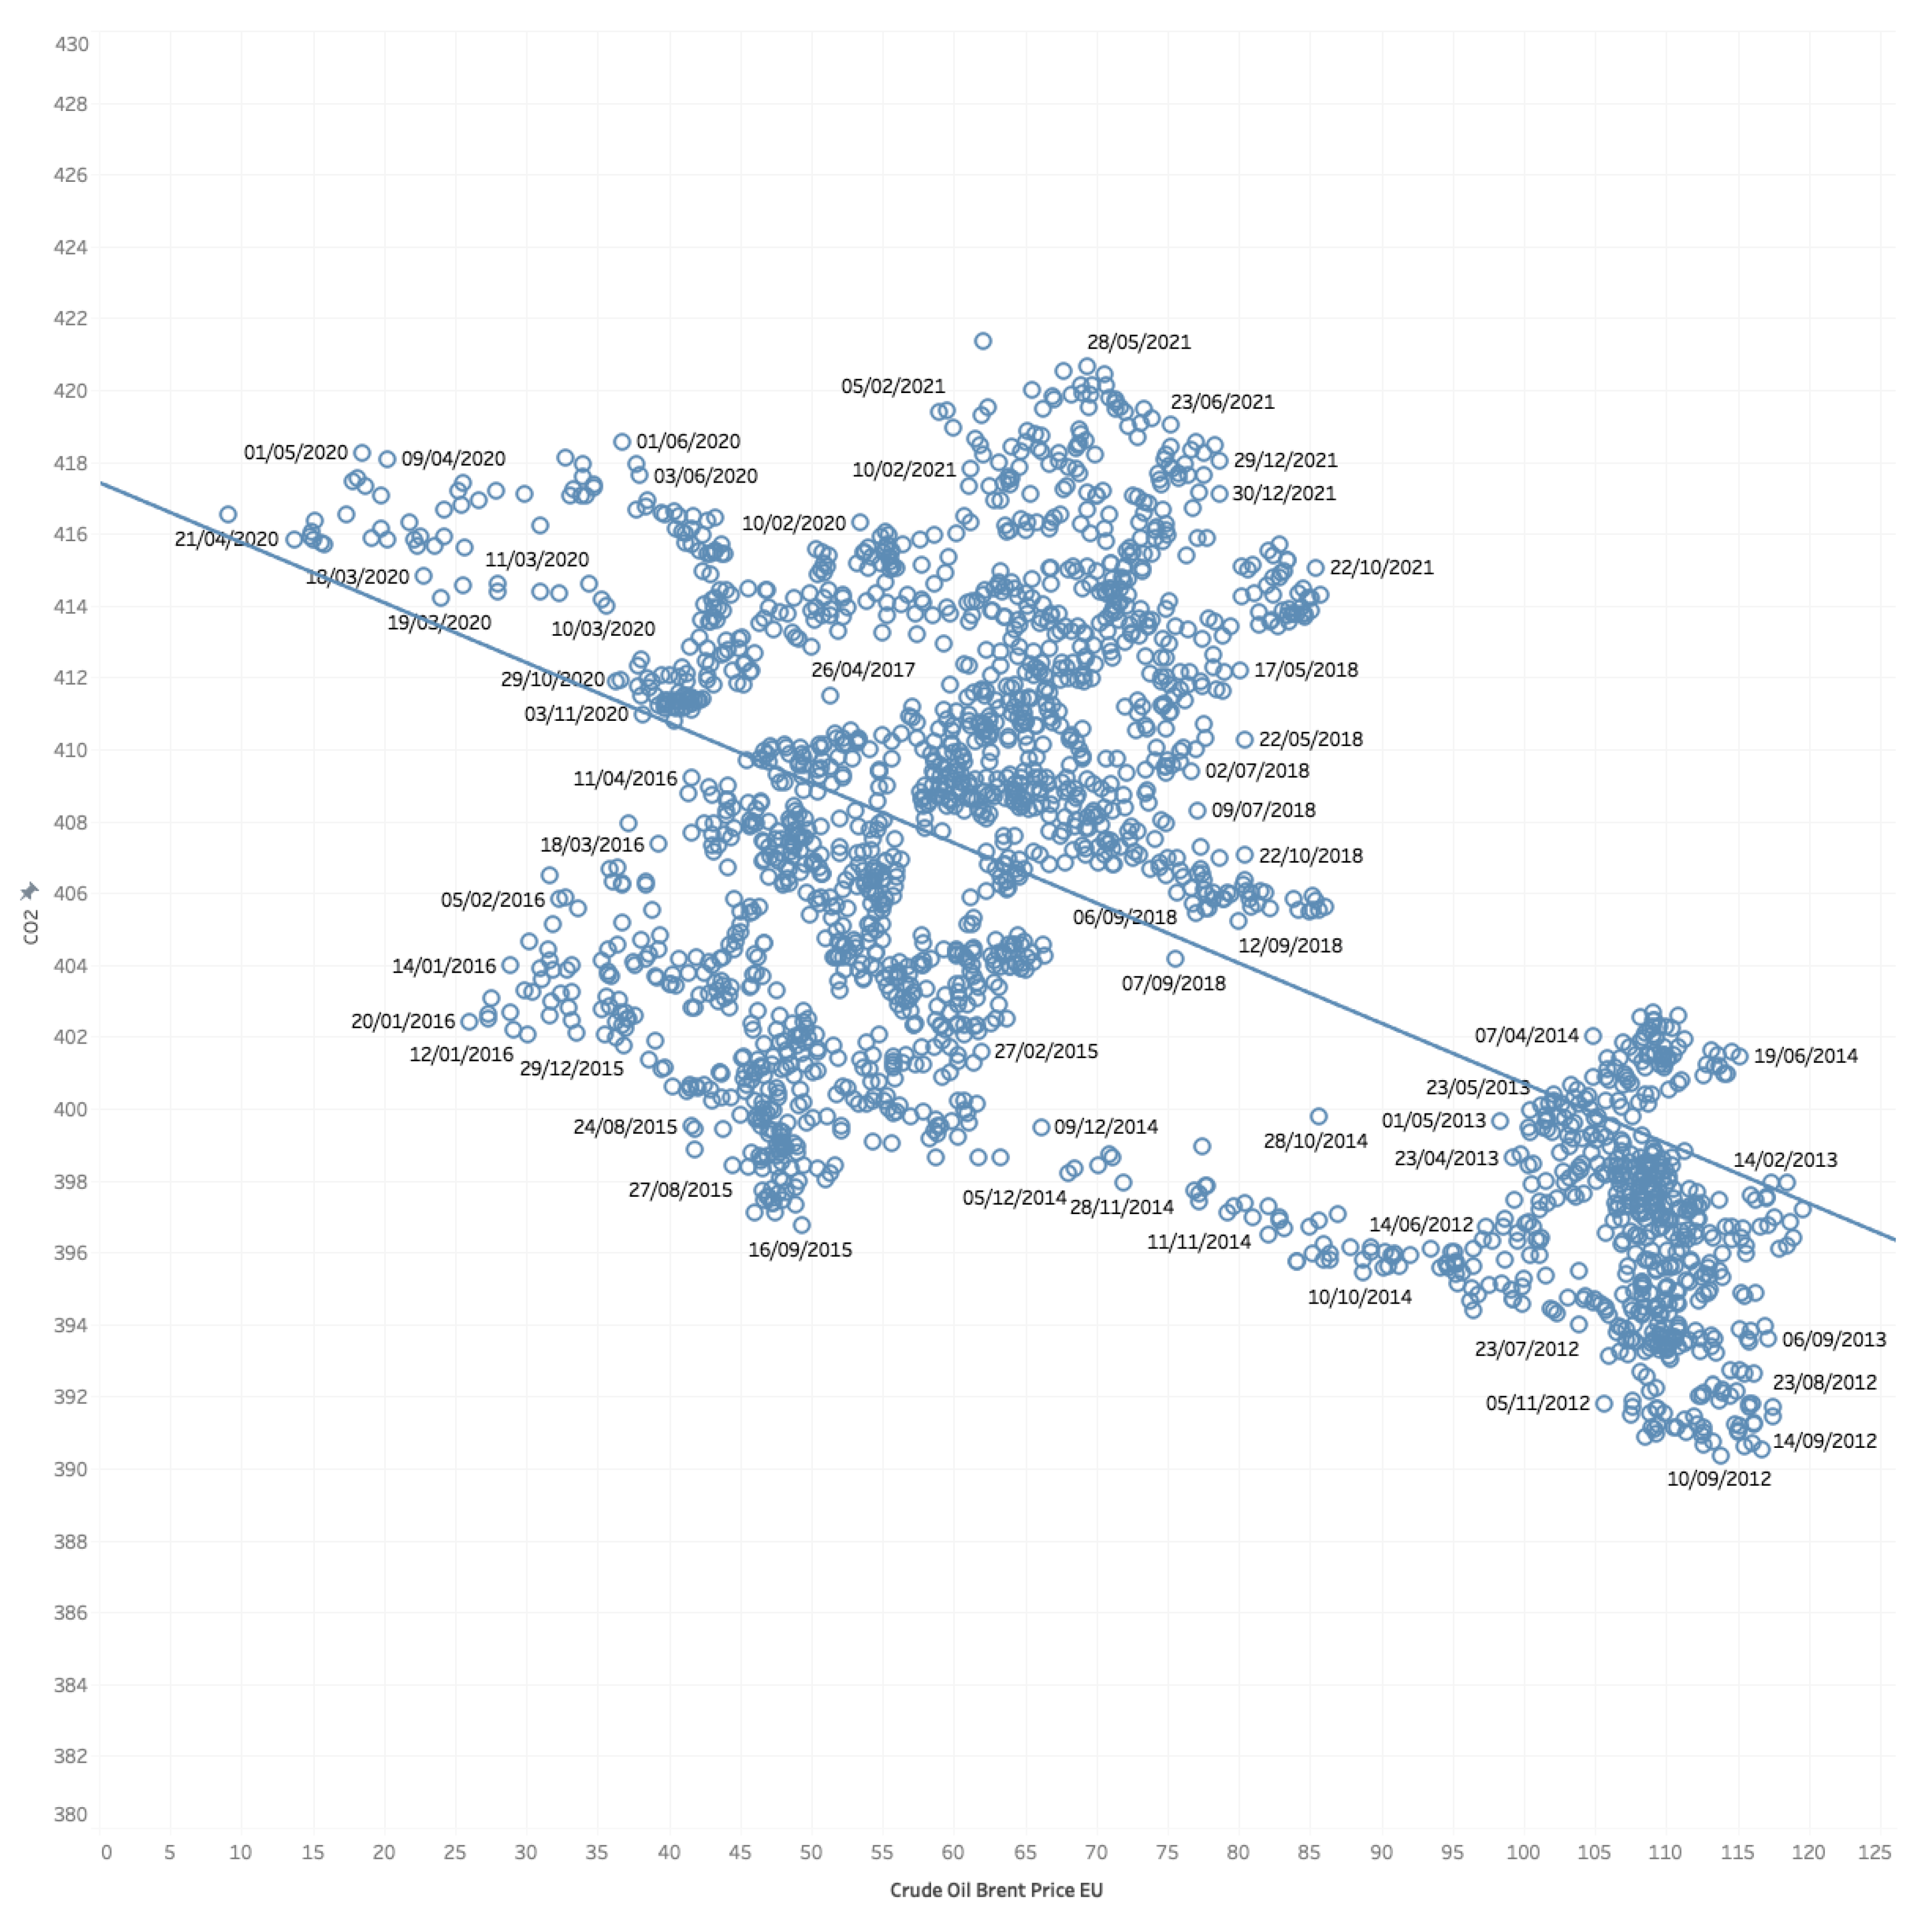


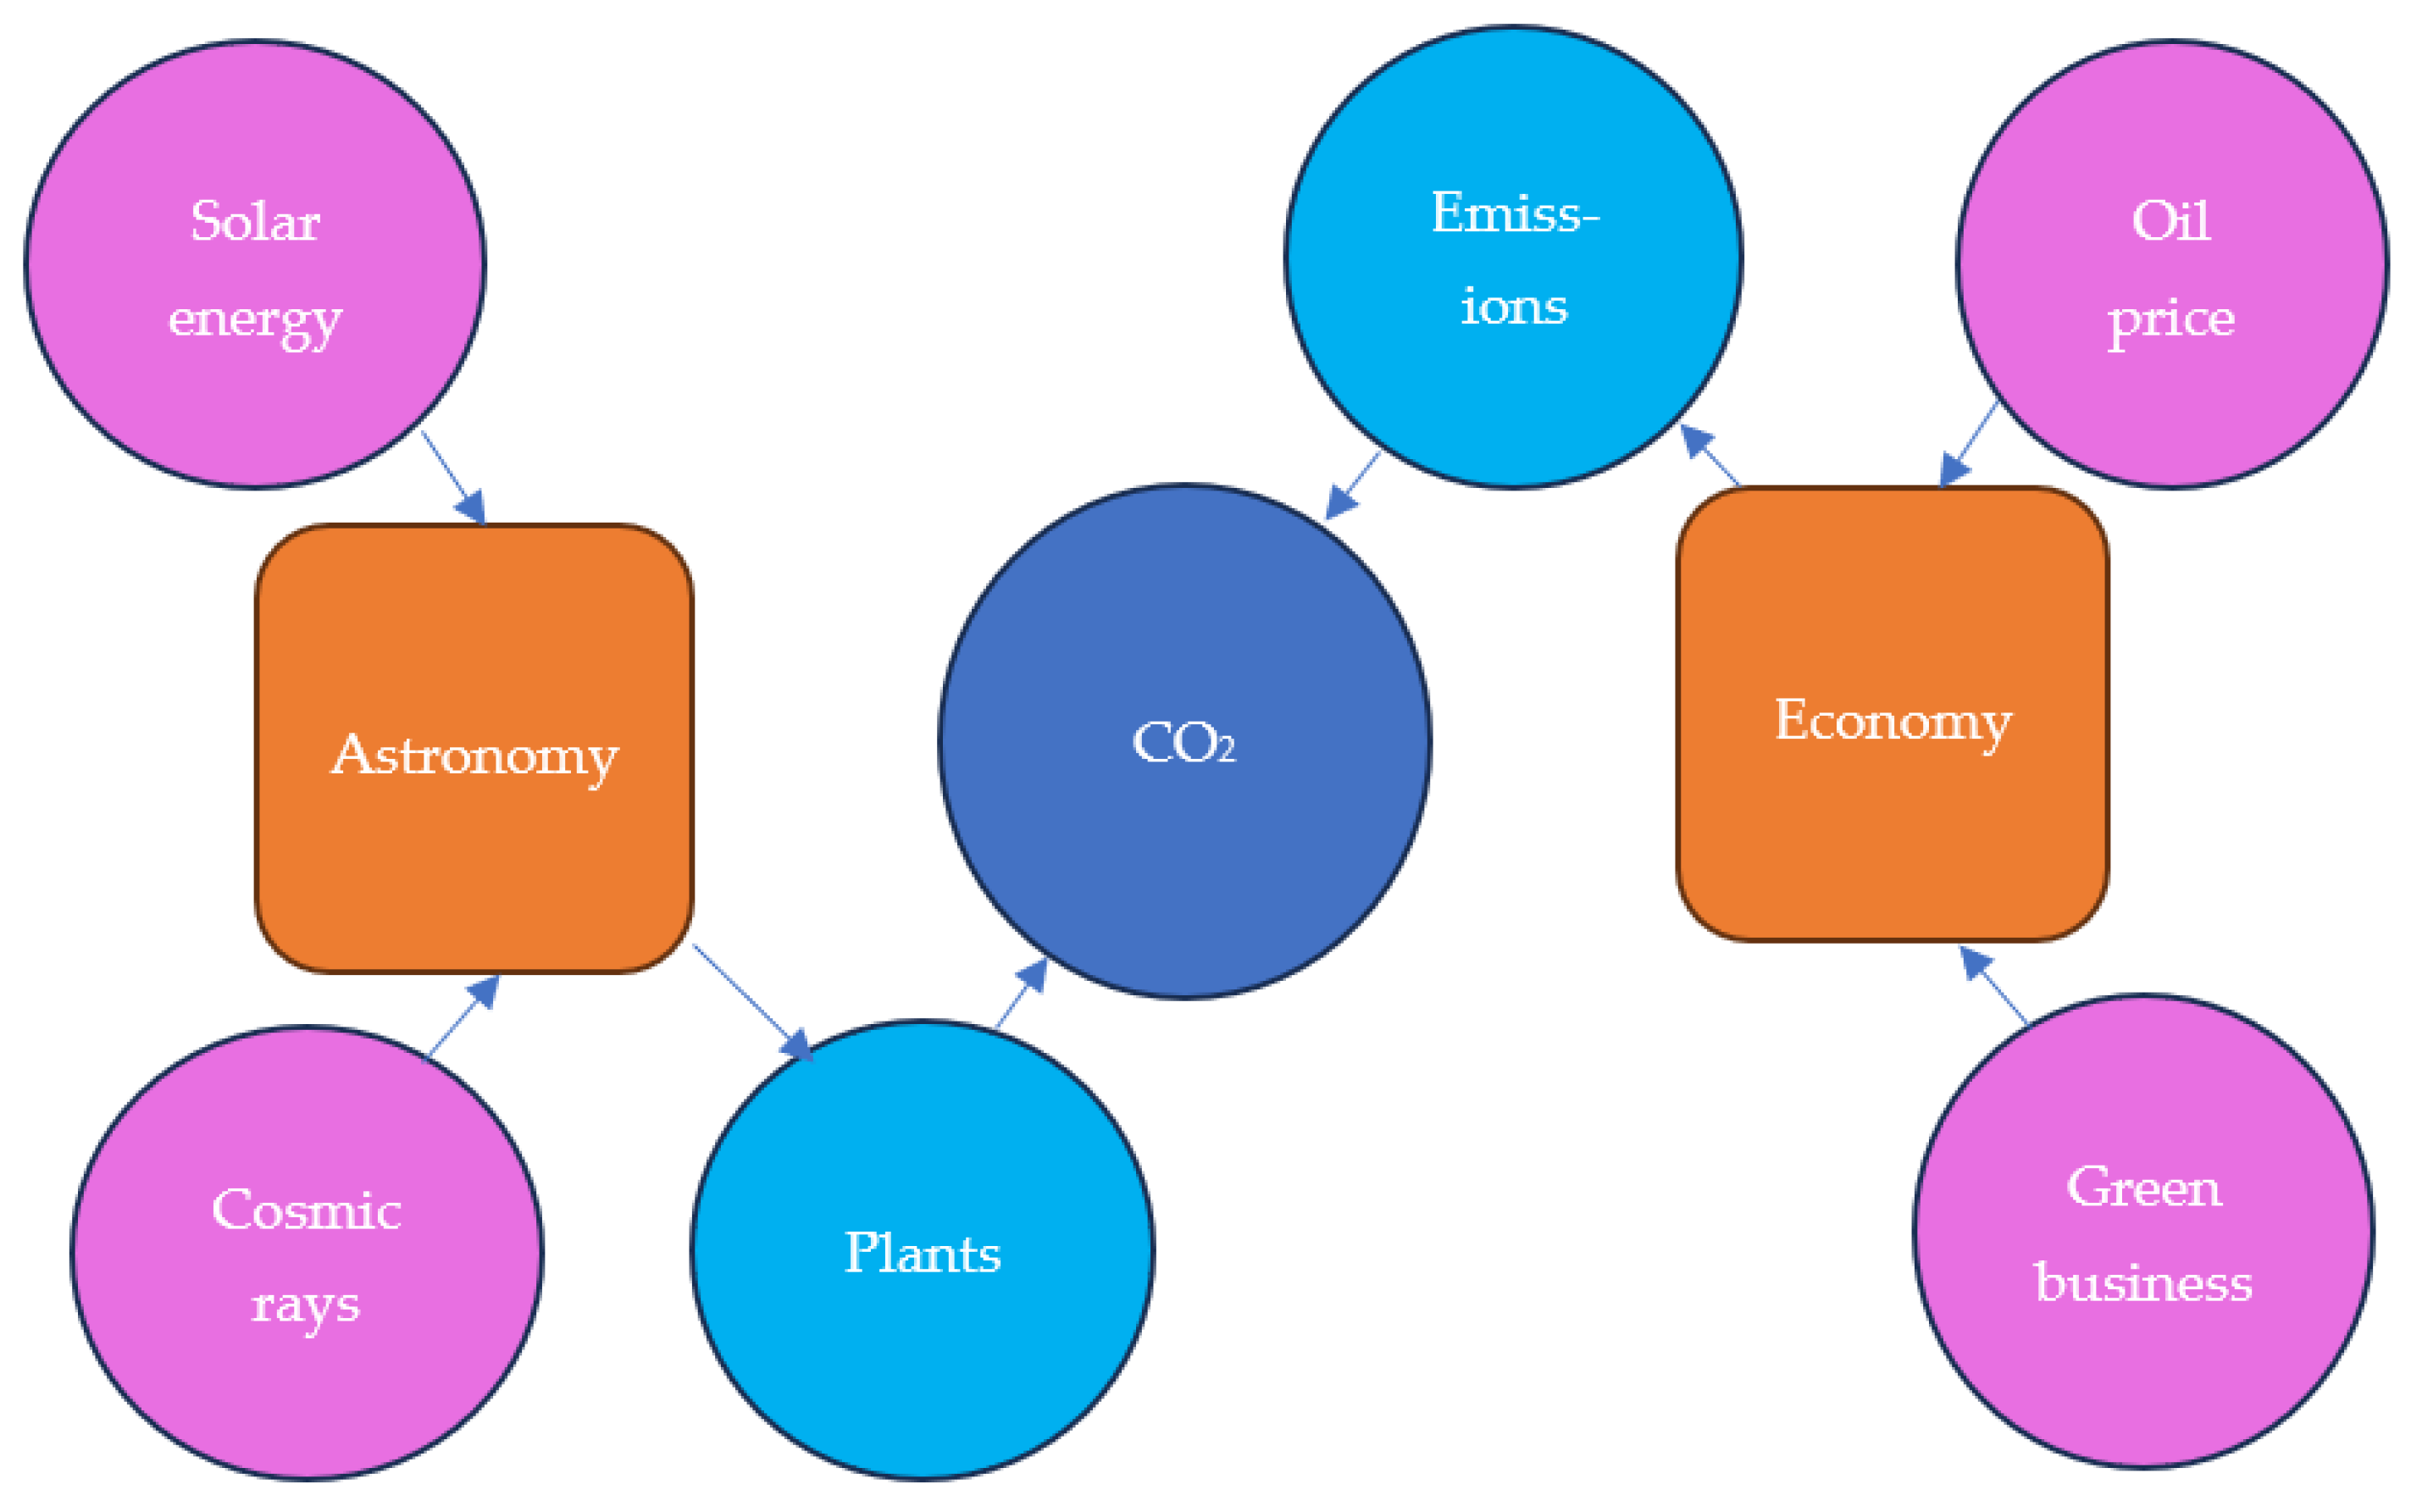


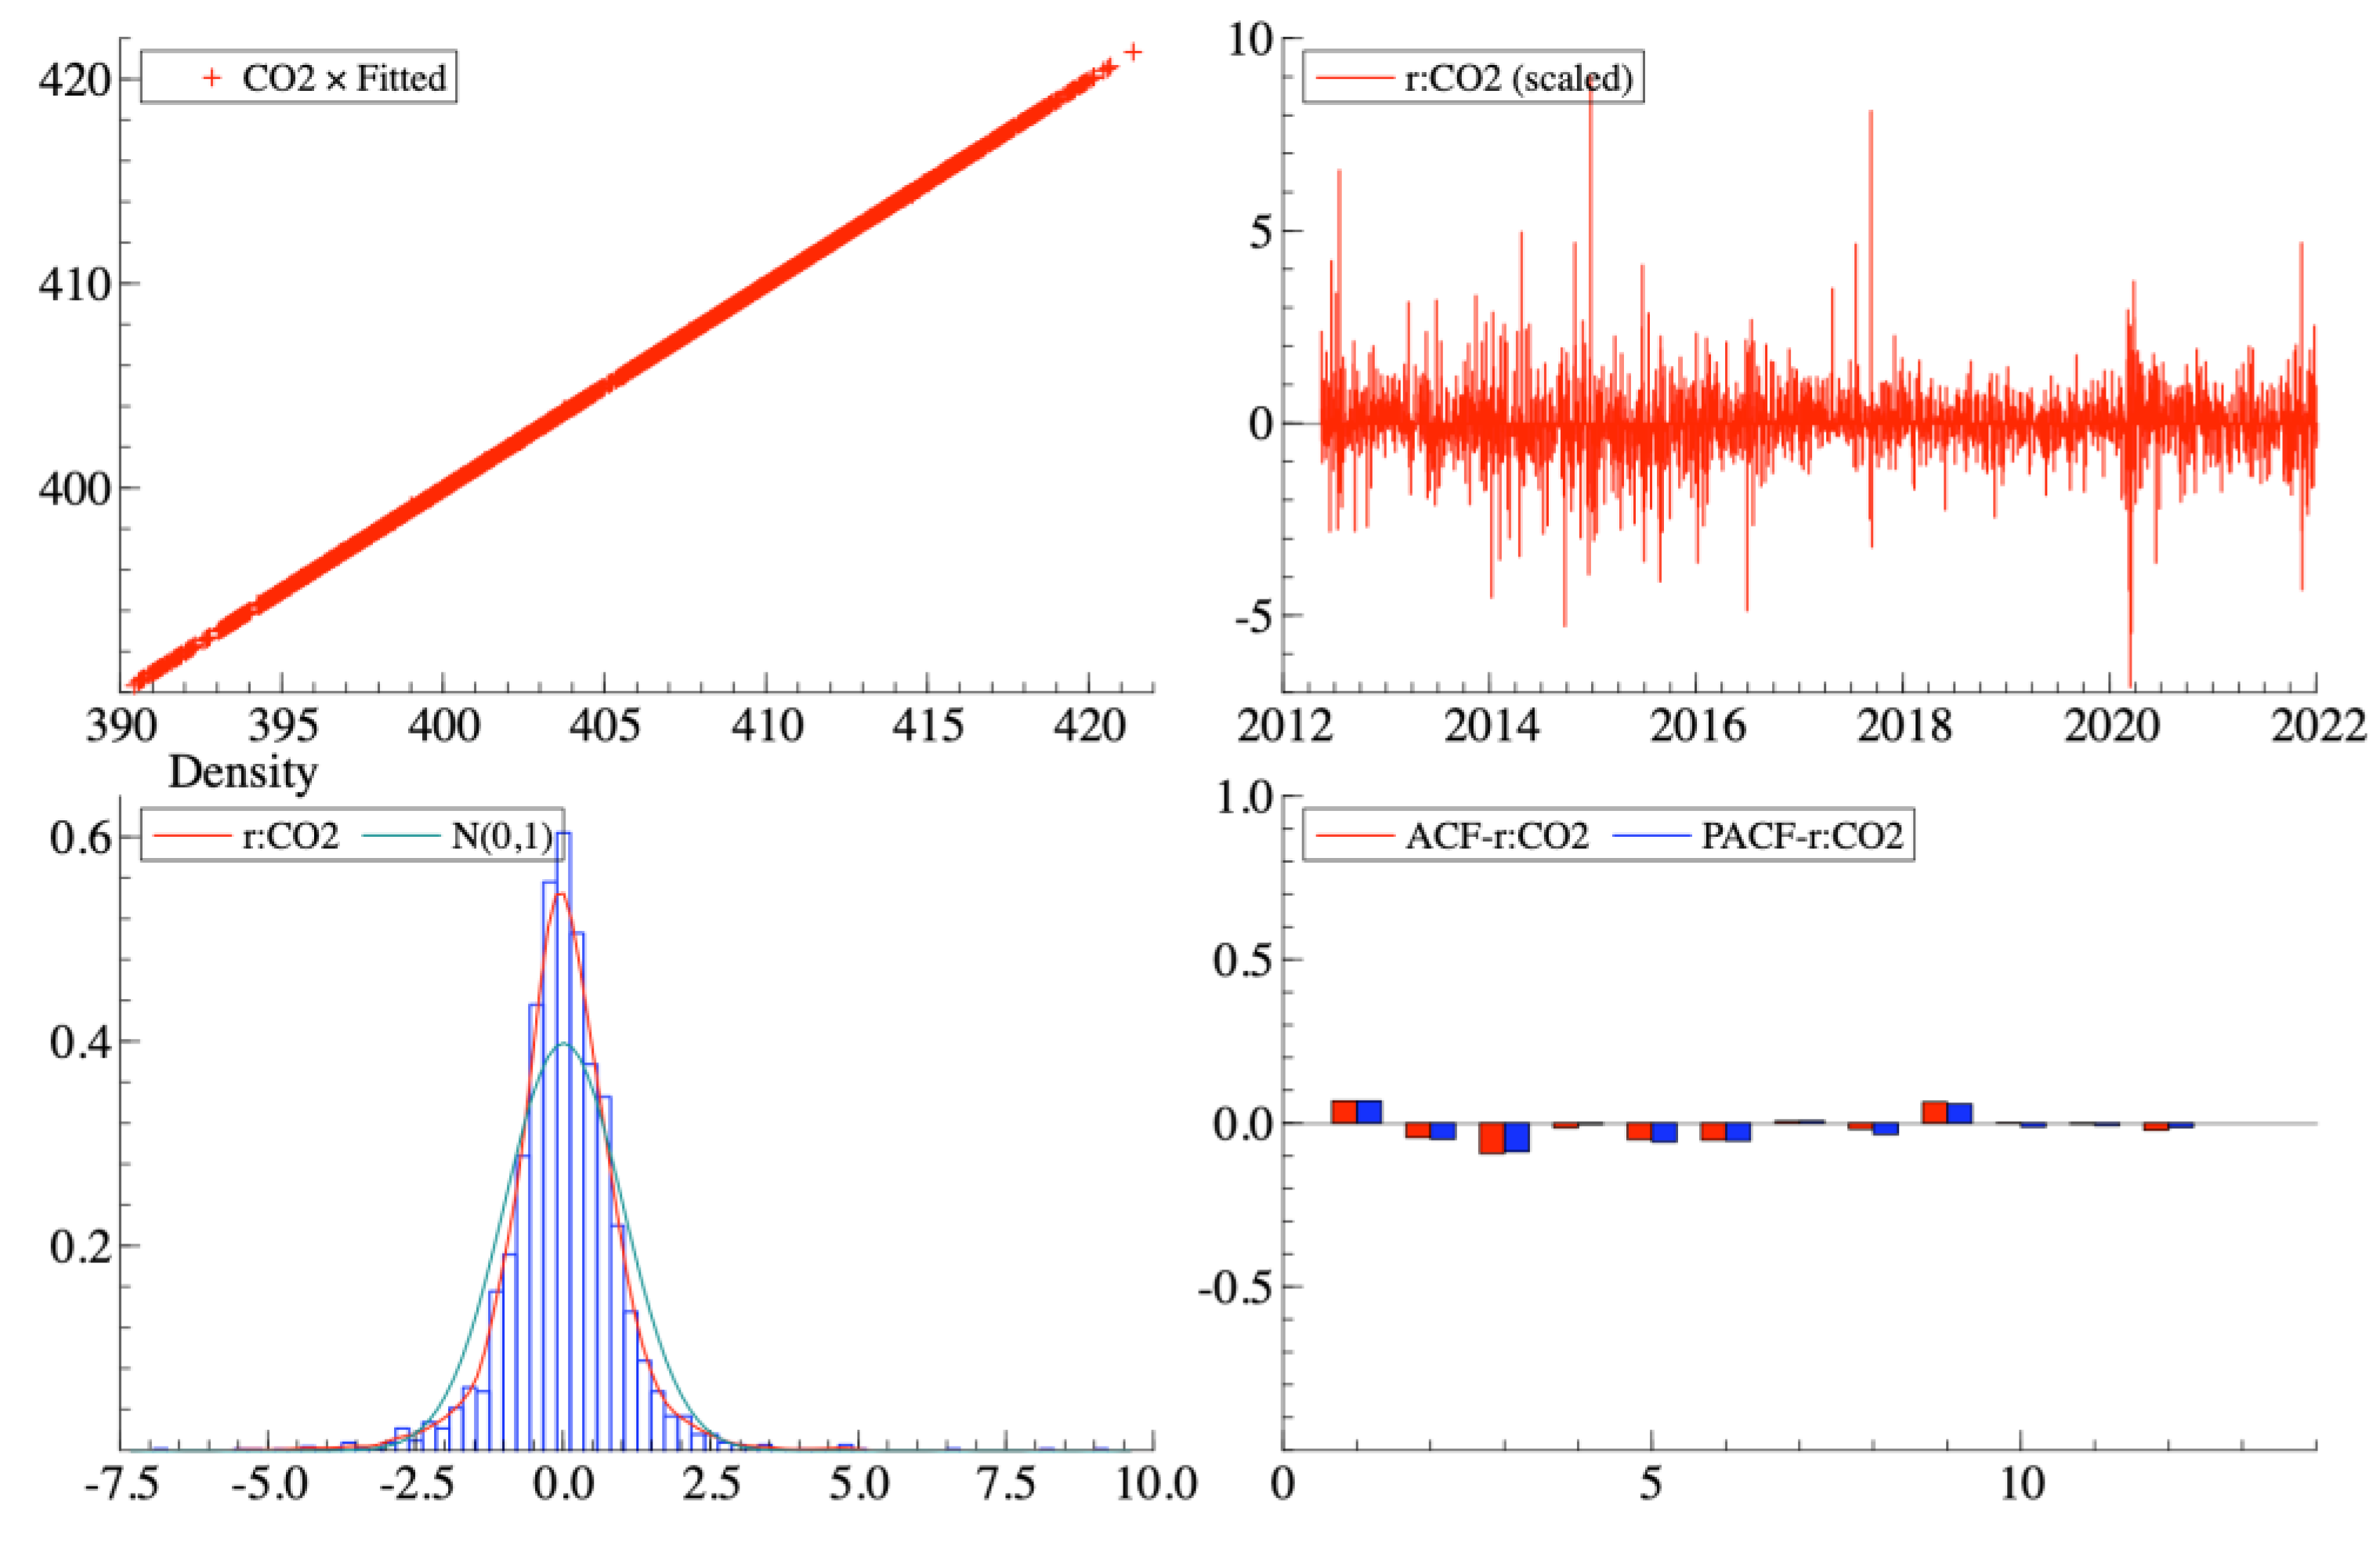
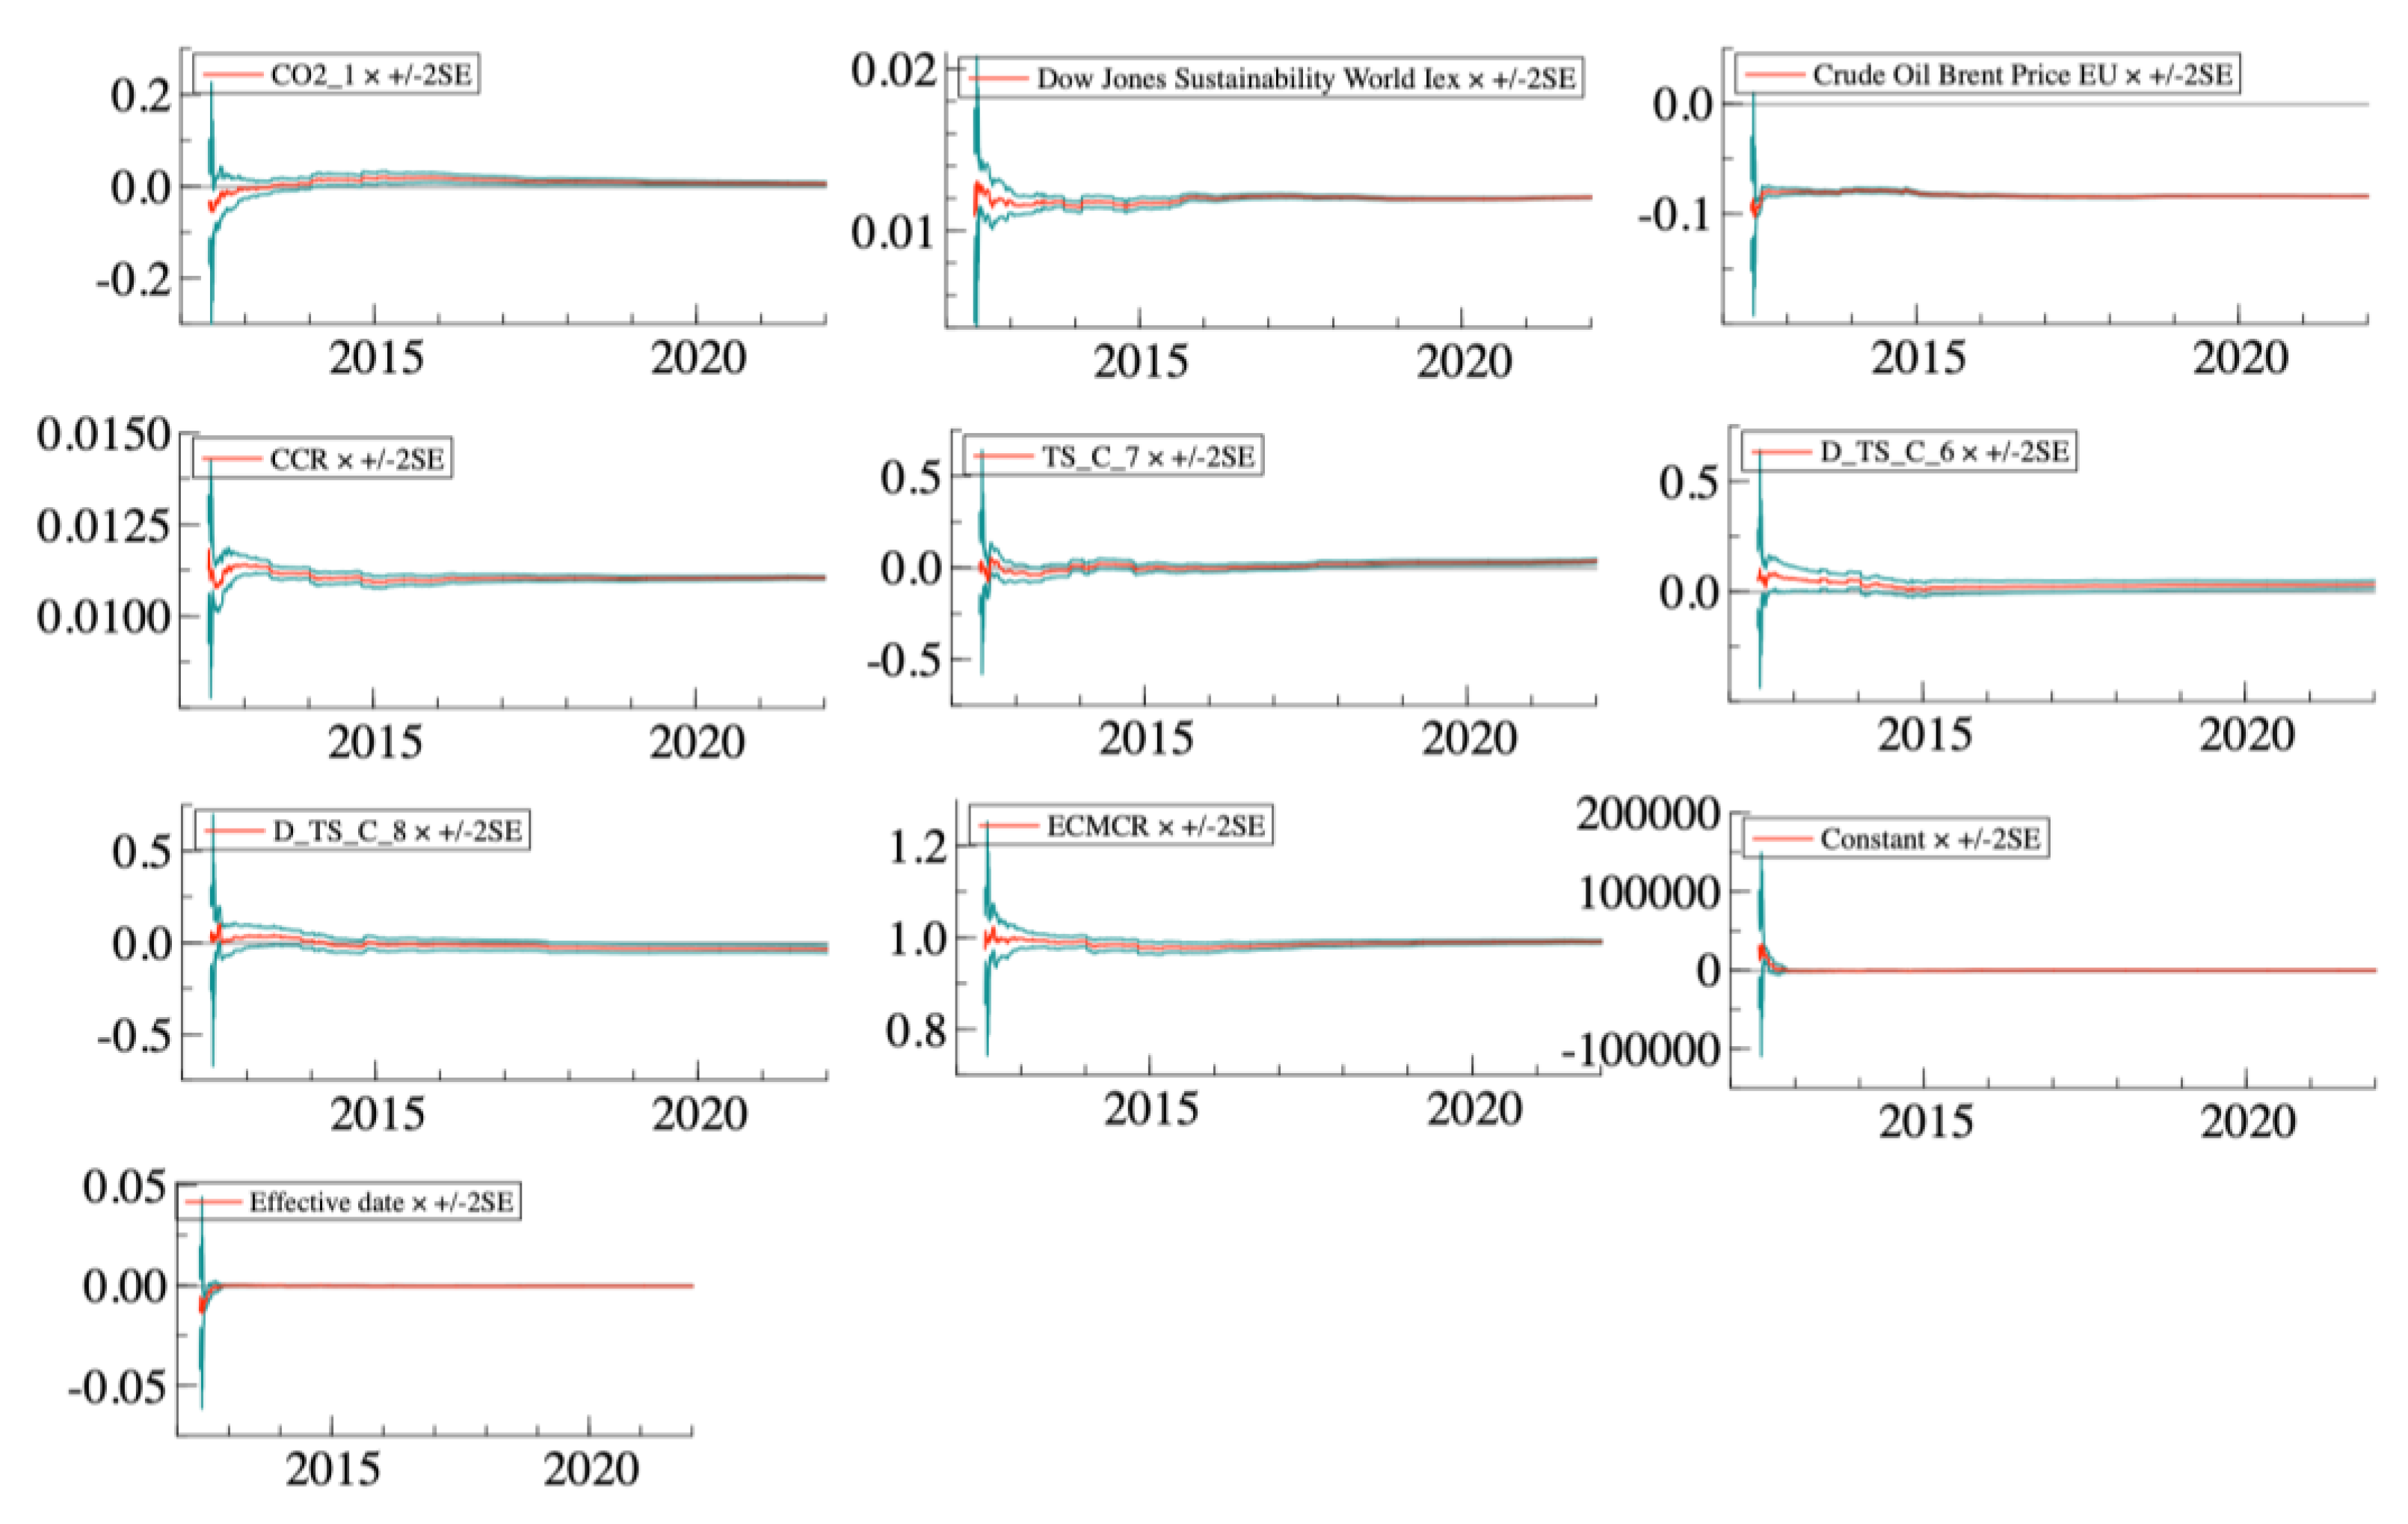
Disclaimer/Publisher’s Note: The statements, opinions and data contained in all publications are solely those of the individual author(s) and contributor(s) and not of MDPI and/or the editor(s). MDPI and/or the editor(s) disclaim responsibility for any injury to people or property resulting from any ideas, methods, instructions or products referred to in the content. |
© 2025 by the authors. Licensee MDPI, Basel, Switzerland. This article is an open access article distributed under the terms and conditions of the Creative Commons Attribution (CC BY) license (https://creativecommons.org/licenses/by/4.0/).