Article

A Muti-Scenario Prediction and Spatiotemporal Analysis of the LUCC and Carbon Storage Response: A Case Study of the Central Shanxi Urban Agglomeration

1
College of Geography and Tourism, Hengyang Normal University, Hengyang 421002, China
2
Hengyang Base of International Centre on Space Technologies for Natural and Cultural Heritage Under the Auspices of UNESCO, Hengyang 421002, China
*
Author to whom correspondence should be addressed.
Sustainability 2025, 17(4), 1532; https://doi.org/10.3390/su17041532
Submission received: 22 December 2024 / Revised: 2 February 2025 / Accepted: 11 February 2025 / Published: 12 February 2025

Abstract

:
Land use and cover change (LUCC) profoundly impacts the carbon cycle and carbon storage. Under the goal of “carbon neutrality”, studying the mechanisms linking LUCC with terrestrial ecosystem carbon storage is of significant importance for ecological protection and regional development. Using the central Shanxi urban agglomeration as a case study, this research employs various quantitative models based on land cover data to analyze changes in LUCC and carbon storage from 2000 to 2035. The study scientifically explores the impact of the spatial and temporal distribution characteristics of LUCC on carbon storage. The study indicates the following: (1) Over the past 20 years, the land types in the central Shanxi urban agglomeration are primarily grassland, cropland, and forest land. The two primary land transformations are the conversion of cropland to grassland and the conversion of grassland to cropland and forest land; (2) The carbon storage in the study area has shown a declining trend over the past two decades. Spatially, this decline exhibits a “two mountains and one valley” distribution pattern influenced by land use types. The reduction of grassland and cropland is the primary reason for the decline in carbon storage; (3) By 2035, under three different scenarios, carbon storage is projected to decrease compared to 2020. Among these, the scenario focused on cropland protection (CP) shows the least decline, while the naturally developing scenario (ND) shows the most significant decline. The research demonstrates that under scenarios of cropland protection and ecological conservation, strategies such as environmental restoration, development of unused land, and reclamation of built-up land for greening significantly enhance regional carbon storage and improve carbon sequestration capacity.

1. Introduction

The terrestrial ecosystem is a major contributor to climate change as a primary worldwide source of carbon [1]. There are various types of terrestrial carbon, including soil organic carbon, which is one of the largest terrestrial carbon reservoirs on Earth [2]; vegetation carbon, which is formed through the fixation of atmospheric carbon via photosynthesis [3]; and litter carbon found in dead plant material on the soil surface [4]. Changes in carbon storage within terrestrial ecosystems are attributed in large part to land use change, which also impacts the composition and functionality of these ecosystems, hence influencing the carbon cycle [5]. However, LUCC is characterized by uncertainty due to the influence of multiple factors. Therefore, in order to objectively comprehend the ways in which human activities affect ecosystem services, the response link between ecosystem carbon storage and LUCC must be quantitatively examined [6]. This analysis is also a prerequisite for the effective management and sustainable development of regional ecosystems, which is critical for mitigating global warming [7].
Currently, the impact of land use on the ability of various ecosystems to store carbon has been the subject of extensive local and international research. On the one hand, scientists have long studied the effects of LUCC on carbon storage in distinct areas. For example, Li et al. [8] focused on the promotion of ecosystem carbon stock by large-scale forest and grassland fallow in Heilongjiang Province, while Setiawan et al. [9] employed an integrated modeling approach to quantitatively study how changes in land use affect carbon stocks in the FMU Ampang Plampang under the trend of forest degradation. However, other researchers have also used a variety of mathematical models to examine how future changes in land use will affect the carbon pool. For instance, Liang et al. [10] evaluated the effects of LUCC on carbon storage in oases under various scenarios using the SD-CLUE-S and InVEST models. Fu et al. [11] quantitatively analyze the links between land usage and future carbon storage by predicting changes in carbon storage using the PLUS model in conjunction with the InVEST model in the Nanchang cities under three distinct scenarios. In summary, existing studies adequately demonstrate that LUCC results in alterations to ecosystem carbon storage. However, from two angles, there are still limits. First, previous research has predominantly emphasized the modifications to carbon storage brought about by LUCC, often neglecting the spatial heterogeneity within regions based on land use intensity and its effects on the storage of carbon in future ecosystems. This oversight limits the examination of carbon storage patterns in ecosystem evolution in space and time. Second, most studies focus on critical ecological conservation areas or ecologically vulnerable regions, such as watersheds, coastal zones, and arid areas [12,13,14]. In contrast, research on urban agglomerations, particularly in underdeveloped areas of central and western China, is relatively scarce. These urban agglomerations not only serve as key areas for reducing regional disparities but also act as essential drivers of national economic development, indicating a need for increased attention to ecosystem protection [15]. The central Shanxi urban agglomeration is a typical case in point.
The central Shanxi urban agglomeration is a core component of Shanxi, serving as an important ecological barrier between the Loess Plateau and the North China Plain. Its carbon sequestration capacity directly impacts regional ecological security. However, as a resource-based urban agglomeration, its urbanization process may prioritize economic benefits, relying excessively on regional resource development and negatively affecting the ecological environment [16]. Consequently, since 2000, Shanxi province has actively promoted ecological restoration projects and policies to promote sustainable ecosystem growth and enhance the ecological environment [17]. Initiatives such as the Grain for Green Program, pilot projects for sustainable coal industry development, and the “Seven Rivers Ecological Restoration Project” have significantly enhanced land carbon sequestration capacity, altered land use patterns, and increased uncertainties in ecosystem carbon sequestration functions. As a developing urban agglomeration, the research on central Shanxi remains scarce domestically and internationally. Only a few researchers have explored the characteristics of land use efficiency’s spatial dispersion, intercity variances, and affecting factors in resource-based cities in Shanxi [18,19]. Researchers have seldom delved deeper into the relationships between LUCC intensity and ecosystem carbon storage in the central Shanxi urban agglomeration. Consequently, this study poses several questions: How do the scale and intensity of LUCC in the central Shanxi urban agglomeration evolve? How do ecosystem carbon storage levels vary across temporal and spatial dimensions? What are the future spatial patterns under various scenarios? And how will land use intensity relate to changes in the carbon pool?
Common methods for detecting LUCC include transfer matrices [20], single dynamic approaches, composite dynamic approaches [21], and intensity analyses [22]. Traditional quantitative methods are limited by the scale of conversion and do not clarify the proportion of different land type conversions, leading to overly simplistic analyses. In response, intensity analysis, as a method for quantifying the severity of land use changes, allows for systematic examination of the processes and states of LUCC through multi-level quantitative analysis. This approach provides a deeper understanding of the processes and causes of LUCC changes from the perspective of change intensity, addressing the shortcomings of previous models [22,23]. Currently, this method has yielded results in areas such as urban expansion [24] and regional comparisons [25]. However, when designing multiple categories and time intervals, the method faces challenges in quickly and intuitively reflecting the scale and stability of the conversion process. Therefore, Deng et al. [26] have optimized current visualization techniques by constructing conversion maps from the perspective of transitions. Field surveys [27], remote sensing inversions [28], and models like CASA [29,30,31] are currently used in theoretical research to explore the mechanisms of carbon balance and the geographical and temporal dynamics of carbon storage from a variety of angles and scales. However, these models exhibit limitations in terms of data availability. In contrast, the InVEST model, with its independent framework, requires less data when integrated with a GIS platform while offering high accuracy, multifunctionality, and stability. It effectively visualizes the distribution of carbon storage in space and its dynamic fluctuations, leading to its widespread application [32,33]. Regarding simulation methods, traditional models like CA-Markov, FLUS, and CLUE-S are characterized by high computational costs and difficulties in quantifying nonlinear factors in land use [34,35]. These models inadequately explain the driving mechanisms behind LUCC. Conversely, the PLUS model calculates the likelihood that various land types will develop, accurately simulating the complex evolution of land categories and addressing the shortcomings of the models above [36,37,38].
Therefore, to address the aforementioned issues, this research relies on land use data and employs intensity analysis methods to graphically analyze the historical patterns of land usage and their spatiotemporal evolution in the central Shanxi urban agglomeration. The InVEST model is utilized to assess the temporal and spatial characteristics of terrestrial ecosystem carbon storage in the study area while combining hot and cold analysis methods to explore the connection between LUCC and ecosystem carbon storage. Building on this study, the PLUS model is applied to forecast land patterns and carbon storage in the central Shanxi urban agglomeration from three angles: scenarios for ecological conservation (EP), cultivated land protection (CP), and natural development (ND). The goal of this research is to offer academic references for the spatial planning and sustainable development of land in the central Shanxi urban agglomeration.

2. Materials and Methods

2.1. Study Area

The central Shanxi urban agglomeration stands in the center of Shanxi (39°39′ N–36°38′ N, 114°9′ E–110°23′ E) and represents an important economic and population hub in northern China. It primarily includes the cities of Jinzhong, Taiyuan, Lüliang, Xinzhou, and Yangquan. It covers an area of 74,100 km2, accounting for 47.3% of the province’s total area (Figure 1). The natural environment is characterized by a temperate continental monsoon climate, featuring four distinct seasons with precipitation concentrated in the summer. Geographically, the region is defined by the Taihang Mountains to the east and the Lüliang Mountains to the west, with the Fenhe Valley situated in between. These unique geographical conditions significantly contribute to the ecological security of the area and support diverse ecosystems. The central Shanxi urban agglomeration possesses abundant plant and animal resources, with forests, wetlands, and grasslands representing the primary types of ecosystems. The wetlands of the Fenhe River basin play a critical role in water conservation, flood regulation, and the maintenance of biodiversity. The region is also home to several rare species, such as the North China leopard, highlighting the importance of ecological conservation [39]. As of the end of 2021, the permanent population in the area reaches 16.13 million, and the local gross domestic product (GDP) amounts to 1.13 trillion yuan, accounting for 46.3% and 50% of the province’s total, respectively. This indicates its significant role in the economic development of Shanxi province and the nation as a whole. Furthermore, the central Shanxi urban agglomeration encompasses numerous development platforms, including 17 national key development zones and 36 provincial development zones, with four designated as national-level development zones. While coal mining, metallurgy, and the chemical industry drive the development of the central Shanxi urban agglomeration, they also contribute to environmental pollution issues [40]. In recent years, with the promotion of the concept of green development, Shanxi province has implemented several ecological restoration initiatives, such as converting farmland back to forest and grassland. These measures result in increased vegetation coverage and significant changes in land use.

2.2. Data Sources

The study’s dataset includes land use data, natural data, and socioeconomic data (Table 1). The land use data is categorized into 6 types based on research requirements: cropland, forest land, grassland, water bodies, built-up, and unused land. Natural condition and socioeconomic data are processed using ArcGIS 10.8, and the PLUS model uses 14 driving factor datasets to predict future land use trends.

2.3. Research Methods

This study is structured into 3 main parts: (1) Intensity analysis methods are employed to analyze LUCC data from 2000 to 2020, focusing on category-level transformation patterns; (2) The PLUS model simulates and predicts land use projections for 2035 using LUCC data and various driving factors, including natural and economic influences; (3) Finally, the relation between present LUCC and carbon storage in the central Shanxi urban agglomeration is revealed by using the InVEST model to assess how LUCC has affected the ecosystem’s ability to store carbon (Figure 2).

2.3.1. The Intensity Analysis

The intensity analysis approach consists of 3 elements: the interval layer, the category layer, and the transition layer. Utilizing the transition matrix, it assesses the spatiotemporal intensity of alterations in land types with the average change intensity. The category layer evaluates the observed fluctuations in land type intensities, either increases or decreases, relative to the annual average change intensity. Meanwhile, the transformation layer offers a closer examination of whether the conversion of various land types into a particular type represents a trend or a deterrent [22].
The examination of land use category hierarchies investigates whether changes in various land types are relatively stable or active. By comparing the average annual decrease intensity L t j , the average annual increase intensity G t j and the average change intensity S t of land types, the activity level of increases or decreases can be assessed; calculations are presented in Equations (1)–(3) [42]. If G t j > S t , an active increase in category j is identified; if G t j S t , the increase in category j is classified as dormant. A similar assessment is applied to the decreases in land types.
S t = j = 1 J j = 1 J C r j j C r j j / T j = 1 J j = 1 J C r j j × 100 %
G t j = i = 1 J C t i j C t j j Y t + 1 Y t i = 1 J C t i j × 100 %
L t i = j = 1 J C t i j C t i i Y t + 1 Y t j = 1 J C t i j × 100 %
The evaluation of land conversion hierarchies analyzes whether the transformation of one land type into another is avoided or favored. The degree of change in land types from one kind to another, denoted as R t i n , as well as the equilibrium conversion intensity W t n , are calculated using Formulas (4) and (5) [42]. If R t i n > W t n , it is concluded that land type i is favored for conversion to land type n ; conversely, if R t i n < W t n , it is concluded that land type i is avoided for conversion to land type n [22].
R t i n = C t i n / Y t + 1 Y t j = 1 J C t i j × 100 %
W t n = i = 1 J C t i n C t n n / Y t + 1 Y t j = 1 J i = 1 J C t i j C t n j × 100 %
The amplitude, intensity, and stability of different transitions cannot be fully and intuitively represented by the original intensity analysis [23]. To describe LUCC, this study makes use of transition diagrams [26]. The patterns of transition between various land types are depicted in Figure 3. The transition is categorized as stable and favorable when the intensity of change from land category I to land type J surpasses the uniform intensity over all time intervals; otherwise, it is categorized as stable and avoided. The land types at the first and last time points are shown in Figure 3 as rows and columns, respectively. The bubbles’ colors show whether the conversion intensity is either greater or less than the consistent intensity, indicating the tendency or avoidance of conversion, while their size reflects the magnitude of the transitions. The stability of the transition process during the full duration is evaluated by laterally comparing the bubble colors.

2.3.2. InVEST Model

Carbon storage plays a crucial role in mitigating climate change by fixing carbon elements in soil and vegetation, thereby regulating atmospheric carbon levels. The InVEST model is currently one of the most widely used models for estimating carbon storage in large-scale ecosystem assessments. In the carbon storage module of the InVEST model, ecosystem carbon storage is divided into four fundamental pools: aboveground biomass carbon (carbon contained in all living plants above the soil), belowground biomass carbon (carbon found in the active root systems of plants), soil carbon (carbon distributed in organic and mineral soils), and dead organic carbon (carbon found in litter and standing or fallen dead wood) [43]. Parameters are shown in Table 2.
C i = C a b o v e + C b e l o w + C s o i l + C d e a d
C t o t a l = i = 1 n C i × A i , i = 1,2 , , n
The fundamental premise of the InVEST model’s carbon storage module is that the carbon density for every form of land cover stays constant. The invariant carbon density values associated with different plant types are then multiplied by their corresponding geographical extents to calculate the carbon storage of regional vegetation. Due to significant variations in carbon density reported by different researchers, carbon density statistics for several land use categories in the central Shanxi urban agglomeration are obtained by reviewing the literature [43,44,45,46] and applying the formula proposed by Alam [47]. The results are presented in Table 3. Because of data limitations, the dead organic matter carbon pool is not taken into account in this study.

2.3.3. PLUS Model

This study intends to utilize the PLUS model as a method for exploring historical land conversion rules and predicting trends of land usage in the future. The PLUS model comprises two components: the land expansion analysis strategy (LEAS) and the cellular automata model based on multitype random patch seeds (CARS) [48]. The model simulates diverse land use categories over several scenarios using Markov chain or linear regression techniques, and it fully reflects the dynamic influences of multiple driving variables on land use change.
Based on land use data from 2005 and 2020, with a 15-year interval, the current land use status of the central Shanxi urban agglomeration is simulated for 2035. By utilizing the land expansion analysis strategy (LEAS) module within the PLUS model, the probabilities of evolution for various land use types are obtained. The Markov chain method is then applied to calculate the projected land use demand for 2035. The automatic random seed (ARS) module is then used to create several scenarios for 2035 by combining the 2020 land use data with the previously determined development probability (Table 4). The transition cost matrix is modified in light of the observed shifts in land use types in the central Shanxi urban agglomeration between 2000 and 2020 in order to improve the accuracy of these projections (Table 5). Moreover, neighborhood weights are established as measures of the degree of expansion for various land use classifications. These neighborhood weights vary from 0 to 1, where more growth potential is indicated by numbers nearer 1. Furthermore, scenarios for natural development, cultivated land protection, and ecological conservation are established. The predicted results are compared with the actual conditions of 2020 to validate the simulation accuracy. The Kappa coefficient is 0.74, and the FOM coefficient is 0.17, both meeting the accuracy requirements, indicating that the generated results are relatively reliable.

2.3.4. Spatial Correlation Analysis

This study employs Moran’s I index to investigate the spatial clustering characteristics of carbon storage in the study area projected for 2035. When the value of Moran’s I index falls within the range of (0, 1), it indicates a positive spatial autocorrelation among geographic elements, demonstrating significant clustering. Conversely, a value within the range of (−1, 0) suggests a negative spatial autocorrelation, characterized by a dispersed pattern [50]. The Getis-Ord Gi* index is utilized to measure the aggregation of high and low carbon storage values in local spatial contexts, revealing cold spots and hotspots within the spatial distribution [51].

3. Results

3.1. LUCC Structure Analysis

Figure 4 illustrates the spatial–temporal distribution and land use framework in the research region between 2000 and 2020. Cropland is mainly found in flat plains and basins, such as the Xinding and Taiyuan Basins, in terms of spatial distribution. These regions benefit from favorable climatic conditions, water resources, and agricultural infrastructure, establishing them as significant food production bases. In contrast, forest land is predominantly found in the highlands and steep regions, such as the Lüliang Mountains and the Taihang Mountains. These areas are unsuitable for cultivation but favorable for afforestation, which aids in water and soil conservation and prevents soil erosion. Grassland is mainly concentrated in semiarid regions or mountainous areas, such as the Xinding Basin, where precipitation is relatively low. Water bodies are dispersed but are primarily located in low-lying areas between urban centers traversed by rivers, such as the Fen River and the Hutuo River. Densely populated areas surrounding the Taiyuan Basin and the Xinding Basin are the primary regions for built-up land.
In terms of land use structure, the greatest land type from 2000 to 2020 is grassland, with cropland coming in second. Approximately 70% of the research region is made up of these two land types together, suggesting a wide distribution of biological resources and advantageous natural endowments. During the previous two decades, the area proportions of various terrain types have evolved somewhat gradually. The most significant decline has been in cropland, which has gone from 31.31% in 2000 to 27.07% in 2020. Additionally, grassland fell somewhat from 41.69% to 41.05%, which may have been caused by policies encouraging the reclamation of cropland for forestry and faster urbanization. On the other hand, government-led ecological restoration initiatives in environmentally sensitive regions, like the Taihang and Lüliang Mountains, have raised the percentage of forest land from 24.36% to 27.45%.

3.2. Detection of LUCC Size and Intensity

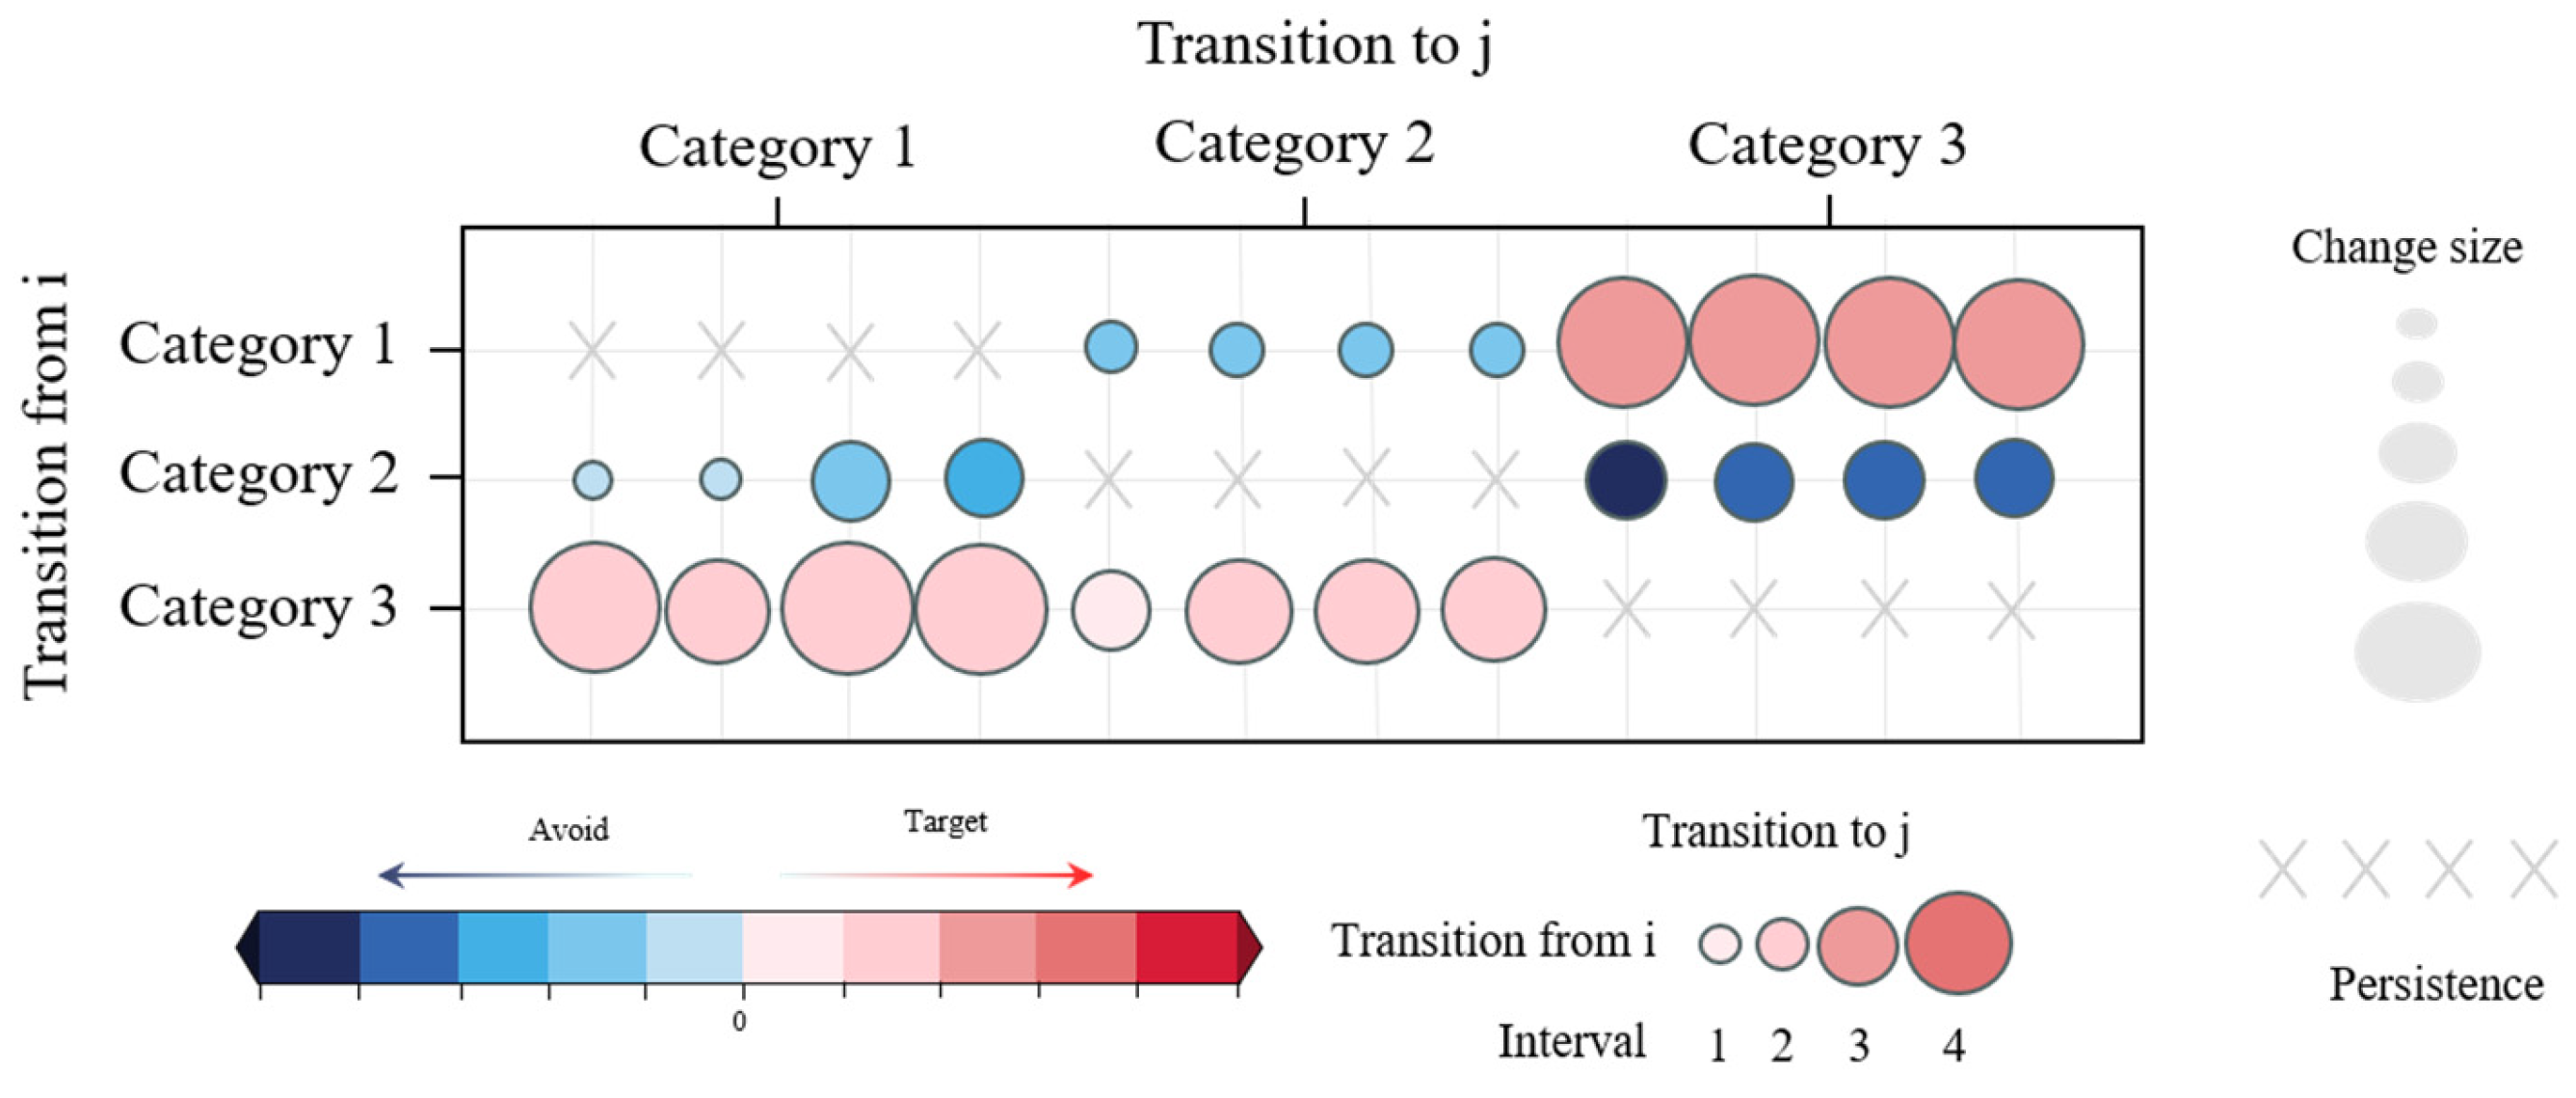
3.2.1. Change Detection at Category Level

Figure 5 illustrates the changes in various land types over four time intervals. The red dashed line represents the average annual change intensity for each interval. If the change intensity of a category exceeds the average annual change intensity, this indicates that the annual change for that category is active; conversely, a lower change intensity suggests a dormant status for that land type.
Overall, during 2000 and 2020, the decrease in the intensity of cropland exceeds its increased intensity, remaining above the average annual change intensity. This trend reflects an active decline in cropland throughout the study period, primarily associated with policies promoting the return of cropland to forest lands and grasslands, as well as urban expansion. In contrast, both the increase and decrease intensities of forest land over the 20 years remain below the average annual change intensity; however, the increased intensity exceeds the decreased intensity, indicating that the increase in forest land remains relatively stable and dormant.
From 2000 to 2005, the increased intensity of grassland reaches 1.79%, surpassing the decreased intensity of 1.54%, demonstrating an active growth state. From 2005 to 2010, grassland experienced a dormant decrease, while the increase remains active, maintaining a trend consistent with the previous period. Perhaps this has to do with the policies for returning cropland to grassland and increased precipitation. However, during the period from 2010 to 2020, government infrastructure development encroaches on some grassland, and the reduction in intensity rises due to factors such as drought, leading to a shift towards an active decrease state for grassland.
The increased intensity of built-up land throughout the study period consistently exceeds the average level, rising from 2.78% between 2000 and 2005 to a peak of 2.89% from 2005 to 2010, before gradually declining to 1.68% from 2015 to 2020. This trend may be attributed to the rapid urbanization, accelerated industrialization, and policy support between 2000 and 2010, which significantly increased land for construction in the central Shanxi urban agglomeration. In contrast, the slowing of the increase in built-up land from 2010 to 2020 can be explained by multiple factors, including a decrease in economic growth rate, strengthened ecological protection, adjustments in land use policies, and a stabilization of the urbanization process.

3.2.2. LUCC Conversion Mapping Analysis

Figure 6 illustrates the LUCC transition patterns throughout the entire study period. The new transition maps represent the intensity and area of land conversion using the color and size of bubbles. By examining the color consistency horizontally, stable characteristics can be identified.
As shown in Figure 6, from 2000 to 2020, cropland demonstrates a stable trend of conversion to grassland, water bodies, and built-up land, with the largest conversion area observed towards grassland. Forest land maintains stability, avoiding conversion to other land types, and the main driver of increases in forest land is grassland. Grassland exhibits a consistent tendency for conversion to cropland and forest land while showing limited conversion to water bodies and built-up land. Regarding the sources of built-up land, cropland, water bodies, and unused land contribute to urban expansion, with cropland having the largest share.

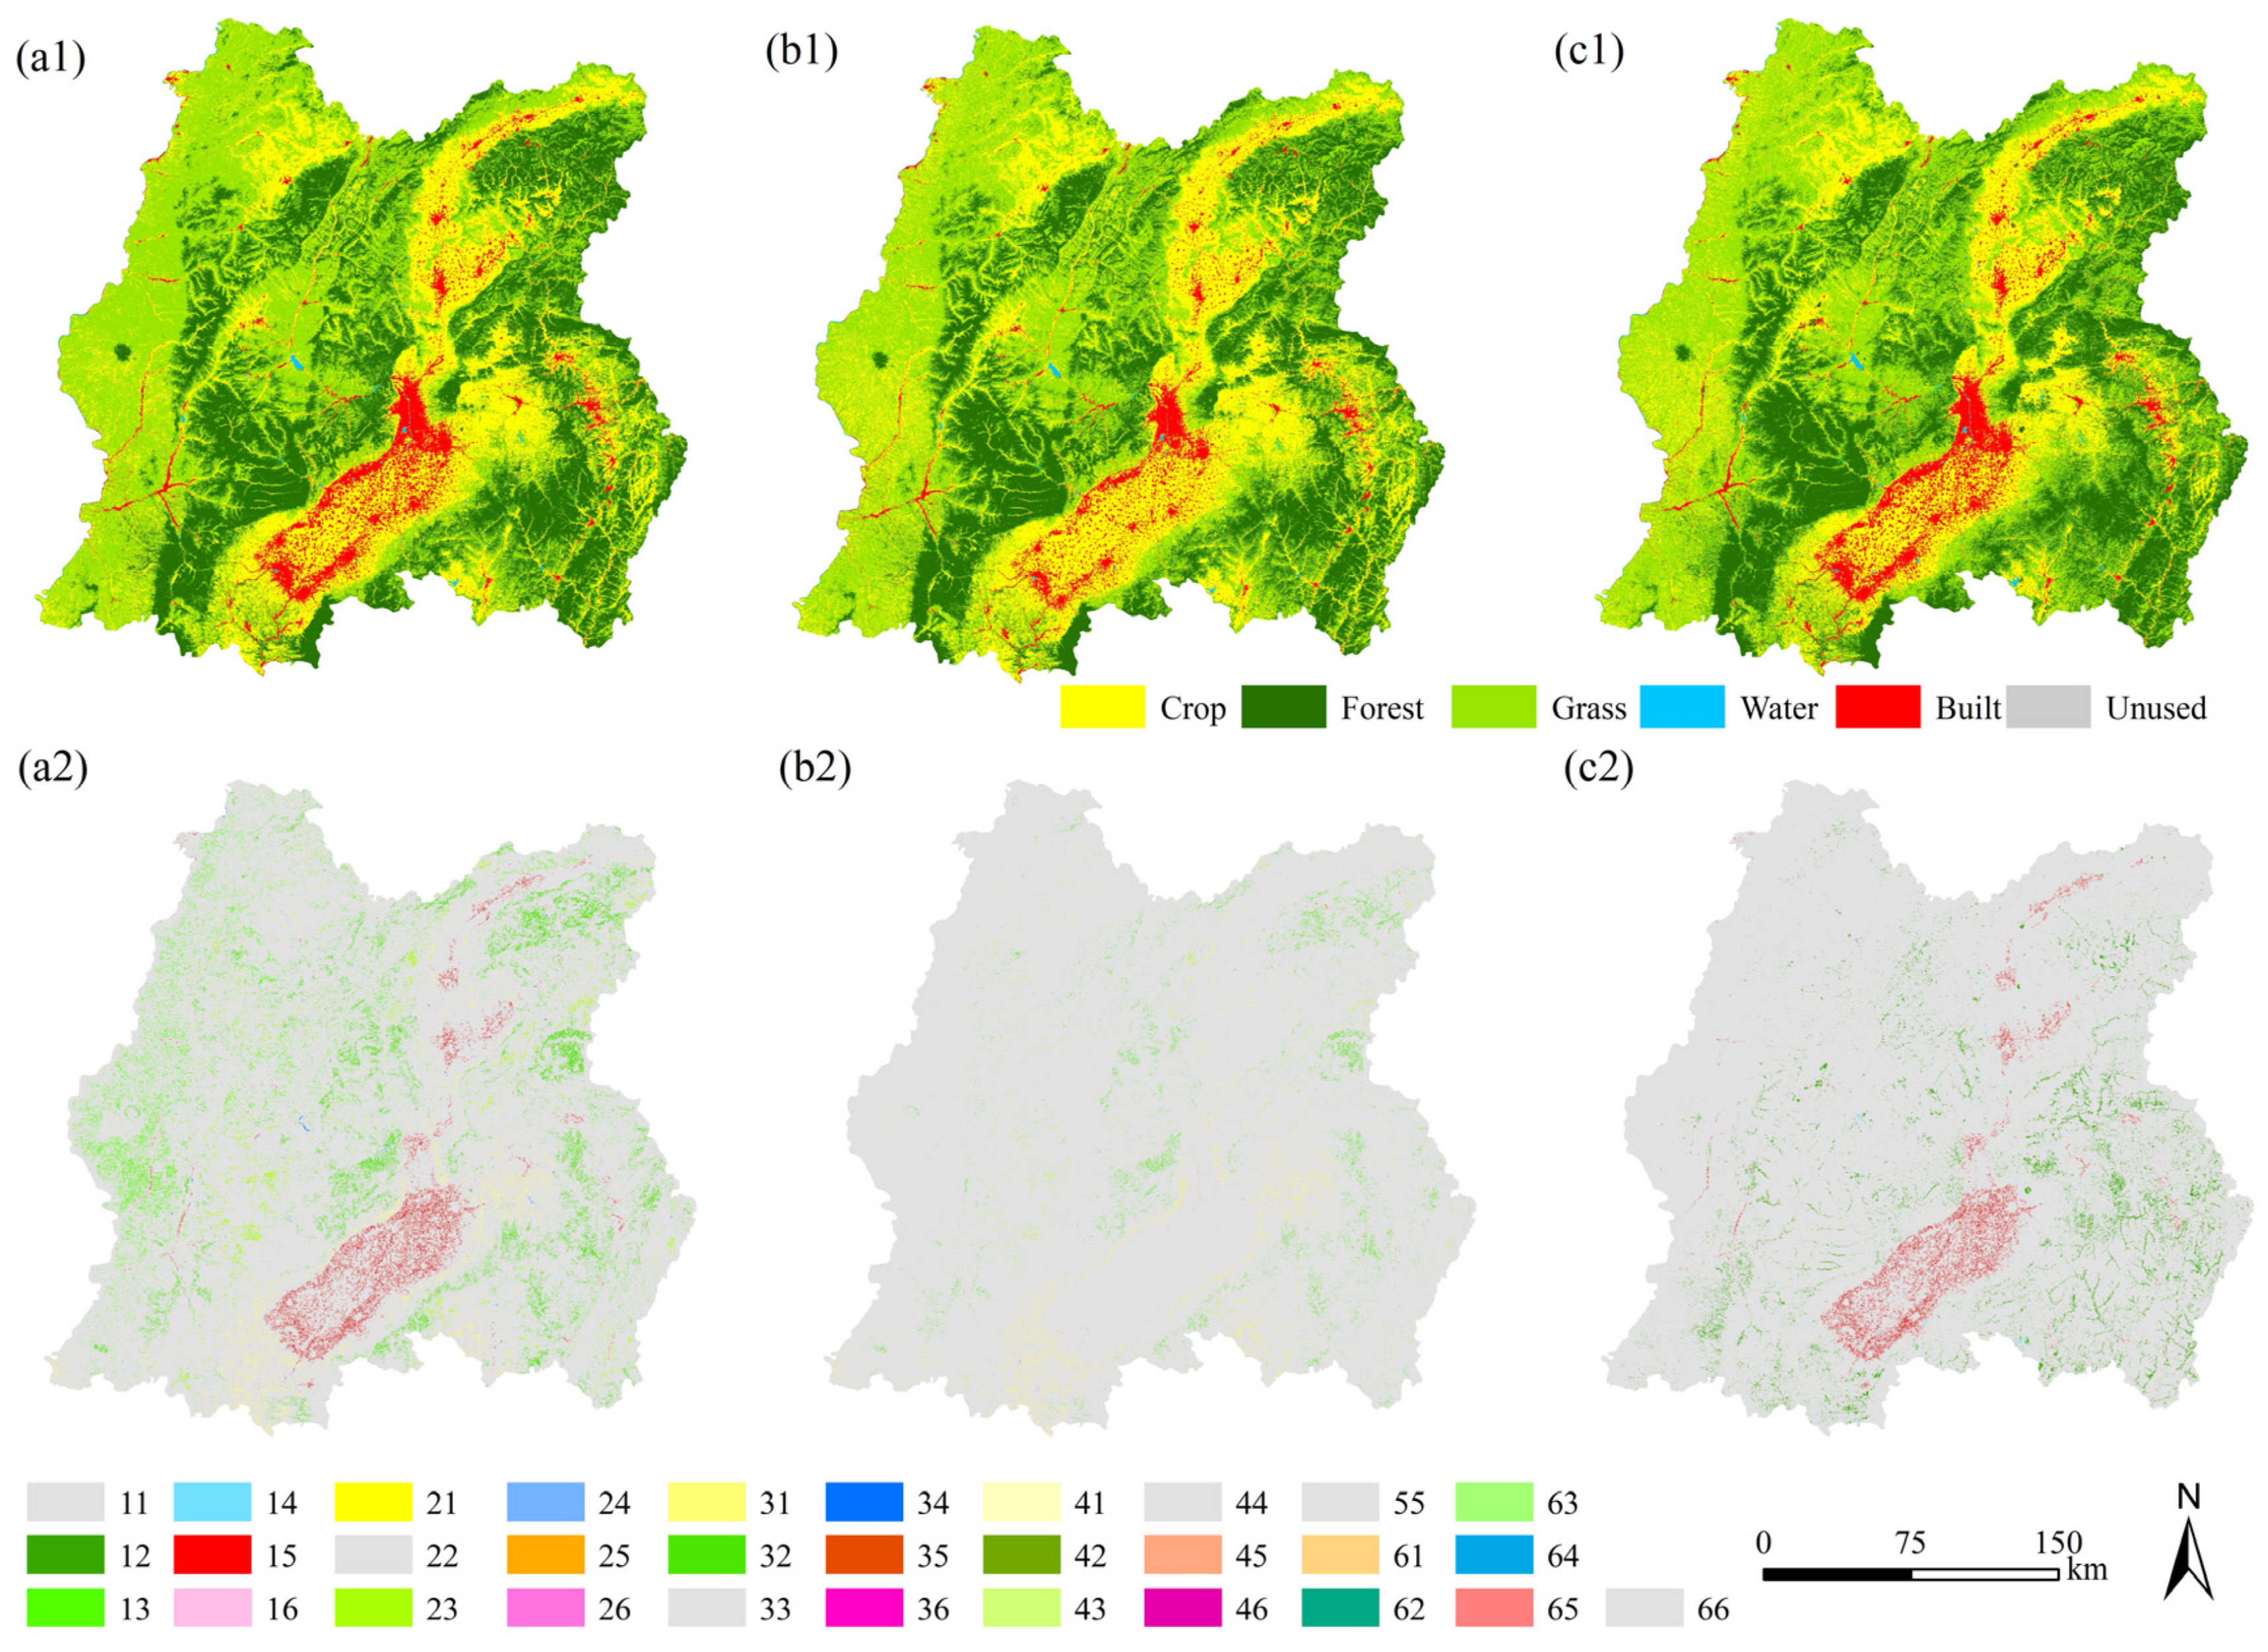
3.3. Analysis of LUCC Prediction in 2035

The projected LUCC in the central Shanxi urban agglomeration under various scenarios for 2035 is shown in Figure 7. Based on the predictive results (Table 6), it is evident that under the ND scenario, the greatest notable increase is seen in built-up land, increasing by 28.90%. This is followed by a 9.80% increase in forest land, a 4.67% increase in water bodies, and a 2.54% rise in unused land. Conversely, cropland experiences the most substantial decrease, accounting for a reduction of 9.01%, followed by grassland, which declines by 3.60%.
Under the CP scenario, areas of cropland, forest land, and built-up land all increase. Notably, cropland experiences a significant increase of 2.67% by 2035. However, grassland decreases by 3.51%, primarily due to substantial transfers to cropland and forest land. Construction land shows a slow upward trend. In the EP scenario, efficient use of different ecological policies in Shanxi province leads to further growth of forest land in the study area compared to 2020. It is anticipated that by 2035, forest land will increase by 10.54%, while cropland is expected to show a marked downward trend, with a larger reduction than in the other two scenarios. The primary cause of this transformation is the preservation of water bodies, grasslands, and forest areas, which stops additional conversion to cropland and built-up land.

3.4. Carbon Storage Dynamics from 2000 to 2020

Based on the InVEST model’s calculation of the carbon module, the central Shanxi urban agglomeration’s carbon storage during 2000 and 2020 was 1.114 × 10⁸ t, 1.112 × 10⁸ t, 1.111 × 10⁸ t, 1.109 × 10⁸ t, and 1.107 × 10⁸ t, respectively, displaying an annual declining tendency, with a total reduction of 6.70 × 10⁶ t.
By comparing the variations in carbon storage with the LUCC area proportion curves (Figure 8), it is observed that from 2000 to 2010, the change in carbon stock corresponds with the trends of cropland and unused land, whereas it exhibits an opposite trend to grassland and forest land. From 2010 to 2020, the variations in cropland and grassland align with the trend of carbon storage changes. This correlation is attributed to a sharp decline in grassland areas during the same period, which decreased by 2.03%. Grassland serves as a significant carbon sink, capable of absorbing and storing substantial amounts of carbon; thus, the reduction of grassland area in the central Shanxi urban agglomeration has a pronounced detrimental effect on the carbon stock.
Concerning the sorts of land use, the carbon stocks in 2000 and 2005 are ordered as follows: grassland > cropland > forest land > build-up land > water bodies > unused land. However, in 2010, 2015, and 2020, according to decreasing order, carbon reserves are as follows: grassland, forest land, cropland, built-up land, water bodies, and unused land. Notably, carbon stock in cropland has continuously decreased, losing 6.70 × 10⁶ t from 2000 to 2020, while carbon stock in forest land has steadily increased, reaching 3.66 × 10⁷ t. The carbon stock in grassland exhibits an upward trend followed by a decline, resulting in an overall reduction of 7.32 × 10⁶ t. The carbon stocks in water bodies and constructed land have shown slow, continuous growth, increasing by 6.37 × 10³ t and 9.19 × 10⁶ t, respectively, which aligns with the LUCC areas within the study zone.
Spatially, the carbon stocks of the central Shanxi urban agglomeration overall reflect a pattern of “low in the center and high on each side” corresponding to the geographical feature of “two mountains flanking a valley” in Shanxi province. Specifically, high carbon stock areas are concentrated in the Taihang Mountains to the east and the Lüliang Mountains to the west, where the coverage rates of cropland and forest land are markedly higher. The low carbon stock areas are predominantly located in the central Taiyuan Basin and the Xinding Basin, characterized by lower elevation and widespread cropland and built-up land compared to other regions.
Figure 9f illustrates the changes and stable regions of carbon stock from 2000 to 2020, revealing that the majority of areas maintain relatively stable carbon stock levels. Regions with increasing carbon stocks are mainly distributed in the northwest and southeast, while decreasing stocks are primarily found in the Taiyuan basin and Xinding Basin. This change is associated with changes in land usage in the central Shanxi urban agglomeration, where reductions in cropland correspond to increases in forest land. Given that the total carbon density of forest land exceeds that of cropland, the overall carbon stocks exhibit an increasing trend. Conversely, in the Taiyuan and Xinding Basins, the expansion of constructed land due to urban growth has resulted in a decrease in carbon stocks.

3.5. Prediction of Carbon Storage in 2035

LUCC is a significant driver of variations in terrestrial ecosystem carbon storage. This is because different types of land have varying capacity for storing carbon, and changes in land use can result in either an increase or a loss in carbon storage. According to research, the conversion of grassland and farmland to other land types was a major factor in the notable decrease in carbon storage between 2000 and 2020, with a total decrease of 5.25 × 10⁷ t (Table 7). In contrast, the conversion of water bodies, built-up areas, and unused land resulted in increases of carbon storage by 6 × 10³ t, 9.19 × 10⁶ t, and 1.1 × 10⁴ t, respectively. The mutual transitions between land types, such as from cropland to water bodies, built environments, and unused land, as well as from forest to other land types, and from grassland to cropland, water bodies, built environments, or unused land, result in reductions in carbon storage. Conversely, conversions between other land cover types typically lead to increases in carbon storage.
Figure 10 provides information about the geographical arrangement of carbon stores in different situations. In the ND scenario, Taiyuan’s fast urban growth has resulted in a significant expansion of constructed land at the detriment of agricultural and natural regions. This has resulted in a drastic decline in carbon stocks within the region, reducing by a total of 4.65 × 106 t by 2035. Specifically, carbon stocks in cropland and field decreased by 2.60 × 10⁷ t and 1.70 × 10⁷ t, while those in forest land increased by 3.18 × 10⁷ t. By contrast, the EP scenario demonstrates a total reduction in carbon stocks of 3.57 × 10⁶ t. This scenario aims to promote ecological sustainability, implementing conservation measures to restrict the reduction of ecological land and properly manage the transformation of agricultural land into new construction. Additionally, the increase in forest land area also mitigates the overall decline in carbon stocks. Under the CP scenario, carbon stocks decrease by 2.89 × 10⁵ t, primarily as a result of laws being put into place that expand the area under cultivation.
Therefore, it has been discovered that substantial carbon losses may result from the conversion of natural regions, such a forests and grasslands, into constructed environments. To enhance carbon storage in forested areas, it is advisable to identify suitable reforestation sites, particularly in regions converted to non-vegetated land types. Native tree species that are well adapted to local climate and soil conditions can be planted, and urban planners can focus on increasing urban green spaces to improve carbon storage capacity. Through the scenario of cropland protection, it is noted that a certain degree of farmland preservation contributes to mitigating reductions in carbon storage. Given the extensive cropland area in the central urban cluster of Shanxi, promoting practices such as sustainable agriculture can reduce carbon emissions and enhance soil carbon sequestration. Additionally, practices like cover crops and no-till farming are promoted to enhance soil health and boost croplands’ capacity to store carbon [52].
We used Geoda 1.22 software to analyze the spatiotemporal differences in carbon storage in the study area, and the results are shown in Figure 11. The Moran’s I values for the three scenarios are 0.434, 0.463, and 0.464, all of which are positive spatial correlations, indicating that the distribution of regional carbon storage has a significant positive spatial correlation and is clustered in space. Hotspot analysis reveals that in 2035, differences in clustering distributions of high and low carbon stock values are minimal across the ND, CP, and EP scenarios (Figure 12). Notably, carbon storage hotspots predominantly occur in most areas of Lüliang except the southwest, western Taiyuan, western and eastern parts of Xinzhou, and southeastern Jinzhong. The overall hotspots under the CP and EP scenarios are relatively weaker compared to the ND scenario. High levels of vegetation cover and intense ecological land use are characteristics of these areas. For instance, the western parts of Lüliang and Xinzhou are mainly located inside the Lüliang mountains region, both with heavy vegetation covering. Conversely, carbon cold spots are mainly situated in the Xinzhou and Taiyuan Basins, townships, and agricultural ecological zones, areas typically marked by a dense population and frequent human activity.

4. Discussion

4.1. Influence of Diverse Driving Factors on LUCC

This study assesses the dynamic spatial distribution of land use changes in the central Shanxi urban agglomeration from 2000 to 2020 and three scenarios for 2035: natural development, cropland protection, and ecological conservation. There are notable variations in the growth of farmland, forest land, grassland, and built-up area in the three scenarios. Figure 13 illustrates the ranking of contributions from various drivers affecting the expansion of these four land types in 2020.
Regarding cropland, it was found that slope has the greatest contribution to cropland growth. In the study area, the primary factors influencing cropland expansion are natural factors, including slope and temperature. Areas with gentler slopes facilitate mechanized operations, and land leveling reduces agricultural costs, thereby promoting large-scale cultivation and farming, which effectively enhances agricultural productivity. Consequently, these areas are more likely to be developed as cropland. Additionally, suitable temperatures favor the growth and development of crops; regions with optimal temperatures can meet the growth requirements of various crops, increasing the likelihood of high yields. This potential for increased productivity attracts individuals to cultivate more land for cropland to obtain greater profits.
DEM and slope are the main variables influencing changes in forest land. On one hand, high-altitude areas typically exhibit lower temperatures and higher precipitation, which favor forest growth. In the Vosges Mountains of northeastern France, plants at high elevations demonstrate greater sensitivity to temperature while exhibiting increased sensitivity to summer drought conditions at lower altitudes and under dry conditions [53]. On the contrary, low-altitude regions could have environmental problems like land deterioration and water scarcity, which could have a negative impact on the amount and quality of plants. Additionally, the central Shanxi urban agglomeration, as the core region of Shanxi province, experiences active economic activities that increase the demand for land resources and development. Rapid economic growth, however, invariably results in environmental problems. Maintaining ecological balance and safeguarding natural resources are becoming increasingly important to society and the government. Relevant authorities are actively implementing environmental management measures to minimize the adverse impacts of economic activities.
Temperature and precipitation are the primary factors influencing grassland expansion. Temperature directly affects the physiological activities of grassland plants, such as photosynthesis and respiration. Within suitable temperature ranges, these physiological processes operate efficiently, promoting plant growth and reproduction, which in turn facilitates grassland expansion. Furthermore, moisture is a critical factor for plant growth; annual average precipitation provides essential water for plants. When precipitation is abundant, plants can absorb sufficient moisture to sustain physiological activities and promote growth.
DEM and distance to primary roads are the most significant factors affecting the expansion of built-up land. Areas characterized by flat terrain, as indicated by DEM data, have lower land development costs, allowing for infrastructure development without extensive engineering efforts, thereby reducing construction difficulty and costs. For example, substantial expansion of built-up land is observed in the flat regions of the Taiyuan Basin. Additionally, areas that are at lower altitudes and distant from geological hazard zones, such as valleys prone to debris flows or landslides, exhibit higher safety and are more conducive to development as built-up land. The contribution of distance to primary roads also indicates that built-up land is highly sensitive to road infrastructure. Major roads typically connect city centers with surrounding areas, effectively enhancing urban connectivity and attracting commercial, industrial, and residential expansion. As primary roads extend, the land value in adjacent areas gradually increases, further facilitating the expansion of developed zones [54].

4.2. Interpretation of Research

The goal of this study is to identify the inherent link between land use change and carbon storage in the central Shanxi urban agglomeration. By analyzing the transformations in land use types over different periods, such as changes in cropland, forest land, and built-up land, the study quantifies their impact on carbon storage. It further clarifies the extent to which land use changes influence carbon storage, providing data support and a theoretical basis for the creation of logical and scientific land planning, carbon reduction strategies, and ecological protection policies in the urban agglomeration, thereby facilitating the region’s transition to green and sustainable development.
The study finds that over the past 20 years, the highest percentage of land use is grassland in the central Shanxi urban agglomeration, followed by cropland. The changes in the area proportions of different land types are relatively gradual, with grassland growing at first and then declining. The reduction of cropland is the most pronounced, while built-up land experiences the fastest growth, and forest land shows stable growth. This phenomenon is closely related to various policies implemented by national and local governments. For example, the national “Grain for Green” policy encourages farmers to convert cropland to forest to improve the ecological environment and increase forest coverage. This program encourages ecological restoration by directly reducing cropland and increasing forest land. The “Land Use Master Plan of Shanxi Province (2006–2020)” emphasizes the protection of cropland and the rational use of built-up land. This plan prioritizes the protection of basic cropland and controls the development of non-agricultural built-up land. Despite these protective measures, some cropland is still converted to built-up land as urbanization accelerates. “National New Urbanization Plan (2014–2020)” encourages land conversion to urban development use and stresses the pace of urbanization. This policy drives the expansion of built-up land, resulting in further reductions in cropland. In 2017, Shanxi province delineated ecological protection redlines to restrict development activities and focus on protecting ecological function zones. By limiting development in certain areas, this initiative promotes stable increases in forest land but also impacts the use of cropland.
The research area’s land-type transitions are very dynamic due to the aforementioned policies and other climatic conditions, which further impact the ability of the environment to store carbon. According to the study, there is a discernible increase in the reduction after 2010 and a declining trend in total carbon storage from 2000 to 2020 (Figure 8). Previous studies confirm that forests serve as the largest carbon reservoir in terrestrial ecosystems, exhibiting the highest carbon density [55,56]. In contrast, built-up land and unused land have the lowest carbon density [57], while the carbon density of cropland and grassland ranks just below that of forests [58]. With the help of several strategies, cropland gradually gives way to higher-density grassland, which in turn gives way to even higher-density forest land. But compared to the size of transitions to lower-density cropland, these changes are far less. Consequently, the total amount of carbon stored keeps decreasing. The prediction results based on different scenarios have also verified this point: In the ND scenario, the reduction in carbon stocks is most pronounced, as this scenario perpetuates the LUCC trend observed in 2020. A substantial area of cropland continually transitions to grassland and constructed land, while grassland increasingly shifts to forest and cultivated land. This suggests that consistent with the results of some scholars [11,59,60,61], there is a considerable loss of carbon when places like grassland and farmed land are converted to built-up land. The EP scenario mitigates the trend of conversion from natural areas like grasslands and forests to constructed land, thereby alleviating the decline in carbon stocks.

4.3. Suggestions for Future Development

Through the comparison of carbon storage across three development scenarios for 2035, it is evident that cropland protection policies significantly mitigate the decline in carbon storage. Therefore, in light of the contributions of land expansion driving factors, it is recommended that government departments strictly implement the responsibility system for cropland protection targets and enhance supervision of the “non-agricultural” and “non-grain” conversion of cropland to ensure that both the quantity and quality of cropland do not decrease. For instance, a dynamic monitoring system for cropland protection should be established to track land use in real time, enabling the timely detection and strict investigation of illegal land occupation. Additionally, efforts should be intensified in ecological restoration and construction. Given the natural geographic conditions of the central Shanxi urban agglomeration, it is crucial to strengthen the management of ecological issues such as soil erosion and land desertification. For example, comprehensive watershed management should be implemented in the Loess Hilly and Gully Region through measures such as afforestation and terracing to increase vegetation coverage and enhance soil carbon sequestration capacity. Furthermore, promoting a green transformation of industries is essential. Traditional industries should be encouraged to develop in a green and low-carbon direction, and support for emerging green industries should be increased. In the energy sector, the development and application of clean and efficient coal utilization technologies should be accelerated, alongside the promotion of new energy industries.
In the ecological protection scenario, although a reduction in carbon storage is somewhat controlled, further incentives for ecological protection behaviors are still necessary. The government can establish a special fund for ecological compensation to provide economic compensation and policy support to entities actively engaging in ecological protection, such as farmers and enterprises involved in reforestation and grassland restoration in ecologically vulnerable areas. This approach aims to enhance their willingness to participate in ecological protection. Simultaneously, water resources should be allocated rationally to meet ecological water demands. For instance, in arid and semi-arid regions, water-saving irrigation technologies should be promoted to improve water resource utilization efficiency and reduce ecological degradation caused by water scarcity. This ensures the functioning of carbon sinks within ecosystems.
By implementing these policies and adopting a comprehensive approach that includes natural and socio-economic dimensions, it is expected that the central Shanxi urban agglomeration can better protect and enhance its carbon storage in future development, achieving a win-win situation for both economic growth and ecological protection.

4.4. Limitations and Future Work

The PLUS model, as an advanced tool for simulating land use change, demonstrates robust capabilities in predicting future land use patterns; however, it also has notable limitations. Its effectiveness heavily relies on the quality of input data. Inaccurate, insufficient resolution, or outdated geographic information system (GIS) data can lead to biased simulation results. For instance, in rapidly urbanizing areas, failure to update land cover data in a timely manner may result in misjudgments regarding future urban expansion trends. Additionally, the model’s demand for socioeconomic data is equally critical, yet such data often possess uncertainties, particularly in developing regions or emerging markets, where deficiencies in statistical systems may affect the accuracy of model outputs.
Although the InVEST model is a powerful decision support tool, there are several limitations worth noting. First, the InVEST model typically relies on static datasets for calculations, making it challenging to reflect changes in ecosystem services over time. For instance, under the long-term context of climate change, the structure and function of ecosystems may evolve, yet these changes might not be captured by static models, thereby affecting the timeliness and accuracy of the assessment results. Second, the results of the InVEST model are highly dependent on user-defined parameter settings and the chosen spatial resolution. Different parameter selections can yield significantly different outcomes, increasing the uncertainty of the model outputs. For example, estimates of carbon storage can vary considerably based on the settings for vegetation types and soil characteristics. Additionally, the choice of spatial resolution is critical; both excessively high and low resolutions can impact the final assessment of service values. Based on the methodology suggested by Alam et al. [47], the carbon density information used in this investigation was obtained from earlier research findings. This approach has been widely applied by numerous scholars in regions such as the Yellow River Basin and Dongting Lake [62]. However, this study does not incorporate field testing or correction of these data. Despite the similarity of the areas under study, there is still some temporal variation in the carbon intensity of various forms of land usage, and it even fluctuates depending on the local conditions [63,64].
Therefore, future research will utilize high-resolution remote sensing imagery and real-time geographic information collection devices to conduct real-time or periodic updates of geographic data, such as land cover and transportation networks, ensuring the accuracy and timeliness of the data. The adaptability of the PLUS model to complex socio-economic changes will be a primary focus. A policy variable module will be introduced into the model, quantifying factors such as policy changes and planning adjustments as model parameters, enabling the simulation of land use changes under various policy scenarios. Additionally, the integration of machine learning and deep learning techniques will enhance the model’s ability to capture nonlinear complex relationships, thereby improving prediction accuracy. To address the reliance of the InVEST model on static datasets, time series data will be incorporated alongside long-term ecological monitoring data to construct a dynamic database that reflects the temporal dynamics of ecosystem services. Furthermore, future studies should conduct field carbon density tests within the central Shanxi urban agglomeration, selecting representative sampling plots across different land use types to obtain accurate carbon density data through sampling analysis. The field measurement data will be compared and calibrated against existing research findings to establish a carbon density database tailored to the region, considering the temporal variations and spatial differences in land use carbon intensity, ultimately enhancing the precision of carbon storage estimates.

5. Conclusions

Based on statistics from 2000 to 2020 for the central Shanxi urban agglomeration, this study innovatively employs intensity analysis through bubble charts to reveal the deep connections between land use changes and carbon storage in the study area. The aim is to theoretically and methodologically advance the formulation of land use policies in the region, thereby facilitating sustainable development. The findings are as follows:
(1)
Significant interrelationships are observed amid a variety of land usage in the central Shanxi urban agglomeration between 2000 and 2020, with cropland and grassland becoming the main categories of land. Grassland exhibits the largest area, followed by cultivated land. During this period, grassland initially increases before later declining, while cultivated land decreases overall, and forest land, water bodies, and construction land display stable growth. In addition to the influence of policy factors, the DEM significantly contributes to the expansion of forest land and constructed land.
(2)
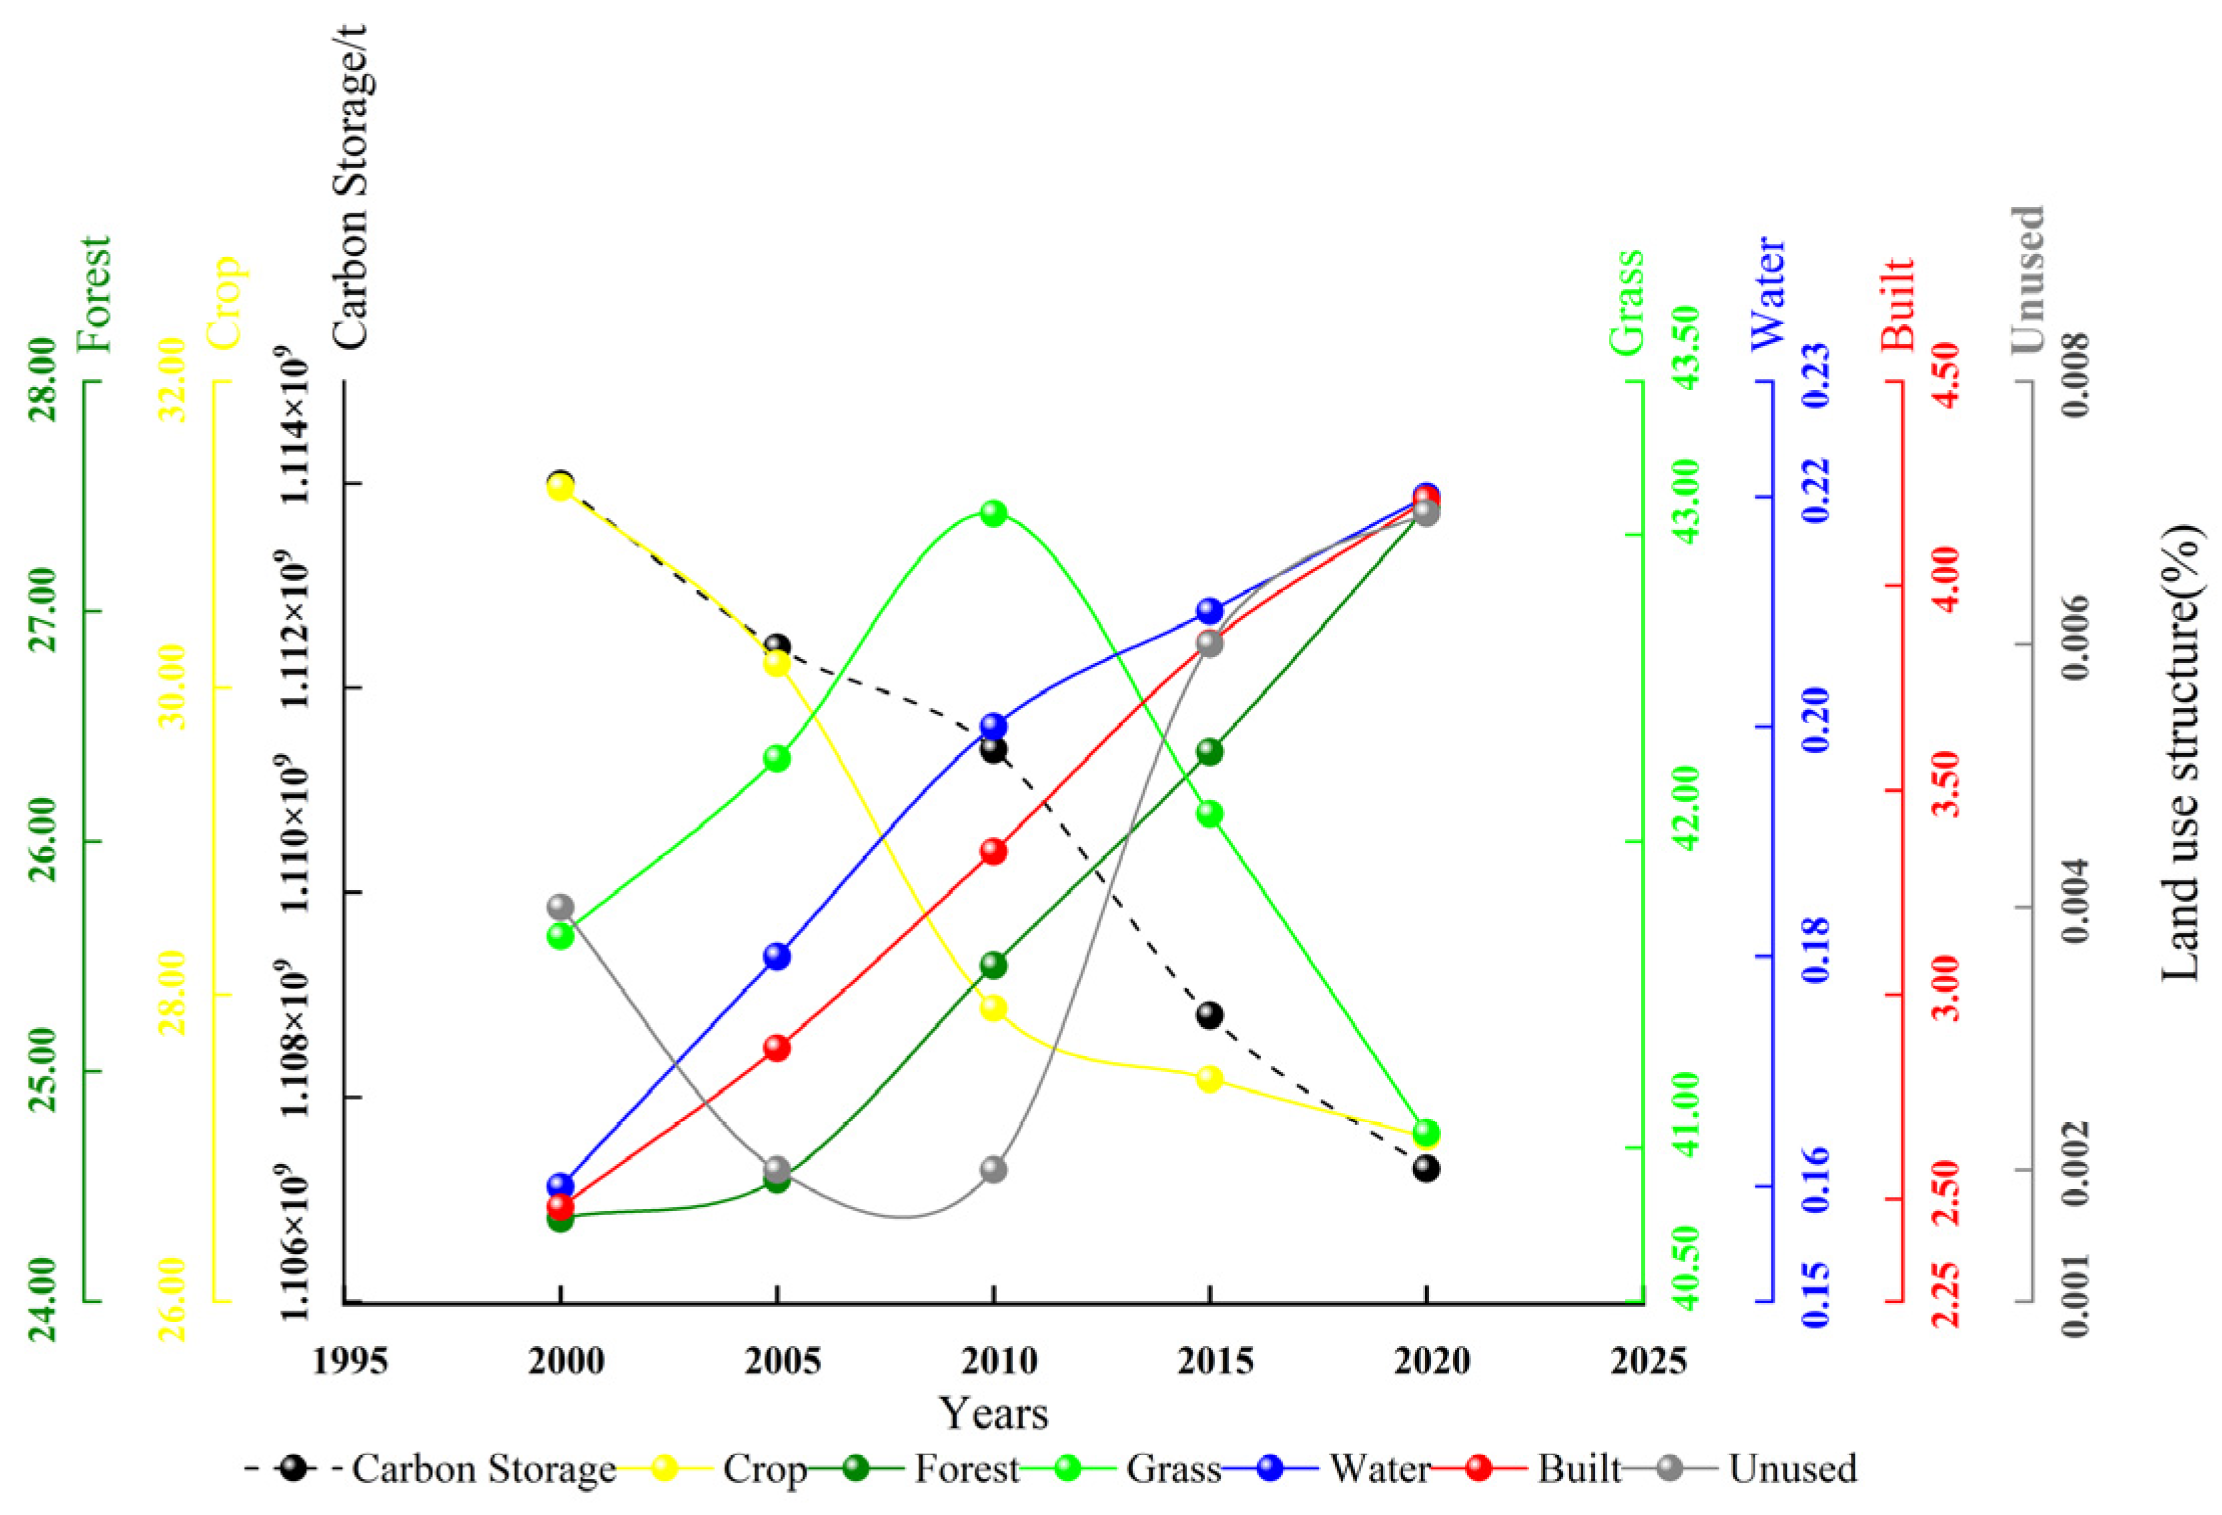
Carbon storage in the central Shanxi urban agglomeration stands at 11.14 ×10⁸ t in 2000 and decreases to 11.07 ×108 t by 2020. Within the urban cluster, areas with decreased carbon storage are especially noticeable. Spatial autocorrelation analysis indicates that carbon storage shows an overall clustered distribution, although the degree of clustering gradually weakens. Areas experiencing an increase in carbon storage are mostly found in the mountains around Lüliang, including regions such as western Xinzhou, Lüliang city, and Taiyuan city. Conversely, regions with lower carbon storage are mostly found in the crowded Taiyuan and Xinzhou basins. This suggests that the switch between high and low carbon density land types influences variations in carbon storage in the studied area.
(3)
The trends from 2000 to 2010 are consistent with changes in cultivated land area, according to a comparison of changes in carbon storage and the percentage of land area used. This suggests that a major factor influencing carbon storage levels is the decrease in cropland. From 2010 to 2020, carbon storage trends align with the reduction of grassland area, highlighting the impact of significant grassland loss. The transformation of land use types indicates that the conversion between fields and cropland significantly affects carbon storage.
(4)
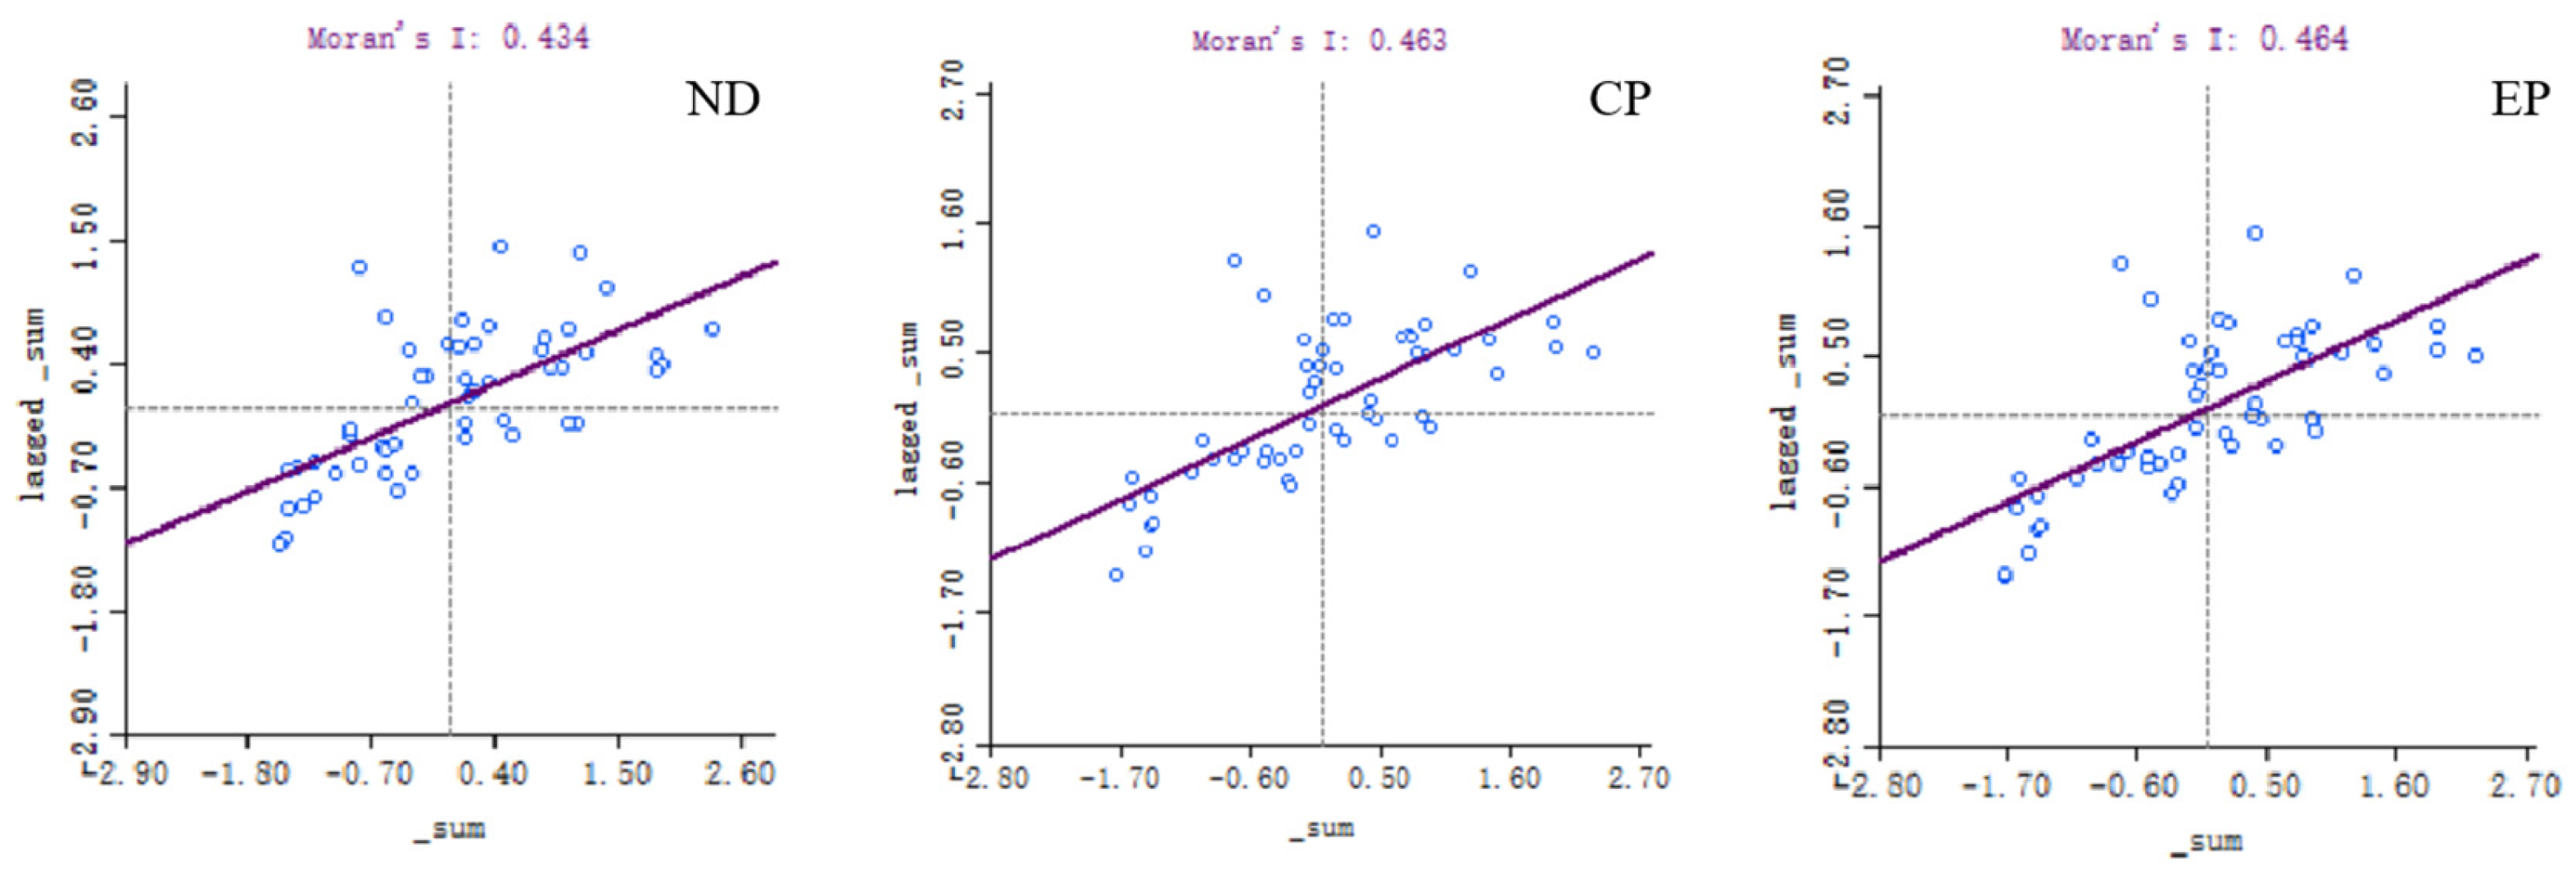
Projections for 2035 under the three scenarios indicate a downward trend in carbon storage, with the CP scenario exhibiting the least decline and the ND scenario showing the most significant decrease. Spatial autocorrelation results suggest that carbon storage distribution becomes more uniform across the three scenarios compared to 2020, with the ND and EP scenarios exhibiting a relatively dispersed distribution, whereas the CP scenario displays a more concentrated distribution.

Author Contributions

Conceptualization, B.Q.; methodology, Y.Z.; software, Y.Z.; validation, B.Q. and Y.Z.; formal analysis, Y.Z.; investigation, Y.Z.; resources, B.Q.; data curation, B.Q. and Y.Z.; writing—original draft preparation, Y.Z.; writing—review and editing, Y.Z. and B.Q.; visualization, Y.Z.; supervision, B.Q.; project administration, B.Q.; funding acquisition, B.Q. All authors have read and agreed to the published version of the manuscript.

Funding

This research was funded by the key Project of Social Science Foundation of Hengyang under grant number 2021B(I)004: Major Project of the Key Project of Hunan Provincial Department of Education (17A067).

Institutional Review Board Statement

Not applicable.

Informed Consent Statement

Not applicable.

Data Availability Statement

The data used in this study can be requested from the authors.

Acknowledgments

We would like to thank the anonymous reviewers for their helpful and valuable comments and suggestions.

Conflicts of Interest

The authors declare no conflicts of interest.

References

  1. Yang, Y.; Shi, Y.; Sun, W.; Chang, J.; Zhu, J.; Chen, L.; Wang, X.; Guo, Y.; Zhang, H.; Yu, L.; et al. Terrestrial carbon sinks in China and around the world and their contribution to carbon neutrality. Sci. China Life Sci. 2022, 65, 861–895. [Google Scholar] [CrossRef] [PubMed]
  2. Stockmann, U.; Padarian, J.; McBratney, A.; Minasny, B.; De-Brogniez, D.; Montanarella, L.; Hong, S.Y.; Rawlins, B.G.; Field, D.J. Global soil organic carbon assessment. Glob. Food Secur. 2015, 6, 9–16. [Google Scholar] [CrossRef]
  3. Wang, X.; Feng, Z.; Ouyang, Z. Vegetation carbon storage and density of forest ecosystems in China. Ying Yong Sheng Tai Xue Bao J. Appl. Ecol. 2001, 12, 13–16. [Google Scholar]
  4. Domke, G.M.; Perry, C.H.; Walters, B.F.; Woodall, C.W.; Russell, M.B.; Smith, J.E. Estimating litter carbon stocks on forest land in the United States. Sci. Total Environ. 2016, 557, 469–478. [Google Scholar] [CrossRef] [PubMed]
  5. Baumann, M.; Gasparri, I.; Piquer-Rodríguez, M.; Gavier Pizarro, G.; Griffiths, P.; Hostert, P.; Kuemmerle, T. Carbon emissions from agricultural expansion and intensification in the Chaco. Glob. Change Biol. 2017, 23, 1902–1916. [Google Scholar] [CrossRef] [PubMed]
  6. Gray, V. Climate Change 2007: The Physical Science Basis Summary for Policymakers. Energy Environ. 2007, 18, 433–440. [Google Scholar] [CrossRef]
  7. Zhang, S.; Bai, X.; Zhao, C.; Tan, Q.; Luo, G.; Wu, L.; Xi, H.; Li, C.; Chen, F.; Ran, C.; et al. China’s carbon budget inventory from 1997 to 2017 and its challenges to achieving carbon neutral strategies. J. Clean. Prod. 2022, 347, 130966. [Google Scholar] [CrossRef]
  8. Li, X.; Huang, C.; Jin, H.; Han, Y.; Kang, S.; Liu, J.; Cai, H.; Hu, T.; Yang, G.; Yu, H.; et al. Spatio-temporal patterns of carbon storage derived using the InVEST model in Heilongjiang Province, Northeast China. Front. Earth Sci. 2022, 10, 846456. [Google Scholar] [CrossRef]
  9. Setiawan, O.; Rahayu, A.A.D.; Samawandana, G.; Tata, H.L.; Dharmawan, I.W.S.; Rachmat, H.H.; Suharti, S.; Windyoningrum, A.; Khotimah, H. Unraveling land use land cover change, their driving factors, and implication on carbon storage through an integrated modelling approach. Egypt. J. Remote Sens. Space Sci. 2024, 27, 615–627. [Google Scholar] [CrossRef]
  10. Liang, Y.; Liu, L.; Huang, J. Integrating the SD-CLUE-S and InVEST models into assessment of oasis carbon storage in northwestern China. PLoS ONE 2017, 12, e0172494. [Google Scholar] [CrossRef]
  11. Fu, Y.; Huang, M.; Gong, D.; Lin, H.; Fan, Y.; Du, W. Dynamic simulation and prediction of carbon storage based on land use/land cover change from 2000 to 2040: A case study of the Nanchang urban agglomeration. Remote Sens. 2023, 15, 4645. [Google Scholar] [CrossRef]
  12. Zhu, L.; Song, R.; Sun, S.; Li, Y.; Hu, K. Land use/land cover change and its impact on ecosystem carbon storage in coastal areas of China from 1980 to 2050. Ecol. Indic. 2022, 142, 109178. [Google Scholar] [CrossRef]
  13. Liang, Y.; Hashimoto, S.; Liu, L. Integrated assessment of land-use/land-cover dynamics on carbon storage services in the Loess Plateau of China from 1995 to 2050. Ecol. Indic. 2021, 120, 106939. [Google Scholar] [CrossRef]
  14. Jiang, P.; Cheng, L.; Li, M.; Zhao, R.; Duan, Y. Impacts of LUCC on soil properties in the riparian zones of desert oasis with remote sensing data: A case study of the middle Heihe River basin, China. Sci. Total Environ. 2015, 506, 259–271. [Google Scholar] [CrossRef]
  15. Ouyang, N.; Rui, X.; Zhang, X.; Tang, H.; Xie, Y. Spatiotemporal evolution of ecosystem health and its driving factors in the southwestern karst regions of China. Ecol. Indic. 2024, 166, 112530. [Google Scholar] [CrossRef]
  16. Yu, Z.; Deng, X.; Cheshmehzangi, A.; Mangi, E. Structural succession of land resources under the influence of different policies: A case study for Shanxi Province, China. Land Use Policy 2023, 132, 106810. [Google Scholar] [CrossRef]
  17. Liu, H.; Wang, Z.; Zhang, L.; Tang, F.; Wang, G.; Li, M. Construction of an ecological security network in the Fenhe River Basin and its temporal and spatial evolution characteristics. J. Clean. Prod. 2023, 417, 137961. [Google Scholar] [CrossRef]
  18. Ge, X.J.; Liu, X. Urban land use efficiency under resource-based economic transformation—A case study of Shanxi Province. Land 2021, 10, 850. [Google Scholar] [CrossRef]
  19. Chen, Y.; Chang, J.; Li, Z.; Ming, L.; Li, C.; Li, C. Coupling Coordination and Spatiotemporal Analysis of Urban Compactness and Land-Use Efficiency in Resource-Based Areas: A Case Study of Shanxi Province, China. Land 2023, 12, 1658. [Google Scholar] [CrossRef]
  20. Chen, Z.; Huang, M.; Zhu, D.; Altan, O. Integrating remote sensing and a markov-FLUS model to simulate future land use changes in Hokkaido, Japan. Remote Sens. 2021, 13, 2621. [Google Scholar] [CrossRef]
  21. Quan, B.; Bai, Y.; Römkens, M.J.M.; Chang, K.T.; Song, H.; Guo, T.; Lei, S. Urban land expansion in Quanzhou city, China, 1995–2010. Habitat Int. 2015, 48, 131–139. [Google Scholar] [CrossRef]
  22. Aldwaik, S.Z.; Pontius, R.G., Jr. Intensity analysis to unify measurements of size and stationarity of land changes by interval, category, and transition. Landsc. Urban Plan. 2012, 106, 103–114. [Google Scholar] [CrossRef]
  23. Deng, Z.; Quan, B. Intensity Analysis to Communicate Detailed Detection of Land Use and Land Cover Change in Chang-Zhu-Tan Metropolitan Region, China. Forests 2023, 14, 939. [Google Scholar] [CrossRef]
  24. Chen, L.; Ma, Y. Current and future characteristics of land use based on intensity analysis and PLUS model: A case study of Foshan city, China. SN Appl. Sci. 2023, 5, 83. [Google Scholar] [CrossRef]
  25. Quan, B.; Pontius, R.G., Jr.; Song, H. Intensity Analysis to communicate land change during three time intervals in two regions of Quanzhou City, China. GIScience Remote Sens. 2020, 57, 21–36. [Google Scholar] [CrossRef]
  26. Deng, Z.; Quan, B. Intensity characteristics and multi-scenario projection of land use and land cover change in Hengyang, China. Int. J. Environ. Res. Public Health 2022, 19, 8491. [Google Scholar] [CrossRef]
  27. Houghton, R.A. The annual net flux of carbon to the atmosphere from changes in land use 1850–1990. Tellus B 1999, 51, 298–313. [Google Scholar] [CrossRef]
  28. Schimel, D.S.; House, J.I.; Hibbard, K.A.; Bousquet, P.; Ciais, P.; Peylin, P.; Braswell, B.H.; Apps, M.J.; Baker, D.; Bondeau, A.; et al. Recent patterns and mechanisms of carbon exchange by terrestrial ecosystems. Nature 2001, 414, 169–172. [Google Scholar] [CrossRef] [PubMed]
  29. Zhao, S.; Liu, S.; Sohl, T.; Young, C.; Werner, J. Land use and carbon dynamics in the southeastern United States from 1992 to 2050. Environ. Res. Lett. 2013, 8, 044022. [Google Scholar] [CrossRef]
  30. Basyuni, M.; Wirasatriya, A.; Iryanthony, S.B.; Amelia, R.; Slamet, B.; Sulistiyono, N.; Pribadi, R.; Sumarga, E.; Eddy, S.; Al Mustaniroh, S.S.; et al. Aboveground biomass and carbon stock estimation using UAV photogrammetry in Indonesian mangroves and other competing land uses. Ecol. Inform. 2023, 77, 102227. [Google Scholar] [CrossRef]
  31. He, C.; Liu, Z.; Xu, M.; Ma, Q.; Dou, Y. Urban expansion brought stress to food security in China: Evidence from decreased cropland net primary productivity. Sci. Total Environ. 2017, 576, 660–670. [Google Scholar] [CrossRef]
  32. Jiang, W.; Deng, Y.; Tang, Z.; Lei, X.; Chen, Z. Modelling the potential impacts of urban ecosystem changes on carbon storage under different scenarios by linking the CLUE-S and the InVEST models. Ecol. Model. 2017, 345, 30–40. [Google Scholar] [CrossRef]
  33. Lyu, R.; Mi, L.; Zhang, J.; Xu, M.; Li, J. Modeling the effects of urban expansion on regional carbon storage by coupling SLEUTH-3r model and InVEST model. Ecol. Res. 2019, 34, 380–393. [Google Scholar] [CrossRef]
  34. Lin, J.; Chen, Q. Analyzing and Simulating the Influence of a Water Conveyance Project on Land Use Conditions in the Tarim River Region. Land 2023, 12, 2073. [Google Scholar] [CrossRef]
  35. Fu, Y.; Li, Q.; Li, J.; Zeng, K.; Wang, L.; Wang, Y. Multi-Scenario Simulation of the Production-Living-Ecological Spaces in Sichuan Province Based on the PLUS Model and Assessment of Its Ecological and Environmental Effects. Sustainability 2024, 16, 10322. [Google Scholar] [CrossRef]
  36. Wang, C.; Li, T.; Guo, X.; Xia, L.; Lu, C.; Wang, C. Plus-InVEST Study of the Chengdu-Chongqing urban agglomeration’s land-use change and carbon storage. Land 2022, 11, 1617. [Google Scholar] [CrossRef]
  37. Zhang, Z.; Wang, X.; Zhang, Y.; Gao, Y.; Liu, Y.; Sun, X.; Zhi, J.; Yin, S. Simulating land use change for sustainable land management in rapid urbanization regions: A case study of the Yangtze River Delta region. Landsc. Ecol. 2023, 38, 1807–1830. [Google Scholar] [CrossRef]
  38. Lin, Y.; Hu, Z.; Li, W.; Chen, H.; Wang, F.; Nan, X.; Yang, X.; Zhang, W. Response of ecosystem carbon storage to land use change from 1985 to 2050 in the Ningxia Section of Yellow River Basin, China. J. Arid Land 2024, 16, 110–130. [Google Scholar] [CrossRef]
  39. Zhang, J.; Li, F.; Zhang, H.; Sun, X. Conservation strategies for the North China leopard: Establishing effective ecological corridors in Shanxi Province. Ecol. Indic. 2024, 169, 112908. [Google Scholar] [CrossRef]
  40. Pan, L.B.; Ma, J.; Wang, X.L.; Hou, H. Heavy metals in soils from a typical county in Shanxi Province, China: Levels, sources and spatial distribution. Chemosphere 2016, 148, 248–254. [Google Scholar] [CrossRef] [PubMed]
  41. Jie, Y.; Xin, H. The 30 m annual land cover dataset and its dynamics in China from 1990 to 2019. Earth Syst. Sci. Data 2021, 13, 3907–3925. [Google Scholar]
  42. Pontius, R.G., Jr. Metrics That Make a Difference: How to Analyze Change and Error; Springer International Publishing: Berlin/Heidelberg, Germany, 2022. [Google Scholar] [CrossRef]
  43. Wang, N.; Chen, X.; Zhang, Z.; Pang, J. Spatiotemporal dynamics and driving factors of county-level carbon storage in the Loess Plateau: A case study in Qingcheng County, China. Ecol. Indic. 2022, 144, 109460. [Google Scholar] [CrossRef]
  44. Zhang, Y.; Shi, X.Y.; Tang, Q. Carbon storage assessment in the upper reaches of the Fenhe River under different land use scenarios. Acta Ecol. Sin 2021, 41, 360–373. [Google Scholar]
  45. Zhang, J.; Yang, J.; Liu, P.; Liu, Y.; Zheng, Y.; Shen, X.; Li, B.; Song, H.; Liang, Z. Effects of Land Use/Cover Change on Terrestrial Carbon Stocks in the Yellow River Basin of China from 2000 to 2030. Remote Sens. 2024, 16, 1810. [Google Scholar] [CrossRef]
  46. Chuai, X.; Huang, X.; Lai, L.; Wang, W.; Peng, J.; Zhao, R. Land use structure optimization based on carbon storage in several regional terrestrial ecosystems across China. Environ. Sci. Policy 2013, 25, 50–61. [Google Scholar] [CrossRef]
  47. Alam, S.A.; Starr, M.; Clark, B.J.F. Tree biomass and soil organic carbon densities across the Sudanese woodland savannah: A regional carbon sequestration study. J. Arid Environ. 2013, 89, 67–76. [Google Scholar] [CrossRef]
  48. Liang, X.; Guan, Q.; Clarke, K.C.; Liu, S.; Wang, B.; Yao, Y. Understanding the drivers of sustainable land expansion using a patch-generating land use simulation (PLUS) model: A case study in Wuhan, China. Comput. Environ. Urban Syst. 2021, 85, 101569. [Google Scholar] [CrossRef]
  49. Dong, G.; Ge, Y.; Jia, H.; Sun, C.; Pan, S. Land use multi-suitability, land resource scarcity and diversity of human needs: A new framework for land use conflict identification. Land 2021, 10, 1003. [Google Scholar] [CrossRef]
  50. He, Y.; Ma, J.; Zhang, C.; Yang, H. Spatiotemporal evolution and prediction of carbon storage in Guilin based on FLUS and InVEST models. Remote Sens. 2023, 15, 1445. [Google Scholar] [CrossRef]
  51. Chen, Y.; Wang, J.; Xiong, N.; Sun, L.; Xu, J. Impacts of land use changes on net primary productivity in urban agglomerations under multi-scenarios simulation. Remote Sens. 2022, 14, 1755. [Google Scholar] [CrossRef]
  52. Knudsen, M.T.; Meyer-Aurich, A.; Olesen, J.E.; Chirinda, N.; Hermansen, J.E. Carbon footprints of crops from organic and conventional arable crop rotations–using a life cycle assessment approach. J. Clean. Prod. 2014, 64, 609–618. [Google Scholar] [CrossRef]
  53. Lebourgeois, F.; Gomez, N.; Pinto, P.; Mérian, P. Mixed stands reduce Abies alba tree-ring sensitivity to summer drought in the Vosges mountains, western Europe. For. Ecol. Manag. 2013, 303, 61–71. [Google Scholar] [CrossRef]
  54. Mo, W.; Wang, Y.; Zhang, Y.; Zhuang, D. Impacts of road network expansion on landscape eco-logical risk in a megacity, China: A case study of Beijing. Sci. Total Environ. 2017, 574, 1000–1011. [Google Scholar] [CrossRef] [PubMed]
  55. Phat, N.K.; Knorr, W.; Kim, S. Appropriate measures for conservation of terrestrial carbon stocks—Analysis of trends of forest management in Southeast Asia. For. Ecol. Manag. 2004, 191, 283–299. [Google Scholar] [CrossRef]
  56. Keith, H.; Mackey, B.G.; Lindenmayer, D.B. Re-evaluation of forest biomass carbon stocks and lessons from the world’s most carbon-dense forests. Proc. Natl. Acad. Sci. USA 2009, 106, 11635–11640. [Google Scholar] [CrossRef]
  57. Robinson, D.T.; Zhang, J.; MacDonald, D.; Samson, C. Estimating Settlement carbon stock and density using an inventory approach and quantifying their variation by land use and parcel size. Urban For. Urban Green. 2023, 82, 127878. [Google Scholar] [CrossRef]
  58. Koga, N.; Shimoda, S.; Shirato, Y.; Kusaba, T.; Shima, T.; Niimi, H.; Yamane, T.; Wakabayashi, K.; Niwa, K.; Kohyama, K.; et al. Assessing changes in soil carbon stocks after land use conversion from forest land to agricultural land in Japan. Geoderma 2020, 377, 114487. [Google Scholar] [CrossRef]
  59. Jiang, Y.; Ouyang, B.; Yan, Z. The Response of Carbon Storage to Multi-Objective Land Use/Cover Spatial Optimization and Vulnerability Assessment. Sustainability 2024, 16, 2235. [Google Scholar] [CrossRef]
  60. Wu, Z.; Lin, F.; Niu, J.; Geng, T. Response of ecosystem service to land use pattern change in the Shanxi central urban agglomeration. Arid Zone Res. 2024, 41, 1153–1166. [Google Scholar]
  61. Ren, J.; Zhao, X.; Xu, X.; Ma, P.; Du, Y. Spatial-temporal evolution, tradeoffs and synergies of ecosystem services in the middle Yellow River. J. Earth Environ. 2022, 13, 477–490. [Google Scholar]
  62. Hu, W.; Li, G.; Gao, Z.; Jia, G.; Wang, Z.; Li, Y. Assessment of the impact of the Poplar Ecological Retreat Project on water conservation in the Dongting Lake wetland region using the InVEST model. Sci. Total Environ. 2020, 733, 139423. [Google Scholar] [CrossRef] [PubMed]
  63. Wu, H.; Guo, Z.; Peng, C. Land use induced changes of organic carbon storage in soils of China. Glob. Change Biol. 2003, 9, 305–315. [Google Scholar] [CrossRef]
  64. Gao, X.; Meng, T.; Zhao, X. Variations of soil organic carbon following land use change on deep-loess hill sopes in China. Land Degrad. Dev. 2017, 28, 1902–1912. [Google Scholar] [CrossRef]
Figure 1. Overview of the region.
Sustainability 17 01532 g001
Figure 2. Research framework.
Sustainability 17 01532 g002
Figure 3. Transformation mapping.
Sustainability 17 01532 g003
Figure 4. The distribution of LUCC and land use structure in central Shanxi urban agglomeration.
Sustainability 17 01532 g004
Figure 5. The degree and scope of category layer shift in central Shanxi urban agglomeration.
Sustainability 17 01532 g005
Figure 6. Transition mapping under four time periods in the central Shanxi urban agglomeration.
Sustainability 17 01532 g006
Figure 7. Different scenarios for central Shanxi urban agglomeration in 2035 LUCC. Notes: (a1c1) are the spatial distribution maps of land use under the natural development scenario, cropland protection scenario, and ecological protection scenario in 2035, respectively; (a2c2) are spatial distribution maps of land use change from 2020 to 2035 under three scenarios. Among them, 1 represents cropland, 2 represents forest land, 3 represents grassland, 4 represents water area, 5 represents built-up land, and 6 represents unused land. In the legend, 11, 22, 33, 44, 55, and 66 represent the unchanged areas from 2020 to 2035; 12 represents the area where cropland is converted to forest land; 13 represents the area where cropland is converted to grassland; 14 represents the area where cropland is converted to water area; and so on.
Sustainability 17 01532 g007
Figure 8. Variation curve of carbon stock and trend curve of area share of each LUCC. Notes: The carbon storage curve in the figure illustrates the changes in total carbon storage in the study area over time. The curves for each land type represent the proportion of each land type within the study area for each year. Given the varying carbon storage capacities of different land types, changes in carbon storage can be inferred by comparing the proportions of these land types.
Sustainability 17 01532 g008
Figure 9. Spatial distribution and change of carbon stocks in central Shanxi urban agglomeration.
Sustainability 17 01532 g009
Figure 10. Forecast of carbon stocks and changes in the central Shanxi urban agglomeration in 2035. Notes: (a1) is the spatial distribution map of carbon storage under the natural development scenario in 2035; (a2) is the carbon stock change map from 2020 to 2035 under natural development scenarios; (b1) is the spatial distribution map of carbon storage under the scenario of cropland protection in 2035; (b2) is the carbon stock change map from 2020 to 2035 under the scenario of cropland protection; (c1) is the spatial distribution map of carbon storage under the ecological protection scenario in 2035; (c2) is the carbon stock change chart from 2020 to 2035 under ecological protection scenarios.
Sustainability 17 01532 g010
Figure 11. Moran scatter plot of spatial autocorrelation analysis of carbon storage in the central Shanxi urban agglomeration.
Sustainability 17 01532 g011
Figure 12. Analysis of carbon stock cold hotspots in central Shanxi urban agglomeration in 2035.
Sustainability 17 01532 g012
Figure 13. Contribution of driving factors of land use change.
Sustainability 17 01532 g013
Table 1. Data Sources.
CategoryDataData ResourceOriginal Resolution (m)
Land use dataLand use in 2000–2020Jie et al. [41] (https://zenodo.org/records/4417810, accessed on 8 April 2022)30
Natural factorsDEM slopeGeospatial Data Cloud (http://www.gscloud.cn/, accessed on 1 April 2022)90
TemperatureData Center for Resources and Environmental Sciences of the Chinese Academy of Sciences (https://www.resdc.cn/, accessed on 14 April 2022)30
Precipitation
Soil type
Socioeconomic factorsPopulation
GDP
Data Center for Resources and Environmental Sciences of the Chinese Academy of Sciences (https://www.resdc.cn/, accessed on 14 April 2022)30
Distance to primary roads
Distance to secondary roads
Distance to tertiary roads
Distance to class IV roads
Distance to highways
Distance to government sites
Distance to rivers
Open Street Map
(https://www.openstreetmap.org, accessed on 14 April 2022)
1000
Table 2. Meaning of the letters in the formula for the InVEST Model.
LettersMeans
C i the carbon density of land type i (t/hm2)
C a b o v e aboveground carbon pool (t/hm2)
C b e l o w belowground carbon pool (t/hm2)
C s o i l soil carbon pool (t/hm2)
C d e a d dead organic carbon pool (t/hm2)
C t o t a l the total carbon stock (t)
A i the area of land type i (hm2)
n the number of land use types
Table 3. Data on carbon intensity for central Shanxi urban agglomerations t/hm2.
Land Use Type C a b o v e C b e l o w C s o i l C d e a d C t o t a l
Cropland3.0242.7498.130143.89
Forestland22.4661.3875.860159.70
Grassland18.745.8190.430154.94
Water bodies1.590001.59
Built-up land1.32070.61071.93
Unused land0.699.3728.42038.48
Table 4. Multi-scenario settings.
ScenariosDetails
Natural Development Scenario (ND)Without establishing any restricted areas, LUCC continues the trends observed from 2000 to 2020, allowing for mutual transitions among various land uses, except for built-up land.
Cultivated Land Protection Scenario (CP)Emphasis is placed on the protection of stable and high-quality croplands within the central Shanxi urban agglomeration. Areas that remain cropland across five time periods are designated as long-term stable croplands within the study region. Additionally, following previous research [49], croplands with slopes less than 6° are extracted as high-quality croplands. These stable and high-quality croplands are then combined and designated as restricted conversion zones, ensuring the rigorous implementation of cropland protection policies.
Ecological Protection Scenario (EP)Prioritizing ecological and environmental conservation, the expansion of urban built-up land is restricted, and the growth rates of forest and grassland are accelerated. According to the ecological benefits of various land uses, the order ranks as forest land, grassland, cropland, and water bodies. Taking into account policies like the return of cropland to forestry and grassland in the Yellow river basin and Shanxi province’s ecological framework of “one axis, two screens, and multiple corridors”, the possibility of forest and grassland converting to cropland is ultimately reduced by 40% based on natural development scenarios. Additionally, water bodies and long-term stable forest areas identified from 2005–2020 are designated as restricted zones.
Table 5. Multi-scenario prediction matrix parameters.
NDCPEP
abcdefabcdefabcdef
a111111100000111111
b111111111011010000
c111111111111011100
d111111101111000100
e000010000010000010
f111111111111111111
Note: a–f stand for cropland, forest land, grassland, water bodies, built-up land, and unused land, respectively; a value of 1 indicates that the land categories are interchangeable, while a value of 0 indicates that they are not.
Table 6. Areas change by category in 2035 compared to 2020 under three scenarios.
TypeTimeDevelopment ScenariosCroplandForest LandGrasslandWater BodiesBuilt-Up LandUnused Land
Area (km2)2020 20,061.4620,340.5630,418.34159.353117.115.42
2035ND18,254.7122,333.3929,323.83166.794017.955.56
CP20,597.3620,863.3429,350.85141.793144.534.36
EP17,040.7022,483.5330,362.85184.904024.555.71
Rate of Change (%)2035ND−9.019.80−3.604.6728.902.54
CP2.672.57−3.51−11.020.88−19.61
EP−15.0610.54−0.1816.0429.125.30
Table 7. Land structure and carbon stock projections to 2035.
ScenarioCroplandForest LandGrasslandWater BodiesBuilt-Up LandUnused Land
Area (km2)Carbon Storage (105 t)Area (km2)Carbon Storage (105 t)Area (km2)Carbon Storage (105 t)Area (km2)Carbon Storage (105 t)Area (km2)Carbon Storage (105 t)Area (km2)Carbon Storage (105 t)
200023,200.863338.3718,049.622882.5230,890.754786.21119.270.191839.07132.282.670.10
202020,061.462886.6420,340.563248.3930,418.344713.02159.350.253117.11224.215.420.21
ND18,254.712626.6722,333.393566.6429,323.834543.43166.790.274017.95289.015.560.21
CP20,597.362963.7520,863.343331.8829,350.854547.62141.790.233144.53226.194.360.17
EP17,040.702451.9922,483.533590.6230,362.854704.42184.900.294024.55289.495.710.22
Disclaimer/Publisher’s Note: The statements, opinions and data contained in all publications are solely those of the individual author(s) and contributor(s) and not of MDPI and/or the editor(s). MDPI and/or the editor(s) disclaim responsibility for any injury to people or property resulting from any ideas, methods, instructions or products referred to in the content.

