Article

Analysis of Airflow Organization in Buses Air-Conditioned by Direct Evaporative Coolers

1
School of Environmental & Municipal Engineering, Lanzhou Jiaotong University, Lanzhou 730070, China
2
Lanzhou Jiaotong University Design & Research Institute Co., Ltd., Lanzhou 730070, China
*
Author to whom correspondence should be addressed.
Sustainability 2025, 17(4), 1647; https://doi.org/10.3390/su17041647
Submission received: 7 November 2024 / Revised: 18 January 2025 / Accepted: 12 February 2025 / Published: 17 February 2025

Abstract

:
Considering the energy-saving advantages of the direct evaporative cooler (DEC) compared to the traditional air conditioning system (TAC), this study aims to indicate its ability to improve the thermal comfort and the indoor air quality of the bus compared to the bus air-conditioned by the traditional compressor system. Taking a bus in Lanzhou as the object, the numerical model and method were first verified by an experimental method. Then, numerical analyses were simultaneously carried out in both bus models, which were air-conditioned by TAC and DEC, respectively. The results showed that the thermal comfort of the bus air-conditioned by DEC is more satisfactory, and the indoor air quality is better. Additionally, the bus air-conditioned by DEC achieves a 43.7% improvement in the temperature efficiency and a 31.3% improvement in the ventilation efficiency compared to the bus air-conditioned by TAC. The conclusion will provide valuable insights into the application of DEC in buses in dry regions.

1. Introduction

Energy consumption in transportation amounts to about 30% of the total, of which, the traditional air-conditioning (TAC) of compression refrigeration in vehicles is responsible for a large proportion [1,2,3,4]. In these conditions, the construction of public transportation facilities air-conditioned by renewable energy should be encouraged and indoor comfort should be assessed. The direct evaporative cooler (DEC) could be an alternative way to air-condition buses in a way that offers greater energy savings and comfort by undertaking the total cooling load or partial load, but studies and applications are hardly found. Indoor airflow organization is the key factor in bus thermal comfort [5,6], including air vent settings [7,8] and operating parameters [9,10,11]. Additionally, it results in different temperature fields [12,13,14], velocity fields [15,16], and pollutant concentration fields [17,18,19], etc. And so, the research on the indoor airflow organization of the bus air-conditioned by DEC (DECB) is valuable because its airflow is high-humidity and is without air return compared that of the bus air-conditioned by TAC (TACB).
In recent years, the airflow organizations in various TACBs have been studied by testing and numerical methods to improve their flow fields and thermal comfort [20,21,22]. Currle J et al. numerically analyzed the indoor temperature field and velocity field of a TACB, and optimized its airflow organization by changing the air parameters [23]. Yang H et al. established a three-dimensional numerical model for a TACB, and studied the influence of air parameters on its temperature field and velocity field [24]. Using a highway, Kang Zhiqiang et al. [25] showed via a numerical method that the air supply speed has a greater impact on the indoor flow field of TACBs than the air temperature. Via the numerical simulation and the vehicle test, Sun Jianli of Anhui University of Technology explored the key factors affecting air quality and thermal comfort in a car air-conditioned by the traditional refrigerator and gave some improvement advice [26]. Regarding indoor environments of buildings and cabins, some studies were carried out on airflow characteristics [27,28,29], occupant comfort [30,31,32,33], and air diffusion characteristics [34,35,36].
DEC has received extensive attention, especially in dry areas. Many scholars demonstrated the energy-saving characteristics of DEC by comparing it with TAC. DEC was proven to have a significant energy-saving effect in Northwest China [37]. Sheng Xiaowen et al. concluded that the evaporative cooling system was more energy-efficient, and could effectively improve the air quality [38], especially in the Lanzhou area from June to September. This is because the power consumption of the DEC system is only 1/5 of that of the TAC system under the same cooling capacity. By analyzing the feasibility and economy of the air-conditioning system based on DEC in Lanzhou underground transportation, Fang Hong et al. [39] found that DEC has good social and economic benefits, and a wide range of application prospects, because its energy efficiency and the operation costs are about 50% lower than those of the TAC system.
In TACBs, it is necessary to lower the supply air temperature to below the air dew point temperature in order to dehumidify the environment. As such, the supply air volume and velocity from the TAC system are usually low; otherwise, the bus is uncomfortable. TAC system has a high level of energy consumption, and so, the return air outlet is necessary in order to reuse some indoor air to conserve energy. In DECBs, the supply air velocity can be higher because its temperature and humidity are higher, and the indoor air is freely exhausted by doors and windows gaps, which is beneficial for improving the thermal comfort and the air quality in bus carriages. DEC could be promising in the transportation field in order to deal with environmental challenges due to its energy savings, but it has received limited attention until now. In order to indicate the feasibility of DEC as a bus cooler, this paper first builds two bus models, respectively, air-conditioned by TAC and by DEC in Lanzhou City, and then their degrees of indoor comfort are numerically calculated and compared, including the temperature field, the velocity field, CO2 concentration, and the PMV thermal comfort indicator. The results will provide some guidance for the following experiment and promote the application of DEC in vehicles.

2. The Bus Numerical Model and Method

2.1. Physical Models

Based on actual references, the air outlet form in the TAC system is considered in this paper. It is necessary to lower the supply air temperature to below the air dew point temperature to dehumidify the environment, and so, the supply air volume and velocity from the TAC system is usually low; otherwise, the bus will be uncomfortable. Compared to the DEC system, the TAC system has higher energy consumption, and so, the return air outlet is necessary to reuse some indoor air to conserve energy. Because the air from the DEC system is more humidity and higher temperature than that of the air from the TAC system, it’s necessary to adopt a larger air volume and velocity of the supply air, and without the return air outlet, otherwise it will be also uncomfortable. And so, the supply air port of DEC system is set as a long slit shape and the indoor air is exhausted by unorganized means from some gaps.
The internal net size of the bus is x = 2.5 m (wide), y = 2.1 m (high), and z = 9 m (long), respectively, and its 23 chairs are seated with passengers. The comprehensive heat transfer coefficient of the bus enclosure wall is 4 W/(m2·K), and the bus bottom is set as the adiabatic condition. The front and rear sides of the bus are equipped with windows of sizes 1100 × 2500 mm and 900 × 2500 mm, respectively. On the door side, there are two windows sized 1100 × 2700 mm and two doors sized 950 × 1900 mm. On the other side, there is a window sized in 1100 × 9000 mm. Figure 1a shows the physical model of a TACB, whose 18 air supply inlets, sized 60 × 310 mm, are arranged in two lines along the length direction, 1 air outlet sized in 1000 × 1000 mm is arranged in the roof center, and gaps of 20 mm wide along the doors and windows are also used to exhaust air. Figure 1b shows the bus physical model of a DECB, whose two air supply inlets, sized 60 × 8300 mm, are arranged in two lines along the length direction, and the indoor air is randomly discharged through gaps 20 mm wide along doors and windows. The air inlets and outlets are marked with a red color in Figure 1. Figure 1c shows a simplified human model, whose heat dissipation is 108 W/p, and the mouth and nose are simplified as a 2 × 3 mm rectangle vent to breathe at an angle of 30° to the vertical direction.

2.2. The Numerical Model and Method

In order to directly pursue the research purpose without more interruptions, the simplification of several interference factors is usually needed to obtain a valid numerical model and results. Some assumptions applied in this paper are as follows: (1) the indoor air satisfies the Boussinesq hypothesis and is incompressible; (2) the indoor air flow is in a state of stable turbulence.

2.2.1. Numerical Equations

To carry out the numerical calculation, the following equations should be satisfied.
(1)
Continuity equation
u i / x i = S m
(2)
The momentum equation
ρ 0 u i / t + ρ 0 u j u i / x j = p / x i + μ 2 u i / x j 2 + ρ 0 g j 1 β T T 0 + S v
(3)
Energy equation
ρ 0 c p T / t + u j T / x j = k 2 T / x j 2 + S h + S E
(4)
Constituent conservation equation
( ρ Y i ) / t + · ( ρ ν Y i ) = · J i + R i + S i
(5)
The standard k-ε models
( ρ k ) / t + ( ρ k u i ) / x i = ρ μ + μ t / σ k k / x j / x j + G k + G b ρ ε Y M + S k
( ρ ε ) / t + ( ρ ε u i ) / x i = μ + μ t / σ ε ε / x j / x j + C 1 ε ε G k + C 3 ε G b / k C 2 ε ε 2 / k + S ε

2.2.2. Boundary Conditions

It is clear that the energy consumption of the DEC system is far lower than that of the TAC system under the same conditions, even by up to 80%, as indicated by the literature [38]. If the same air organization as that of the DEC system is adopted by the TAC system, such as a high temperature, a large air volume, and a lack of a return air outlet, energy consumption will be enormous, and if a return air outlet is adopted, the indoor humidity load will not be eliminated. And so, the characteristics of a low air supply temperature, a small air volume and velocity, and a return air outlet belong to the TAC system. And the characteristics of high air temperature, a large air volume and velocity, and a lack of a return air outlet belong to the DEC system.
Based on the summer meteorological parameters in Lanzhou and a full seating capacity condition, the airflow organizations of TACBs and DECBs are studied simultaneously. Apart from the boundary conditions at the inlets and the outlets of TACBs and DECBs, the other conditions for TACBs and DECBs are the same. According to “design code for heating ventilation and air conditioning of civil building”, the local average annual dry and wet bulb temperature in Lanzhou summer are adopted in this paper, which permits a high deviation of 50 h. The bus walls are set as wall boundary conditions, and the bottom is set as an adiabatic condition. The initial temperature and CO2 concentration in the bus are 31.2 °C and 300 ppm, respectively. The expiratory velocity, temperature, and CO2 concentration of the passenger model are 2.24 m/s, 34 °C, and 4% respectively. In TACBs, the air inlets are set as a velocity inlet boundary condition with a 20 °C temperature and a 1.12 m/s velocity, an air outlet of 1000 mm × 1000 mm is set as the pressure outlet condition with a positive pressure of 10 Pa, and the unorganized emission condition persists from door and window gaps. In DECBs, the air inlets are also velocity inlet conditions, with a 23.5 °C temperature and 1.58 m/s velocity, and the air outlets constitute the unorganized emission condition from doors and window gaps, with a positive pressure of 10 Pa. The supply air treatment processes used in both air conditioning modes are shown in Figure 2, where C is the mixing point, N is the indoor state point, O is the air supply state point, and W is the outdoor state point.

2.2.3. Evaluation Indicators

To explore the feasibility of DEC for the bus air-conditioning and its advantages compared to the TAC, the following indicators are used in addition to air velocity, temperature, and CO2 concentration in the carriage.
(1)
PMV Evaluation Index
PMV is a comprehensive thermal comfort index used to indicate the thermal sensation of the people in a thermal environment. Equation (7) gives its empirical regression equation.
P M V = 0.303 exp 0.036 M + 0.0275 × M W 3.05 5.733 0.007 M W P a 0.42 M W 58.2 0.0173 M 5.867 P a 0.0014 M 34 t a 3.96 × 10 8 f c l t c l + 273 4 t r ¯ + 273 4 f c l h c t c l t a
Table 1 shows the relationship between the PMV value and the thermal sensation, and 0 indicates that the satisfaction level of passengers for the bus thermal environment is not less than 90%.
(2)
Ventilation efficiency Ev
Ventilation efficiency Ev is usually used to evaluate the ability of an air conditioning system to discharge pollutants, and is defined by Equation (8).
E V = c e c s / c m e a n c s
(3)
Temperature efficiency ET
The temperature efficiency ET is usually used to evaluate the ability of air-conditioning systems to discharge surplus heat, which is defined by Equation (9).
E T = t e t s / t m e a n t s

2.3. The Mesh and Its Assessment

In this paper, the structured grid is used to discretize TACBs and DECBs. To look for a reasonable grid system balancing both calculation accuracy and the computer resources occupied, several grid systems are tried in turn. With the help of Airpak 3.0, the velocities along the intersection line of x = 0.4 m and z = 6.4 m in TACBs and DECBs under the grid systems of Grad 1 (40 W), Grad 2 (60 W), Grad 2 (100 W), and Grad 4 (150 W), respectively, are calculated and are shown in Figure 3. Table 2 shows the information between four grid systems and the maximum difference rate of the average flow speed between grid systems.
At the intersection lines of x = 0.4 m and z = 6.4 m, as the height increases, the speeds in four grid systems initially increase until the peak value at y = 1.6 m, resulting from the combined effects of the supply airflow, the exhaust airflow, respiration, and passengers, and then decrease. When the grid number increases from Grid 1 to Grid 4, the maximum difference rate of calculated results between two consecutive grid systems decreases. The relative error should be smaller and smaller as the grid is encrypted, but the simulated value always approaches its true value in a fluctuating manner. Considering the balance between the occupation of computer resource and the calculation accuracy, the 0.07 m grid system is selected in this paper. When Grid 3, whose grid size is mainly 0.07 m, is used, the balance point between calculation accuracy and computer resource occupied is thought to be obtained, and the grid size of 0.01 m is used in some areas with significant parameter change, such as the outlet. And so, Grid 3 is finally selected to carry out the subsequent simulations.

2.4. The Numerical Model and Method Verification

To validate the numerical method, this study constructed a carriage model in a laboratory, as shown in Figure 4. This model is 4.5 × 2.5 × 2 m in size and owns 20 seats. The air supply vents are on the model’s top, and the exhaust vents are located at the model’s lower part on both sides. A controllable electric heating membrane is fully attached outside the carriage wall to simulate heat gained from the external environment.
In the test process, twenty volunteers were invited to sit quietly in the carriage model. The air supply temperature was controlled at 24 ± 0.5 °C, and the air supply velocity was maintained at 3.4 ± 0.1 m/s. The outer wall temperature was set at 31.2 °C based on the outdoor temperature in the summer in Lanzhou city. Measurement points are located at heights of 0.4 m, 0.8 m, 1.2 m, 1.6 m, and 2.0 m along lines 1, 2 and 3 respectively, which are the cross-sectional lines of section A-A′, B-B′ and C-C′, and section D-D′, as shown in Figure 4. Air temperature and velocity, as well as the carbon dioxide concentration at each point, were detected by the hot-wire anemometer of TES-1340 (Taishi Electronics Industry Co., Ltd., Taipei City, China) and the portable diffusion gas detector of MS104K-CO2 (Shenzhen Yiyuntian Electronics Co., Ltd., Shenzhen, China). At the same time, the parameters mentioned above were calculated at the same conditions using the numerical method outlined in this paper. The measurement accuracy and uncertainty of the instrument are shown in Table 3. Considering the errors caused by experimental instruments and human operation, this paper uses the average value of three measurement results. Test results and numerical results are presented in Figure 5. Figure 5a shows the air velocity and temperature along line 1, Figure 5b shows that along line 2, and Figure 5c shows that along line 3.
With a rising height, the temperatures along 3 lines increase because hot air rises. At the height of 0.6 m, there are drastic increases in temperature along line 1 and line 3 due to passenger heat and respiration introduced. The air velocity along 3 lines decreases with raising height, but there are some fluctuations due to the combined action of passenger respiration and heat dissipation, and airflow from nozzles.
The change trends of the numerical results and test values are generally consistent, and some differences may arise from difference in passenger heat dissipation and in the model wall materials of both conditions. Considering a maximum relative error of less than 5%, the numerical method is used in this paper.

3. Results and Discussion

In this paper, the results at three representative planes of 0.3 m, 1.2 m and 1.7 m in TACBs and DECBs are output and compared, which corresponds to the lower leg region, the breathing zone of a seated passenger and the head area of a standing passenger, including the temperature, velocity, CO2 concentration, PMV, EV, and ET.

3.1. Parameters at 1.7 m Section

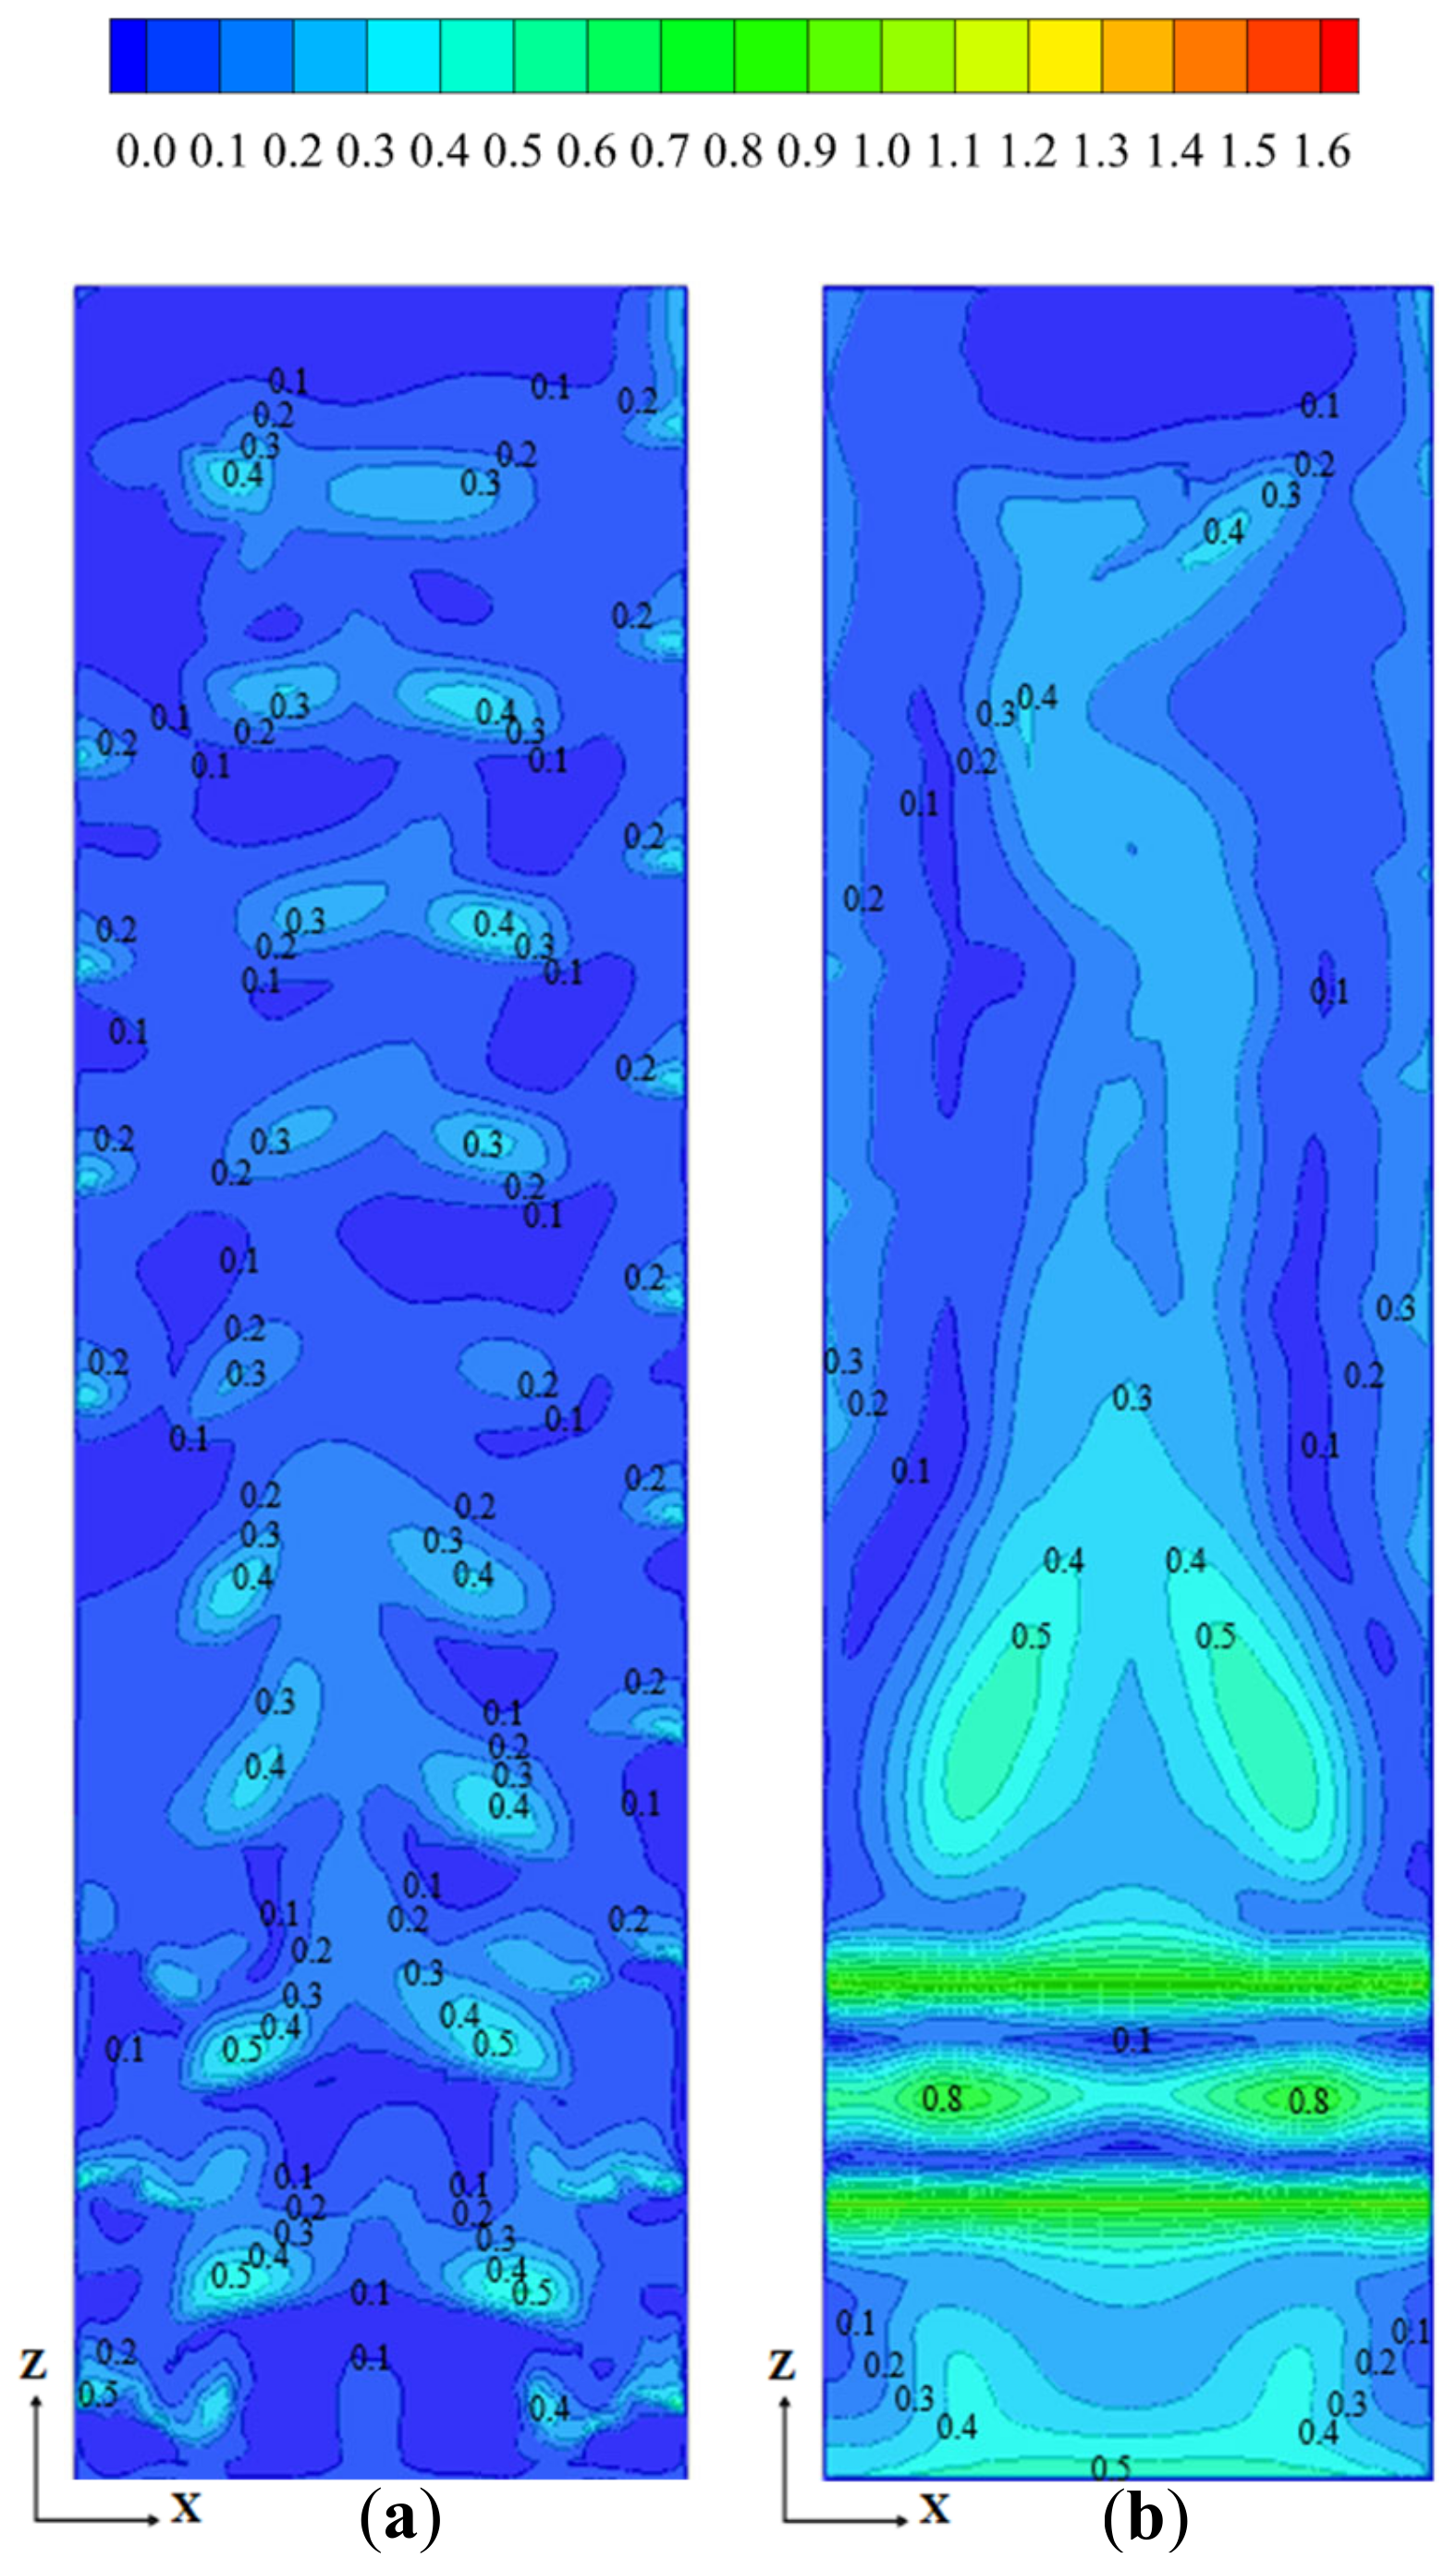
3.1.1. Velocity Distribution at 1.7 m Section

Figure 6 shows the velocity distributions at 1.7 m planes of both models. According to ASHRAE standards [40], the airflow velocity in enclosed space should be from 0.2 m/s to 0.5 m/s. In TACBs, the airflow velocity at the 1.7 m plane is relatively low and uniform because it is necessary to adopt low air velocity at the inlet and outlet. At the same time, because the return air outlet and the air supply inlet are both located at the carriage’s top, most of the supply of fresh air cannot flow into the lower parts. The maximum velocity is 0.4 m/s in the aisle area and the minimum velocity is 0.1 m/s in most of the area. In DECBs, because the air supply velocity at inlet is larger and passengers in bus rear is more, the uneven distribution of airflow and larger velocity in bus rear are observed, but this is beneficial to improve passenger comfort in hot summer. The maximum velocity is 0.8 m/s in a densely populated area at the carriage rear and the minimum velocity is 0.1 m/s at part of sides and front area.

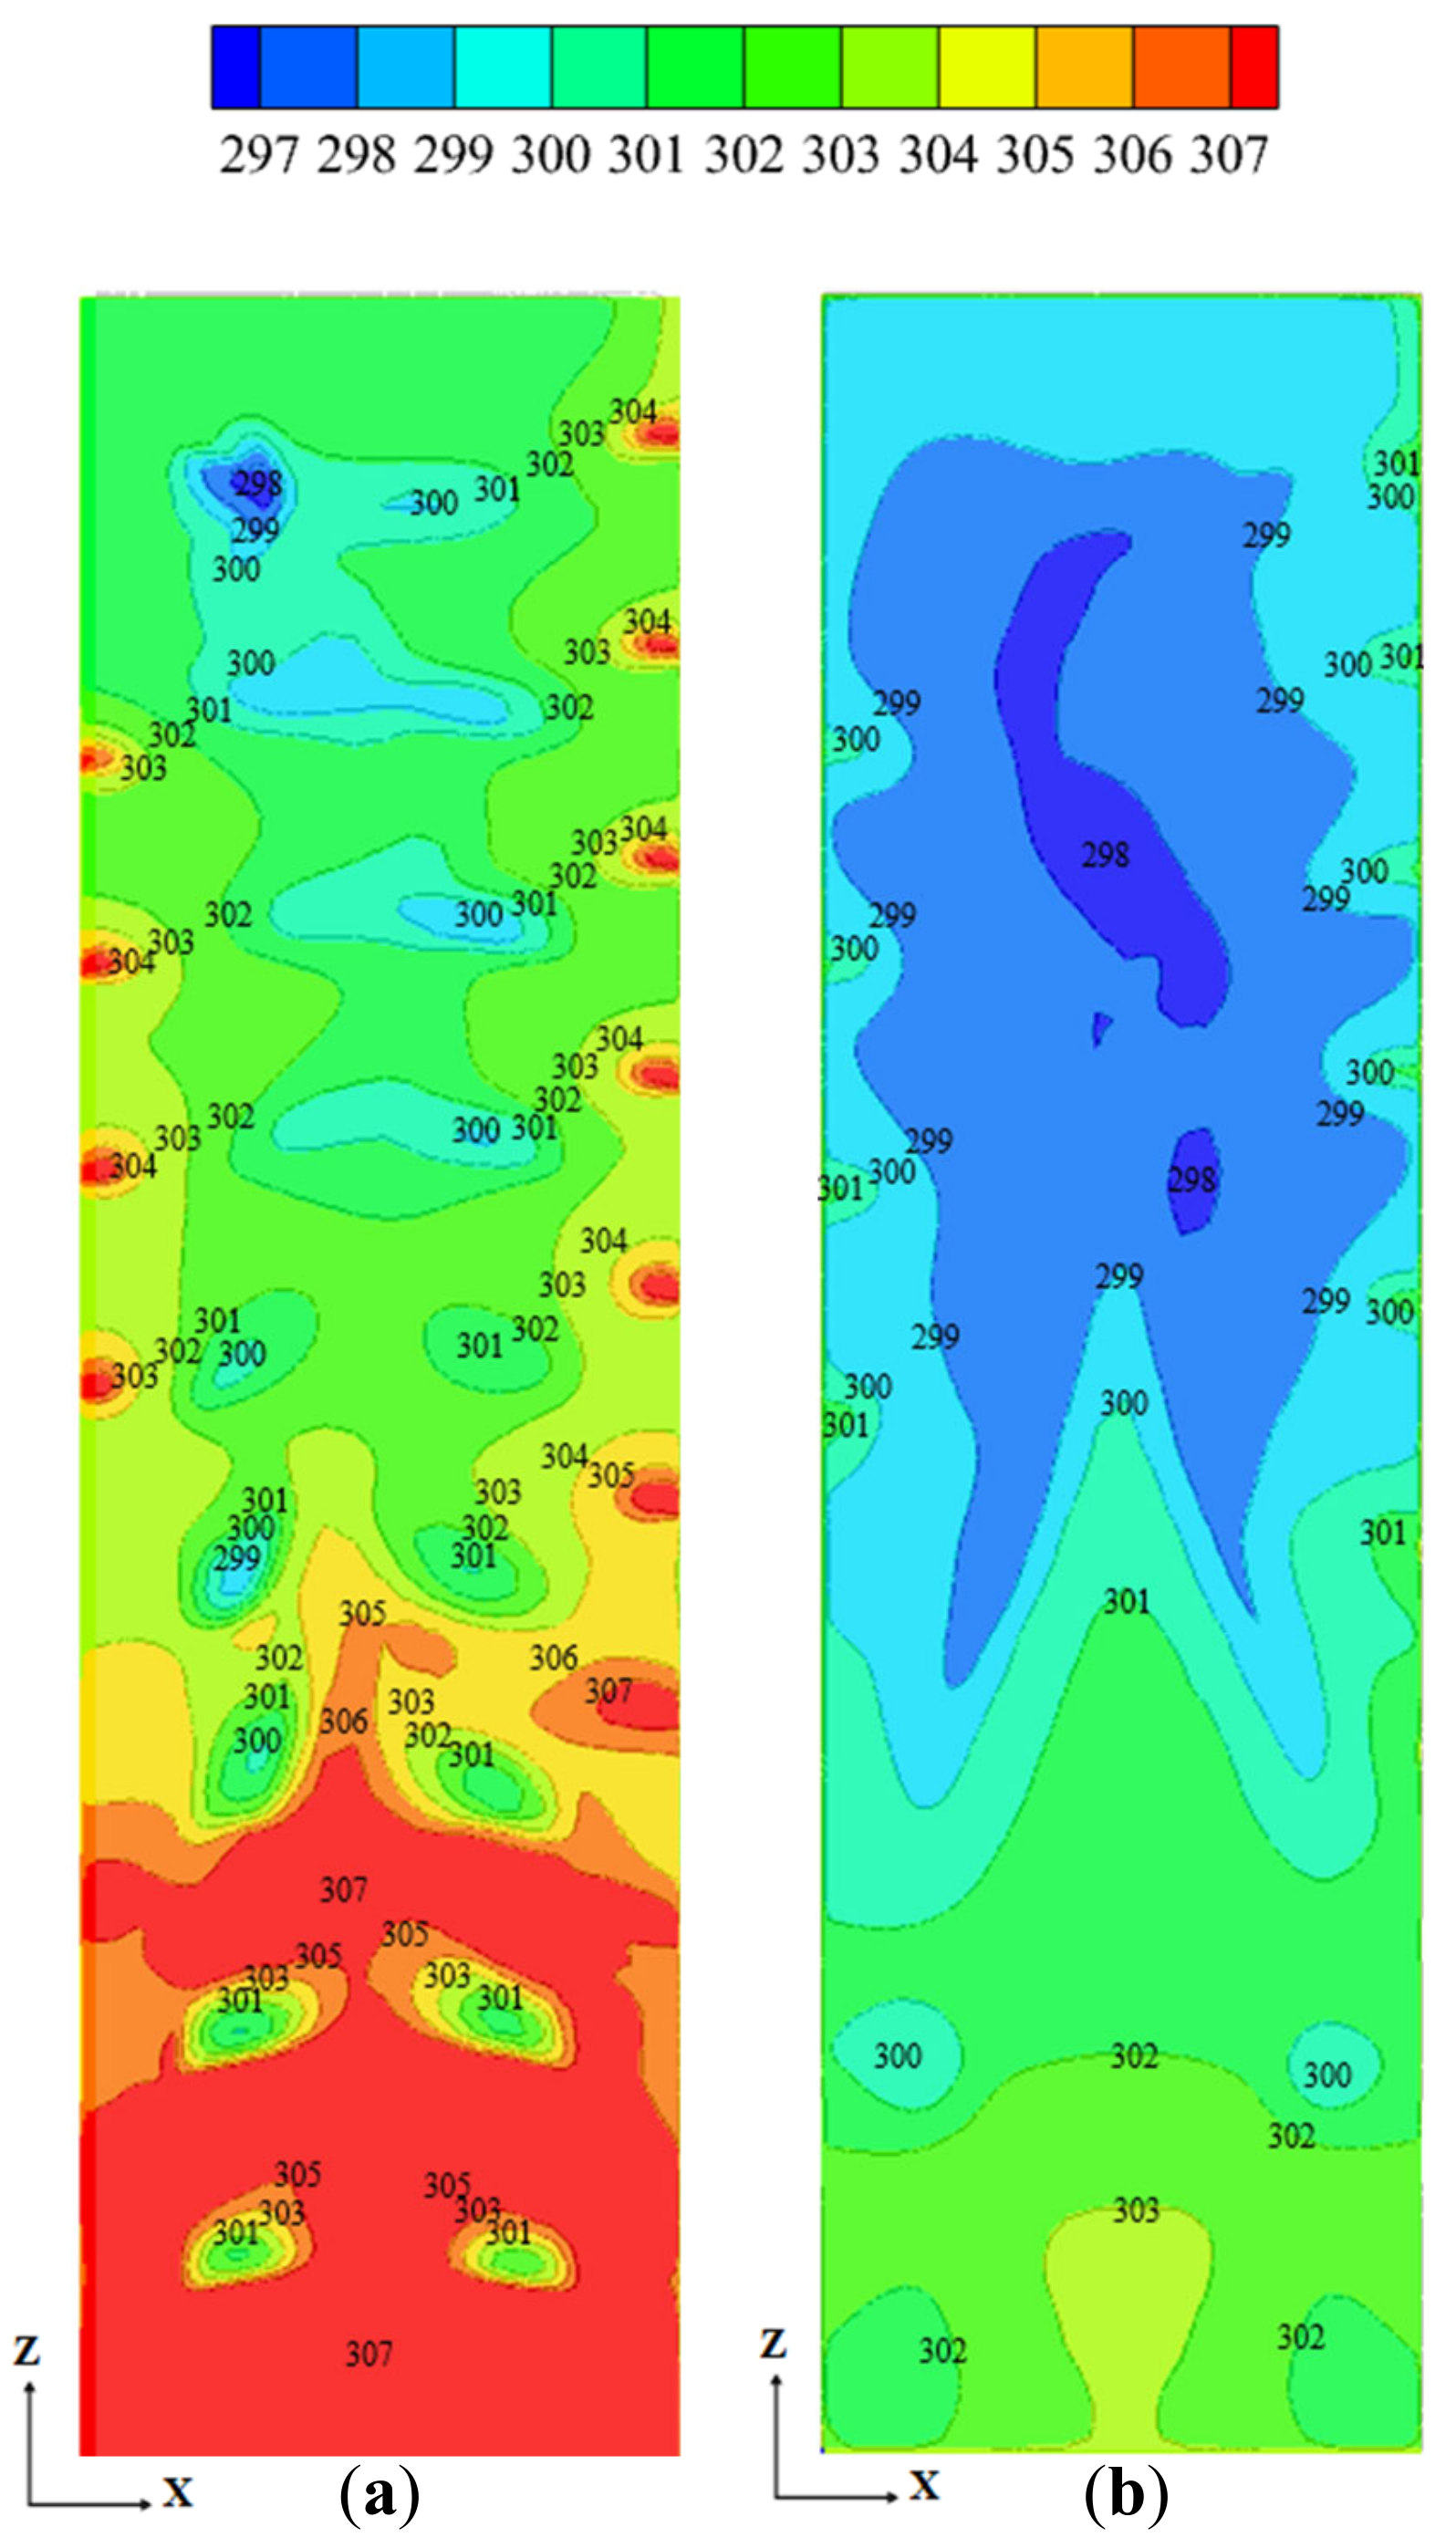
3.1.2. Temperature Distribution at 1.7 m Section

In the rear section of the carriage where passenger density is higher, more efficient air circulation should be allowed for. According to the technical requirement outlined in “Technical Conditions for Passenger Car Air Conditioning Systems [41]”, the temperature difference in the carriage should not exceed 4 °C. Figure 7 shows the temperature distributions at 1.7 m planes of both models. Because most passengers sit at the rear, the temperature in this section is higher than that in the front section.
Although the air supply temperature is lower in TACBs, the overall temperature is higher and the temperature difference is more significant between the front and rear sections, at approximately 8 °C, which is uncomfortable and not in accordance with the standard regulation. The highest temperature is 34 °C at the rear of TACBs and the lowest temperature is 25 °C at the front part, which may result from the low air velocity at the inlet of TACBs. DECBs are characterized by higher supply air temperature and velocity, and the circuit airflow is exhausted directly by gaps without outlets, which facilitates more effective heat exchange and air circulation, and a comfortable experience in the carriage. Although the temperature of the air supplied is higher than that in TACBs, the air temperature in the carriage is lower and more evenly distributed, typically ranging between 24 °C and 26 °C, which can effectively improve the thermal comfort of passengers.

3.1.3. PMV Analysis at 1.7 m Section

The greater the PMV difference with 0, the lower the indoor comfort level is. The distribution of PMV indexes at the1.7 m plane in both models is shown in Figure 8. In TACBs, the PMV distribution is very uneven and very few areas can better meet the comfort requirement of passengers, even in the front section. Particularly, passengers in most rear sections could feel very hot due to the PMV approaching 3. In DECBs, the thermal comfort level is relatively high because the PMV in about 70% of the areas is between −0.5 and 0.5, and few passengers in the rear section can feel slightly warm because the PMV in these areas tends to 1.25. The results indicate that the passengers in DECBs will have better thermal comfort in the summer.

3.1.4. CO2 Concentration at 1.7 m Section

CO2 in the bus mainly comes from passenger respiration, which is also influenced by the distance from air vents. According to the conditions required in “Public health indicators and limit requirements [42]”, the CO2 concentration in the carriage should not exceed 1500 ppm. In TACBs, in order to reduce the energy consumption of air conditioning, the tightness of its doors and windows is usually good, and fresh air is always insufficient. When the CO2 concentration in the bus is greater than the conventional value, passengers will be drowsy and dizzy. In addition, the CO2 concentration is usually proportional to other contaminants released by passengers.
Figure 9 depicts the CO2 concentration at the plane of 1.7 m in both models. CO2 concentration in the rear section is more than that in the front section, and gradually increases along the carriage height due to the thermal plume floating around passengers. The average CO2 concentration is between 2300 ppm and 5300 ppm in TACBs, which is uncomfortable and does not meet the requirements in the standard. In DECBs, the CO2 distribution is more uniform and lower concentration due to better airflow organization than that in TACBs. The CO2 concentration is between 800 ppm and 1800 ppm, and the areas with slightly high CO2 concentrations can be easily improved by slightly increasing the air volume. This also shows that the DEC system and its airflow organization are suitable for the bus.

3.2. Result Comparison at Various Heights

To indicate the advantages of the evaporative cooler in DECBs over the compressed air conditioner in TACBs, the parameters mentioned above on planes with three heights in both models are compared, and results are shown in the following tables. In these, the standard deviation σ is used to indicate the parameter uniformity in a thermal environment, such as temperature or air velocity, which can be calculated by Equation (10). The air parameter distribution is uniform when σ is small, which is desirable.
σ = i = 1 N X i μ 2 / N

3.2.1. Comparison of Velocities, Temperatures, and PMVs

Table 4 shows the velocities at three planes in both models, including the maximum velocity, the minimum velocity, the mean velocity, and the standard deviation σ of velocity. Because of the respiration influence of sitting passengers, the velocities at the 1.2 m plane are larger than that at the 1.7 m plane. In TACBs, because the air velocity at the inlet is low (otherwise, it is uncomfortable due to low air temperature at the inlet), the air speed in cabins is mostly in the range of 0–0.1 m/s and the air velocities in several zones are near zero. This situation is disadvantageous in terms of improving passenger comfort and diluting the CO2 concentration. In DECBs, the air mean velocity is larger than 100% that in TACBs, but velocities in most areas can meet the standard requirements. Although velocities in several areas are greater than the standard requirements, this situation is favorable in terms of improving the thermal comfort of passengers in hot summers.
Table 4 also shows the temperatures at three planes in both models, including the highest temperature, the lowest temperature, the mean temperature, and the standard deviation σ of temperature. Because hot air floats up, the temperature rises gradually. There is noticeable temperature stratification along the height of the cabin, with poorer heat exchange towards the bottom. At the 1.2 m plane, heavily influenced by breathing airflow, the overall temperature is higher than at other planes. In TACBs, some local areas even approach 309 K and exhibit significant temperature gradients. In contrast, DECBs lowers the overall temperature at each plane by about 3 °C compared to TACBs, offering better uniformity and effectively reducing the heat plume effect around the human body.
In addition, Table 4 shows PMVs at three planes in both models, including the maximum, the minimum, the mean value, and its standard deviation σ. It is clear that the thermal comfort is very poor in TACBs with significant PMV gradients, and most areas can be classified as “hot”. In DECBs, a smaller thermal comfort gradient is obtained, which can more effectively meet the comfort needs of passengers.

3.2.2. Comparison on CO2 Concentrations

Table 5 shows CO2 concentrations at three planes in both models, including the highest value, the lowest value, the mean value, and the standard deviation σ. At the passenger breathing section, which is about a 1.2 m height, the CO2 concentration is significantly higher than that of planes at other heights. Especially in TACBs, the overall CO2 concentration in the carriage is far higher than the value sought because of the low air velocity at inlet and the well tightness of carriage. In DECBs, the problem that the CO2 concentration surpasses the norms in TACBs is significantly addressed, and CO2 concentrations in most regions are satisfactory.

3.3. Other Evaluation Index

The more the energy utilization efficiency (ET) and the ventilation efficiency (EV), the less the energy is consumed by air conditioning to ventilate excess heat and the air pollutants. Table 6 shows the ET and EV of both air conditionings used in the two models. Compared to that in TACBs, the ET of air conditioning in DECBs is improved by 43.7%, and EV is increased by 31.3%, which means better comfort and air quality with less energy and a lower cost.

4. Conclusions

Considering the enormous energy consumption in the TAC systems of vehicles and the higher energy efficiency of DEC systems, this paper indicates that the comfort improvement caused by DEC systems in the bus cabinet environment is better than that of TAC systems by a numerical method. The main conclusions are drawn as follows:
  • By bearing the partial air-conditioning load of vehicles, DEC systems offer low energy consumption than vehicle TAC systems.
  • The numerical method provided in this paper is effective are solving the air organization problem of vehicles.
  • Compared to the TAC system, the DEC system has a positive effect in terms of improving indoor temperature, velocity, thermal comfort, and air quality, with an energy efficiency improvement of 43.7%. The ventilation efficiency is improved by 31.3%, which can effectively avoid the spread of some respiratory viruses.
The conclusions can guide subsequent research and promote the use of DECBs.

Author Contributions

Conceptualization, W.Z.; Methodology, W.Z.; Software, M.L.; Formal analysis, M.L. and L.D.; Investigation, M.L. and L.D.; Resources, L.D.; Data curation, M.L.; Writing—original draft, M.L.; Writing—review & editing, W.Z.; Visualization, L.D.; Supervision, W.Z. All authors have read and agreed to the published version of the manuscript.

Funding

This research received no external funding.

Informed Consent Statement

Not applicable.

Data Availability Statement

Data is not available due to privacy restrictions.

Conflicts of Interest

Author Lin Duan was employed by the company Lanzhou Jiaotong University Design & Research Institute Co., Ltd. The remaining authors declare that the research was conducted in the absence of any commercial or financial relationships that could be construed as a potential conflict of interest.

Nomenclature

DECdirect evaporative coolerWmechanical work done by the human body (W/m2)
TACtraditional air conditioningfarea coefficient
DECBbus air-conditioned by DEChconvective heat transfer (W/m2·K)
TACBbus air-conditioned by TACEefficiency
ρgas density (kg/m3)caverage pollutant concentration (ppmv)
ttime (s)taverage temperature (K)
ufluid velocity (m/s)σstandard deviation (in Equation (10))
pstatic pressure (Pa)Noverall quantity
μdynamic viscosity (Pa·s) (in Equation (5))Xpopulation value
ggravity (m/s2)μpopulation mean (in Equation (10))
βThermal expansion coefficientSubscripts
TTemperature (K)iThe subscripts i = 1, 2 and 3 denote the x, y, and z directions, respectively
cpIsobaric specific heat capacity (J/kg·K)jThe subscripts i = 1, 2 and 3 denote the x, y, and z directions, respectively
FOther source termmQuality
hEnthalpy value (J/kg)0Reference
kThermal conductivity generated (W/m·K)vMomentum
SSource termhVolume term
YThe predicted mass fraction in the convection-diffusion equationEEnergy
vVelocity (m/s)kThe average velocity gradient
RThe net chemical rate of the chemical reactionbBuoyancy
JDiffusion flux (kg/m2·s)aAmbience
σThe turbulent Prandtl numbers (in Equation (5))clClothing surface
GThe turbulent kinetic energy (m2/s2)rRadiation
kTurbulent energy (m2/s2)tTurbulent
εTurbulent kinetic energy dissipation rate (m2/s2)VVentilation
CThe empirical coefficient of dissipation rateTTemperature (K)
PMVPredicted Mean VoteeExhaust outlet
MHuman Metabolic Rate (W/m2)sAir supply inlet
meanMean value in the bus

References

  1. Cigarini, F.; Fay, T.A.; Artemenko, N.; Göhlich, D. Modeling and experimental investigation of thermal comfort and energy consumption in a battery electric bus. World Electr. Veh. J. 2021, 12, 7. [Google Scholar] [CrossRef]
  2. Wen, Y. Performance Evaluation and Energy Consumption Optimization of Pure Electric Buses Considering Thermal Management. Ph.D. Thesis, Chang’an University, Xi’an, China, 2024. [Google Scholar]
  3. Zhang, H.; Dai, L.; Xu, G.; Li, Y.; Chen, W.; Tao, W. Studies of air-flow and temperature fields inside a passenger compartment for improving thermal comfort and saving energy. Part II: Simulation results and discussion. Appl. Therm. Eng. 2009, 29, 2028–2036. [Google Scholar] [CrossRef]
  4. Akçay, İ.H.; Asghar, H.B.A.; Gürbüz, H.; Ali, Q.A. Analysis of the Thermal Comfort Parameters in the Passenger Cabin of a Bus by Finite Element Method (ANSYS). Int. J. Automot. Eng. Technol. 2016, 5, 115–124. [Google Scholar]
  5. Guo, B. Study on Formaldehyde Pollution and Thermal Comfort in the Cabin of Plateau City Bus. Ph.D. Thesis, Kunming University of Science and Technology, Kunming, China, 2020. [Google Scholar]
  6. Deng, F. Research on Flow Field and Passenger Comfort in EMU Compartment. Ph.D. Thesis, Southwest Jiaotong University, Chengdu, China, 2019. [Google Scholar]
  7. Xiang, L. Study on Airflow Distribution Characteristics and Dynamic Thermal Comfort in Air-Conditioned Bus. Ph.D. Thesis, Central South University, Changsha, China, 2011. [Google Scholar]
  8. Cheng, G. Research on Air Distribution Optimization and Passenger Thermal Comfort of Air-Conditioned Bus on Highway. Ph.D. Thesis, Donghua University, Shanghai, China, 2014. [Google Scholar]
  9. Zhou, K.; Hu, G.; Lang, X. Analysis of velocity field and temperature field in pure electric buses based on air supply parameters. Automot. Pract. Technol. 2017, 16, 112–115. [Google Scholar]
  10. Peng, Q.; Huang, J.; Liu, J.; Chen, D.; Zhang, G. Study on the influence of air supply parameters of bus air conditioning on indoor flow field. Cool. Air Cond. 2016, 30, 716–719. [Google Scholar]
  11. Wang, T.; Zhao, K.; Lu, Y.; Zhu, Y.; Shi, F.; Jiang, C.; Wang, Y.; Yang, B. The airflow characteristics and thermal comfort evaluation in high-speed train cabin with mixing ventilation: An experimental and numerical study. Build. Environ. 2024, 250, 111187. [Google Scholar] [CrossRef]
  12. Zhu, S.; Demokritou, P.; Spengler, J. Experimental and numerical investigation of micro-environmental conditions in public transportation buses. Build. Environ. 2010, 45, 2077–2088. [Google Scholar] [CrossRef]
  13. Zhu, X.; Lei, L.; Wang, X.; Zhang, Y. Air quality and passenger comfort in an air-conditioned bus micro-environment. Environ. Monit. Assess. 2018, 190, 276. [Google Scholar]
  14. Pirouz, B.; Mazzeo, D.; Palermo, S.A.; Naghib, S.N.; Turco, M.; Piro, P. CFD investigation of vehicle’s ventilation systems and analysis of ACH in typical airplanes, cars, and buses. Sustainability 2021, 13, 6799. [Google Scholar] [CrossRef]
  15. Hossam, M.; Fouad, M.; Abou-Zaid, A. Numerical investigation of airflow patterns and thermal comfort in a bus cabin. SAE Int. J. Passeng. Cars-Mech. Syst. 2020, 13, 145–156. [Google Scholar] [CrossRef]
  16. Alahmer, A.; Mayyas, A.; Mayyas, A.A.; Omar, M.A.; Shan, D. Vehicular thermal comfort models; a comprehensive review. Appl. Therm. Eng. 2011, 31, 995–1002. [Google Scholar] [CrossRef]
  17. Lin, X.L.; Zhang, Y.Y.; Liu, J.X. Numerical simulation of droplet transport in bus. J. Northeast. Univ. Nat. Sci. 2021, 42, 726. [Google Scholar]
  18. Shen, Y.; Li, C.; Dong, H.; Wang, Z.; Martinez, L.; Sun, Z.; Handel, A.; Chen, Z.; Chen, E.; Ebel, M.; et al. Community outbreak investigation of SARS-CoV-2 transmission among bus riders in Eastern China. JAMA Int. Med. 2020, 180, 1665–1671. [Google Scholar] [CrossRef]
  19. Yang, X.; Ou, C.; Yang, H.; Liu, L.; Song, T.; Kang, M.; Lin, H.; Hang, J. Transmission of pathogen-laden expiratory droplets in a coach bus. J. Hazard. Mater. 2020, 397, 122609. [Google Scholar] [CrossRef]
  20. Jin, S.; Ma, C.; Yuan, X. Numerical simulation analysis of air distribution in bus air-conditioned compartment. Refrig. Air Cond. 2008, 397, 21–24. [Google Scholar]
  21. He, L.; Wu, C.; Li, Q.; Jiang, Z. Numerical simulation of car interior flow field. Comput. Simul. 2016, 33, 166–170. [Google Scholar] [CrossRef]
  22. Huang, G.Y. Numerical Simulations in Areas of Fluid Dynamics, Thermal Dynamics and Nfatercial Scierce. Ph.D. Dissertation, National Taiwan University, Taiwan, China, 2003. [Google Scholar]
  23. Currle, J.; Maué, J. Numerical Study of the Influence of Air Vent Area and Air Mass Flux on the Thermal Comfort of Car Occupants. In Proceedings of the IOP Conference Series Earth and Environmental Science, Changsha, China, 18–20 September 2020. [Google Scholar]
  24. Yang, H.; Wang, Y.; He, T. The Analysis on the Effect of Passenger car Air Conditioning and Distribution with Different Inlet Parameters. In Proceedings of the International Conference on Information Sciences, Chongqing, China, 11–13 April 2015. [Google Scholar]
  25. Kang, Z.; Zhang, N.; Xia, X.; Sun, J.; Yu, Z. Study on the influence of air supply parameters on the airflow organization of bus compartment. Energy Sav. 2020, 11, 39. [Google Scholar]
  26. Sun, J. Investigation of Passenger Car Interior Environment Comfort and Optimization of Air Distribution. Ph.D. Thesis, Anhui University of Technology, Maanshan, China, 2015. [Google Scholar]
  27. Wang, C.; Liu, J.; Li, J.; Guo, Y.; Jiang, N. Turbulence characterization of instantaneous airflow in an aisle of an aircraft cabin mockup. Build. Environ. 2017, 116, 207–217. [Google Scholar] [CrossRef]
  28. Cheng, F.; Zhang, S.; Gao, S.; Tian, X.; Liao, C.; Cheng, Y. Experimental investigation of airflow pattern and turbulence characteristics of stratum ventilation in heating mode. Build. Environ. 2020, 186, 107339. [Google Scholar] [CrossRef]
  29. Pichardo-Orta, F.A.; Patiño-Luna, O.A.; Vélez-Cordero, J.R. Natural Ventilation in Urban Buses: From Negative Pressure To Velocity-Driven Dispersion of Aerosols. Sci. Rep. 2022. [Google Scholar] [CrossRef]
  30. Nada, S.A.; El-Batsh, H.M.; Elattar, H.F.; Ali, N.M. CFD investigation of airflow pattern, temperature distribution and thermal comfort of UFAD system for theater buildings applications. J. Build. Eng. 2016, 6, 274–300. [Google Scholar] [CrossRef]
  31. Mishra, A.K.; Derks, M.T.H.; Kooi, L.; Loomans, M.G.; Kort, H.S. Analysing thermal comfort perception of students through the class hour, during heating season, in a university classroom. Build. Environ. 2017, 125, 464–474. [Google Scholar] [CrossRef]
  32. Qin, Y.; Li, Z.; He, Z. Study on human thermal comfort in passenger compartment under swirl air supply. J. Wuhan Univ. Technol. 2024, 46, 117–124+131. [Google Scholar]
  33. Li, S.; Mao, H.; Xie, Z.; Zheng, J. Investigation and analysis of thermal comfort of air-conditioned bus occupants. In Proceedings of the 21st Academic Exchange Conference of Building Thermal Power Branch of China Architecture Society, Anhui, China, 5–6 September 2019; Volume 5. [Google Scholar]
  34. Peng, P.; Zhang, C.; Li, W.; Pomianowski, M.; Gong, G.; Fang, X.; Chun, L.; Guo, R. Investigation on indoor airflow and contaminant dispersion of diffuse ceiling ventilation in heating and cooling modes. Build. Eng. 2020, 80, 107972. [Google Scholar] [CrossRef]
  35. Ramajo, D.E.; Corzo, S.F. Airborne transmission risk in urban buses: A computational fluid dynamics study. Aerosol Air Qual. Res. 2022, 22, 1–20. Available online: https://ri.conicet.gov.ar/handle/11336/204576 (accessed on 11 February 2025). [CrossRef]
  36. Liu, M.; Liu, J.; Cao, Q.; Li, X.; Liu, S.; Ji, S.; Lin, C.H.; Wei, D.; Shen, X.; Long, Z.; et al. Evaluation of different air distribution systems in a commercial airliner cabin in terms of comfort and COVID-19 infection risk. Build. Environ. 2022, 208, 108590. [Google Scholar] [CrossRef]
  37. Kovan; Huang, X.; Luo, R.; Ma, J.; Qiao, X. Discussion on the application form of evaporative cooling technology in the field of rail transit. Cool. Air Cond. 2021, 35, 401–406. [Google Scholar]
  38. Sheng, X.; Huang, X.; Qu, Y. Applicability of evaporative cooling air conditioning system in subway. Clean Air Cond. Technol. 2013, 2, 13–16. [Google Scholar]
  39. Fang, H.; Cai, S. Design and Application of Direct Evaporative Cooling Air Conditioning System in Underground Traffic Space. Build. Struct. 2013, 202, 200–203. [Google Scholar]
  40. ASHRAE Standard 189.1-2011; Sustainable Building Design Guidelines for High-Performance Green Buildings. American Society of Heating. Refrigerating and Air-Conditioning Engineers: Atlanta, GA, USA, 2011.
  41. JT/T 216-2006; Technical Conditions for Passenger Car Air Conditioning Systems. Museum of National Standards Guan: Beijing, China, 2006.
  42. GB 37488-2019; Public Health Indicators and Limit Requirements. The National Health Commission of China: Beijing, China, 2019.
Figure 1. Models: (a) TACB; (b) DECB; (c) passenger.
Sustainability 17 01647 g001
Figure 2. Supply air treatment processes (a) of TACBs and (b) DECBs.
Sustainability 17 01647 g002
Figure 3. Velocities in different grid systems.
Sustainability 17 01647 g003
Figure 4. The locations of test points.
Sustainability 17 01647 g004
Figure 5. The verification of the numerical method (a) along Line 1, (b) along Line 2, (c) and along Line 3.
Sustainability 17 01647 g005
Figure 6. Velocities at y = 1.7 m: (a) TACB; (b) DECB.
Sustainability 17 01647 g006
Figure 7. Temperatures at y = 1.7 m: (a) TACB; (b) DECB.
Sustainability 17 01647 g007
Figure 8. PMV at y = 1.7 m: (a) TACB; (b) DECB.
Sustainability 17 01647 g008
Figure 9. CO2 at y = 1.7 m: (a) TACB; (b) DECB.
Sustainability 17 01647 g009
Table 1. PMV values.
PMV−3−2−10123
MeaningColdCoolSlightly coolNeutralSlightly warmWarmHot
Table 2. Deviation rate of average flow speed at y = 1.2 m between grid systems.
Grid Size
(m)
Grid Number
(W)
Average Speed
(m/s)
Maximum Deviation Rate
(%)
0.11410.110/
0.09650.1154.3
0.071030.1182.7
0.051540.1171.2
Table 3. Test instrument parameters.
NameMeasurement ObjectMeasurement RangeMeasurement Accuracy
TES-1340Velocity0.1~30.0 m/s±3%
MS104K-CO2Temperature−40~120 °C±0.5 °C
CO2 concentration0~15,000 ppm±1 ppm
Table 4. Temperature results.
Planes
(m)
y = 1.7y = 1.2y = 0.3
TACBDECBTACBDECBTACBDECB
V (m/s)Max0.5810.9451.5531.6030.2490.935
Min0.0140.0430.1210.156800.034
Mean0.1420.2660.1180.2300.0890.177
σ0.08340.17300.07260.15000.03830.1530
T (°C)Max35.0529.7835.6329.2531.2429.36
Min24.3524.6126.2424.7727.3925.09
Mean27.9026.7030.1027.0029.6026.80
σ2.281.362.691.863.362.40
PMVMax2.641.7332.162.841.82
Min−0.34−0.260.47−0.321.160.57
Mean1.870.542.050.801.930.85
σ0.7490.3920.7280.5810.6870.551
Table 5. CO2 concentration results.
Y
(m)
y = 1.7y = 1.2y = 0.3
TACBDECBTACBDECBTACBDECB
CO2
(ppm)
Max5605229531,70929,99538071831
Min189787229618463054814
Mean28001028344013502450836
σ5103091190986247268
Table 6. Evaluation Indicators.
ETEV
In DECB1.2851.368
In TACB0.8941.042
Disclaimer/Publisher’s Note: The statements, opinions and data contained in all publications are solely those of the individual author(s) and contributor(s) and not of MDPI and/or the editor(s). MDPI and/or the editor(s) disclaim responsibility for any injury to people or property resulting from any ideas, methods, instructions or products referred to in the content.

