Abstract
Bolivia’s national parks, with their rich biodiversity and natural landscapes, have great potential to contribute to their own financial sustainability, and tourism is one of the most promising sustainable activities that can make this possible. Entrance fees to national parks are a vital source of income for the National Service of Protected Areas, yet a significant financial gap remains. This study estimates tourists’ willingness to pay (WTP) for increased entrance fees in two protected areas, comparing data from 2019 and 2023 to assess the effect of COVID-19 on WTP. Using the contingent valuation approach, we found that tourists’ profiles and their WTP have shifted between 2019 and 2023. However, there was no consistent trend across the protected areas, highlighting the challenges and specific impacts of the pandemic on tourists WTP. Nevertheless, the findings can help inform pricing strategies aimed at enhancing the financial sustainability of Bolivia’s protected areas, supporting broader conservation goals both nationally and globally.
1. Introduction
Protected areas (PAs) play a crucial role in preserving biodiversity and ecosystem services, making them an essential tool for nature conservation [1]. However, despite their known significance, PAs often lack adequate funding, which directly impacts management effectiveness and conservation efforts [2,3].
In this context, tourism in PAs has been a positive contributor, mainly through entrance and user fees, which help increase resources for these areas [4]. Although charging fees to access natural and public lands can be controversial [5], several studies have demonstrated the benefits of entrance fees—not only for generating revenue but also for enhancing visitors’ overall experience [6,7,8,9,10,11,12].
However, setting an optimal entrance fee scheme, where both revenues and visitor satisfaction are maximized while achieving social objectives, remains a challenge [13]. Most studies to date have used survey-based approaches, such as the contingent valuation approach, to estimate the optimal entrance fee [14,15,16] in which those objectives are achieved—or, at least, attempted to be achieved.
The COVID-19 pandemic has profoundly impacted global tourism, with a significant reduction in international travel and visitor numbers to PAs [17]. This decline has had significant financial repercussions for PAs, which rely on tourism revenue for their operations [4]. The pandemic has also altered tourist behavior and preferences, with a shift towards more nature-based and socially distanced experiences [4]. As a result of the search for safer and socially distanced activities, studies have suggested an increased visitors’ willingness to pay (WTP) to visit PAs [18,19,20]. However, while research has been conducted on the pandemic’s effects on tourism in some countries, there appears to be a gap in knowledge regarding its specific impact on developing countries such as Bolivia.
In general terms, it is known that, as it happened with other countries, the tourism sector in Bolivia experienced a substantial downturn due to the pandemic. However, as far as we know, there has been no quantification of the impact of COVID-19 on visitors’ WTP to visit PAs. This quantification is important due to the attempt of Bolivia’s National Service of Protected Areas (SERNAP for its acronym in Spanish) to identify and implement mechanisms, such as entrance fees, to increase PAs revenue.
In this sense, this study aims to estimate the changes in visitors’ WTP in Bolivia, comparing WTP between 2019 and 2023, contributing to the literature by closing this knowledge gap. Additionally, this study aims to support SERNAP by providing empirical evidence on how the pandemic has affected tourists’ WTP and their profiles and by estimating an average WTP that might be used as a starting point for setting an optimal pricing strategy.
To date, Bolivia’s national parks system comprises 24 parks (or PAs), of which 19 are authorized by SERNAP to receive visitors. Out of these, 14 charge a fee for tourist access. Revenue from tourism, particularly entrance fees, is a crucial financial source for SERNAP, supporting the management and monitoring of PAs across the country. Currently, Bolivia’s protected area fee system, known as SISCO (for its acronym in Spanish), generates approximately USD 3 million per year in revenue [21]. However, this system presents significant disparities in revenue generation, with more than 80% of this revenue coming from a single PA, the Eduardo Avaroa Reserve [22]. As a result of this situation, the resources generated fall short of SERNAP’s operational needs, with an annual financial gap exceeding USD 7 million (BOB 49 million) [23].
In this context, there is an opportunity for SERNAP to adjust its fee scheme—SISCO—based on quantitative analysis and empirical evidence. Indeed, adjusting entrance fees for both national and international visitors is currently the strategy to address the financial shortfall and optimize revenue from tourism in PAs in Bolivia. However, to our knowledge, there are solely a couple of studies on financial mechanisms conducted in Bolivia [21,24,25]. In conclusion, these studies highlight the feasibility of increasing existing fees and implementing new ones or new mechanisms in the country.
2. Materials and Methods
2.1. Study Design
To calculate tourists’ WTP for an increase in the entrance fee, we followed the literature and used the contingent valuation approach. This methodology enables the estimation of the monetary value of a good or service in a hypothetical scenario, informed by the preferences of those who completed a survey [18,26].
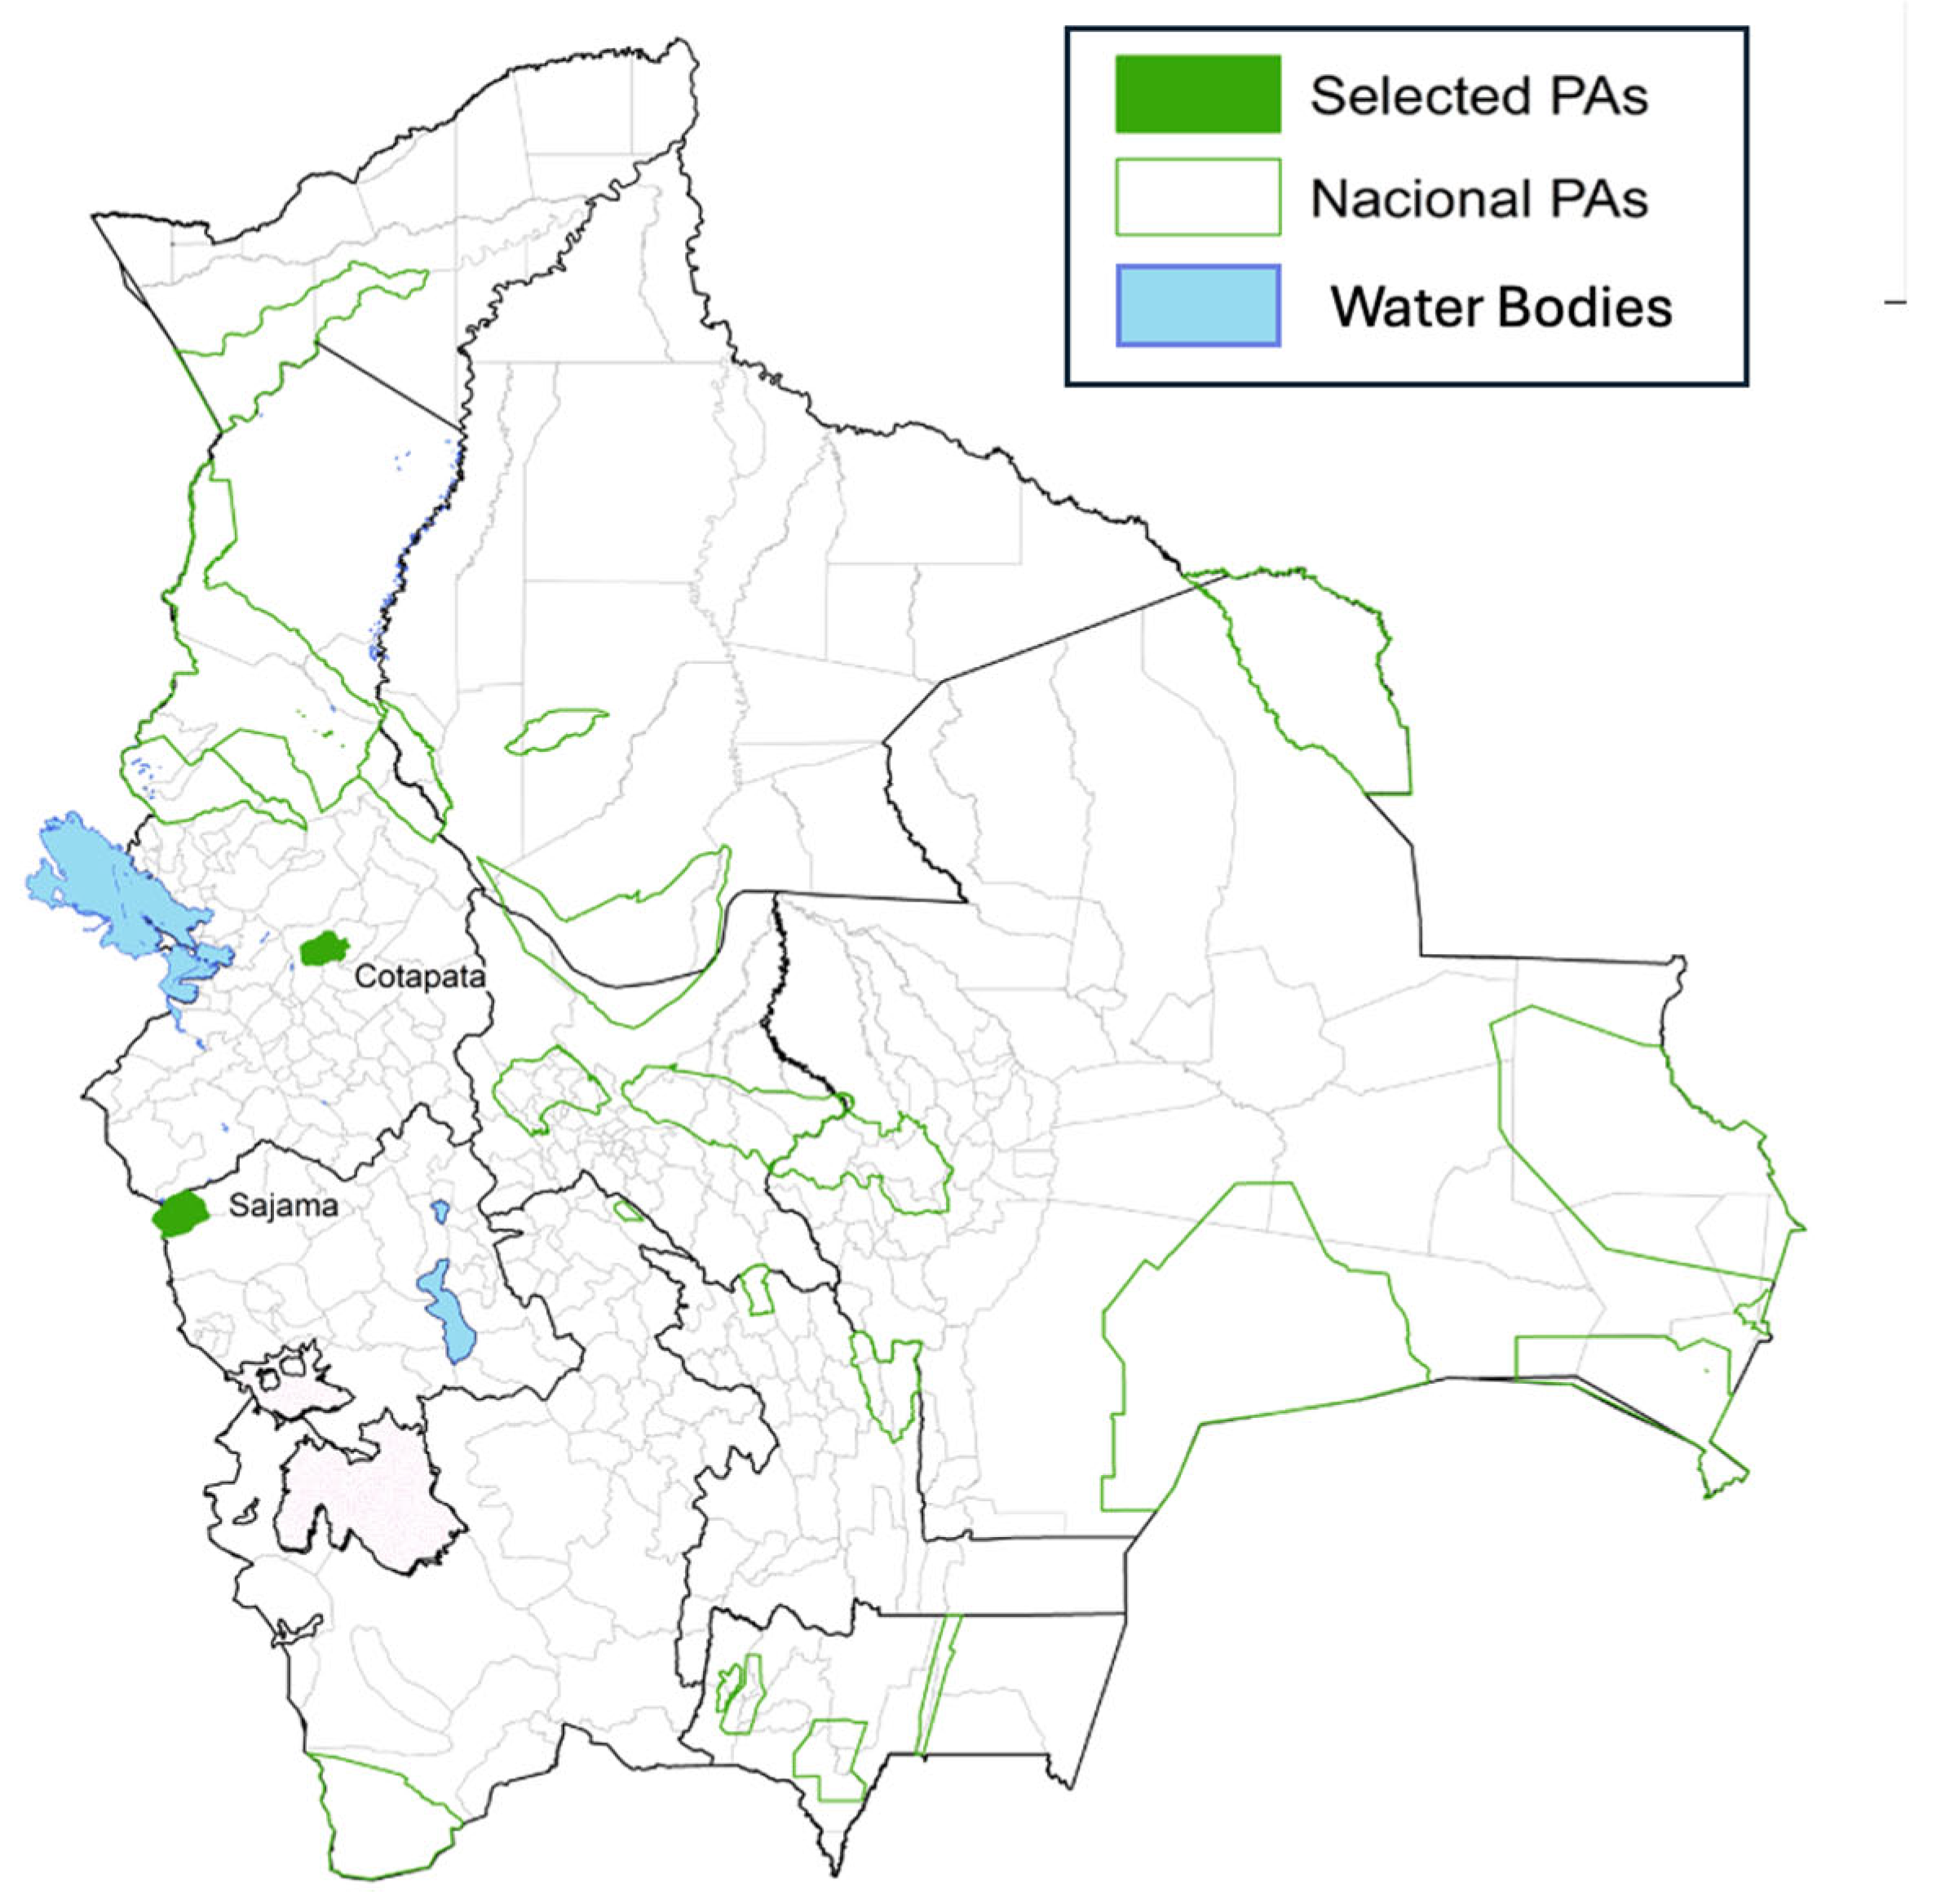
In this study, we surveyed tourists in two PAs, Sajama National Park and Cotapata National Park (Figure 1). The selection of these two PAs was strategically motivated by SERNAP’s focus on areas where fee adjustments could have significant impacts. Additionally, these two areas are interesting from a research perspective due to their distinct characteristics, contrasting management approaches, and growing importance as tourist destinations. Sajama National Park requires adjustment of its existing entrance fee to better align with its increasing influx of international tourists, particularly climbers. On the other hand, Cotapata National Park has consistently attracted high visitation rates from both national and international tourists. Therefore, it is an ideal candidate for implementing an entrance fee scheme for the first time, representing a significant opportunity for income generation given its long-standing appeal as a destination.
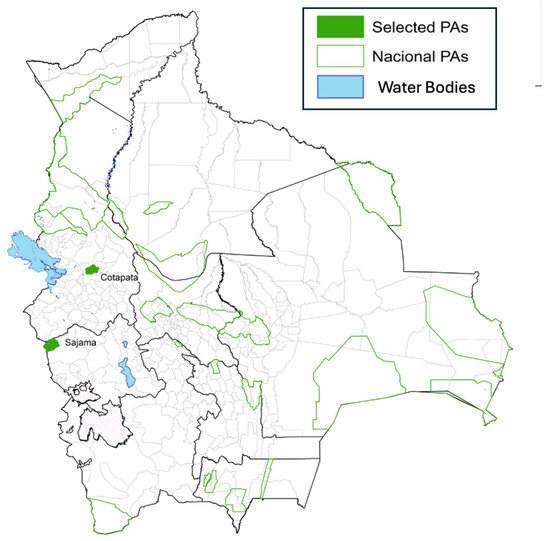
Figure 1.
Location of the selected PAs. Note: Own elaboration based on The World Database on Protected Areas [27].
More specifically, Sajama National Park was created in 1939 as Bolivia’s first PA. It was established by the Government of Bolivia to protect wildlife habitats in high-Andean ecosystems. The park is most well-known for its volcanic peaks, including Bolivia’s highest mountain, Nevado Sajama, 6542 m above sea level, making it a popular spot for climbers—usually international tourists. The park also offers diverse outdoor activities such as hiking, hot springs, and geysers, and it is rich in flora and fauna. Currently, to enter the PA, national and international visitors must pay an entrance fee of BOB 30 (USD 4) and BOB 100 (USD 15) respectively. These entrance fees are either collected at the entrance of the park or at the Tomarapi community.
Cotapata National Park, on the other hand, is a more recent park. It was established in 1993. Its creation aimed to safeguard fragile ecosystems, critical watershed zones, and areas of high biodiversity. The park offers diverse attractions for visitors, with mountain biking being particularly popular. One of its most famous routes is the “Death Road” descent, which attracts mainly international tourists. However, the park’s lowland areas are especially appealing to domestic tourists, owing to their proximity to La Paz and the favorable climate. Unlike Sajama, visitors to Cotapata are not required to pay an entrance fee, although efforts are underway to design a fee implementation strategy.
Given the unique characteristics of each park, we conducted distinct surveys: one in Sajama National Park and two in Cotapata National Park. In Sajama, we focused on international tourists due to their contribution to PA’s visitor demographics, comprising a significant majority of overall visits, particularly prior to the pandemic. From 2014 to 2019, they constituted 79% of all visitors [22]. When accounting for the COVID-19 pandemic, this figure remains substantial at 69% from 2014 to 2023 [22]. International tourists also represent the majority of climbers; thus, we included a specific question about their WTP an user fee for climbing activities, separate from the standard entrance fee. For Cotapata, we focused the survey on both national and international tourists, tailoring our approach to the different visitor profiles. We asked national tourists, who typically visit the lowland areas, about their WTP an entrance fee. For international tourists, often interested in mountain biking, we inquired about a different entrance fee structure. This differentiated approach was necessary to capture the varied preferences and activities specific to each park and visitor group.
2.2. Data Collection
Our data collection process was designed to capture comprehensive information about tourists’ WTP and their experiences visiting the two PAs analyzed. Both in 2019 and 2023, we conducted on-site surveys, and the process involved employing a random sampling approach to ensure that the sample was a good representation of the entire population (i.e., PAs tourists).
Due to logistical constraints, the surveys were conducted at different times in 2019 and 2023. In 2019, the surveys were conducted in April and May in Sajama National Park, and in April in Cotapata National Park. In 2023, the surveys were conducted in September in Sajama National Park and between the months of August and September in Cotapata National Park. We acknowledge that this timing difference might introduce potential biases to the analysis. In the case of these PAs, the high peak season is between July and October, which means responses might differ due to variations in demand, perceived value, and overall experience quality (crowding levels and wildlife viewing), for example. In Section 3, we describe the demographic characteristics of the samples and their implications for this study.
2.3. Analytical Technique
2.3.1. Survey
The approach to conduct the survey remained largely consistent in both years, 2019 and 2023. Prior to conducting the survey, we conducted a pilot in the central area and tourist centers of La Paz. In addition to the attitudinal and behavioral questions, the pilot test featured an open-ended question regarding the amount respondents would be willing to pay for entering the Sajama and Cotapata national parks. The responses helped establish reference amounts for the fee ranges included in the final surveys, which are available in the Supplementary Materials.
To ensure the reliability and comparability of our findings, we implemented several methodological controls across both the 2019 and 2023 surveys. This included employing an identical core set of questions to measure key variables, maintaining a consistent survey structure, and utilizing fee ranges derived from the 2019 pilot study. These measures minimized potential biases and provided a robust framework for evaluating visitor willingness to pay. Additionally, for the 2023 survey, we incorporated three specific questions regarding COVID-19; these addressed pre- and post-pandemic visitation to protected areas and perceptions of the importance of natural areas following the pandemic.
In each PA, we developed five types of surveys, each with a different fee increase option. We then randomized the distribution of these surveys and administered them to the visitors. Aside from the fee variation, all other questions remained consistent across the surveys. The fee increases were determined based on the minimum and maximum fees reported in the pilot test. With this information, we calculated the fee increases by comparing these fees to the current entrance fee in each case. To create five possible fee increase scenarios, we divided the range between the minimum and maximum increases into equal intervals. For Sajama National Park, the minimum fee reported was the current entrance fee, reflecting no fee increase. In contrast, for Cotapata National Park, the minimum fee reported was above zero—USD 5 for national tourists and USD 3 for international tourists. Table 1 shows the five potential fee increases for each PA by visitor type.

Table 1.
Fee increase proposed in the surveys conducted in the Sajama and Cotapata national parks (USD).
In the case of Sajama, in addition to the entrance fee, we also asked climbers their WTP an additional fee of USD 15.
2.3.2. Econometric Model
To calculate the average WTP, we employed the Turnbull estimator, which is a non-parametric method for analyzing WTP data, particularly useful in contingent valuation studies. Among the key features of this approach, we highlight two. First, the lack of need to make any assumptions about the underlying distribution of WTP in the population. Second, the fact that the Turnbull estimator provides a conservative “lower bound” on the average WTP.
Using the Stata/SE 18.5 module created by [28], we calculate the average WTP in both national parks.
To assess the potential impact of the pandemic on visitors’ WTP, we then conducted a probit regression analysis. This approach allowed us to estimate the effect of the post-pandemic period on the probability of accepting the fee increase, controlling for other factors such as age and income. More specifically, we estimated the following regression model:
where accept fee increase is a binary variable indicating whether the respondent accepted the proposed fee increase; COVID is a dummy variable for the post-COVID period (0 for 2019, 1 for 2023); and X is a vector of control variables. In this study, the control variables include:
- Demographic Variables: we included age, education, income, and gender to account for the influence of visitors’ backgrounds on their WTP. These variables are standard in survey-based studies, as they help ensure that our results are not biased by demographic differences among respondents. More specifically:
- ∘
- Age: in general, older visitors may have a higher WTP due to a greater appreciation of conservation efforts.
- ∘
- Education: higher education levels might potentially increase WTP as individuals may have a better understanding of the importance of protected areas.
- ∘
- Income: higher income is expected to increase WTP since individuals with higher income can afford to pay more.
- Gender: gender may have varying effects on WTP depending on the cultural and social context, but generally, it can influence WTP patterns.
- Fee Awareness: this variable captures whether respondents were aware of the entrance fees prior to their visit. Awareness of fees can significantly influence WTP, as those who are informed may have different valuation perceptions compared to those who are unaware.
- Prior PA Experience: this variable indicates whether the respondent had previous experiences with PAs. Prior experience can affect WTP because it may shape visitors’ appreciation and understanding of the value of conservation efforts.
- Length of Stay: The duration of the visit was included as a control variable, as it can influence WTP. Longer stays might indicate a higher level of engagement and satisfaction, potentially leading to a higher WTP.
- Mountain Climbing (specific to Sajama National Park): For Sajama National Park, we included an additional variable that indicates whether the respondent engaged in mountain climbing activities during their visit. Mountain climbing is a unique activity that could significantly influence WTP due to its associated costs and perceived value.
It is worth noting that these control variables were chosen to cover different aspects that could influence visitors’ WTP and to ensure a comprehensive understanding of the factors affecting WTP. By including these variables, we aimed to isolate the effect of the main variables of interest and hopefully provide more robust and reliable results.
3. Results
3.1. Sajama National Park
In 2019, we surveyed a total of 240 tourists in Sajama National Park, representing 6.96% of the total foreign visitors (2929). In 2023, the number of tourists being surveyed increased slightly to 303, representing 7.57% of the total 4004 foreign visitors.
3.1.1. Descriptive Statistics
Visitors to Sajama in 2023 exhibited different characteristics compared to those in 2019. Specifically, the 2023 visitors were younger and had higher levels of education and income (Table 2). This demographic shift could be attributed to two potential factors: a difference in visitor profiles between peak and off-peak seasons, as the surveys were conducted at different months of the year, and/or a change in the overall visitor demographic in the post-pandemic period. According to local tourism experts, the main differences between peak and off-peak season visitors typically involve nationality and income level. Given these demographic changes, it is expected that visitors’ WTP will be lower in 2019 than in 2023. All other factors being equal, the effect of the pandemic on visitors’ WTP is less straightforward. On one hand, studies have shown that visitors are valuing open and green areas more highly in the wake of the pandemic [29,30]. This increased appreciation could potentially lead to a higher WTP. On the other hand, for many potential visitors, the pandemic might have represented a negative income shock, which could decrease their WTP [31,32].
Table 2.
Demographic characteristics of tourists visiting Sajama National Park in 2019 and 2023.
3.1.2. Willingness to Pay
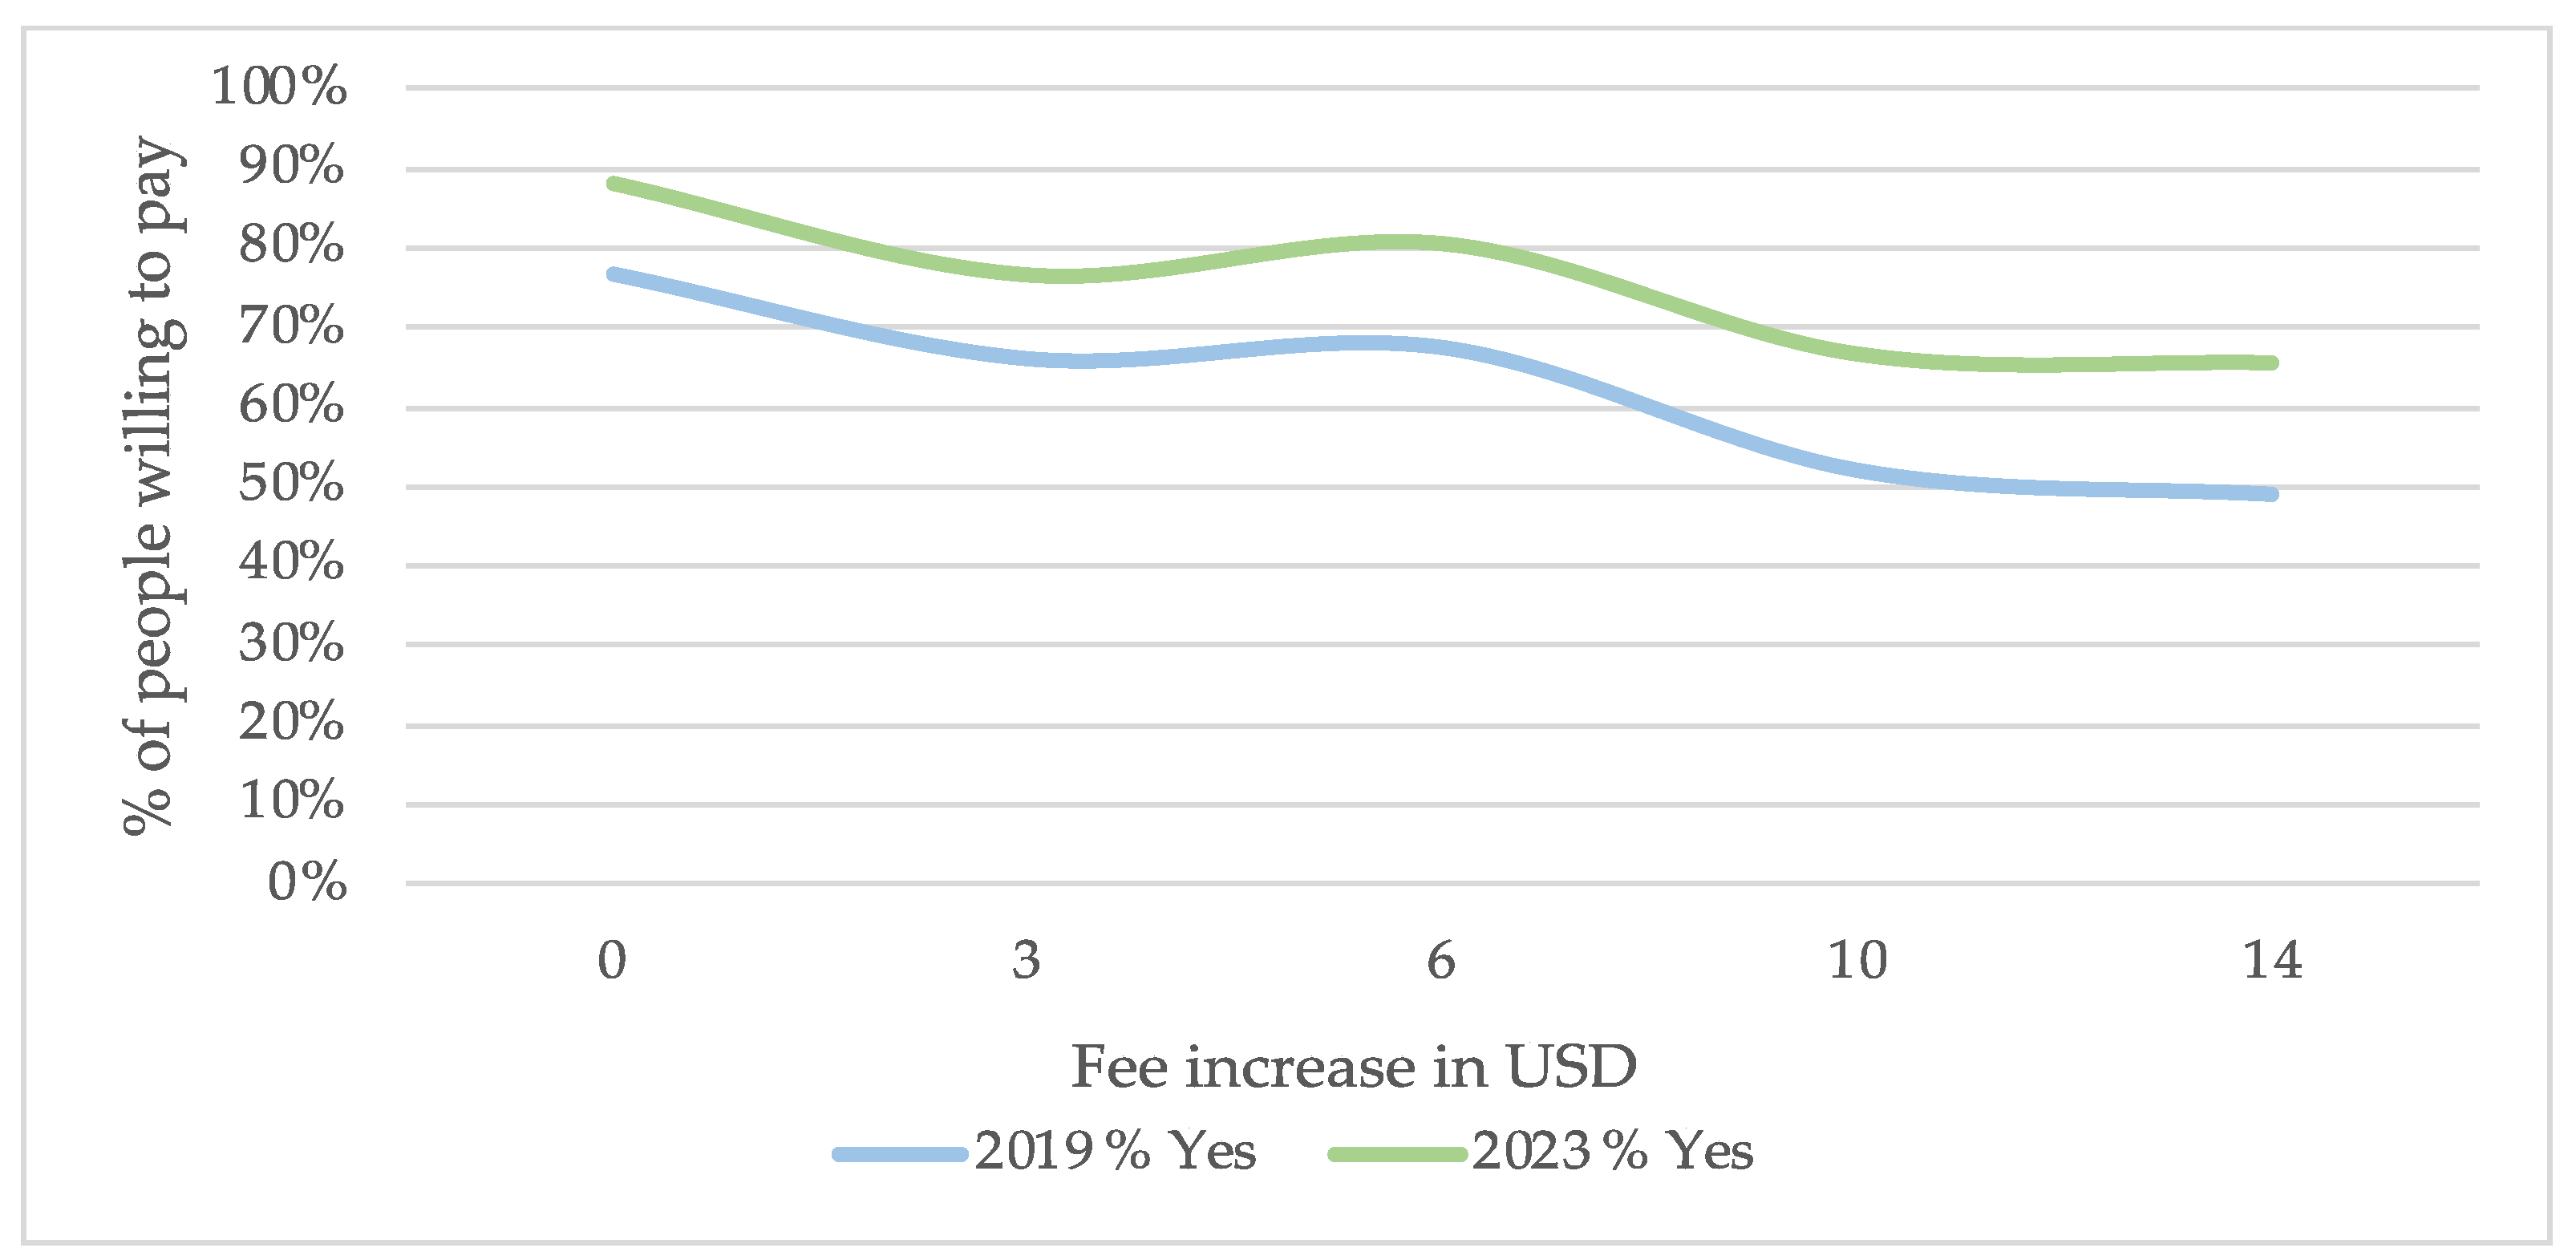
Figure 2 shows the general results regarding acceptance levels for different fees. As expected, the curves for both years demonstrate an inverse relationship between the initially proposed fee and WTP, where higher fees correspond to a lower WTP. The position of the 2023 curve, which shows the percentage of people accepting the proposed fee, is to the right of the corresponding 2019 curve. This indicates that, in general, visitors were more willing to pay the proposed amounts in 2023 than they were in 2019.
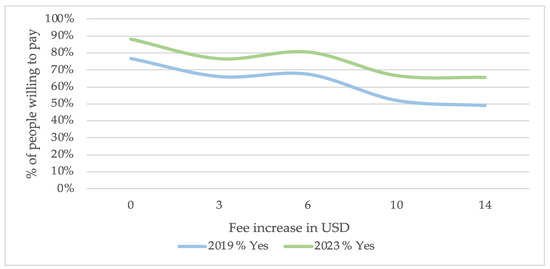
Figure 2.
Percentage of respondents that said “yes” to their WTP question in Sajama National Park.
Using the nonparametric Turnbull approach, we calculate an average WTP for the entrance fee of USD 19 in 2019 and USD 23 in 2023—an increase of 21%. This increase in WTP can be explained by changes in the socio-economic characteristics of the respondents. As mentioned before, the 2023 sample is characterized by a younger population with higher education and income levels.
A similar trend was observed when analyzing climbers’ WTP an additional USD 15 user fee. In 2023, approximately 58% of climbers expressed willingness to pay this fee, compared to only 42% in 2019.
Specifically, regarding the impact of the COVID-19 pandemic, Table 3 shows that the direction of the COVID effect on the probability of visitors paying a higher fee is positive. This holds true for models 1 and 2, which include mountain climbing as an explanatory variable. In terms of the effect’s magnitude, we estimated an increased probability of 12% and 10%, respectively, when COVID equals one.
Table 3.
COVID-19 impact on fee increase acceptance in Sajama National Park.
3.2. Cotapata National Park
The number of tourists surveyed in Cotapata National Park was 298 in 2019 and 341 in 2023 in the lowland area. For mountain bike tourists, the number of surveys was 319 in 2019 and 366 in 2023.
3.2.1. Descriptive Statistics
In Cotapata National Park, we noted a similar trend regarding the socio-economic profile of visitors. Overall, the data suggests a shift towards younger, more educated, and relatively wealthier tourists visiting the park, particularly among lowland area tourists (Table 4 and Table 5). Based on this trend, we expect to find a higher WTP in 2023 when compared to 2019.
Table 4.
Demographic characteristics of national tourists visiting Cotapata National Park in 2019 and 2023.
Table 5.
Demographic characteristics of international tourists visiting Cotapata National Park in 2019 and 2023.
3.2.2. Willingness to Pay
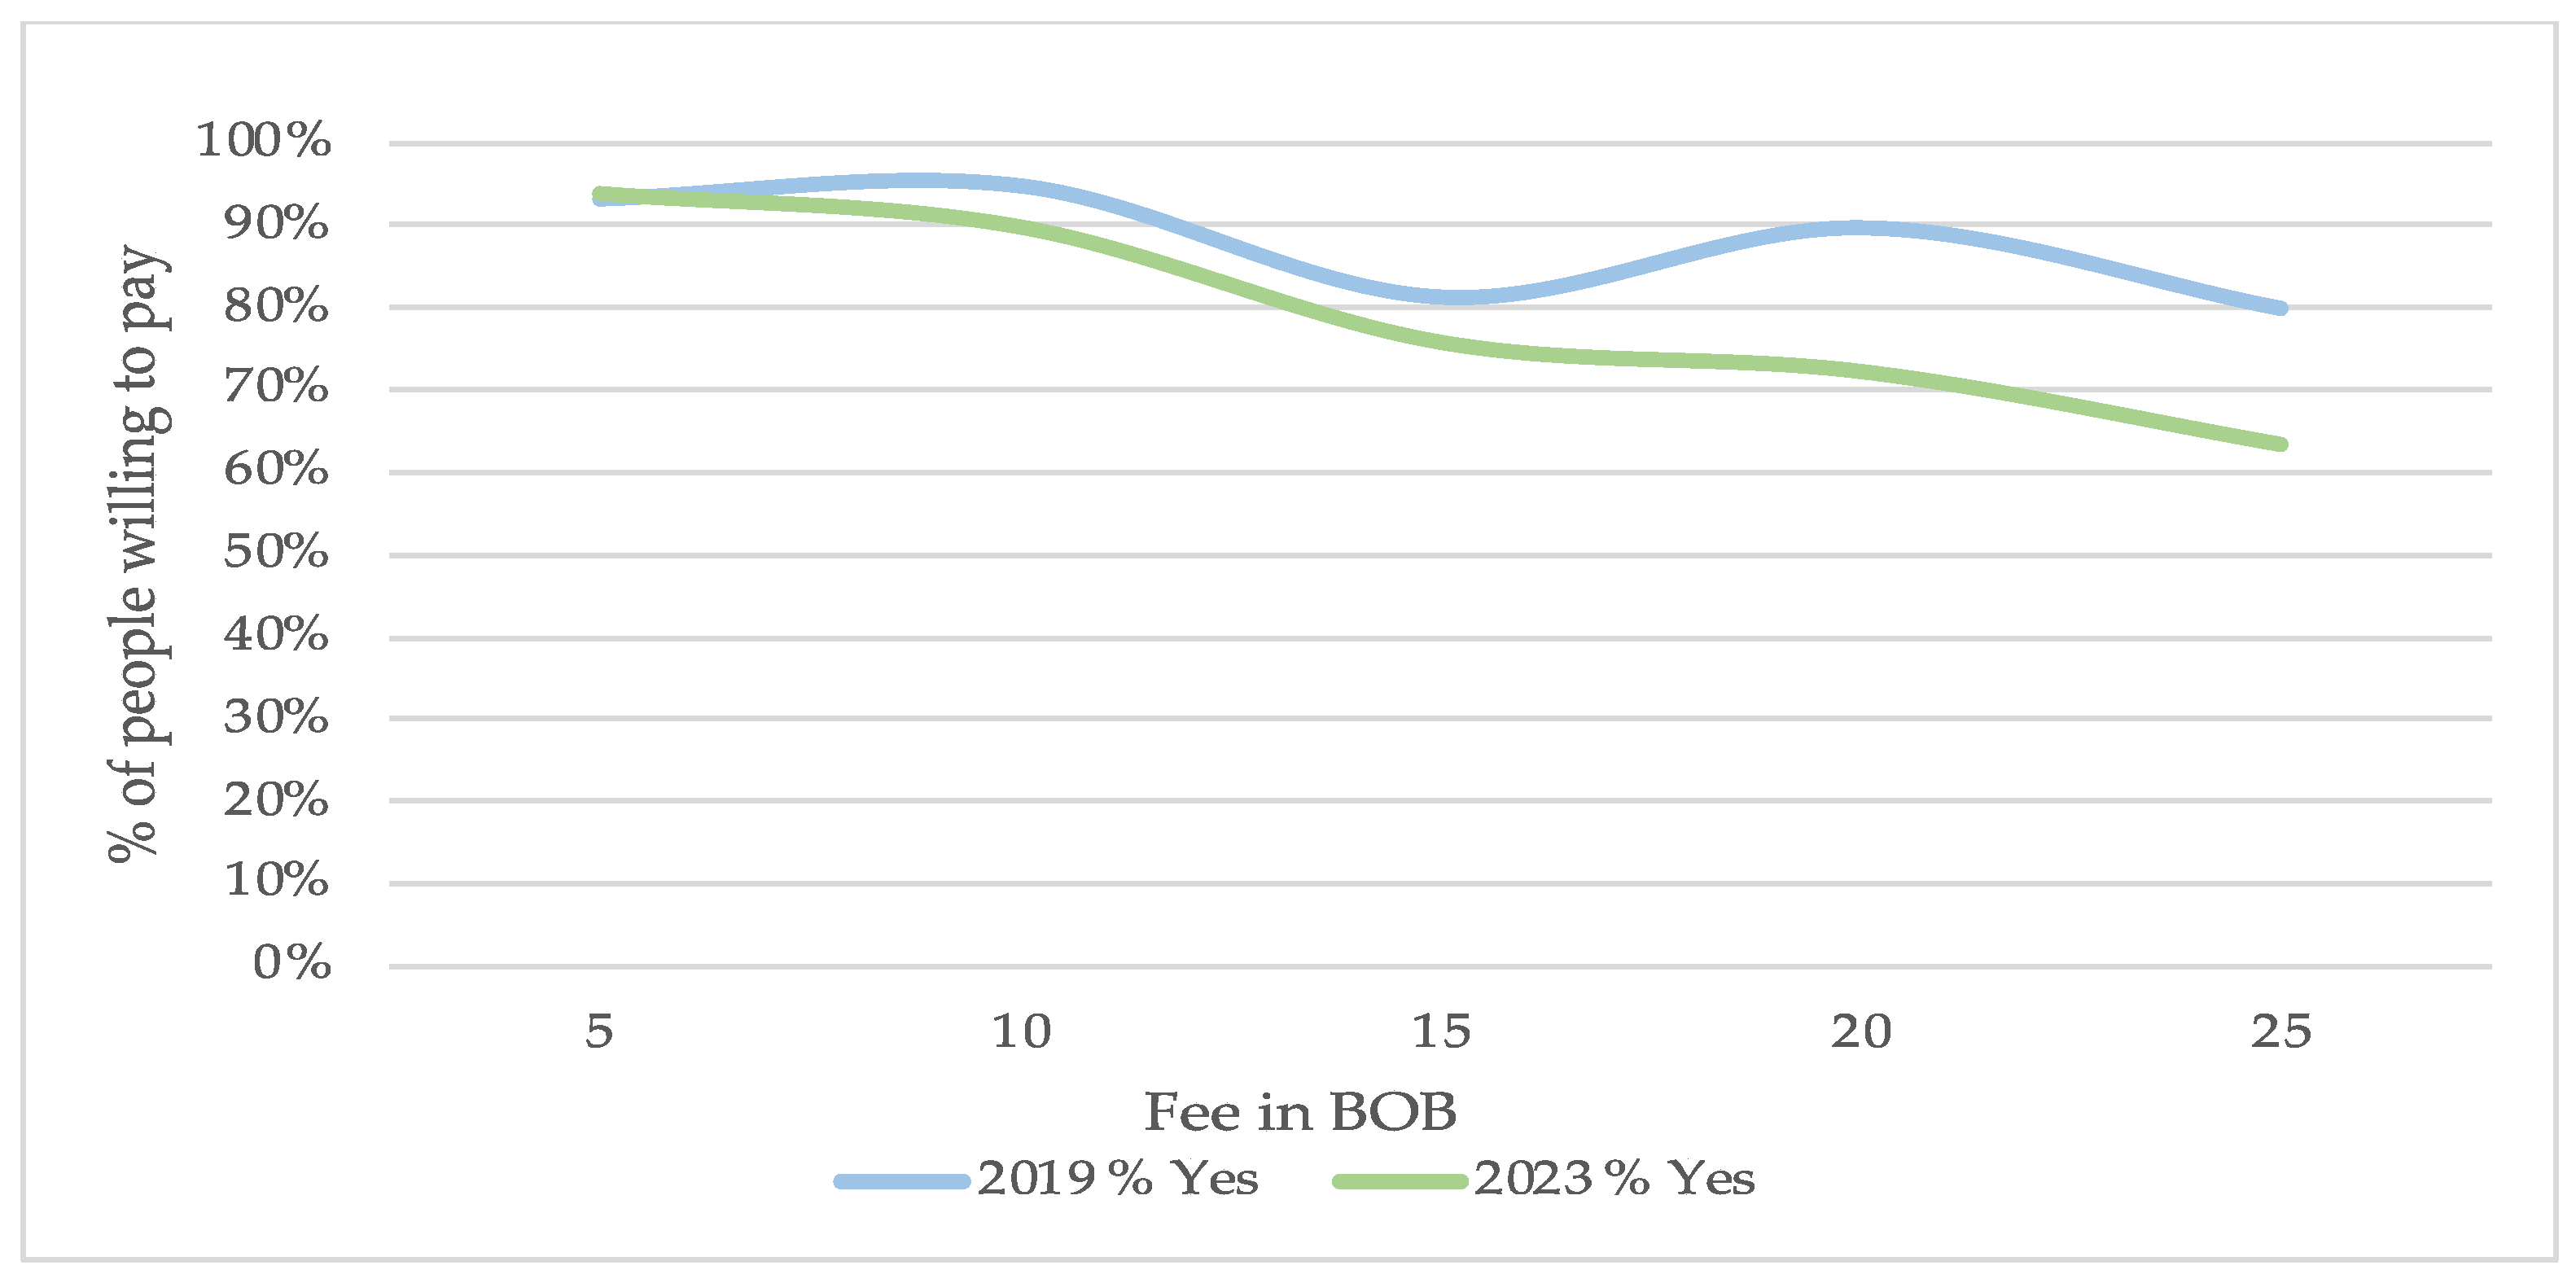
Figure 3 illustrates the percentage of tourists surveyed who were willing to pay the new entrance fee. For tourists visiting the lowland areas, the data reveal the anticipated downward trend in willingness. However, contrary to what was expected, the data shows a decrease in the percentage of tourists willing to pay higher entrance fees in 2023 compared to 2019.
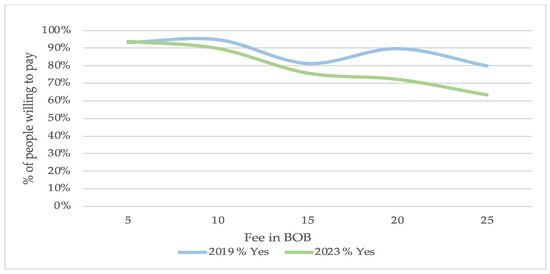
Figure 3.
Percentage of respondents that said “yes” to their WTP question in the lowland areas in Cotapata National Park.
Visitors who were unwilling to pay the park’s entrance fee were asked to explain their reasons. In 2023, the primary reasons were that the proposed fee was considered too high, and the high cost of travel. In 2019, the main concern was a lack of trust in the appropriate use of the funds, followed by the perception that the fee was excessive and the high cost of travel. The shift from concerns about fund utilization in 2019 to a primary focus on the fee itself in 2023 suggests that while trust issues may have been addressed or diminished, the perception of the fee has become more prominent. Despite this shift, budget constraints and travel costs consistently impact visitors’ willingness to pay.
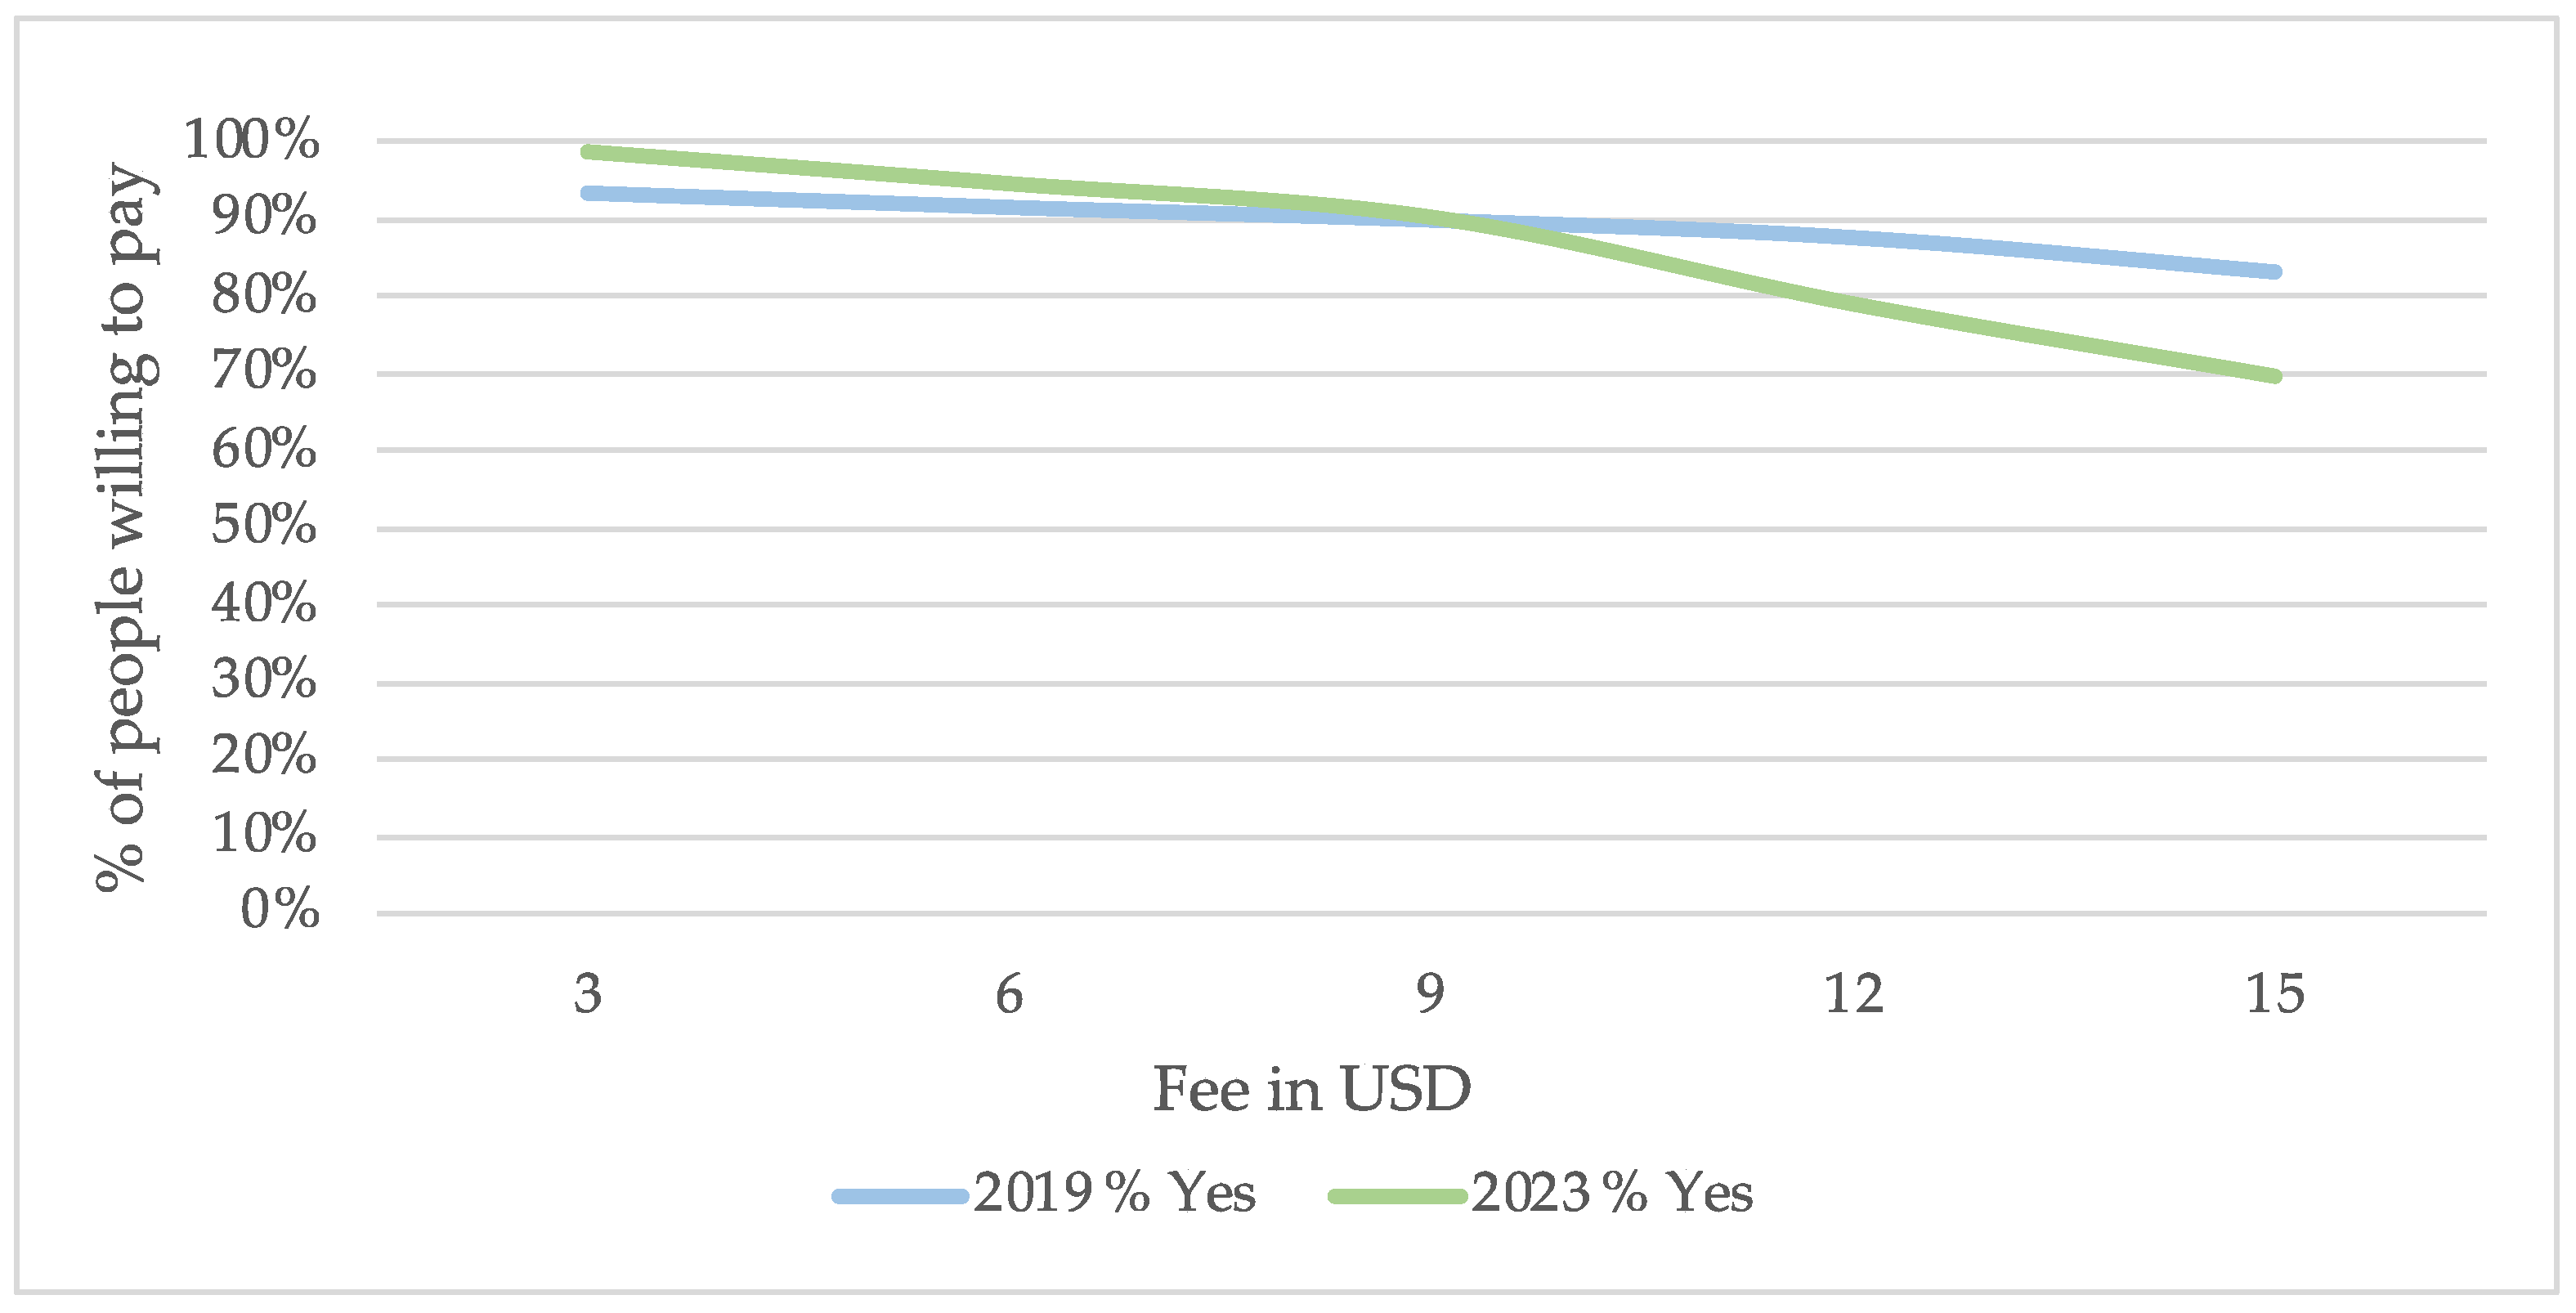
In the case of international tourists interested in mountain biking, a comparison of the 2023 and 2019 curves, which illustrate the percentage of individuals who accept the proposed fare, reveals two key trends (Figure 4). Initially, the 2023 curve shows an expansion for fares ranging from USD 3 to USD 9. This is followed by a contraction in the curve compared to the 2019 data.
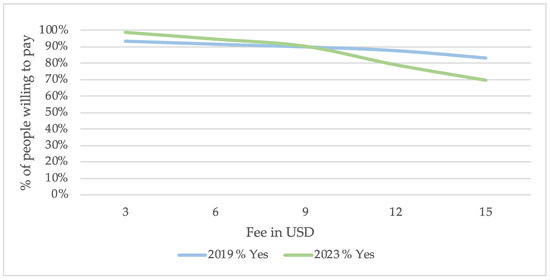
Figure 4.
Percentage of respondents interested in mountain biking that said “yes” to their WTP question in Cotapata National Park.
Based on follow-up questions, we identified that the primary reason international tourists were unwilling to pay the new entrance fee is the perception that it is too high.
Table 6 presents the average WTP for implementing an entrance fee in Cotapata National Park, segmented by tourist nationality. The results confirm the findings discussed earlier. For domestic tourists (i.e., those interested in visiting the lowland areas of the park), the average WTP decreases from BOB 23 (USD 3.3) to BOB 20 (USD 2.8). In contrast, for international tourists (i.e., mountain bikers), the average WTP remains consistent at USD 13 in both years.
Table 6.
Average WTP in Cotapata National Park by tourist nationality.
Table 7 shows the results from the probit regression analysis, specifically focusing on the marginal effects for both national and international tourists. The estimates support the findings from the Turnbull analysis. Specifically, in the case of Cotapata National Park, the pandemic had a negative impact on the likelihood of paying an entrance fee. These results align with the figures presented in Table 7.
Table 7.
COVID-19 impact on fee implementation acceptance in Cotapata National Park.
4. Discussion
Using the contingent valuation approach, we calculated and compared the WTP of visitors to Sajama National Park and Cotapata National Park in Bolivia. Findings revealed a positive WTP for both parks, suggesting that adjusting current fee structures could increase revenue and resource allocation for national park management. This approach has been successfully implemented in Bolivia’s Eduardo Avaroa Andean Fauna National Reserve (REA), aligned with a previous WTP study conducted in the country [33]. In 2009, REA approved an update to its SISCO fee structure for international tourists, increasing the entrance fee from BOB 30 to BOB 150 (Administrative Resolution—DE—N° 102/2010). Despite this increase, tourist flow continued to rise [22]. Notably, REA now operates as a self-sufficient area, with income generated from its visitor fees (SISCO). This demonstrates that, when supported by adequate promotional strategies, entrance fee adjustments can be made with minimal impact on visitor numbers [34,35].
However, for these strategies to be successful, it is essential that tourism services meet minimum quality requirements [36,37]. Many visitors surveyed here have expressed dissatisfaction with the current state of services in both Cotapata and Sajama National Parks, potentially impacting their overall travel experience. Similar findings have been reported in other studies, which emphasize the importance of service quality in influencing tourists’ WTP [38] and overall satisfaction [35,36,37]. Ensuring adequate maintenance and staffing of essential facilities—such as restrooms, water sources, electricity, signage, and visitor information centers—is crucial for enhancing the visitor experience and satisfaction and ultimately supporting higher fee acceptance. Recognizing the critical role of visitor experience, a recent study [39] emphasizes that investments in infrastructure and training are vital for improving tourist experiences and promoting sustainable practices to position Bolivia as a unique and appealing destination within the global tourism market. This is particularly important as tourism in PAs has gained significant global importance due to its potential to contribute to local economies while simultaneously supporting biodiversity conservation [37].
Tourists’ valuation of PAs is significantly influenced by their awareness of conservation efforts [40]. Many visitors express a willingness to contribute financially if they perceive that their fees will support conservation initiatives [35,38]. This highlights the importance of communication strategies that inform tourists about how their contributions aid environmental preservation and local communities [37,38].
Visitor motivations were analyzed, with ‘popularity’ emerging as a significant factor in both parks. A substantial portion of visitors (20% in Cotapata National Park and 17% in Sajama National) cited popularity as a primary reason for their visit. Moreover, a strong interest in natural resources and scenery was evident, with 28% of international tourists and 46% of national tourists in Cotapata National Park, and 48% of visitors in Sajama National Park citing these aspects as key motivators. These findings suggest that promoting the parks should focus on their unique attractions and scenic beauty while emphasizing a conservation approach. Previous studies indicate that this strategic focus can enhance sustainable tourism, increasing visitation while preserving the natural beauty and biodiversity of the areas [35,40,41].
Sajama National Park has experienced significant growth in tourism in recent years. The number of international visitors in 2023 reached the highest in a decade, attracting 4004 visitors. This resulted in a total income generation of USD 57,528 with the current fee structure. Implementing the proposed fee adjustment, revenue could have increased to USD 86,293. Furthermore, there is an opportunity to implement a climbing fee of USD 15, which has garnered a 58% acceptance rate among visitors in 2023—an increase of 16% from the 42% acceptance rate in 2019
Cotapata National Park, currently lacking entrance fees, presents significant revenue potential. While comprehensive registration data on total visitor numbers are unavailable, estimations based on specific activities provide valuable insights. In 2018, the total number of national tourists who visited the PN-ANMI Cotapata was 38,380, and the total number of foreign tourists who participated in biking activities was 55,549 [42]. According to the results of the willingness to pay analysis, a proposed fee of USD 12 for foreign tourists could generate an estimated USD 593,602. For national tourists, with a fee set at BOB 25, the projected revenue is BOB 648,716 (USD 93,206). Moreover, tourism activities like biking offer opportunities to contribute to local economic development [42] and enhance conservation efforts by fostering sustainable tourism practices [34,35,41].
Additionally, our analysis revealed a shift in tourists’ profiles when comparing data from 2019 to 2023. Tourists visiting the two PAs are now younger, more educated, and relatively wealthier than before. This demographic shift contributed to an increased average WTP in Sajama National Park in 2023 compared to 2019, while in Cotapata National Park, the average WTP decreased. This can be explained by the relatively lower income of national tourists visiting Cotapata National Park.
We also examined the potential impact of the pandemic on tourists’ WTP for visiting the two PAs. In Sajama National Park, the pandemic appeared to have a positive effect on WTP, indicating a greater willingness to pay among visitors. In contrast, Cotapata National Park experienced a negative impact, with visitors expressing a lower willingness to pay higher entrance fees. This divergence underscores the varied effects of the pandemic on tourism in different protected areas and the need to conduct PA-specific studies to better understand tourists’ behavior and preferences.
Overall, these findings underscore the importance of strategic fee adjustments for enhancing the financial sustainability of Bolivia’s protected areas. Implementing appropriate fees, coupled with service quality improvements, effective communication strategies, and a robust strategic management plan, can significantly contribute to revenue generation while ensuring the long-term conservation of these valuable natural resources. Furthermore, raising awareness about the importance of PAs among both local and international visitors is a defining factor that can enhance their willingness to pay and support conservation efforts. Ongoing monitoring and evaluation of the implemented strategies are crucial to ensure their effectiveness and adapt to changing visitor needs and market conditions.
5. Conclusions
This study assessed tourists’ WTP for increased entrance fees in Bolivia’s national parks, comparing data from 2019 and 2023 to evaluate the impact of COVID-19. Our findings indicate that tourists’ profiles and their WTP have shifted over this period, yet no consistent trend was observed across the two PAs studied.
Despite the lack of common trend between the two areas, SERNAP can use the results obtained, such as the average WTP, to develop more effective pricing strategies that enhance revenue without deterring visitors. Sajama National Park shows significant potential for increasing entrance fees due to a rise in international tourist visitation levels. In contrast, Cotapata National Park is well-positioned to establish an entrance fee given its appeal to both national and international tourists. This approach supports broader conservation goals both nationally and globally, ensuring that the rich biodiversity and natural landscapes of Bolivia’s National Parks are preserved for future generations.
There are some broad limitations associated with using the contingent valuation approach. However, in our view, the main limitations in this study are (1) the use of different samples of tourists in 2019 and 2023—ideally, the survey would be conducted with the same tourists—and (2) conducting the survey in different seasons. Regarding the first limitation, we believe that the randomization of the selection of the tourists reduced potential bias. Regarding the second limitation, we acknowledge that conducting surveys in different months can introduce seasonal biases because tourists’ preferences, behaviors, and WTP might vary depending on the time of year.
In terms of the direction of the bias, the high season might attract more international tourists willing to spend more, while low season might attract more local tourists with different spending habits. Thus, we would expect that the WTP during the high season would be greater than the WTP during the low season. Within our context, a higher WTP in 2023 would be expected. Therefore, in the case of Sajama National Park, where we calculated a higher WTP in 2023, we cannot state that the change is due to COVID-19 and not simply due to seasonality. We believe it is likely a combination of both factors, which share the same direction. This means that in Sajama, we could potentially be overestimating the effect of COVID-19, while in Cotapata, we could be underestimating the impact of the pandemic.
All in all, we can affirm that tourists remain willing to pay for accessing protected areas in Bolivia. This represents a significant opportunity for SERNAP to leverage these findings to enhance the financial sustainability of these areas. The increasing popularity of these parks underscores the potential for generating additional revenue through fee adjustments. A fee increase can provide essential funding for conservation efforts, ensuring the continued protection and management of these invaluable natural resources while promoting responsible tourism practices that benefit both the environment and local communities.
Supplementary Materials
The following supporting information can be downloaded at: https://www.mdpi.com/article/10.3390/su17051768/s1, Survey in English for foreign visitors in Sajama National Park and Cotapata National Park, and for national tourists in Cotapata National Park. We note that the original survey for national tourists in Cotapata National Park was conducted in Spanish.
Author Contributions
Conceptualization, A.M.H.; data curation, S.R.; formal analysis, S.R. and T.V.; funding acquisition, A.M.H.; investigation, S.R.; methodology, T.V. and A.M.H.; project administration, A.M.H.; resources, A.M.H.; software, S.R.; supervision, S.E. and A.M.H.; writing—original draft, S.R. and T.V.; writing—review and editing, S.E. and A.M.H. All authors have read and agreed to the published version of the manuscript.
Funding
This research was funded by the Swedish International Development Agency, grant number 15694.
Institutional Review Board Statement
Not applicable.
Informed Consent Statement
Verbal consent was obtained prior to all the interviews. This verbal consent was considered as the initial criterion in the surveyor to proceed with the interview.
Data Availability Statement
All data from the survey are available upon request.
Acknowledgments
We would like to thank the Bolivian National Service of Protected Areas (SERNAP) for their institutional support. We also would like to acknowledge the Conservation Strategy Fund that supported this article. Finally, we thank the editor and anonymous referees for their helpful comments and suggestions throughout the manuscript.
Conflicts of Interest
The authors declare no conflicts of interest.
References
- Hilty, J.; Worboys, G.L.; Keeley, A.; Woodley, S.; Lausche, B.J.; Locke, H.; Carr, M.; Pulsford, I.; Pittock, J.; White, J.W.; et al. Guidelines for Conserving Connectivity Through Ecological Networks and Corridors; IUCN: Gland, Switzerland, 2020. [Google Scholar] [CrossRef]
- Coad, L.; Watson, J.E.; Geldmann, J.; Burgess, N.D.; Leverington, F.; Hockings, M.; Knights, K.; Di Marco, M. Widespread shortfalls in protected area resourcing undermine efforts to conserve biodiversity. Front. Ecol. Environ. 2019, 17, 259–264. [Google Scholar] [CrossRef]
- Lessmann, J.; Geldmann, J.; Fajardo, J.; Marquet, P.A. The role of funding in the performance of Latin America’s protected areas. Proc. Natl. Acad. Sci. USA 2024, 121, e2307521121. [Google Scholar] [CrossRef]
- Bhammar, H.; Li, W.; Molina, C.M.M.; Hickey, V.; Pendry, J.; Narain, U. Framework for Sustainable Recovery of Tourism in Protected Areas. Sustainability 2021, 13, 2798. [Google Scholar] [CrossRef]
- Zou, S. National park entrance fee increase: A conceptual framework. J. Sustain. Tour. 2020, 28, 2099–2117. [Google Scholar] [CrossRef]
- Fernández-Baca, J.C.; Hamberg, S.E.; Martin, A.S. Conservation Finance: Strategies for Protected Areas and Protected Area Systems; Innovations in Conservation Series for the Parks in Peril Program; The Nature Conservancy: Arlington, VA, USA, 2007. [Google Scholar]
- Bovarnick, A.; Fernandez Baca, J.; Galindo, J.; Negret, H. Financial Sustainability of Protected Areas in Latin America and the Caribbean: Investment Policy Guidance; United Nations Development Programme (UNDP): New York, NY, USA; The Nature Conservancy (TNC): Arlington, VA, USA, 2010. [Google Scholar]
- IUCN ESARO. Closing the Gap. The Financing and Resourcing of Protected and Conserved Areas in Eastern and Southern Africa; IUCN ESARO: Nairobi, Kenya, 2020. [Google Scholar]
- Bates, N. Paying to play: The future of recreation fees. Parks Recreat. 1999, 34, 47–52. [Google Scholar]
- Lindberg, K.; Halpenny, E. Protected Area Visitor Fees: An Overview; Cooperative Research Centre for Sustainable Tourism: Gold Coast, Australia, 2001. [Google Scholar]
- Song, L.; Xue, Y.; Jing, Y.; Zhang, J. Visitor’s Willingness to Pay for National Park Entrance Fees in China: Evidence from a Contingent Valuation Method. Int. J. Environ. Res. Public Health 2021, 18, 13410. [Google Scholar] [CrossRef]
- Hughes, E.; Starkey, S. Economic Impacts of Managed Access at Zion National Park. Doctoral Dissertation, Duke University, Durham, NC, USA, 2021. [Google Scholar]
- Zyl, H.V.; Kinghorn, J.; Emerton, L. National Park Entrance Fees: A Global Benchmarking Focused on Affordability. PARKS 2019, 25, 39–54. [Google Scholar]
- Spenceley, A.; Rylance, A.; Laiser, S.L. Protected area entrance fees in Tanzania: The search for competitiveness and value for money. Koedoe: Afr. Prot. Area Conserv. Sci. 2017, 59, 1–8. [Google Scholar] [CrossRef]
- Platania, M.; Rizzo, M. Willingness to pay for protected areas: A case of Etna Park. Ecol. Indic. 2018, 93, 201–206. [Google Scholar] [CrossRef]
- Witt, B. Tourists’ Willingness to Pay Increased Entrance Fees at Mexican Protected Areas: A Multi-Site Contingent Valuation Study. Sustainability 2019, 11, 3041. [Google Scholar] [CrossRef]
- Buckley, R. Conservation implications of COVID19: Effects via tourism and extractive industries. Biol. Conserv. 2020, 247, 108640. [Google Scholar] [CrossRef] [PubMed]
- Jeon, C.-Y.; Yang, H.-W. The Impact of the COVID-19 Pandemic on Tourists’ WTP: Using the Contingent Valuation Method. Int. J. Environ. Res. Public Health 2021, 18, 8605. [Google Scholar] [CrossRef]
- Sloggy, M.R.; Long, D.; Sánchez, J.J. The Effect of the COVID-19 Pandemic on the Willingness-to-pay for Outdoor Recreation in Wilderness Areas. J. For. Econ. 2023, 38, 235–258. [Google Scholar] [CrossRef]
- Ezeh, P.C.; Dube, K. Willingness to Pay in Tourism and Its Influence on Sustainability. Sustainability 2024, 16, 10630. [Google Scholar] [CrossRef]
- Mendizábal, C.; Malky Harb, A.; Cabrerizo, I. Optimización de Tarifas de Ingreso en Áreas Protegidas de Bolivia; Policy Brief; Conservation Strategy Fund: Washington, DC, USA, 2020. [Google Scholar]
- Sernap. Informe de Datos Estadísticos del Flujo Turistico Histórico de las APs de Bolivia 2014–2023; Internal Document; Servicio Nacional de Áreas Protegidas: La Paz, Bolivia, 2024. [Google Scholar]
- Sernap-Fundesnap. Plan Estratégico Financiero 2022–2031; Internal Document; Servicio Nacional de Áreas Protegidas: La Paz, Bolivia, 2022. [Google Scholar]
- Drumm, A. Sustainable Finance for Protected Areas: Tourism Entrance Fees; The Nature Conservancy: Arlington, VA, USA; Alex C. Walker Foundation: Pittsburgh, PA, USA; USAID: Washington, DC, USA, 2004; Available online: https://www.cbd.int/doc/pa/tools/Tourism%20entrance%20fees.pdf (accessed on 13 January 2025).
- Rakela, S.; Vilela, T.; Espinoza, S.; Malky Harb, A.; Mendizábal Vergara, C. Exploring Public Support for Bolivia’s Protected Areas: A Contingent Valuation Approach. Land 2024, 13, 868. [Google Scholar] [CrossRef]
- Johnston, R.J.; Boyle, K.J.; Adamowicz, W.; Bennett, J.; Brouwer, R.; Cameron, T.A.; Hanemann, W.M.; Hanley, N.; Scarpa, R.; Tourangeau, R.; et al. Contemporary guidance for stated preference studies. J. Assoc. Environ. Resour. Econ. 2017, 4, 319–405. [Google Scholar] [CrossRef]
- UNEP-WCMC; IUCN Protected Planet. The World Database on Protected Areas (WDPA) and World Database on Other Effective Area-based Conservation Measures (WD-OECM). 2024. Available online: www.protectedplanet.net (accessed on 10 January 2025).
- Azevedo, J.P. TURNBULL: Stata Module to Estimate the Turnbull Empirical Distribution Estimator of Willingness to Pay; Statistical Software Components S457125; Boston College Department of Economics: Chestnut Hill, MA, USA, 2010. [Google Scholar]
- Lin, S.-W.; Wang, K.-F.; Chiu, Y.-H. Effects of tourists’ psychological perceptions and travel choice behaviors on the nonmarket value of urban ecotourism during the COVID-19 pandemic- case study of the Maokong region in Taiwan. Cogent Soc. Sci. 2022, 8, 2095109. [Google Scholar] [CrossRef]
- Mandić, A. Protected area management effectiveness and COVID-19: The case of Plitvice Lakes National Park, Croatia. J. Outdoor Recreat. Tour. 2023, 41, 100397. [Google Scholar] [CrossRef] [PubMed] [PubMed Central]
- Jones, N.; McGinlay, J.; Jones, A.; Malesios, C.; Holtvoeth, J.; Dimitrakopoulos, P.G.; Gkoumas, V.; Kontoleon, A. COVID-19 and protected areas: Impacts, conflicts, and possible management solutions. Conserv. Lett. 2021, 14, e12800. [Google Scholar] [CrossRef] [PubMed] [PubMed Central]
- Rondeau, D.; Perry, B.; Grimard, F. The Consequences of COVID-19 and Other Disasters for Wildlife and Biodiversity. Environ. Resour. Econ. 2020, 76, 945–961. [Google Scholar] [CrossRef]
- Espinoza, S.; Lozano, P.V.; Peñarrieta, L.; Siles, N.P.; Zea O’Phelan, M. Valoración Económica de Recursos Naturales en APN de Bolivia/Economic Valuation of Natural Resources of Bolivian Protected Areas; Serie Académica No. 2; Conservation Strategy Fund: Washington, DC, USA, 2008. [Google Scholar]
- Chavez, J.M.; Tetto, A.F.; Reynel, C.A.; Souza, N.J. Evaluation of tourism management in the bosque de pómac historic sanctuary, peru. Floresta 2022, 52, 35–44. [Google Scholar] [CrossRef]
- de Araújo, A.F.; Andrés Marques, M.I.; Candeias, M.T.R.; Vieira, A.L. Willingness to Pay for Sustainable Destinations: A Structural Approach. Sustainability 2022, 14, 2548. [Google Scholar] [CrossRef]
- Oviedo-García, M.; Vega-Vazquez, M.; Castellanos-Verdugo, M.; Orgaz Agüera, F. Tourism in protected areas and the impact of servicescape on tourist satisfaction, key in sustainability. J. Destin. Mark. Manag. 2019, 12, 74–83. [Google Scholar] [CrossRef]
- Leung, Y.-F.; Spenceley, A.; Hvenegaard, G.; Buckley, R.; Groves, C. Gestión del Turismo y de los Visitantes en Áreas Protegidas: Directrices para la Sostenibilidad; IUCN: Gland, Switzerland, 2019. [Google Scholar]
- Wang, P.; Zhong, L. Tourist Willingness to Pay for Protected Area Ecotourism Resources and Influencing Factors at the Hulun Lake Protected Area. J. Resour. Ecol. 2018, 9, 174–180. [Google Scholar]
- SDSN Bolivia; IES. Turismo con Propósito y la Agenda 2030 en Bolivia: Una Mirada Prospectiva Basada en Datos y Estudios; Sustainable Development Solutions Network Bolivia: La Paz, Bolivia, 2024; Available online: https://sdsnbolivia.org/turismo-con-proposito/ (accessed on 13 January 2025).
- Surendran, A.; Sekar, C. An economic analysis of willingness to pay (WTP) for conserving the biodiversity. Int. J. Soc. Econ. 2010, 37, 637–648. [Google Scholar] [CrossRef]
- Lasarte, E.S. Travel Decision and Destination Experiences in the Islands of Caramoan, Philippines: A Visitors’ Descriptive Evaluation. Int. J. Innov. Sci. Res. Technol. (IJISRT) 2020, 5, 24–29. [Google Scholar] [CrossRef]
- Malky, A.; Mendizábal, C.; y Bobka, S. Estudios Transversales: Desarrollo Local a Partir del Turismo en Áreas Protegidas; SDSN Bolivia: La Paz, Bolivia, 2020; Available online: https://www.conservation-strategy.org/node/437799 (accessed on 13 January 2025).
Disclaimer/Publisher’s Note: The statements, opinions and data contained in all publications are solely those of the individual author(s) and contributor(s) and not of MDPI and/or the editor(s). MDPI and/or the editor(s) disclaim responsibility for any injury to people or property resulting from any ideas, methods, instructions or products referred to in the content. |
© 2025 by the authors. Licensee MDPI, Basel, Switzerland. This article is an open access article distributed under the terms and conditions of the Creative Commons Attribution (CC BY) license (https://creativecommons.org/licenses/by/4.0/).