Article

The Variations in Soil Microbial Communities and Their Mechanisms Along an Elevation Gradient in the Qilian Mountains, China

1
College of Geosciences, Qinghai Normal University, Xining 810008, China
2
Xinjiang Academy of Forestry Science, Urumqi 830046, China
3
College of Life Sciences, Qinghai Normal University, Xining 810008, China
4
Key Laboratory of Biodiversity Formation Mechanism and Comprehensive Utilization in Qinghai-Tibet Plateau, Qinghai Normal University, Xining 810008, China
5
College of Ecology, Lanzhou University, Lanzhou 730000, China
*
Author to whom correspondence should be addressed.
Sustainability 2025, 17(5), 1797; https://doi.org/10.3390/su17051797
Submission received: 31 December 2024 / Revised: 12 February 2025 / Accepted: 12 February 2025 / Published: 20 February 2025

Abstract

:
Untangling the multiple drivers that affect biodiversity along elevation gradients is crucial for predicting the consequences of climate change on mountain ecosystems. However, the distribution patterns of microorganisms along elevation gradients have not yet been clarified, in particular when associated with strong changes in dominant species. Five typical vegetation types (i.e., coniferous forests, meadow grasslands, alpine shrubs, alpine meadows, and sparse vegetation of limestone flats) from contrasting vegetation belts were selected to explore the influence of elevation gradients on soil microbial communities. The results showed that Actinobacteriota and Proteobacteria were the dominant bacterial phyla. Ascomycota and Basidiomycota were the prevalent fungal phyla. Soil bacterial alpha diversity increased with increasing elevation, while soil fungal alpha diversity showed an obvious mid-elevation pattern. The beta diversity of the bacterial and fungal communities reflected a clear spatial niche-differentiation, and indicated that herbaceous plants affected soil bacterial communities while shrubs preferred soil fungal communities. A correlation analysis showed that environmental factors had different contributions to the composition and diversity of soil microbial communities. Soil bacteria were primarily affected by soil properties, whereas fungi were affected by vegetation. The research results can improve the prediction of soil microbial ecological processes and patterns related to elevation, and provide a theoretical basis for maintaining the sustainable development of soil microbial biodiversity under the background of global change.

1. Introduction

Soil microbes mediate many ecosystem processes [1], such as litter decomposition, nutrient transformation, and primary production, providing critical links between plants and soil through complex interactions and feedback [2,3]. Gaining insight into the patterns of microbial diversity is essential for predicting climate change impacts on ecosystems worldwide [4]. Mountainous areas have a dramatic turnover in both climate and biota over relatively short elevational distances, powerfully providing “natural experiments” for biodiversity studies and underlying ecological mechanisms of microbial adaptation to environmental changes [5]. Recently, Zou et al. (2022) reported an increase in bacterial diversity with increasing elevation on the Tibetan Plateau [6], while others found either hump-shaped or no obvious trends [7,8]. Additionally, other studies have also revealed the similarities and differences in the elevational distribution patterns of microbial diversity [9,10]. For example, in the tropics, Shen et al. (2020) discovered that bacterial and fungal diversity exhibited a U-shaped and a monotonic decreasing pattern, respectively [11]. However, there are inconsistencies documented with respect to the soil microbial diversity along elevational gradients. Overall, these mixed results suggest that elucidating the ecological drivers of these biogeographical patterns constitutes still a key task.
Environmental factors were frequently reported as key factors shaping microbial elevational patterns [12]. Plant distribution, especially, has a considerable influence on the diversity and community structure of soil microorganisms along elevation gradients [13]. In the mountains of Eurasia, the presence and composition of plant communities can influence the diversity and community structure of soil microorganisms [14]. In a subtropical forest, the distribution and characteristics of plants along an elevational gradient determines the ecology and development of soil microorganisms [15]. Soil characteristics are critical to the diversity of organisms above and below ground [16,17]. For instance, soil pH is highly correlated with the changes in biodiversity and community composition that occur with elevation, especially for bacteria [17,18]. These changes in diversity are also correlated with changes in soil phosphorus, carbon, nitrogen, and potassium ion concentrations [19]. Nevertheless, the relative importance of plant-related and soil factors to above- and below-ground diversity is poorly known, as well as whether the relationships between diversity and the environment differ between microorganisms and plants [20,21].
Exploring environmental responses to biodiversity will contribute to our understanding of biodiversity maintenance mechanisms and ecosystem management developments.
The Qilian Mountains lie at the intersection of the Qinghai–Tibet Plateau, the Mongolian Plateau, and the Loess Plateau [22]. Due to the long elevation gradient of the Qilian Mountains, there are important changes in vegetation types, such as coniferous forests, meadow grasslands, alpine shrubs, alpine meadows, and sparse vegetation of limestone flats [23]. These important biological and environmental changes are ideal for studying the dynamic processes of soil microorganisms and their relationship with soil properties and above-ground vegetation communities in mountainous ecosystems. Compared with other regions, there are fewer reports on the patterns of soil microorganisms along the elevation gradients of the Qilian Mountains.
In this study, we utilized 16S and ITS amplicon sequencing to determine the diversity and composition of bacterial and fungal communities. We hypothesized that (i) soil bacterial and fungal communities would respond differently to elevation, and both would exhibit spatial niche differentiation; and (ii) environmental factors, especially plant communities and soil properties, would impact the soil microbial community, causing differences in both composition and diversity along the elevation gradient, with fungi and bacteria responding differently according to their ecological traits and niche requirements. Therefore, five typical vegetation types (i.e., coniferous forests, meadow grasslands, alpine shrubs, alpine meadows, and sparse vegetation of limestone flats) along the vertical belt of the Qilian Mountains were selected to explore the elevational patterns of bacterial and fungal communities and their driving ecological factors.

2. Materials and Methods

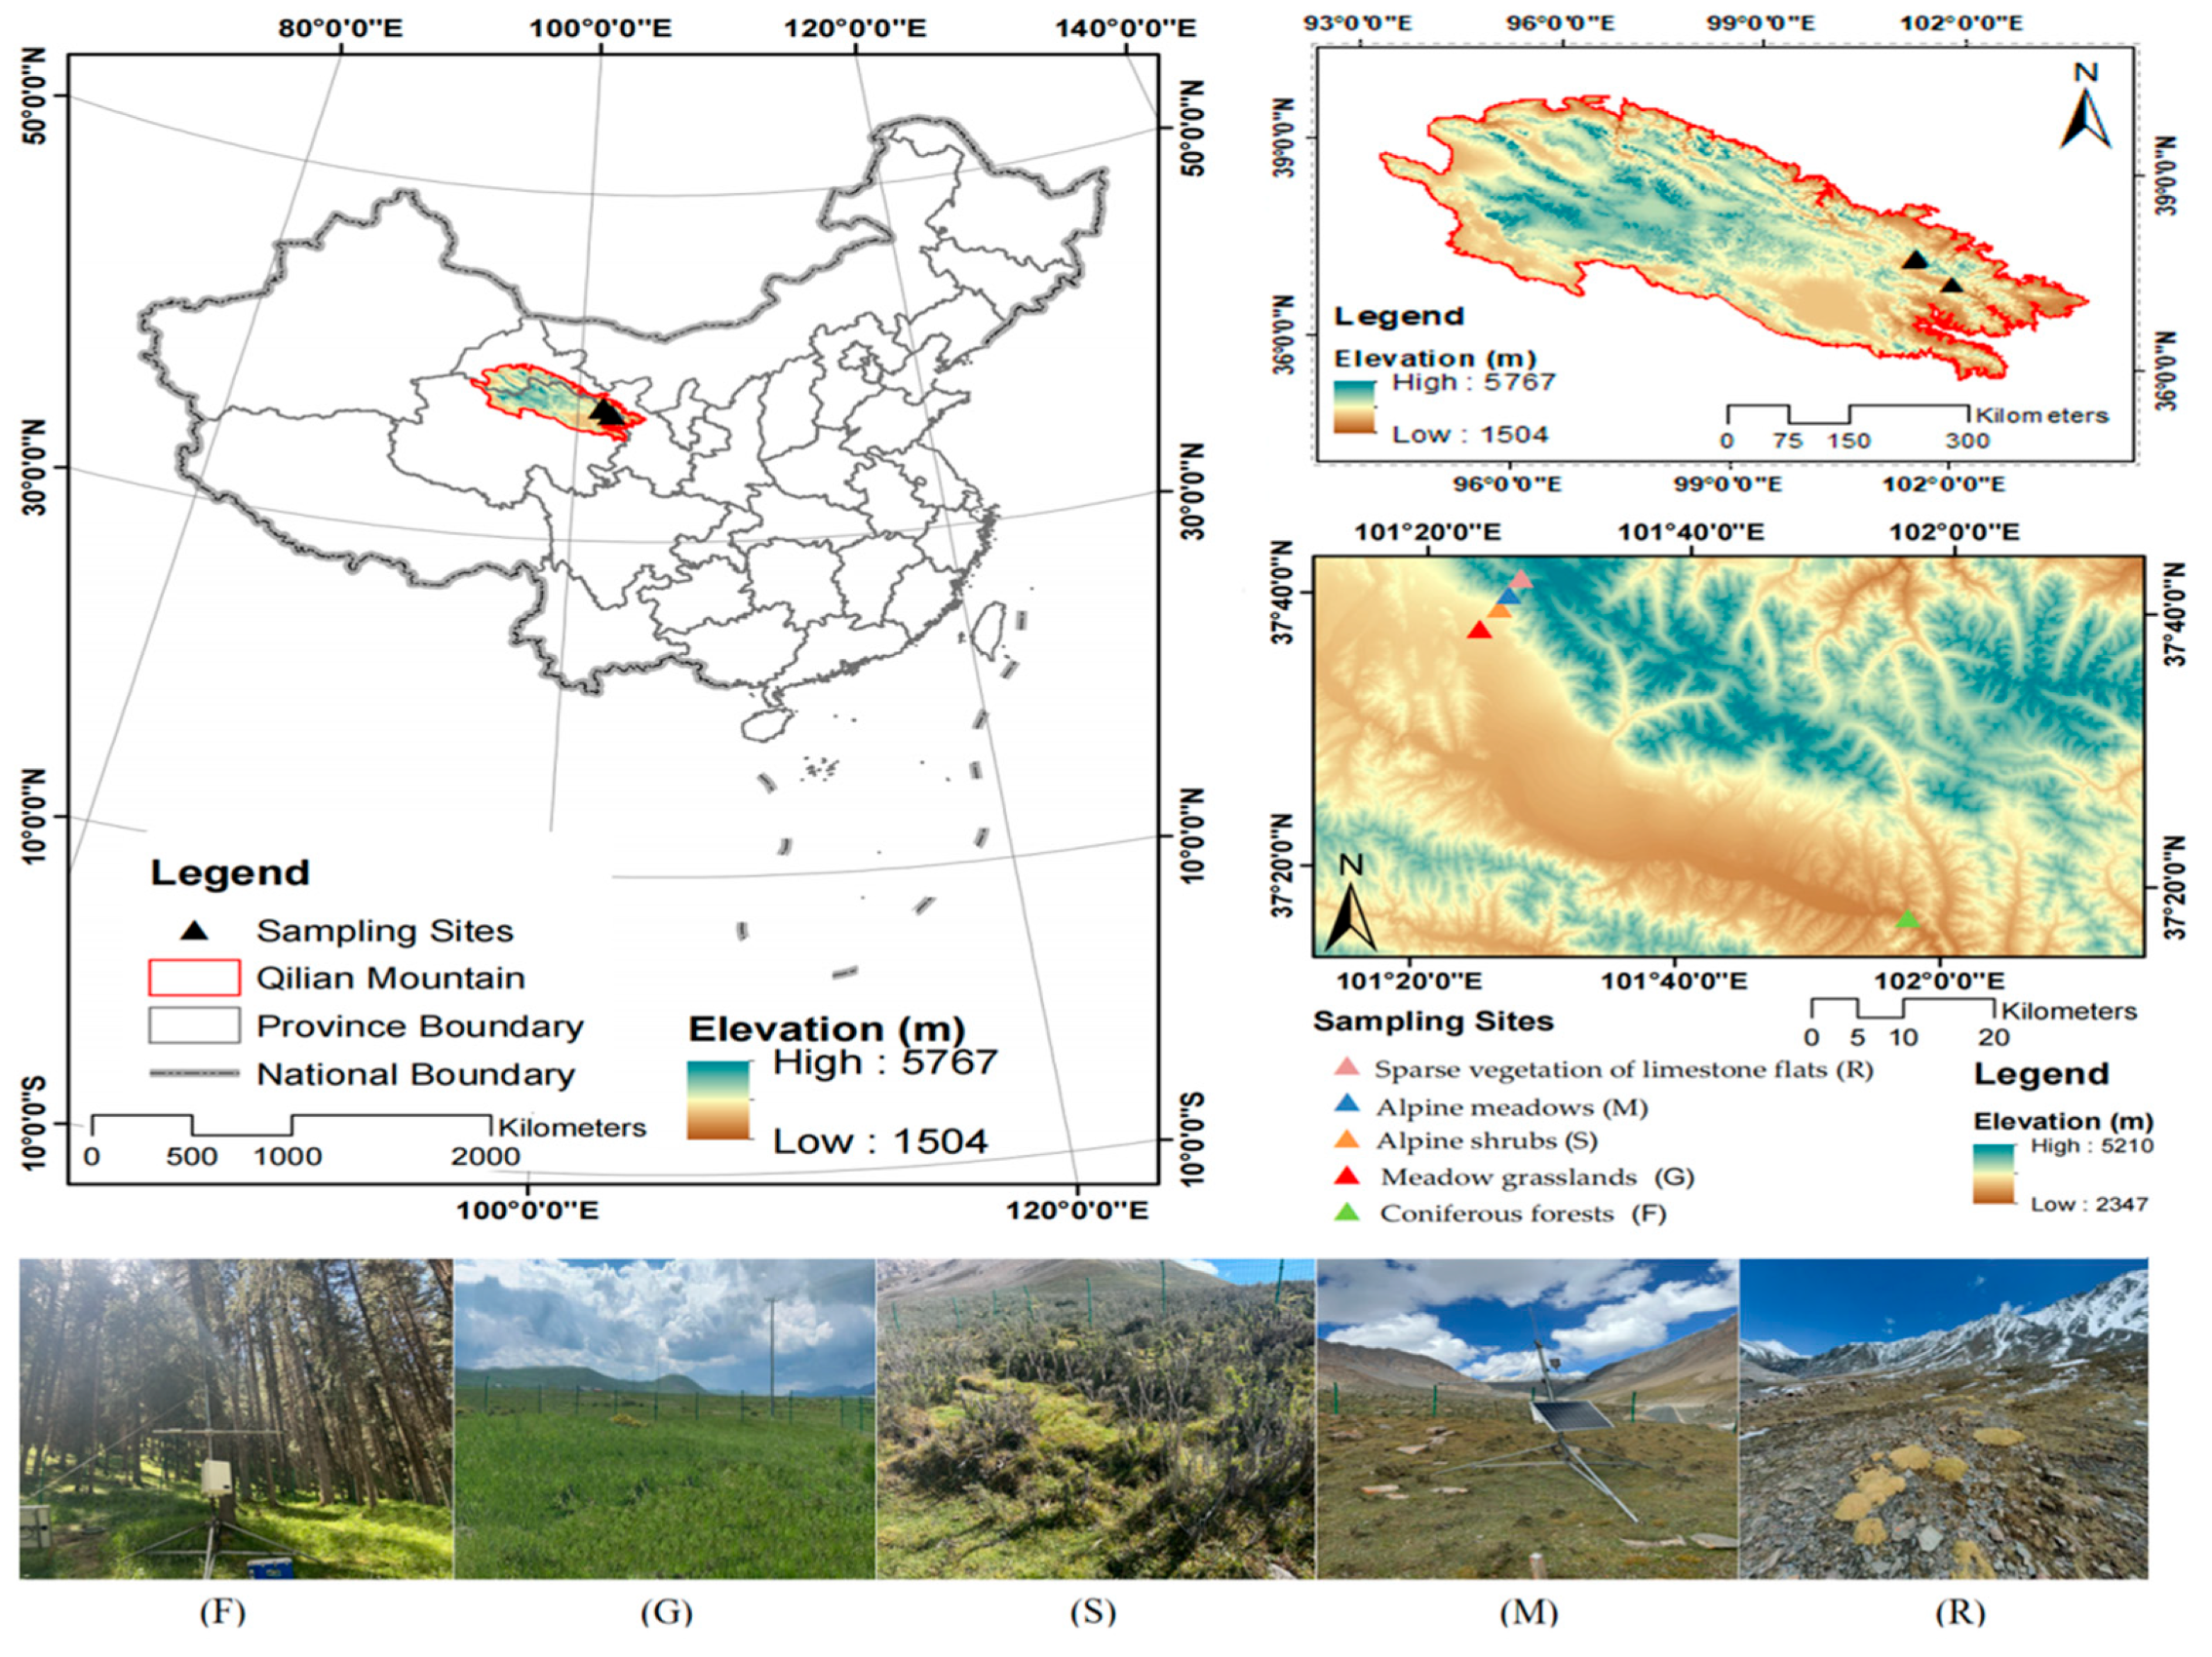
2.1. Overview of the Study Area

This study was conducted at the Qilian Mountain National Nature Park of Xianmi Forest farm in Lenglongling (101°24′11″~101°57′29″ E, 37°17′25″~37°41′30″ N; http:www.gscloud.cn/ accessed on 26 February 2023; Figure 1). The region is characterized by a continental plateau climate [22]. The total solar radiation is 5916–15,000 MJ·m−2, and the annual sunshine duration is 2500–3300 h. The average annual temperature is below 4 °C, the extreme maximum temperature is 37.6 ° C, and the extreme minimum temperature is −35.8 °C. The average annual precipitation is 400 mm and evaporation is 1137~2581 mm. The average wind speed is about 2 m·s−1, and there is no absolute frost-free period throughout the year. The complex topography and diverse habitats form differences in the typical vegetation in coniferous forests, meadow grasslands, alpine shrubs, alpine meadows, and sparse vegetation of limestone flats. The corresponding soil types of vegetation types were mountain gray-brown soil, subalpine meadow soil, alpine shrub–meadow soil, alpine meadow soil and frigid desert soil.

2.2. Study Site Establishment and Sample Collection and Treatment

Five typical vegetation types (i.e., coniferous forests, meadow grasslands, alpine shrubs, alpine meadows, sparse vegetation of limestone flats) along Qilian Mountains were selected as the research regions (Table 1). According to similar slopes and slope directions, we randomly established four plots within each vegetation type. Each plot area was 20 m × 20 m. Plant characteristics surveys and soil samples were collected in August 2021.
The soil samples (0~10 cm depth) were collected, using a steel auger, from three sampling points that were randomly arranged in each plot and mixed well as a sample. There were 4 replicates per sample. The collected soil samples were marked, put into a sealed bag, and immediately sent back to the laboratory in a cooler. All soil samples were screened with a 2 mm screen and then divided into two parts: one was stored in a refrigerator at −20 °C for microbial studies, and the other was stored at 4 °C for the determination of soil physiochemical properties.
For the plant characteristics, the species names, coverage, and heights were recorded within plots of 4 tree (10 m × 10 m), 4 shrub (5 m × 5 m), and 8 herb (1 m × 1 m) monitoring quadrants. Plant species are identified by the plant taxonomist through the method of plant morphology. Plant coverage was estimated visually, i.e., by percentage. For plant height, a steel tape measurer was used to measure the vertical height between the highest point and the ground in natural state of plants in the sample square, as expressed in cm. For average height of species, 5 plants (clusters) from each species were randomly selected to measure the vertical height between the highest point and the ground in their natural state with a tape measure, which was represented in cm. Plant diversity was calculated based on the relative height and coverage of plant species [24]. The detailed calculation method is as follows:
(1) IV = R c + R h 2 ;
(2) Species richness index (Splant): the number, N, of total species in all plots;
(3) Shannon–Wiener index (Hplant) = − i = 1 s P i ln P i ;
(4) Pielou evenness index (Jplant) = Hplant/ln Splant.
Where IV is the importance value of species; Rc is the relative coverage of species; Rh is the relative height of species; and Pi = IV/100.

2.3. Sample Determination

2.3.1. Determination of Soil Physiochemical Properties

Soil moisture content (MC) was measured using the gravimetric method [25]. Soil bulk density (BD) was measured using the ring knife method [25]. Soil pH was determined using an automatic titrator (Metrohm 702, Herisau, Switzerland) in 1:2.5 soil–water suspensions. Total nitrogen (TN) and total carbon (TC) were measured using an Elementar Vario ELIII elemental analyzer (Langenselbold, Germany) [26]. Total phosphorus (TP) content was determined by melt-molybdenum, antimony, and scandium colorimetry, and available phosphorus (AP) was measured using the Olsen method [27]. Ammonium (NH4+-N) and nitrate nitrogen (NO3-N) were determined following extractions of fresh soil with 2 M KCl for 18 h, and analyzed colorimetrically using a continuous flow analyzer (FUTURA, Alliance Instruments, Frépillon, France) [26].

2.3.2. Determination of Soil Microorganisms

According to the manufacturer’s instructions, the total DNA of soil samples were extracted by kits (Omega Bio-tek, Norcross, GA, USA), and the DNA concentration was quantified by NanoDrop 2000 spectrophotometer (Thermo Scientific Inc., Waltham, MA, USA) at 260 nm. Agarose gel electrophoresis (1%) was used to check DNA quality. Then, the extracted DNA samples were stored at −20 °C until use. Pyrosequencing was conducted using the Miseq platform (Shanghai Meiji Biomedical Technology Co., Ltd., Shanghai, China). 338F (5′-ACTCCTACGGGAGGCAGCAG-3′) and 806R (5′-GGACTACHVGGGTWTCTAAT-3′) to perform amplicon pyrosequencing of soil DNA against the V3 and V4 regions of 16S rRNA, using the primers ITS1 (5′-TCCGTAGGTGAACCTGCGG-3′) and ITS4 (5′-TCCTCCGCTTATTGATATGC-3′) to amplify fungal diversity against internal transcribed spacers (ITS) rRNA [28]. PCR amplification proceeded as follows: initial denaturation at 95 °C (3 min), followed by 30 cycles of 95 °C denaturation (30 s), 55 °C annealing (30 s), 72 °C extension (45 s), and finally, 72 °C extension (10 min) ending at 4 °C. PCR products were detected by agarose gel electrophoresis (2%) and further purified with AxyPrep DNA Gel Extraction Kit (Axygen Biosciences, Union City, CA, USA). The purified amplicons were paired and sequenced on the Illumina Miseq PE300/NovaSeq PE250 platform (Shanghai Meiji Biomedical Technology Co., Ltd., Shanghai, China). FLASH [29] (http://www.cbcb.umd.edu/software/flash, accessed on 16 March 2022, version 1.2.11) was used to filter and merge the raw fastq [30] (https://github.com/OpenGene/fastp, accessed on 16 March 2022, version 0.19.6) using UPARSE (http://drive5.com/uparse/, accessed on 16 March 2022, version 7.1) similarity (97%) clustering [31,32]. The UCHIME method was used to identify and remove chimeric OTUs [31]. The Ribosomal Database Project (RDP) Classifier [33] (http://rdp.cme.msu.edu/, accessed on 17 March 2022, version 2.11) was used for 16S rRNA database (http://www.arb-silva.de, accessed on 18 March 2022) and ITsrRNA database (http://unite.ut.ee/index.php, accessed on 17 March 2022) classification analysis, with a confidence threshold of 0.7.

2.4. Statistical Analyses

The mothur software (http://www.mothur.org/wiki/Calculators, accessed on 24 May 2022) was used to obtain richness, Shannon, Simpson, chao1, ace, and Good’s coverage, and to evaluate the alpha diversity of soil bacteria and soil fungi. A one-way analysis of variation (ANOVA) and a least significant difference (LSD) multiple comparison (p < 0.05) were used to assess the significant effects of soil properties and soil microbial diversity. Statistical analyses of the data were carried out using SPSS v20.0. Non-metric multi-dimensional scaling (NMDS) and Bray–Curtis dissimilarity describe the beta diversity of soil microorganisms. Pearson and redundancy analyses (RDA) were performed to identify the relationship between environmental factors and soil microbial communities. Construction and visualization of structural equation models (SEM) was carried out using the R platform’s lavaan and semplot packages (R Development Core Team (v4.1.2).

3. Results

3.1. Soil Properties Along an Elevation Gradient

Soil physicochemical properties of 0~10 cm depth showed varied patterns along the elevation gradient (Table 2). The soil moisture decreased with increasing elevation. However, the soil bulk density generally showed a gradual increase along with the increasing elevation, and the soil bulk density in the sparse vegetation of limestone flats reached a maximum value of 2.25 g·cm−3. There were not significant differences in the soil pH in different vegetation types. The concentration of NH4+-N showed no significant differences along the elevation gradient, whereas NO3-N decreased with the increasing elevation. NH4+-N was the main inorganic nitrogen form for all vegetation types. The AP content of the limestone flats was significantly higher than the other vegetation types. The concentrations of soil TC, TN, and TP in the different vegetation were 15.33~99.19, 1.63~8.90, and 0.55~0.62 g·kg−1, respectively. The TC and TN in the soil gradually decreased with increasing elevation. There were no significance differences in the soil TP along the elevation gradient. The soil C:N, C:P, and N:P were 9.52~11.30, 29.89~215.28, and 3.18~40.74. The soil C:N and C:P gradually decreased with increasing elevation. The soil N:P was significantly lower in the sparse vegetation of limestone flats than in the other vegetation types.

3.2. Plant Diversity Along an Elevation Gradient

Plant diversities varied significantly with elevation (Table 3). The plant richness and Shannon index are lower at lower elevations (coniferous forests) and higher elevations (alpine meadows and sparse vegetation of limestone flats), and peak at middle elevations (meadow meadows and alpine shrublands). The Pielou evenness indices are lower in the coniferous forests, alpine shrubs, and sparse vegetation of limestone flats, and higher in the meadow grasslands and alpine meadows. In conclusion, the plant richness and diversity indices all showed a mid-altitude model.

3.3. Microbial Diversity and Composition Along an Elevation Gradient

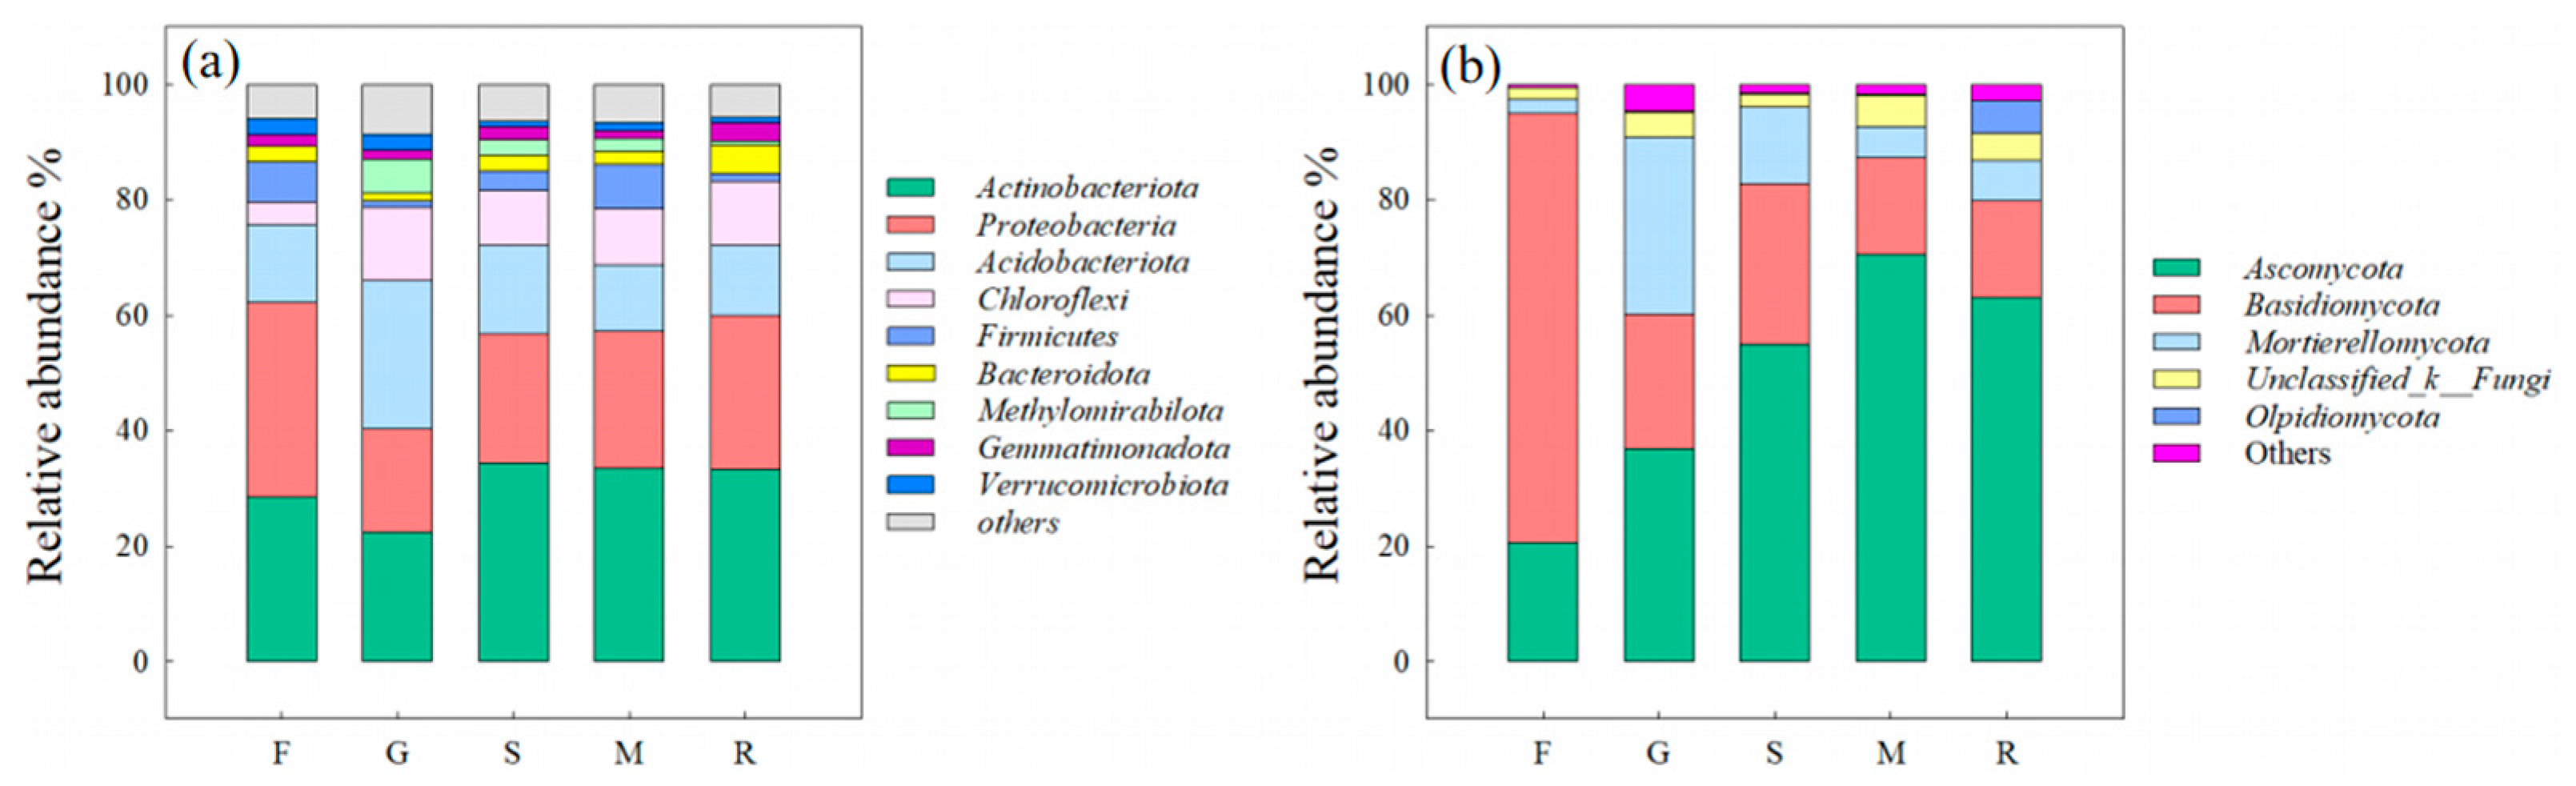
3.3.1. Composition of Bacterial and Fungal Communities

Taxonomic classification determined that Actinobacteriota, Proteobacteria, Acidobacteriota, Chloroflexi, Firmicutes, Bacteroidota, Methylomirabilota, Gemmatimonadota, and Verrucomicrobiota were the dominant bacterial phyla (Figure 2a). Among them, the relative abundance of Actinobacteriota, Proteobacteria, and Acidobacteriota were higher in the soil from all vegetation types. The relative abundance of Actinobacteriota and Proteobacteria were lower in the soil from the meadow grasslands at mid-elevation, but higher in the soil from the coniferous forests and sparse vegetation of limestone flats at low and high elevations, but Acidobacteria and Chlorobacteria showed the opposite pattern.
Fungal communities, including Ascomycota, Basidiomycota and Mortierellomycota, were the prevalent fungal phyla, but their relative abundance varies significantly with elevation (Figure 2b). Basidiomycota increased gradually with increasing elevation, except for in the sparse vegetation of limestone flats. Ascomycota was the highest in the soil from the coniferous forests at a low elevation (74.3%). Mortierellomycota was higher in the soil from medium-elevation meadow grasslands, but lower in the soil from the coniferous forests and sparse vegetation of limestone flats at low and high elevations.

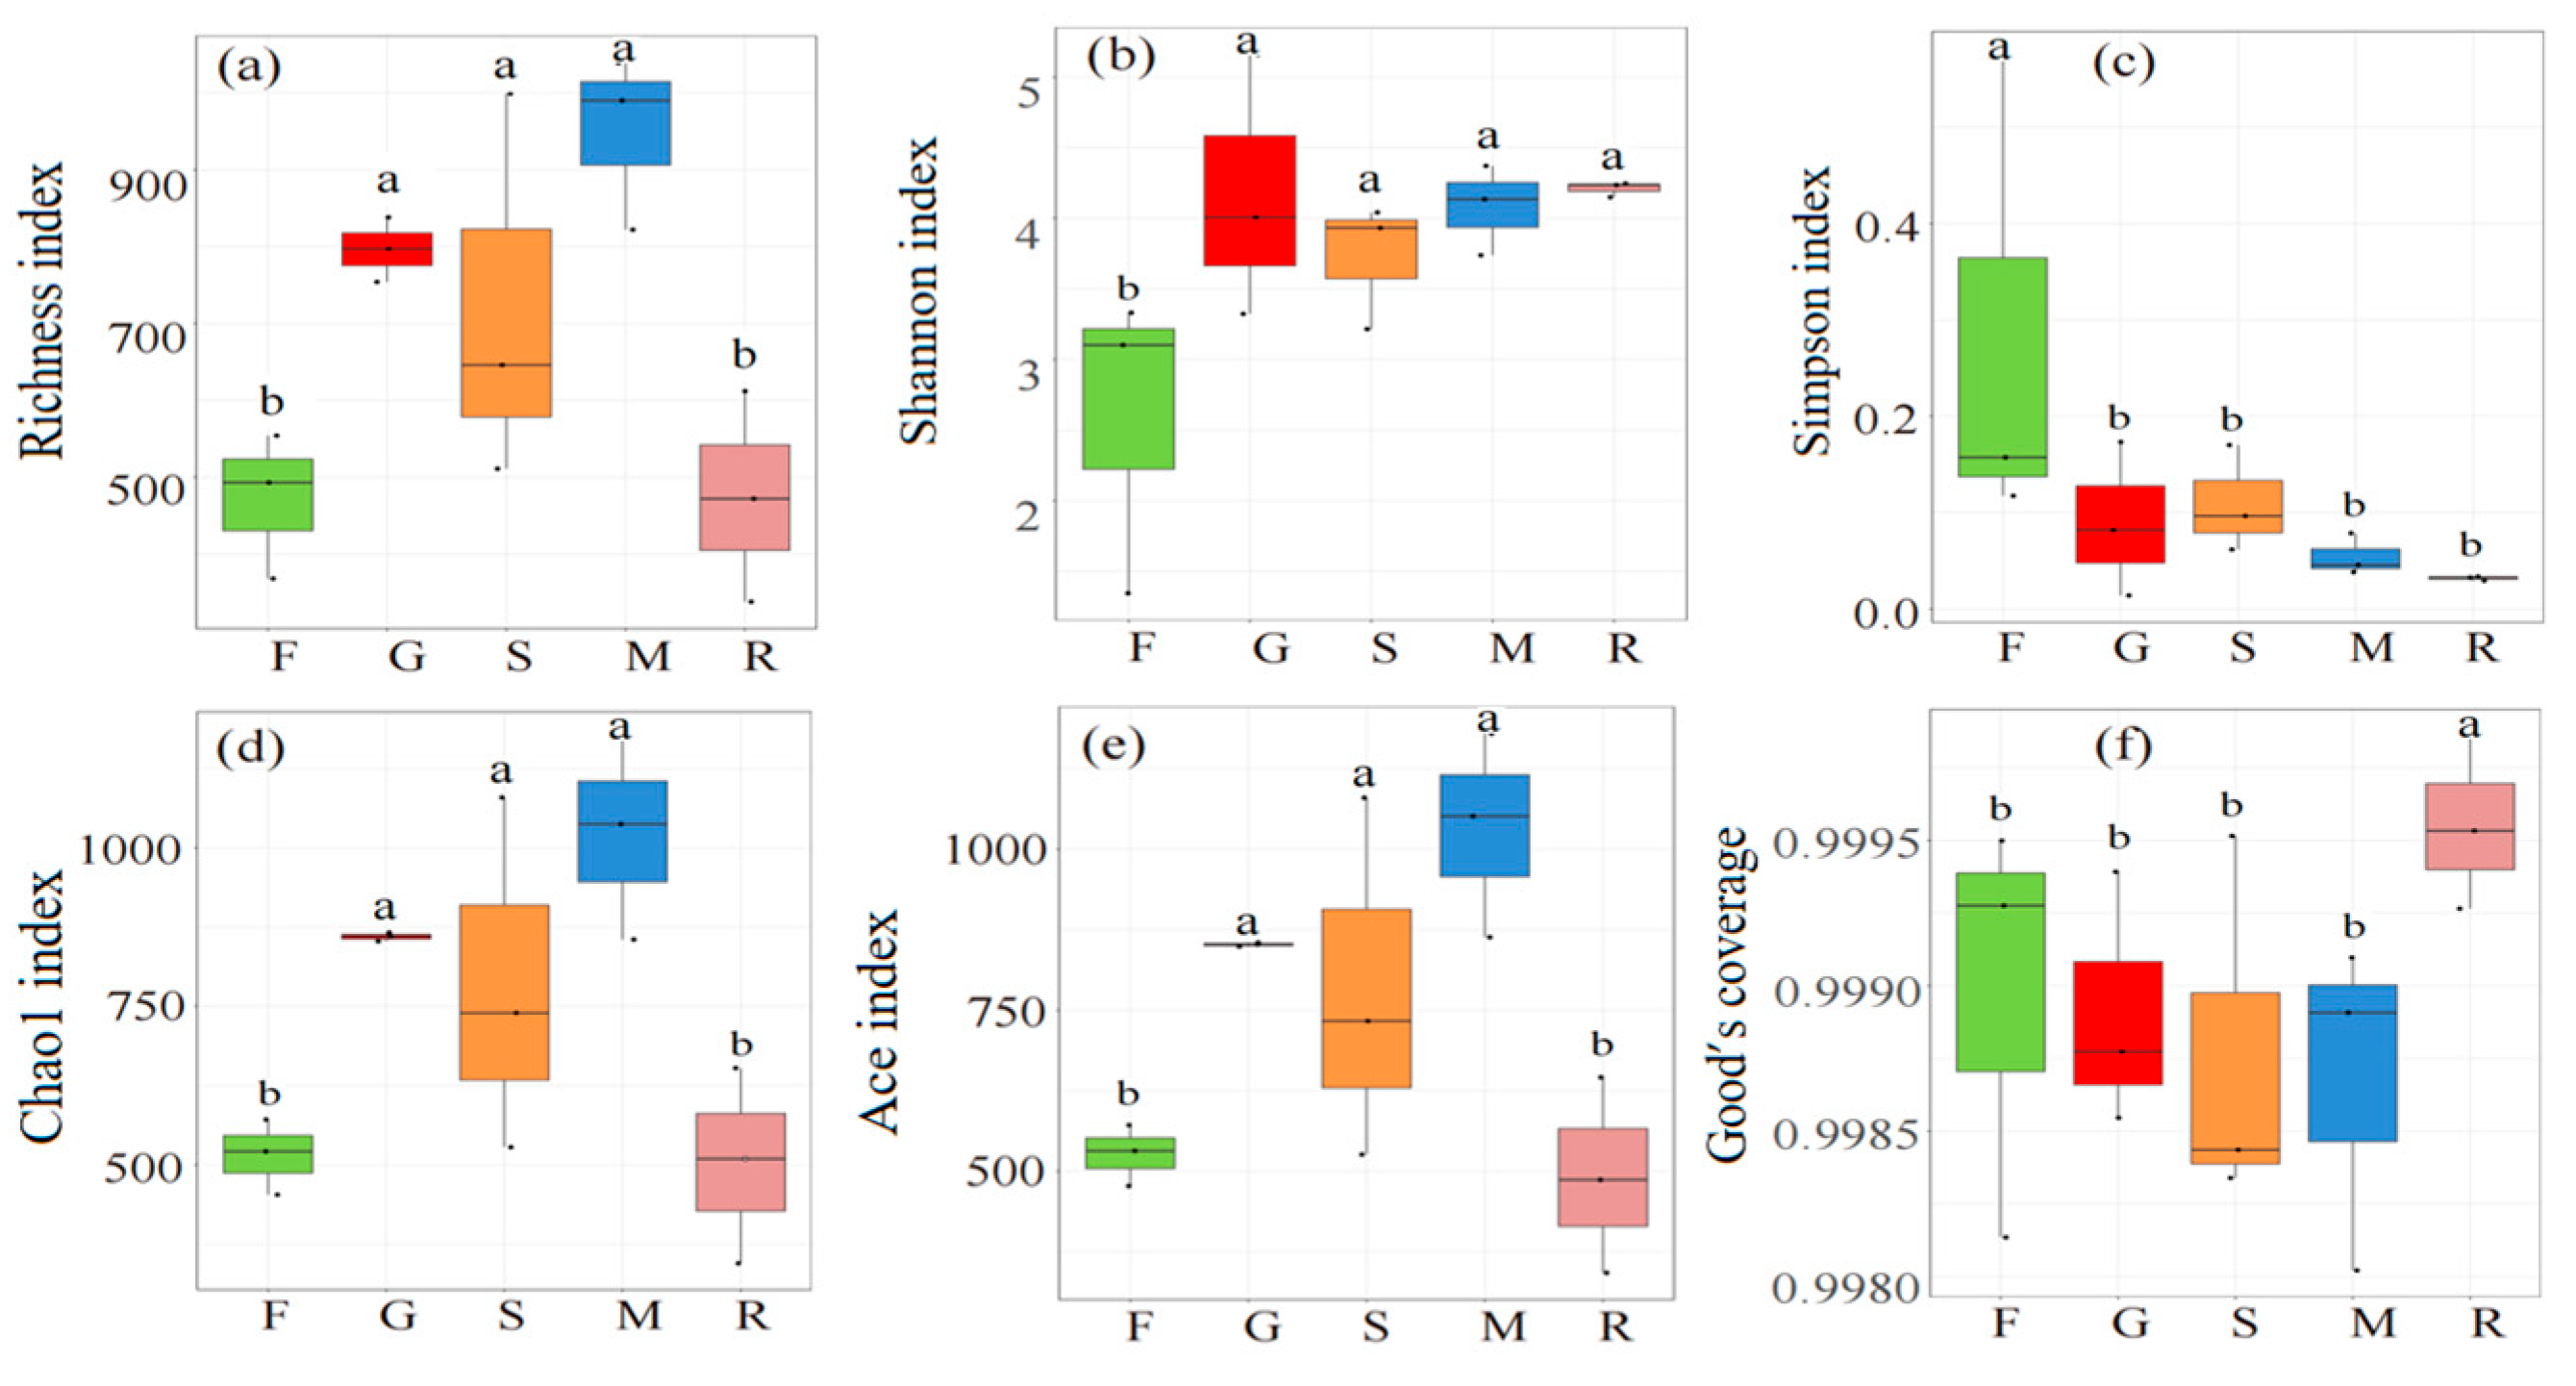
3.3.2. Diversity of Bacterial and Fungal Communities

The soil bacterial (Figure 3) and fungal (Figure 4) alpha diversity responded differently to elevation. The richness (Figure 3a), chao1 (Figure 3d), ace (Figure 3e), and Shannon (Figure 3b) indices of the bacterial communities increased with elevation. The richness (Figure 4a), chao1 (Figure 4d), and ace (Figure 4e) indices of fungal communities were higher in the mid-elevation meadow grasslands, alpine shrubs, and alpine meadows, but lower in the low and high altitude coniferous forests and sparse vegetation of limestone flats.
Beta diversity refers to differences along the environmental gradients of soil microbial communities. Non-metric multi-dimensional scaling (NMDS) and Bray–Curtis dissimilarity were used to reflect the clustering of the vegetation, which indicated the similarity in the beta diversity (Figure 5). The bacterial communities from coniferous forests and sparse vegetation of limestone flats were clearly dissimilar in their composition, but meadow grasslands, alpine shrubs, and alpine meadows were similar (Figure 5a,c). Fungal communities from the coniferous forests, alpine shrubs, and sparse vegetation were dissimilar, but the meadow grasslands and alpine meadows were similar (Figure 5b,c).

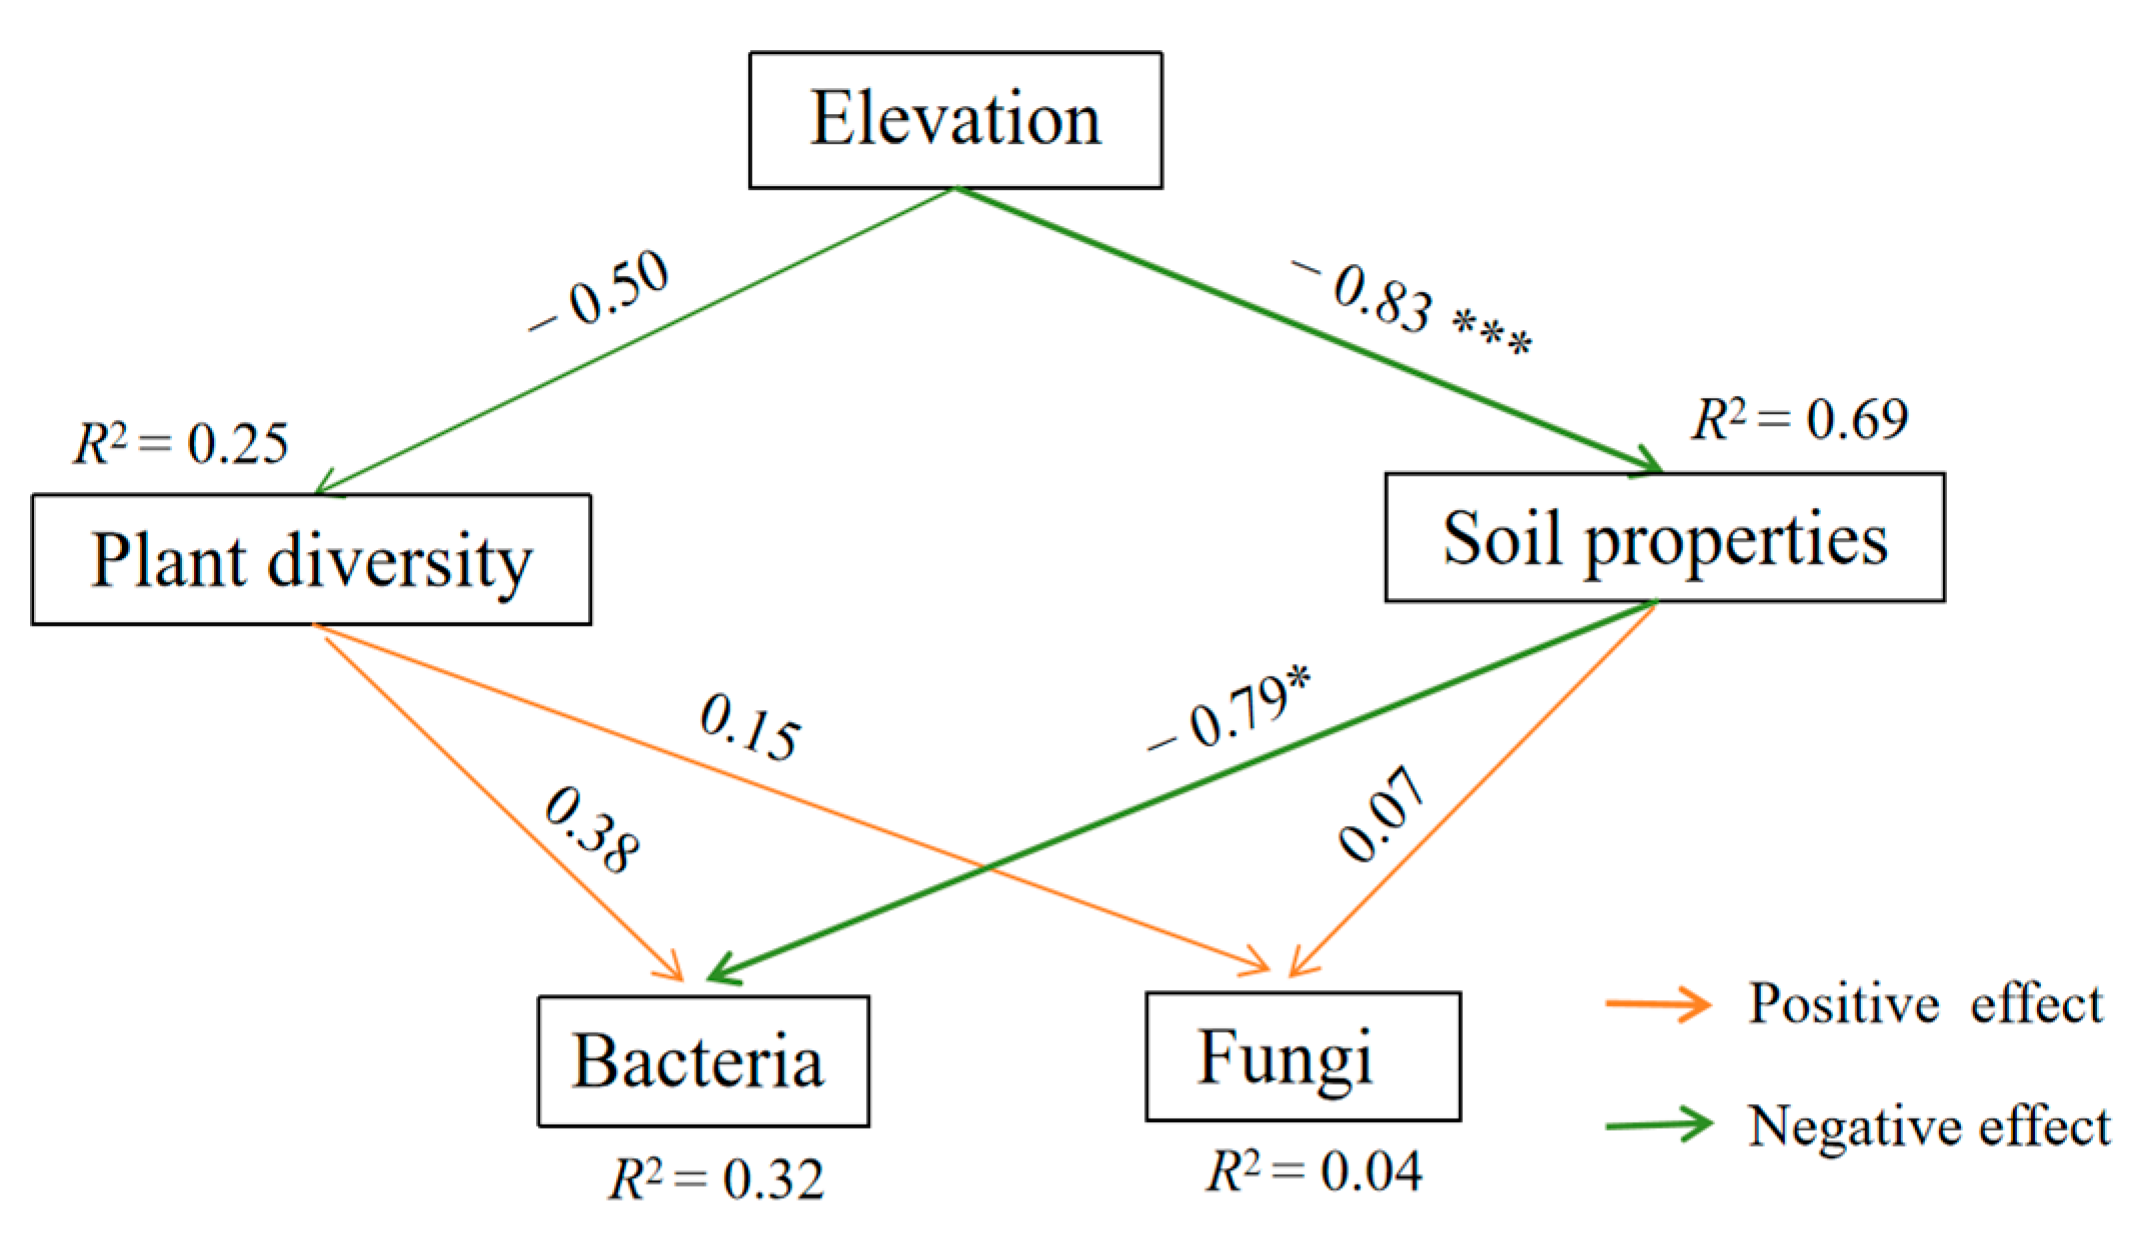
3.3.3. Relationships Between Soil Properties, Plant Diversity, and Soil Microbial Communities

According to the RDA, all the environmental factors accounted for 84.0% and 89.9% of the variance in the composition of the bacterial and fungal communities, respectively (Figure 6). NO3-N, TN, and SM significantly contributed to the dominant bacterial phyla (p < 0.05; Figure 6b). Among them, NO3-N was the most significant contributor, with a relative contribution of more than 40%. The content of NO3-N was positively correlated with Chloroflexi and Methylomicrobia, while it was negatively correlated with Firmicutes and Proteobacteria (Figure 6a). However, for the fungal community, NO3-N had little effect on the dominant fungal phyla (Figure 6d). BD, plant Shannon diversity, and species richness significantly contributed to the dominant fungal phyla (p < 0.05; Figure 6b). Among them, BD was the most significant contributor, with a relative contribution of more than 50%. BD was positively correlated with Basidiomycota, while it was negatively correlated with Olpidiomycota (Figure 6c).
Pearson correlation analysis was used to estimate the relationship between environmental factors and soil microbial communities. For bacteria (Figure 7a), Actinobacteriota was only negatively correlated with Splant (p < 0.05). Proteobacteria were significantly positively correlated with BD and AP, and negatively correlated with TN, TC, NO3-N, and Splant (p < 0.05), while Chloroflexi and Methylomiradilota showed an opposite trend. Acidobacteriota was significantly positively correlated with NO3-N and Splant (p < 0.05). Additionally, SM was a key factor, which was negatively corrected with the four alpha diversity index of the bacteria (p < 0.05). For fungi (Figure 7b), Ascomycota was significantly positively correlated with TN, TC, and SM, and negatively correlated with BD (p < 0.05), while Basidiomycota showed a opposite trend. In addition, Basidiomycota was also negatively correlated with NH4+-N (p < 0.05). Olpidiomycota was negatively correlated with Hplant and Jplant (p < 0.05). Regarding fungal diversity, the index of richness, chao1, and ace were all negatively corrected with Jplant (p < 0.05), and the Shannon diversity index were positive corrected with SM and C:N (p < 0.05).
Considering the collinearity of the factors across spatial scales, we used SEM to estimate the direct and indirect effects of environmental factors on the soil microorganisms (Figure 8). The results showed that elevation was negatively correlated with plant diversity and soil properties. Plant diversity was positively correlated with soil bacteria and fungi. Soil properties were positively correlated with fungi and negatively correlated with bacteria. In summary, elevation directly affects soil properties, and indirectly affects soil bacteria.

4. Discussion

In this study on the Qilian Mountain soil microbial community, we found that the diversity of bacterial and fungal communities reflected a clear spatial niche differentiation. Soil bacteria increased with increasing elevation, and soil fungi showed an obvious mid-elevation pattern, which are likely due to their distinct ecological traits. Bacteria are mainly influenced by soil properties, while fungi prefer to be influenced by plant communities. These findings generally align with our hypothesis.

4.1. Elevational Soil Microbial Composition and Diversity

Spatial heterogeneity, which creates a complex and diverse environment, is a key factor affecting the soil microbial community [34]. Elevation, as a crucial aspect of spatial heterogeneity, has a profound impact on the composition and distribution of soil bacterial communities in our study (Figure 6). The elevation gradient is closely associated with non-biological changes, such as temperature and precipitation [35]. As the elevation varies, the temperature shows a decreasing trend, and the precipitation patterns may also change. These changes directly and indirectly shape the living conditions of soil microorganisms. For example, lower elevations, relatively higher temperatures, and more stable water availability may provide a more favorable environment for some microbial species to thrive [36]. However, as elevation increases, the decreasing temperature may slow down the enzymatic reactions and physiological processes of microorganisms [37]. Additionally, changes in precipitation can affect the soil moisture content, which in turn influences the solubility and availability of nutrients in the soil. Microorganisms need to adapt to these changing conditions by adjusting their metabolic pathways and gene expression [38].
In this study, Actinobacteriota, Proteobacteria, and Acidobacteriota were the dominant bacterial phyla in the Qilian Mountain ecosystem, which is consistent with the results Wang et al. (2015) reported in the Tibetan Plateau [39]. Among the bacterial communities, Actinobacteriota are the largest saprophytic bacterial taxa and participate in soil nutrient cycling and energy conversion. Proteobacteria belong to eutrophic bacteria and require a large pool of organic matter to supply the energy for metabolic activities. In addition, Proteobacteria have the ability to adapt to environmental stress, and their higher concentration and the diversity of soil resources can regulate competitive species interactions within the phylum, thereby increasing their abundance. The relative abundance of Actinobacteriota and Proteobacteria were lower in the soil from meadow grasslands at mid-elevation, but higher in the soil from coniferous forests and sparse vegetation of limestone flats at low and high elevations. Acidobacteriota belongs to the acidophilus group and is more suitable for acidic conditions. They have gene sequences encoding cellulase and starch hydrolase, which can accelerate the decomposition of animal and plant residues to produce nutrients such as organic matter, so they are relatively higher in the soil from the meadow grasslands at mid-elevation.
Additionally, soil fungal communities, such as Ascomycota and Basidiomycota, are primary colonies, and their responses to elevation are different, which is consistent with the results of previous studies [40]. The Ascomycetes oligotrophs are rich in oxycellulase, and their relative abundance increases with elevation gradients, especially in the meadow grasslands, where herbaceous roots ease decomposition, and increase the relative abundance of Ascomycota. However, the eutrophic Basidiomycetes are thought to contain a large number of saprophytic fungi, and their relative abundance decreases with elevation. The high relative abundance of Basidiomycota in the coniferous forests might be due to its strong ability to synthesize enzymes that are required for the degradation of complex polymers, thus increasing their relative abundance. In addition, tree communities (Picea crassifolia) have substantially greater rhizosphere resource inputs from root exudation, and therefore may promote Basidiomycota. Hernandez et al. (2021) revealed that the abundance of eutrophic microorganisms decreased [41], while the abundance of oligotrophic microorganisms increased, along elevation gradients. Microbes at low elevations tend to consume more carbon sources than those at high elevations [42]. This suggests that, at low elevations, nutrients are abundant and Basidiomycetes thrive, while at high elevations, Ascomycetes can break down cellulosic substances to alleviate nutrient deficiencies due to enhanced resource constraints [43]. The relative abundance of Mortierellomycota was significantly higher in the alpine shrubs, which might be attributed to the shrub rhizosphere resource input by root exudation. Olpidiomycota could adapt to acidic and resource-limited conditions and have higher relative abundances in the higher elevation of the sparse vegetation of limestone flats. These results suggested that different bacterial and fungal phyla are clearly exhibiting spatial niche differentiation, showing different patterns of variation along the elevation gradient.
Microbial alpha diversity can reflect the overall law of microbial uniformity, as well as abundance and diversity, and the level of the species composition structure of the microbial community can be revealed from different aspects [44]. Previous studies have shown that soil microbial alpha diversity is relatively more driven by environmental factors, such as light, heat, soil pH, soil organic matter content, and soil moisture content [45,46]. In our research, there were significant differences in the soil bacterial and fungal communities at different elevations. The alpha diversity of the soil bacteria increased with increasing elevation, which may also be due to the changes in environmental factors caused by elevation changes, such as differences in the physical and chemical properties of soil under solar radiation, which led to differences in the microbial communities. In contrast, the soil fungi alpha diversity index showed an obvious mid-elevation effect, caused by the unique geographical location of the plateau, with better light, heat, and water conditions for microbial growth at mid-elevation. The resource advantages of mid-elevation landscapes in the Qhinghai–Tibetan Plateau can be distinguished from other tropical or regional unimodal patterns. Beta diversity refers to the diversity between habitats, which can represent the turnover of different species in different ecological niches. According to the theory of community ecology, increasing evidence suggests that niche availability (deterministic processes driven by environmental heterogeneity) determine microbial community assemblages, largely depending on the spatial scales, habitat types, etc. [47]. In this study, the clustering of the different samples reflects the soil microbial community structure. The beta diversity of the bacterial and fungal communities reflected a clear spatial niche differentiation. The bacterial beta diversity showed that the coniferous forests and sparse vegetation of limestone flats were separated, but the meadow grasslands, alpine shrubs, and alpine meadows were aggregated. For fungi, the coniferous forests, alpine shrubs, and sparse vegetation were segregated, but the meadow grasslands and alpine meadows were aggregated, which suggests that herbaceous plants affected the bacterial communities, while shrubs affected the fungal communities. Elevation shapes multiple landscape types and forms spatial niche differentiation.

4.2. Relationships Between Soil Microorganisms and Environmental Factors

Soil microorganisms are essential components in providing ecosystem services, and microbial community structures can influence a variety of ecosystem processes [48], such as plant community assembly, the flux of nutrients, and carbon storage [49,50]. Thus, it is important to understand the relationship between a soil microbial community and its environmental factors. Plant communities have a specific species composition and distribution, which significantly influence the soil microbial community, indicating different habitat conditions [51]. Our research shows that plant diversity significantly affects soil bacterial compositions. For example, the plant species richness is positively correlated with Acidobacteriota and Methylomirabilota, while it is negatively correlated with Actinobacteriota and Proteobacteria. In the case of fungi, plant diversity affects soil fungal compositions at mid-high elevations. For instance, the plant species richness is positively correlated with Mortierellomycota at mid-elevation, and the plant Shannon diversity index is negatively correlated with Olpidiomycota at a high elevation. Plant diversity is a key factor in maintaining the function and stability of the ecosystem [52]. Firstly, the root system of plants secretes a wide range of substances, such as root exudates, which contain sugars, amino acids, organic acids, and other compounds [53]. These root exudates provide a rich source of C and energy for soil microorganisms, promoting their growth and activity [54]. Different plant species may produce different types and amounts of root exudates, thereby selectively supporting the growth of specific microbial taxa. In our study, plant species richness had a close correlation with Actinobacteriota (Figure 6), which supports the above theory. Secondly, plant diversity affects the physical and chemical properties of the soil. Plants with different growth forms and root architectures can modify the soil structure, porosity, and oxygen content [55]. This, in turn, influences the distribution and activity of soil microorganisms. For instance, deep-rooted plants can bring up nutrients from deeper soil layers and make them available to microorganisms in the surface soil [56].
Soil properties play a crucial role in determining the distribution, activity, and community structure of soil microorganisms. For instance, the concentrations of TC and TN have a significant impact on microbial communities [57]. In our study, as the elevation increases, the amount of litter and root inputs may change, affecting the availability of C and N sources for microorganisms. The correlation analysis revealed that TC and TN have a complex relationship with different soil microbial taxa. The TC and TN are positively correlated with certain soil bacteria, such as Chloroflexi and Methylomirabilota, as well as the soil fungi Ascomycota. This positive correlation suggests that these microbial taxa may have a preference for or be well-adapted to environments with higher C and N contents. On the other hand, they are negatively correlated with the soil bacteria Proteobacteria and the soil fungi Basidiomycota, indicating that these taxa may have different ecological niches or metabolic strategies [58]. In addition to TC and TN, other soil properties also influence soil microorganisms. For example, the form and availability of N in the soil can have a significant impact. Although ammonium is the main inorganic N form for all vegetation types, NH4+-N does not show significant correlations with the microbial composition and community diversity. In contrast, NO3-N is significantly positively correlated with Acidobacteriota, Chloroflexi, and Methylomirabilota, and is negatively correlated with Proteobacteria and Bacteroidota. This indicates that different N forms may have different effects on microbial communities, which may be related to the ability of microorganisms to utilize different N sources [59]. Soil moisture is another important factor. Soil bacterial diversity is often related to soil moisture. Adequate soil moisture provides a suitable environment for microbial growth and metabolism, affecting their survival and reproduction [60]. Overall, soil properties interact with each other and jointly affect the diversity and composition of soil microbial community.

5. Conclusions

Environmental factors, especially plant communities and soil properties, impact the soil microbial community, causing differences in both composition and diversity along the elevation gradient. Soil bacteria increased with increasing elevation, and soil fungi showed an obvious mid-elevation pattern. Fungi and bacteria respond differently according to their ecological traits and niche requirements, which likely due to their distinct ecological traits. All ecological factors showed that NO3-N, TN, SM, and pH were the four most important contributors to soil bacteria phyla. For soil fungi, the most important factors were BD, Hplant, and Splant. Bacteria are mainly influenced by soil properties, while fungi prefer to be influenced by plant communities. Our study strengthens the current understanding of the complex patterns and multiple drivers affecting soil microbial communities along elevation gradients, and provides a theoretical basis for biodiversity sustainability research in the context of global change.

Author Contributions

Investigation, writing—review and editing, L.B.; data curation and investigation, Z.C. and Y.X.; formal analysis and investigation, X.C.; conceptualization, methodology, funding acquisition, data curation, formal analysis, investigation, writing—original draft, writing—review and editing, W.W. All authors have read and agreed to the published version of the manuscript.

Funding

This work was supported by the National Key R&D Program of China (2023YFF1304305), the Second Tibetan Plateau Scientific Expedition and Research (STEP) Program (2019QZKK0302), and the 111Project (D23029), Qinghai Province’s first batch of special funds for the central government to guide local scientific and technological development in 2021. The authors are particularly grateful to Pierre Liancourt and Richard Michalet for their help in revising the manuscript.

Institutional Review Board Statement

Not applicable.

Informed Consent Statement

Not applicable.

Data Availability Statement

Data are contained within the article.

Conflicts of Interest

The authors declare no conflicts of interest.

References

  1. Falkowski, P.G.; Frenchel, T.; Delong, E.F. The microbial engines that drive Earth’s biogeochemical cycles. Science 2008, 320, 1034–1039. [Google Scholar] [CrossRef] [PubMed]
  2. Bahram, M.; Hildebrand, F.; Forslund, S.K.; Anderson, J.L.; Soudzilovskaia, N.A.; van Bodegom, P.; Bengtsson-Palme, J.; Anslan, S.; Coelho, L.P.; Harend, H. Structure and function of the global topsoil microbiome. Nature 2018, 560, 233–237. [Google Scholar] [CrossRef]
  3. Delgado-Baquerizo, M.; Eldridge, D.J.; Liu, Y.R.; Sokoya, B.; Wang, J.T.; Hu, H.W.; He, J.Z.; Bastida, F.; Moreno, J.L.; Bamigboye, A.R.; et al. Global homogenization of the structure and function in the soil microbiome of urban greenspaces. Sci. Adv. 2021, 7, eabg5809. [Google Scholar] [CrossRef]
  4. Mukhtar, H.; Wunderlich, R.F.; Muzaffar, A.; Ansari, A.; Shipin, O.V.; Cao, T.N.; Lin, Y.P. Soil microbiome feedback to climate change and options for mitigation. Sci. Total Environ. 2023, 882, 163412. [Google Scholar] [CrossRef]
  5. Körner, C. The use of ‘altitude’ in ecological research. Trends Ecol. Evol. 2007, 22, 569–574. [Google Scholar] [CrossRef]
  6. Zou, Z.; Yuan, K.; Ming, L.; Li, Z.; Yang, Y.; Yang, R.; Chen, B. Changes in alpine soil bacterial communities with altitude and slopes at mount Shergyla, Tibetan Plateau: Diversity, structure, and influencing factors. Front. Microbiol. 2022, 13, 839499. [Google Scholar] [CrossRef]
  7. Liu, D.; Wu, X.; Shi, S.; Liu, H.; Liu, G. A hollow bacterial diversity pattern with elevation in Wolong Nature Reserve, Western Sichuan Plateau. J. Soils Sediments 2016, 16, 2365–2374. [Google Scholar] [CrossRef]
  8. Fierer, N.; McCain, C.M.; Meir, P.; Zimmermann, M.; Rapp, J.M.; Silman, M.R.; Knight, R. Microbes do not follow the elevational diversity patterns of plants and animals. Ecology 2011, 92, 797–804. [Google Scholar] [CrossRef]
  9. Bryant, J.A.; Lamanna, C.; Morlon, H.; Kerkhoff, A.J.; Enquist, B.J.; Green, J.L. Microbes on mountainsides: Contrasting elevational patterns of bacterial and plant diversity. Proc. Natl. Acad. Sci. USA 2008, 105, 11505–11511. [Google Scholar] [CrossRef]
  10. Fu, F.; Li, J.; Li, S.; Chen, W.; Ding, H.; Xiao, S.; Li, Y. Elevational distribution patterns and drivers of soil microbial diversity in the Sygera Mountains, southeastern Tibet, China. Catena 2023, 221, 106738. [Google Scholar] [CrossRef]
  11. Shen, C.; Gunina, A.; Luo, Y.; Wang, J.; He, J.Z.; Kuzyakov, Y.; Hemp, A.; Classen, A.T.; Ge, Y. Contrasting patterns and drivers of soil bacterial and fungal diversity across a mountain gradient. Environ. Microbiol. 2020, 22, 3287–3301. [Google Scholar] [CrossRef] [PubMed]
  12. Hagedorn, F.; Gavazov, K.; Alexander, J.M. Above- and belowground linkages shape responses of mountain vegetation to climate change. Science 2019, 365, 1119–1123. [Google Scholar] [CrossRef] [PubMed]
  13. Ren, B.; Hu, Y.; Chen, B.; Zhang, Y.; Thiele, J.; Shi, R.; Liu, M.; Bu, R. Soil pH and plant diversity shape soil bacterial community structure in the active layer across the latitudinal gradients in continuous permafrost region of Northeastern China. Sci. Rep. 2018, 8, 5619. [Google Scholar] [CrossRef] [PubMed]
  14. Picazo, F.; Vilmi, A.; Aalto, J.; Soininen, J.; Casamayor, E.O.; Liu, Y.; Wang, J. Climate mediates continental scale patterns of stream microbial functional diversity. Microbiome 2020, 8, 92. [Google Scholar] [CrossRef]
  15. Ma, L.; Liu, L.; Lu, Y.; Chen, L.; Zhang, Z.; Zhang, H.; Zhang, J. When microclimates meet soil microbes: Temperature controls soil microbial diversity along an elevational gradient in subtropical forests. Soil Biol. Biochem. 2022, 166, 108566. [Google Scholar] [CrossRef]
  16. De, G.B.; Van, W.H. Linking aboveground and belowground diversity. Trends Ecol. Evol. 2005, 20, 625–633. [Google Scholar]
  17. Tian, Q.; Jiang, Y.; Tang, Y.; Wu, Y.; Tang, Z.; Liu, F. Soil pH and organic carbon properties drive soil bacterial communities in surface and deep layers along an elevational gradient. Front. Microbiol. 2021, 12, 646124. [Google Scholar] [CrossRef]
  18. Praeg, N.; Seeber, J.; Leitinger, G.; Tasser, E.; Newesely, C.; Tappeiner, U. The role of land management and elevation in shaping soil microbial communities: Insights from the Central European Alps. Biochemistry 2020, 150, 107951. [Google Scholar] [CrossRef]
  19. Zhang, B.; Xue, K.; Zhou, S.; Che, R.; Du, J.; Tang, L.; Pang, Z.; Wang, F.; Wang, D.; Cui, X.Y.; et al. Phosphorus mediates soil prokaryote distribution pattern along a small-scale elevation gradient in Noijin Kangsang Peak, Tibetan Plateau. FEMS Microbiol. Ecol. 2019, 95, fiz076. [Google Scholar] [CrossRef]
  20. Zhao, W.; Yin, Y.; Li, S.; Liu, J.; Dong, Y.; Su, S. Soil Microbial Community Varied with Vegetation Types on a Small Regional Scale of the Qilian Mountains. Sustainability 2022, 14, 7910. [Google Scholar] [CrossRef]
  21. Seaton, F.M.; George, P.B.; Alison, J.; Jones, D.L.; Creer, S.; Smart, S.M.; Robinson, D.A. A diversity of diversities: Do complex environmental effects underpin associations between below-and above-ground taxa? J. Ecol. 2024, 112, 1550–1564. [Google Scholar] [CrossRef]
  22. Zhang, L.; Yan, H.; Qiu, L.; Cao, S.; He, Y.; Pang, G. Spatial and temporal analyses of vegetation changes at multiple time scales in the Qilian Mountains. Remote Sens. 2021, 13, 5046. [Google Scholar] [CrossRef]
  23. Li, T.; Kamran, M.; Chang, S.; Peng, Z.; Wang, Z.; Ran, L.; Hou, F. Climate-soil interactions improve the stability of grassland ecosystem by driving alpine plant diversity. Ecol. Indic. 2022, 141, 109002. [Google Scholar] [CrossRef]
  24. Wen, J.; Qin, R.; Zhang, S.; Yang, X.; Xu, M. Effects of long-term warming on the aboveground biomass and species diversity in an alpine meadow on the Qinghai-Tibetan Plateau of China. J. Arid Land 2020, 12, 252–266. [Google Scholar] [CrossRef]
  25. Zhou, H.; Zhang, D.; Jiang, Z.; Sun, P.; Xiao, H.; Yuxin, W.; Chen, J. Changes in the soil microbial communities of alpine steppe at Qinghai-Tibetan Plateau under different degradation levels. Sci. Total Environ. 2019, 651, 2281–2291. [Google Scholar] [CrossRef] [PubMed]
  26. Yang, C.; Zhang, H.; Zhao, X.; Liu, P.; Wang, L.; Wang, W. A functional metagenomics study of soil carbon and nitrogen degradation networks and limiting factors on the Tibetan plateau. Front. Microbiol. 2023, 14, 1170806. [Google Scholar] [CrossRef]
  27. Olsen, S.R.; Sommers, E.L. Phosphorus Availability Indices. Phosphorus soluble in sodium bicarbonate. Methods of soil analysis, Part II. Chemical and microbiological properties. ASA-SSSA Agron. Ser. 1982, 9, 404–430. [Google Scholar]
  28. Liu, C.; Zhao, D.; Ma, W.; Guo, Y.; Wang, A.; Wang, Q.; Lee, D.J. Denitrifying sulfide removal process on high-salinity wastewaters in the presence of Halomonas sp. Appl. Microbiol. Biotechnol. 2016, 100, 1421–1426. [Google Scholar] [CrossRef]
  29. Magoč, T.; Salzberg, S.L. FLASH: Fast length adjustment of short reads to improve genome assemblies. Bioinformatics 2011, 27, 2957–2963. [Google Scholar] [CrossRef]
  30. Chen, S.; Zhou, Y.; Chen, Y.; Gu, J. fastp: An ultra-fast all-in-one FASTQ preprocessor. Bioinformatics 2018, 34, i884–i890. [Google Scholar] [CrossRef]
  31. Edgar, R.C. UPARSE: Highly accurate OTU sequences from microbial amplicon reads. Nat. Methods 2013, 10, 996–998. [Google Scholar] [CrossRef] [PubMed]
  32. Stackebrandt, E.; Goebel, B.M. Taxonomic note: A place for DNA-DNA reassociation and 16S rRNA sequence analysis in the present species definition in bacteriology. Int. J. Syst. Evol. Microbiol. 1994, 44, 846–849. [Google Scholar] [CrossRef]
  33. Wang, Q.; Garrity, G.M.; Tiedje, J.M.; Cole, J.R. Naive Bayesian classifier for rapid assignment of rRNA sequences into the new bacterial taxonomy. Appl. Environ. Microbiol. 2007, 73, 5261–5267. [Google Scholar] [CrossRef] [PubMed]
  34. Álvarez, V.E.; El Mujtar, V.A.; Falcão Salles, J.; Jia, X.; Castán, E.; Cardozo, A.G.; Tittonell, P.A. Micro-Environmental Variation in Soil Microbial Biodiversity in Forest Frontier Ecosystems—Implications for Sustainability Assessments. Sustainability 2024, 16, 1236. [Google Scholar] [CrossRef]
  35. Zhou, Y.; Meng, F.; Ochieng, B.; Xu, J.; Zhang, L.; Kimirei, I.A.; Wang, J. Climate and Environmental Variables Drive Stream Biofilm Bacterial and Fungal Diversity on Tropical Mountainsides. Microb. Ecol. 2024, 87, 28. [Google Scholar] [CrossRef]
  36. Pepin, N.; Bradley, R.S.; Diaz, H.F.; Baraer, M.; Caceres, E.B.; Forsythe, N.; Yang, D.Q. Elevation-dependent warming in mountain regions of the world. Nat. Clim. Change 2015, 5, 424–430. [Google Scholar]
  37. Mayor, J.R.; Sanders, N.J.; Classen, A.T.; Bardgett, R.D.; Clement, J.C.; Fajardo, A.; Wardle, D.A. Elevation alters ecosystem properties across temperate treelines globally. Nature 2017, 542, 91–95. [Google Scholar] [CrossRef]
  38. Greenblum, S. Microbial adaptability in changing environments. Nat. Rev. Microbiol. 2024, 22, 327. [Google Scholar] [CrossRef]
  39. Wang, J.T.; Cao, P.; Hu, H.W.; Li, J.; Han, L.L.; Zhang, L.M.; He, J.Z. Altitudinal distribution patterns of soil bacterial and archaeal communities along Mt. Shegyla on the Tibetan Plateau. Microb. Ecol. 2015, 69, 135–145. [Google Scholar] [CrossRef]
  40. Guo, Y.; Ren, C.; Yi, J.; Doughty, R.; Zhao, F. Contrasting responses of rhizosphere bacteria, fungi and arbuscular mycorrhizal fungi along an elevational gradient in a temperate montane forest of China. Front. Microbiol. 2020, 11, 2042. [Google Scholar] [CrossRef]
  41. Hernandez, D.J.; David, A.S.; Menges, E.S.; Searcy, C.A.; Afkhami, M.E. Environmental stress destabilizes microbial networks. ISME J. 2021, 15, 1722–1734. [Google Scholar] [CrossRef] [PubMed]
  42. Semeraro, S.; Kergunteuil, A.; Sánchez-Moreno, S.; Puissant, J.; Goodall, T.; Griffiths, R.; Rasmann, S. Relative contribution of high and low elevation soil microbes and nematodes to ecosystem functioning. Funct. Ecol. 2022, 36, 974–986. [Google Scholar] [CrossRef]
  43. Li, H.; Yang, S.; Semenov, M.V.; Yao, F.; Ye, J.; Bu, R.; Kuzyakov, Y. Temperature sensitivity of SOM decomposition is linked with a K-selected microbial community. Glob. Change Biol. 2021, 27, 2763–2779. [Google Scholar] [CrossRef] [PubMed]
  44. Chen, K.; Hu, L.; Wang, C.; Yang, W.; Zi, H.; Manuel, L. Herbaceous plants influence bacterial communities, while shrubs influence fungal communities in subalpine coniferous forests. For. Ecol. Manag. 2021, 500, 119656. [Google Scholar] [CrossRef]
  45. Nie, H.; Qin, T.; Yan, D.; Lv, X.; Wang, J.; Huang, Y.; Liu, F. How do tree species characteristics affect the bacterial community structure of subtropical natural mixed forests? Sci. Total Environ. 2021, 764, 144633. [Google Scholar] [CrossRef]
  46. Lladó, S.; López-Mondéjar, R.; Baldrian, P. Drivers of microbial community structure in forest soils. Appl. Microbiol. Biotechnol. 2018, 102, 4331–4338. [Google Scholar] [CrossRef]
  47. Cai, Z.; Wang, X.; Bhadra, S.; Gao, Q. Distinct factors drive the assembly of quinoa-associated microbiomes along elevation. Plant Soil 2020, 448, 55–69. [Google Scholar] [CrossRef]
  48. Huang, R.; Zhao, D.; Zeng, J.; Shen, F.; Cao, X.; Jiang, C.; Wu, Q.L. pH affects bacterial community composition in soils across the Huashan watershed, China. Can. J. Microbiol. 2016, 62, 726–734. [Google Scholar] [CrossRef]
  49. Yang, J.; Yu, J.; Wang, J.; Li, X. Soil microbial community responds to elevation gradient in an arid montane ecosystem in Northwest China. Forests 2022, 13, 1360. [Google Scholar] [CrossRef]
  50. Van Der Heijden, M.G.; Bardgett, R.D.; Van Straalen, N.M. The unseen majority: Soil microbes as drivers of plant diversity and productivity in terrestrial ecosystems. Ecol. Lett. 2008, 11, 296–310. [Google Scholar] [CrossRef]
  51. Pinto-Junior, H.V.; Villa, P.M.; Menezes, L.F.T.; Pereira, M.C.A. Effect of climate and altitude on plant community composition and richness in Brazilian inselbergs. Journal of Mountain Science 2020, 17, 1931–1941. [Google Scholar] [CrossRef]
  52. Lamb, E.G.; Kennedy, N.; Siciliano, S.D. Effects of plant species richness and evenness on soil microbial community diversity and function. Plant Soil 2011, 338, 483–495. [Google Scholar] [CrossRef]
  53. Upadhyay, S.K.; Srivastava, A.K.; Rajput, V.D.; Chauhan, P.K.; Bhojiya, A.A.; Jain, D.; Minkina, T. Root exudates: Mechanistic insight of plant growth promoting rhizobacteria for sustainable crop production. Front. Microbiol. 2022, 13, 916488. [Google Scholar] [CrossRef] [PubMed]
  54. Afridi, M.S.; Kumar, A.; Javed, M.A.; Dubey, A.; de Medeiros, F.H.V.; Santoyo, G. Harnessing root exudates for plant microbiome engineering and stress resistance in plants. Microbiol. Res. 2024, 279, 127564. [Google Scholar] [CrossRef]
  55. Hodge, A.; Berta, G.; Doussan, C.; Merchan, F.; Crespi, M. Plant root growth, architecture and function. Plant Soil 2009, 321, 153–187. [Google Scholar] [CrossRef]
  56. Peixoto, L.; Olesen, J.E.; Elsgaard, L.; Enggrob, K.L.; Banfield, C.C.; Dippold, M.A.; Rasmussen, J. Deep-rooted perennial crops differ in capacity to stabilize C inputs in deep soil layers. Sci. Rep. 2022, 12, 5952. [Google Scholar] [CrossRef]
  57. Liao, W.; Tong, D.; Li, Z.; Nie, X.; Liu, Y.; Ran, F.; Liao, S. Characteristics of microbial community composition and its relationship with carbon, nitrogen and sulfur in sediments. Sci. Total Environ. 2021, 795, 148848. [Google Scholar] [CrossRef]
  58. Zhang, L.; Liao, L.; Dijkstra, F.A.; Wang, X.; Delgado-Baquerizo, M.; Liu, G.; Wang, G.; Song, Z.; Gu, J.; Zhang, C. Aridity thresholds of microbiome-soil function relationship along a climatic aridity gradient in alpine ecosystem. Soil Biol. Biochem. 2024, 192, 109388. [Google Scholar] [CrossRef]
  59. Dong, L.; Berg, B.; Gu, W.; Wang, Z.; Sun, T. Effects of different forms of nitrogen addition on microbial extracellular enzyme activity in temperate grassland soil. Ecol. Process. 2022, 11, 36. [Google Scholar] [CrossRef]
  60. Cruz-Paredes, C.; Tájmel, D.; Rousk, J. Can moisture affect temperature dependences of microbial growth and respiration? Soil Biol. Biochem. 2021, 156, 108223. [Google Scholar] [CrossRef]
Figure 1. Distribution of sampling sites across different vegetation types in Qilian Mountains. Coniferous forests (F, 2700 m); meadow grasslands (G, 3200 m); alpine shrubs (S, 3500 m); alpine meadows (M, 3700 m); and sparse vegetation of limestone flats (R, 4000 m). Same for following text.
Sustainability 17 01797 g001
Figure 2. The relative abundance of soil bacteria (a) and fungi (b) along the elevation gradient.
Sustainability 17 01797 g002
Figure 3. Alpha diversity index of soil bacteria along the elevation gradient. Richness (a); Shannon (b); Simpson (c); Chao1 (d); Ace (e); Good’s coverage (f); Bars represent the means ± SE (n = 4). Different letters indicate significant differences (p < 0.05) among different vegetation types based on one-way ANOVA followed by LSD test.
Sustainability 17 01797 g003
Figure 4. Alpha diversity index of soil fungi along the elevation gradient. Richness (a); Shannon (b); Simpson (c); Chao1 (d); Ace (e); Good’s coverage (f); Bars represent the means ± SE (n = 4). Different letters indicate significant differences (p < 0.05) among different vegetation types based on one-way ANOVA followed by LSD test.
Sustainability 17 01797 g004
Figure 5. Beta diversity of soil bacteria and fungi along elevation gradient. Soil bacterial NMDS (a); soil fungal NMDS (b); soil bacterial Bray–Curtis dissimilarity (c); soil fungal Bray−Curtis dissimilarity (d). Bars represent the means ± SE (n = 4).
Sustainability 17 01797 g005
Figure 6. Redundancy analysis of soil microorganisms and ecological factors. Soil bacterial redundancy analysis (a) and ecological factors contribution (b); soil fungal redundancy analysis (c) and ecological factors contribution (d).
Sustainability 17 01797 g006
Figure 7. Pearson correlation analysis describing the relationship between the dominant phylum of soil bacteria (a), soil fungi (b) and ecological factors. Asterisks indicate statistical significance (* p < 0.05).
Sustainability 17 01797 g007
Figure 8. SEM was used to the relationship between soil microorganisms and environmental factors. Direction of arrow stands for causality, and number represents normalized path coefficient; line thickness is directly proportional to its significance (either positive or negative). Orange solid line indicates a positive effect and green line means a negative effect. Asterisks indicate statistical significance (* p < 0.05; *** p < 0.001).
Sustainability 17 01797 g008
Table 1. Basic information of sampling points.
Vegetation Types (No.)Geographic PositionElevation (m)Dominant SpeciesVegetation Coverage (%)Soil Types
Coniferous forests (F)37°17′25″ N
101°57′29″ E
2700Picea crassifolia + Poa annua L. + Anemone rivularis80Mountain gray–brown soil
Meadow grasslands (G)37°37′42″ N
101°24′11″ E
3200Bistorta vivipara L. + Potentilla anserina + Kobresia pygmaea95Subalpine meadow soil
Alpine shrubs (S)37°39′17″ N
101°25′38″ E
3500Potentilla fruticosa L. + Caragana jubata + Kobresia humilis95Alpine shrub–meadow soil
Alpine meadows (M)37°40′19″ N
101°26′13″ E
3700Kobresia pygmaea + Poa annua L.70Alpine meadow soil
Sparse vegetation of limestone flats (R)37°41′30″ N
101°27′06″ E
4000Poa bulbosa L. var. vivipara Koeler + Kobresia pygmaea
+ Thylacospermum caespitosum
40Frigid desert soil
Table 2. Characteristics of soil properties along elevation gradient.
Soil PropertiesConiferous Forests (F)Meadow Grasslands (G)Alpine
Shrubs (S)
Alpine Meadows (M)Sparse Vegetation of Limestone Flats (R)
Soil moisture (%)112.39 ± 22.38 a64.41 ± 7.71 bc96.39 ± 3.32 ab45.09 ± 1.99 cd10.7 ± 5.69 d
Bulk density (g·cm−3)0.64 ± 0.04 d0.92 ± 0.07 bc0.78 ± 0.02 cd1.1 ± 0.08 b2.25 ± 0.65 a
pH7.42 ± 0.03 a7.35 ± 0.43 a7.39 ± 0.31 a7.32 ± 0.33 a7.69 ± 0.06 a
NH4+-N (mg·kg−1)16.87 ± 4.05 a16.41 ± 2.88 a14.12 ± 2.5 a18.13 ± 3.91 a14.73 ± 2.79 a
NO3-N (mg·kg−1)14.91 ± 1.86 a13.95 ± 4.1 a9.26 ± 2.19 ab4.89 ± 1.42 b2.78 ± 0.84 b
Available P (mg·kg−1)8.74 ± 1.45 b6.69 ± 0.42 b8.32 ± 0.31 b9.18 ± 0.81 b13.57 ± 0.6 a
TC/(g·kg−1)96.27 ± 4.41 a82.58 ± 14.6 ab99.19 ± 5.08 a59.43 ± 5.85 b15.33 ± 2.45 c
TN/(g·kg−1)8.51 ± 0.17 a7.78 ± 1.21 ab8.9 ± 0.34 a6.05 ± 0.47 b1.63 ± 0.27 c
TP/(g·kg−1)0.55 ± 0.07 a0.62 ± 0.03 a0.62 ± 0.03 a0.62 ± 0.01 a0.55 ± 0.07 a
C:N11.3 ± 0.28 a10.53 ± 0.28 ab11.13 ± 0.16 a9.79 ± 0.2 b9.52 ± 0.69 b
C:P215.28 ± 21.43 a132.74 ± 20.08 b138.34 ± 19.96 b15.92 ± 3.50 b29.89 ± 8.46 c
N:P18.61 ± 43.79 a12.52 ± 1.64 ab12.41 ± 1.71 ab15.92 ± 3.50 a3.18 ± 0.9 b
Values are means ± standard error (n = 4). Different letters indicate significant differences (p < 0.05) among different vegetation types based on one-way ANOVA followed by LSD test.
Table 3. Characteristics of plant diversity along elevation gradient.
Vegetation Type (No.)SplantHplantJplant
Coniferous forests (F)19.002.560.87
Meadow grasslands (G)23.002.820.90
Alpine shrubs (S)34.002.930.83
Alpine meadows (M)16.002.540.92
Sparse vegetation of limestone flats (R)18.002.220.77
Splant: Species richness of plant community. Hplant: Shannon diversity index of plant community. Jplant: Pielou evenness index of plant community.
Disclaimer/Publisher’s Note: The statements, opinions and data contained in all publications are solely those of the individual author(s) and contributor(s) and not of MDPI and/or the editor(s). MDPI and/or the editor(s) disclaim responsibility for any injury to people or property resulting from any ideas, methods, instructions or products referred to in the content.

