Abstract
As urbanization accelerates in developing countries and populations continue to grow, the demand for sustainable urban regeneration becomes increasingly urgent. This study explores how urban regeneration can be integrated with tourism development to promote sustainable and inclusive growth. Using the theory of organic regeneration, this study emphasizes the role of localized, small-scale interventions that enhance the urban environment while boosting tourism appeal. Through field research at the Tianjin Cruise Terminal, this study applies the KANO model to classify user needs and prioritize design interventions based on the needs of various user groups, including tourists, exercisers, anglers, and local residents. By analyzing user group activity frequencies, the study identifies Must-be, One-dimensional, and Attractive needs, and utilizes weight analysis to assess the impacts of different facilities on user satisfaction. This approach ensures that the design guidelines effectively address both essential and value-enhancing features. The findings provide more suitable design guidelines for improving tourism infrastructure, promoting sustainable development, and enhancing the overall urban experience.
1. Introduction
1.1. Background
In recent years, China’s urban development model has shifted from “incremental expansion” to “stock optimization”. Within this new framework, urban renewal strategies have undergone a significant transformation, moving from large-scale demolition and construction to more refined, “embroidered” renewal approaches [1]. The micro-renewal method focuses on repair rather than demolition, reducing reconstruction costs and reconfiguring unused or abandoned areas. This approach aims to create environments that are both familiar and refreshed for urban residents [2]. Compared to traditional large-scale demolition, micro-renewal emphasizes the protection of cultural heritage and collective memory in historic districts, seeking to revitalize and enhance urban areas by updating spaces that have lost their functionality [3,4].
Since the 1970s, the revitalization of waterfront areas has become a key focus of urban policies in Europe and the United States [5]. By the 1980s, urban design and placemaking played a crucial role in the renewal of waterfront areas [5]. Today, waterfront design projects have gained global prominence, contributing to regional value enhancement and tourism attraction [6]. However, the infrastructure of waterfront areas still struggles to fully meet the needs of both residents and visitors, and numerous challenges remain in their development [7].
In recent years, the urbanization of tourist destinations has accelerated, with the design and optimization of urban public facilities directly impacting tourist satisfaction and destination competitiveness [8]. For instance, optimizing facilities to meet tourist needs enhances destination appeal and promotes sustainable local economic development [9]. Although China has a rich history of urban public infrastructure construction, recent rapid development has revealed shortcomings in infrastructure and a lack of human-centered design [10]. The pressures of rapid urbanization and market interests have gradually reduced the available space in waterfront areas, significantly diminishing their openness. Additionally, waterfront development faces challenges such as declining ecological quality, limited accessibility, and restricted functional services [11]. Studies indicate that successful waterfront redevelopment can enhance the interaction between residents and visitors, offering spaces that promote education, healthy lifestyles, and enjoyment [12], while also meeting diverse demands for leisure and tourism [13].
However, existing research predominantly focuses on small-scale renovation strategies for historical districts, while studies related to waterfront areas often emphasize tourism planning and landscape design. A research gap remains in relation to how small-scale renovation design guidelines can enhance the multifunctionality and service efficiency of waterfront areas. This gap impedes the overall improvement of tourism infrastructure in these areas, particularly in addressing the growing tourism demand and enhancing the visitor experience. Given the significant role of tourism in the economic and social development of cities, integrating tourism development into urban planning—especially through small-scale renovation design guidelines to enhance the service level of tourism infrastructure—has become a key issue that urgently needs to be addressed in current urban development. The Tianjin cruise terminal is located along the Haihe River, serving as both a significant tourist destination for domestic and international visitors and an important venue for the daily activities of local residents. It thus performs a dual function in leisure and urban life. This characteristic makes it a typical case for exploring the coordinated development of tourism and urban planning, providing valuable research opportunities for optimizing multifunctional spaces. Furthermore, the rapid recovery of the tourism market in the post-pandemic era has led to increased demand for facilities and upgrades at the Tianjin cruise terminal, a high-footfall site. This study, by analyzing the current layout and services of the terminal, offers scientific recommendations for improving the visitor experience and enhancing service quality. It also provides insights for optimizing urban public spaces in the post-pandemic era. The characteristics of the Tianjin cruise terminal are highly representative within China, with similar waterfront tourist sites and public activity spaces found in numerous cities, such as the Bund in Shanghai and the banks of the Pearl River in Guangzhou.
Therefore, this study focuses on the small-scale renovation design of the Tianjin Haihe River cruise terminal, exploring suitable design guidelines for optimizing public service facilities, introducing green spaces, and enhancing waterfront interaction experiences. This research offers a new perspective on small-scale renovation design for waterfront areas and provides practical insights for integrating urban planning with tourism development. It aims to enhance the attractiveness of waterfront areas and the vitality of the city.
1.2. Literature Review
The UN 2030 Agenda highlights the urgency of sustainable urban development and emphasizes the crucial role of urban micro-renewal in modernizing public services and humanizing urban renewal [14]. Nevertheless, urban micro-renewal practices encounter several challenges, especially concerning resource allocation, resident involvement, and long-term sustainability.
Research on the micro-updating of public facilities mainly focuses on positive effects, with limited discussion of limitations and complexities, especially regarding waterfront areas. For example, Wang et al. [15] utilized multi-source big data to investigate the relationship between the vitality of waterfront public spaces and urban hinterland development. While the study makes a significant contribution by emphasizing the direct impact of spatial modifications on urban dynamics, it might have benefited from a more extensive consideration of the long-term social implications, such as how these changes influence ongoing social interactions and the preservation of local cultural heritage. Pazzini et al. [16] used the SWOT analysis framework to assess the renovation plans for the Rimini Canal Port in Italy, focusing primarily on economic and environmental outcomes. While this macro-level analysis is valuable for understanding broad renovation impacts, a deeper exploration of the social dimensions, particularly the lived experiences and needs of local residents and tourists, would provide a more comprehensive understanding of the renovation’s full implications. Ouyang and Wu’s [17] study on the Changning section of the Suzhou River in Shanghai employed a mixed-method approach to evaluate the facility capacity of waterfront public spaces. This approach offers a detailed assessment of spatial functionality; however, it overlooks critical aspects, such as the tensions between different user groups—tourists and residents—and the long-term consequences of introducing functional diversification in these spaces, particularly in terms of social cohesion and community development. Similarly, Enseñat-Soberanis et al. [18] stressed the importance of integrating the perspectives of both tourists and local communities into sustainable cultural tourism planning. While their focus on stakeholder inclusion is crucial, the study could be further strengthened by offering practical frameworks for balancing these diverse interests in real-world planning scenarios, thus ensuring a more sustainable and equitable approach to tourism development. Seebunruang et al. [19] established a relationship between park proximity and tourist satisfaction, contributing valuable insights into the park–tourism nexus. However, the study could be expanded by investigating the specific attributes of different park types and how they address the varied needs of distinct visitor groups, along with a more thorough analysis of the economic benefits that these diverse park experiences generate within the tourism sector.
Overall, the existing literature demonstrates the potential of micro-renewal in improving urban spaces and promoting tourism development, highlighting the importance of macro-level planning and environmental benefits for waterfront areas and tourism destinations. However, there is a lack of in-depth discussion on the micro-level aspects, such as facility layout and interactive experiences, which are essential to meet the needs of both residents and visitors. In the micro-renewal of waterfront areas, resource integration and multifunctional space design have received insufficient attention in existing research. These elements are crucial for enhancing the attractiveness of waterfront areas and balancing the needs of both tourism and residents.
1.3. Research Objective
Current theories and case studies provide valuable insights into the renewal and renovation of urban areas. However, the existing research methods and case studies often face limitations in scope and technique when applied to other urban regions, such as public facilities and tourist attractions. These limitations highlight a research gap in exploring the renewal and optimization of these areas, particularly in the lack of discussions on micro-level aspects such as facility layout, interactive experiences, resource integration, and multifunctional space design.
In light of this gap, the aim of this study is to develop design guidelines for the renewal of urban public facilities and tourist attractions, with the goal of enhancing the quality and humanization of public infrastructure. Specifically, the study focuses on optimizing site design to improve visitor comfort and enrich their experiences. Taking the renovation of the Tianjin Cruise Terminal as a case study, the research examines the terminal’s historical background, identifies existing issues, analyzes the unique characteristics of waterfront spaces, and considers crowd dynamics and usage frequency. Based on this analysis, the study applies the KANO model to classify user needs, prioritizes design guidelines according to these needs, and evaluates the impact of different facilities on user satisfaction using weighted analysis. Through the implementation of these design guidelines, the study aims to improve the configuration of public infrastructure, enhance the visitor experience, and provide references for the renovation of similar sites, particularly in enhancing green spaces, optimizing facility layouts, and promoting interaction.
2. Methodology
2.1. Illustrative Project Overview
Tianjin is a major city in northern China, and serves as a strategic hub for the Belt and Road Initiative and the Maritime Silk Road. As of 2022, Tianjin spans 11,966.45 square kilometers and has a population of approximately 13.73 million [20].
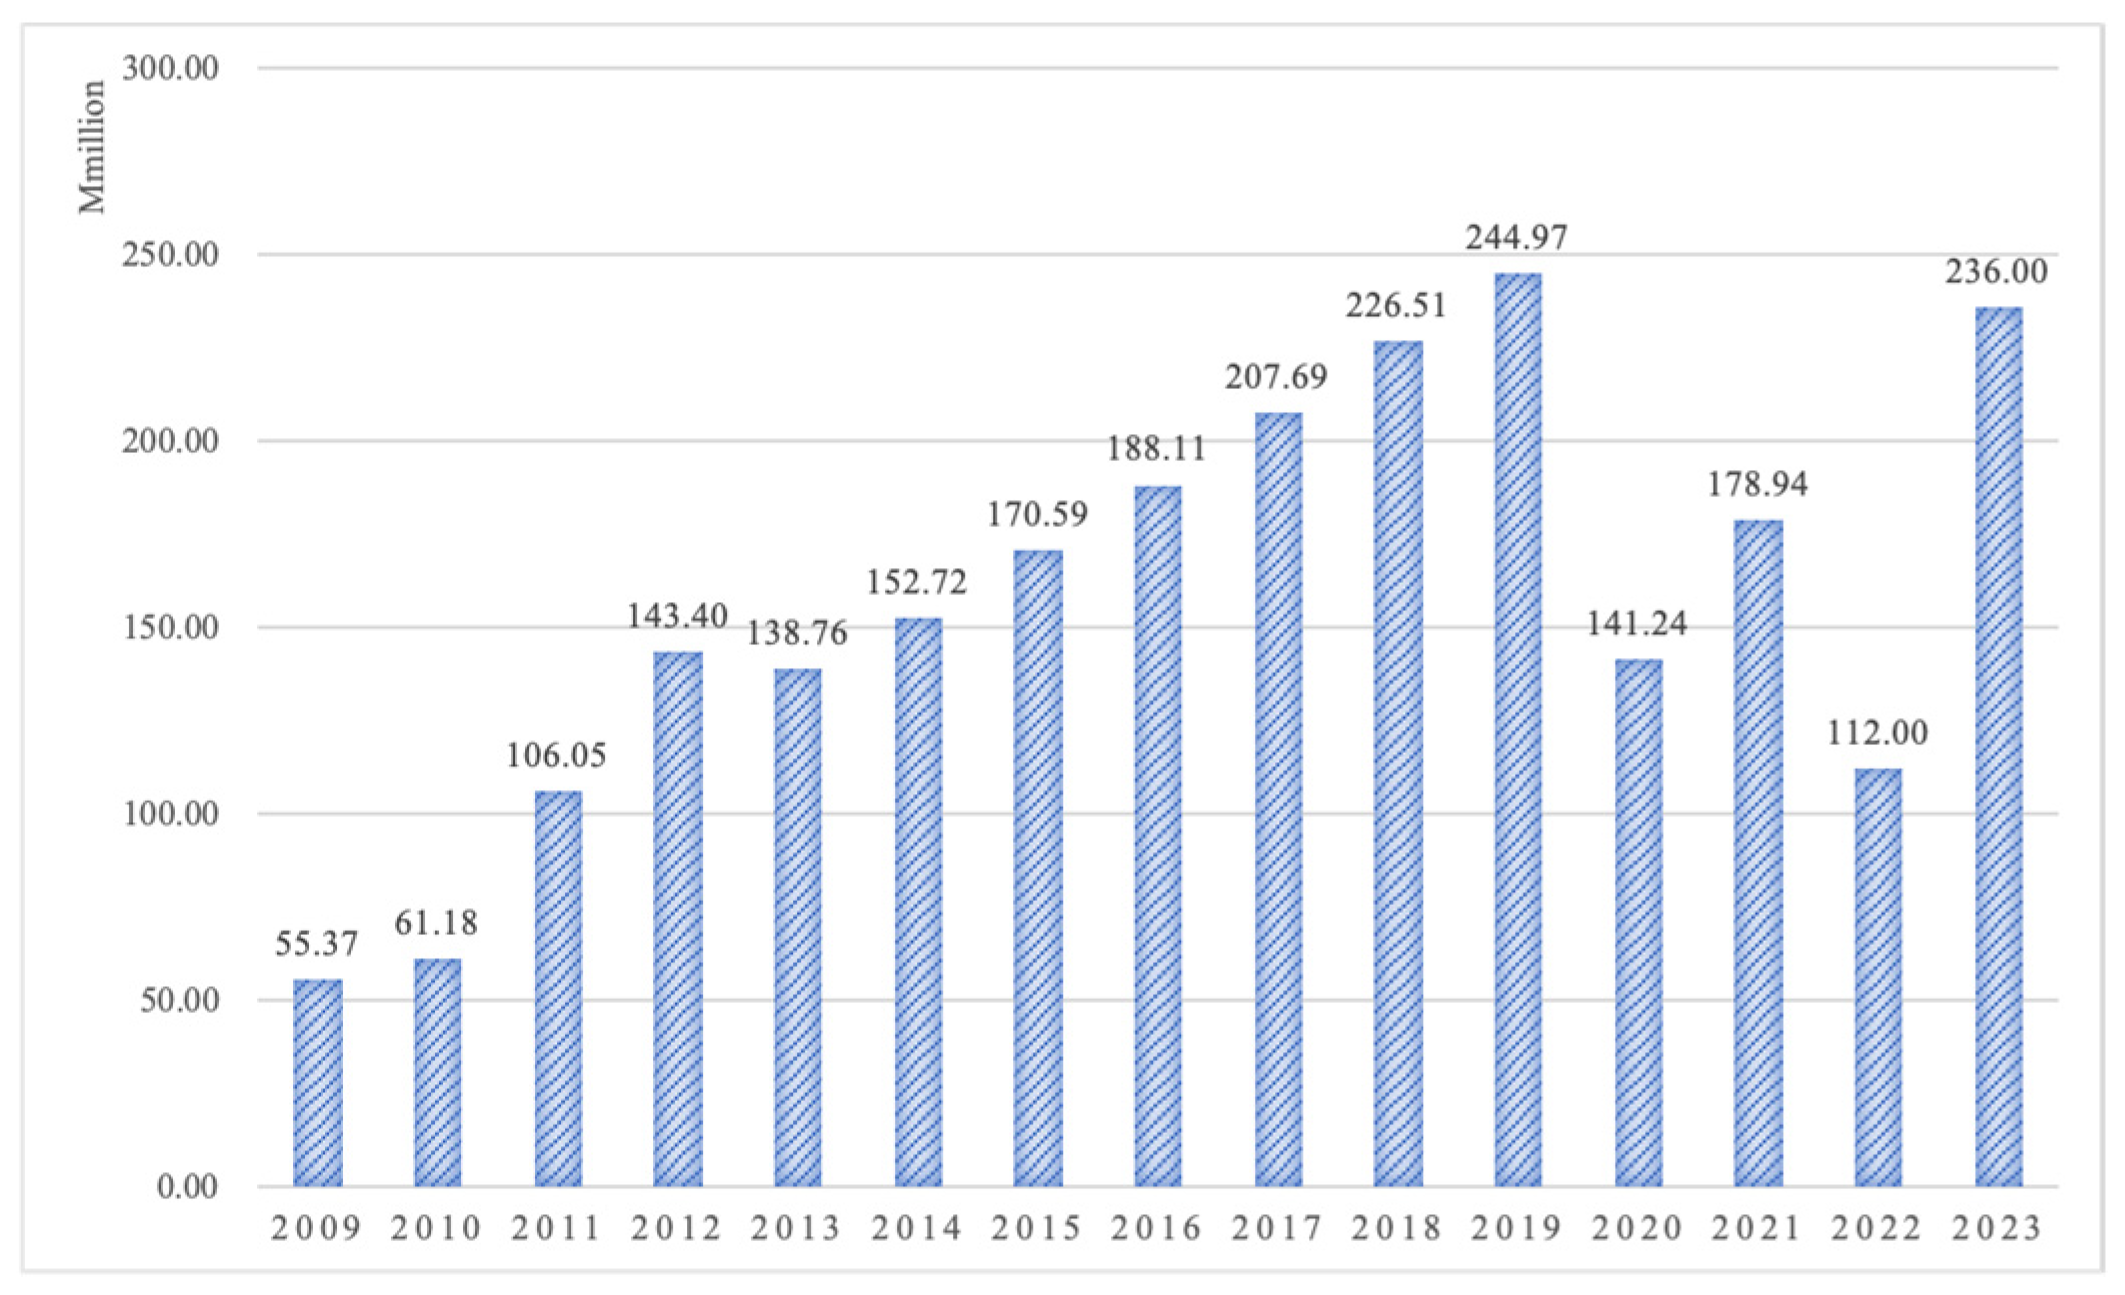
The Haihe River has been central to Tianjin’s economic and industrial growth, with urban development traditionally centered around the Haihe River (Figure 1). Presently, within a 2 km radius of the Beijing–Tianjin–Hebei trunk line, there are 2693 tourist attractions, including 535 urban gardens and 272 public squares. Kernel density analysis shows the high clustering of these sites, particularly along the Haihe River, where the integration of sightseeing, commercial, residential, and recreational spaces underscores its role in Tianjin’s leisure and tourism sector [21,22]. However, despite this concentration of attractions, there remains significant potential for improvements in visitor flow management, the enhancement of public spaces, and the upgrading of supporting facilities. Furthermore, the COVID-19 pandemic has had a profound impact on Tianjin’s tourism industry. In 2020, due to the pandemic, the number of tourists in Tianjin sharply declined, falling by 42.3% year-on-year (Figure 2). However, with the end of the pandemic in 2022, the domestic tourism market is expected to lead the recovery of China’s tourism industry. Post-pandemic, tourist demand has become more specific, necessitating the reassessment and careful selection of destinations across different regions. This trend is expected to drive the gradual recovery of China’s tourism industry, which will reach new peaks due to the surge in tourist demand. The latest data from 2023 show that in the first quarter of 2023, Tianjin’s number of tourists reached 43,646,900, with 16,124,200 tourists during the Mid-Autumn Festival and National Day holidays, and tourism revenue reached CNY 12.185 billion. Compared to 2019, this represents a 35.2% and 67.0% increase in tourist numbers and revenue, respectively, with out-of-town tourists accounting for 45.2% of the total [23]. Tianjin’s tourism industry is recovering, with both tourist numbers and revenue surpassing pre-pandemic levels. The Haihe River Cruise Terminal at Tianjin Station is a key tourist attraction and plays a crucial role in the recovery of Tianjin’s tourism industry. Improvements are needed to meet the growing demand and enhance service quality.
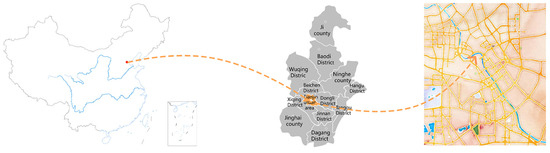
Figure 1.
Location map of Haihe River Terminal in Tianjin, China.

Figure 2.
Tianjin visitor number variation trends.
Today, the Haihe River has evolved from a transportation corridor into a scenic and cultural landmark. Prominent riverside sites, such as the Tianjin Station Wharf, anchor the city’s tourism industry, attracting both domestic and international visitors. While this area has grown in popularity, the current spatial layout and amenities are not yet fully optimized to meet the needs of a high volume of visitors. This research aims to identify more suitable design guidelines to enhance public infrastructure, increase accessible green spaces, and improve visitor comfort, thereby revitalizing the area to meet both present and future demands for quality urban tourism spaces.
2.2. Study Framework
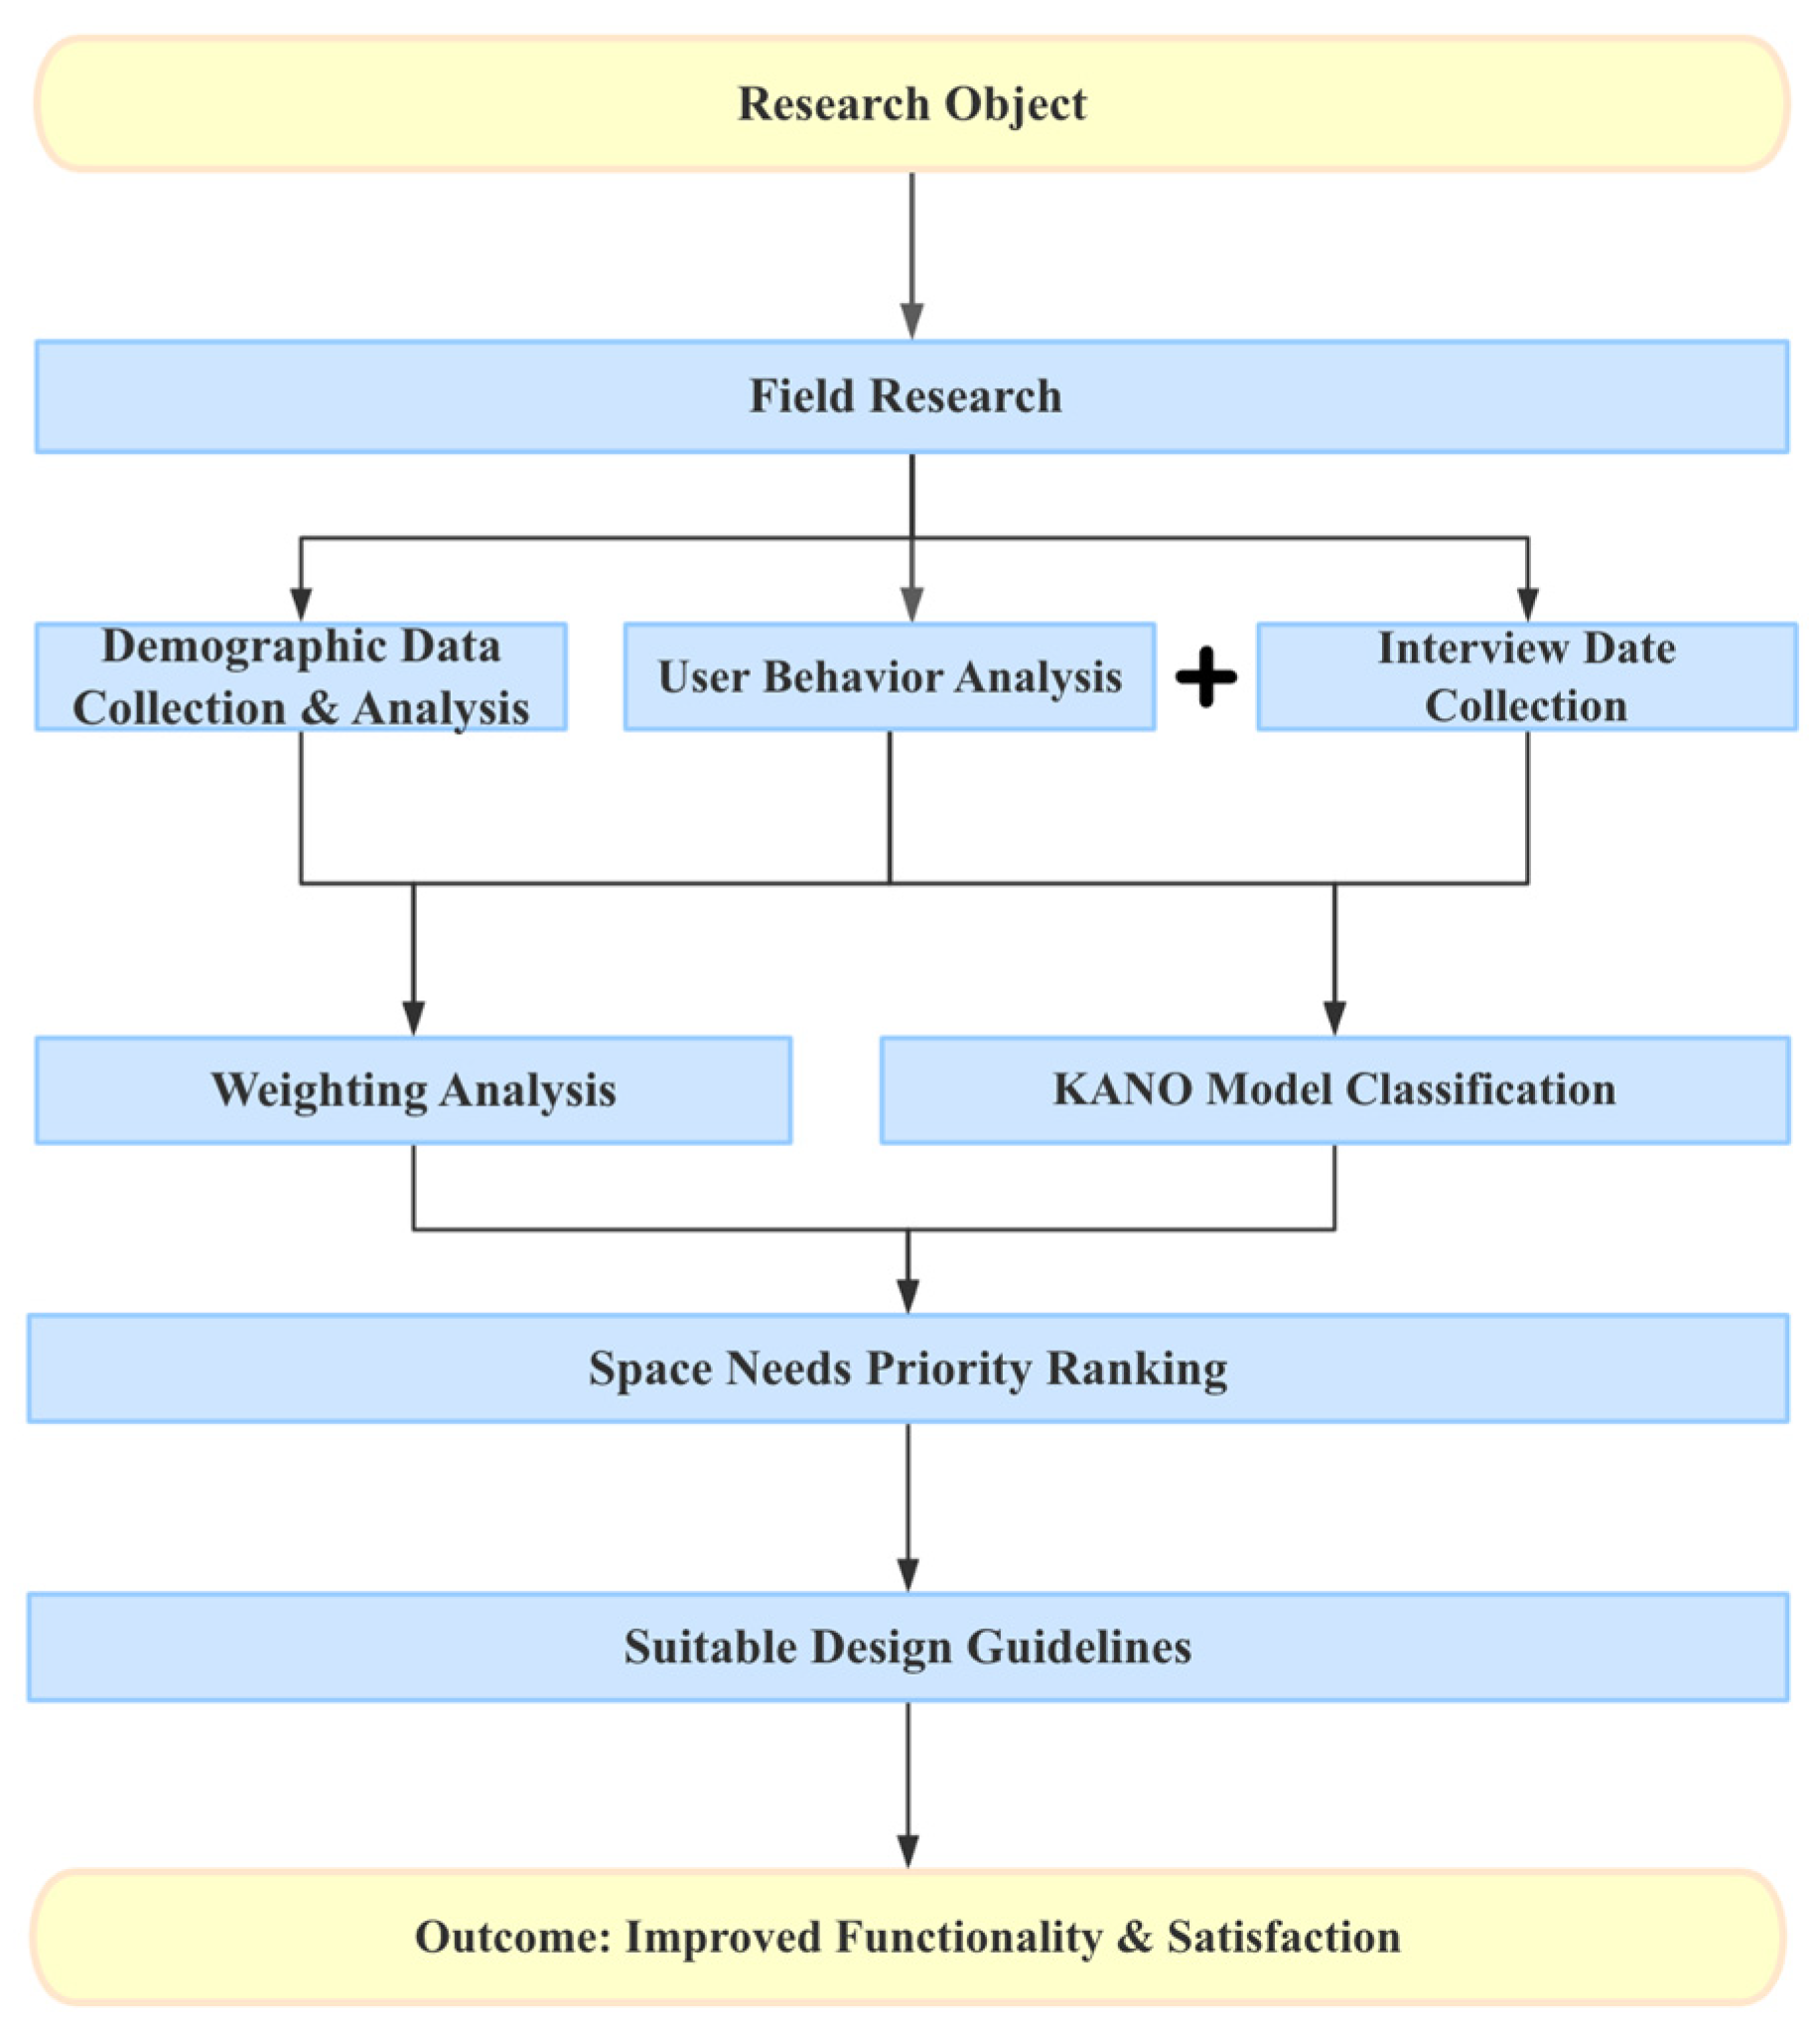
This study develops a comprehensive framework for evaluating and prioritizing the spatial needs of different user groups at the Haihe Cruise Terminal, based on field research and user behavior analysis. The framework is designed to assess the spatial configuration and facility requirements of the site through a multidimensional approach, focusing on three key dimensions, as follows: spatial accessibility, public infrastructure, and outdoor comfort. These dimensions are further subdivided into 12 specific indicators that address the core aspects of user experience.
To systematically classify and prioritize these spatial demand indicators, the KANO model is employed. This model helps identify and categorize user needs into three primary categories: Must-be, One-dimensional, and Attractive attributes. The priority of each indicator is determined based on an analysis of user group distribution and behavior patterns throughout the day. Specifically, the study records the activity times, frequencies, and behavioral characteristics of five user groups—exercisers, boat passengers, tourists, resters, and fishers—across different time intervals.
The collected data are then used to identify peak demand periods and spatial usage preferences, providing a clear picture of which areas and facilities are most needed by each user group at specific times of the day. This analysis informs the prioritization of spatial demand indicators, enabling the development of targeted design guidelines that cater to the needs of the users.
The evaluation results derived from the KANO model analysis serve as the foundation for developing design guidelines aimed at enhancing the service quality of public facilities at the terminal. These guidelines ensure that the design interventions not only address the unique needs of different user groups, but also enhance the overall functionality and user satisfaction of the site. The research framework is illustrated in Figure 3, providing a visual representation of the analysis process and the relationship between the various evaluation criteria.
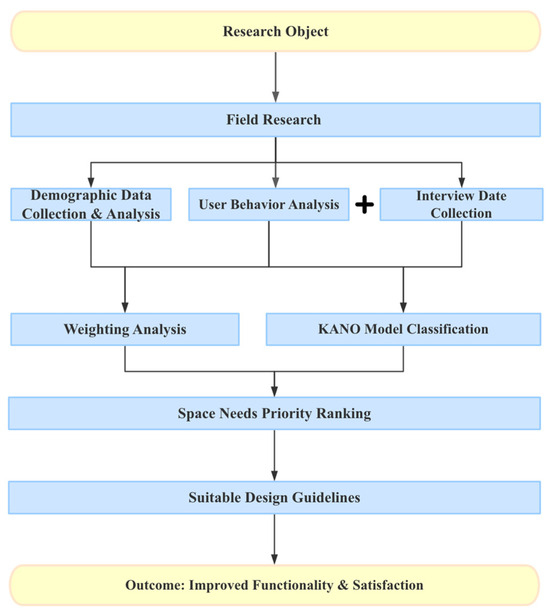
Figure 3.
Study framework.
2.3. Field Research on Current Situation
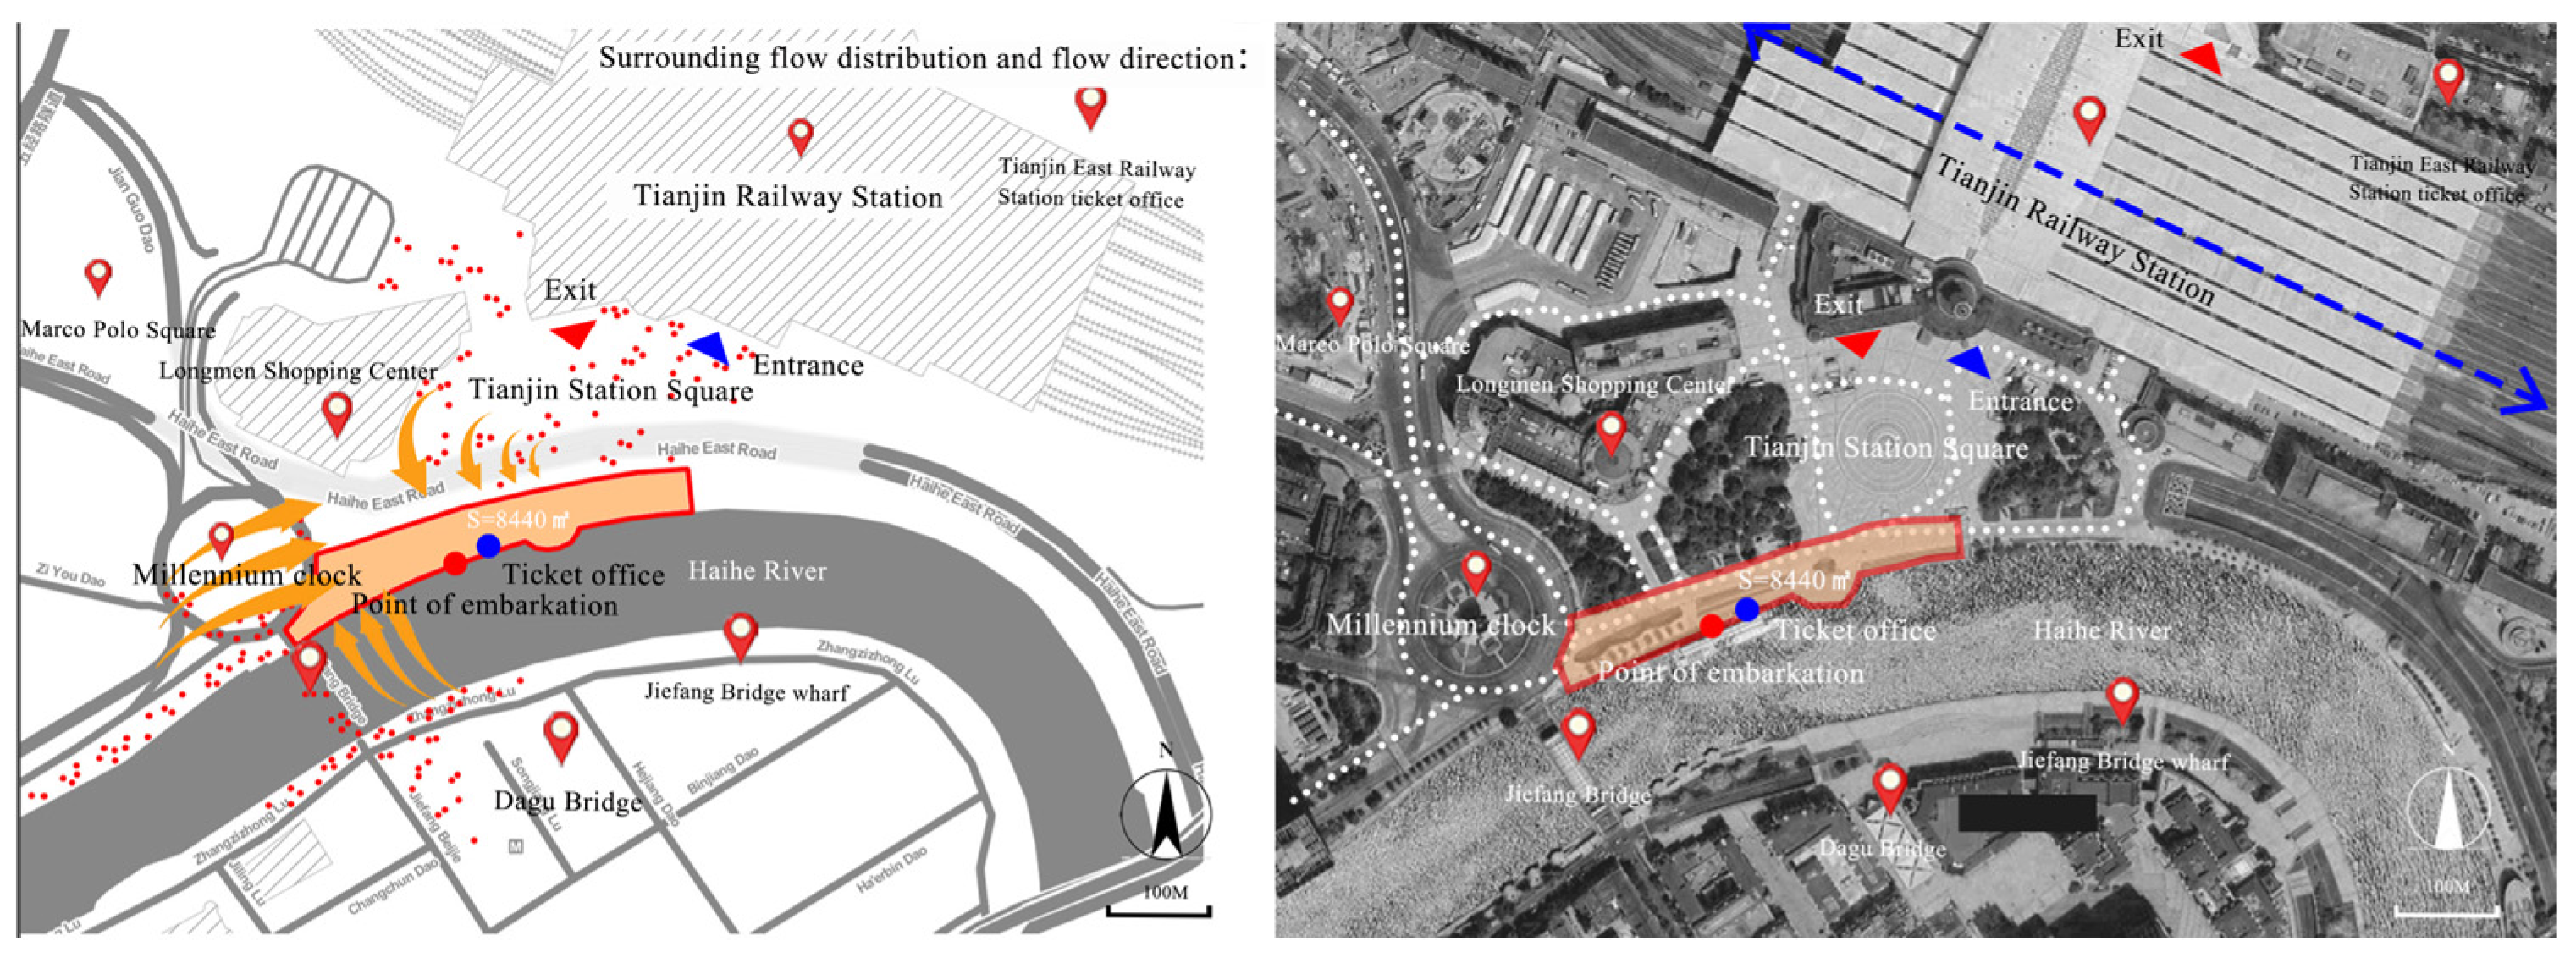
The research site is in the affluent area of the Haihe River scenic belt (Figure 4), adjacent to key landmarks such as Tianjin Station, the Century Clock, and the Liberation Bridge. This location boasts a prime geographic position with a well-developed road network and convenient transportation. The main access points are near the Liberation Bridge and the Century Clock, both of which are highly favored by locals and tourists alike.
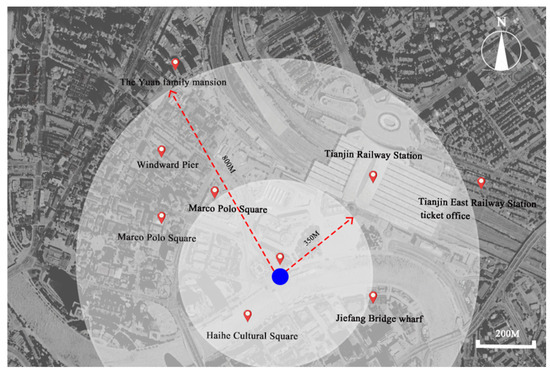
Figure 4.
Studied tourism site location plan from the case city.
This study employs a mixed-method approach, combining qualitative observation with quantitative data analysis to assess the current state of the site. The focus of the observation includes pedestrian traffic, the availability of public spaces, and the overall accessibility of the area. Specifically, the study targets passengers at the train station and individuals gathered around the plaza near Tianjin Railway Station. Notably, the iconic “Century Clock”, located at the center of the roundabout, attracts a large number of tourists for photos, but it also leads to congestion in the areas surrounding the roundabout. Since the site is free of motor vehicle traffic, attention can be concentrated on pedestrian flow without interference from vehicular movement. People primarily enter the site from two directions, as follows: 1. Citizens and tourists gathering near Jiefang Bridge and the Century Clock. 2. Passengers emerging from the train station and individuals in the plaza in front of the station (Figure 5). The site covers an area of 8440 m2, with a greening rate of approximately 8.3%, mainly concentrated around the Century Clock and along the riverbank. The building density of the site is approximately 0.24%, with high pedestrian traffic.

Figure 5.
Studied tourism site location plan in case city.
The Tianjin Railway Station Haihe Cruise Terminal is an important tourist attraction in Tianjin, playing a key role in the recovery of the city’s tourism industry. As of October, the terminal has welcomed over 1.4 million visitors in 2024 [24]. However, the number of public facilities at the existing site (Table 1) is limited, making it difficult to meet the actual demands brought about by high visitor traffic. Compared to the general service standards for national tourist sites [25,26], the facility configuration at the Tianjin Railway Station Haihe Cruise Terminal is clearly inadequate, and cannot meet the growing demands of the present and future. This situation highlights the potential for improvement in facility optimization and service enhancement, providing clear directions for future micro-updating strategies. Therefore, there is an urgent need for a systematic optimization of the existing facilities, based on actual visitor demands and service standards, so as to further improve the overall service level and visitor satisfaction.

Table 1.
Current public services’ and spaces’ details.
2.4. Data Acquisition Methods
2.4.1. Qualitative Spatial Data Collection
To explore user behavior patterns and spatial activity distribution, a qualitative observation method was employed, with a systematic approach aimed at obtaining a comprehensive understanding of how different user groups interact with the site. This methodological approach is based on principles from behavioral geography and spatial analysis, and has proven effective in urban planning studies [27], which allow for capturing nuanced and real-time data on how people utilize urban spaces.
This study employed qualitative observation methods to record the behavior patterns and activity distribution of different user groups at the site. Smartphones equipped with a time-recording application (model: iPhone 13, manufacturer: Apple Inc., location: Cupertino, California, USA) were used to ensure accurate and systematic data collection. The Timestamp Recorder (TimeStamps—Time Recording with Ease1.5.2) was used to log the start and end times of user activities, automatically generating time stamps. The application allows for the export of data in a spreadsheet format for further analysis. The focus of the observation was to record the crowd dwell time and activity frequency in each activity area within the study region.
The recording methods and procedures focused on specific observation periods, with peak hours of 6:00–9:00, 12:00–15:00 and 18:00–21:00 and off-peak hours of 9:00–12:00, 12:00–15:00, and 21:00–24:00.
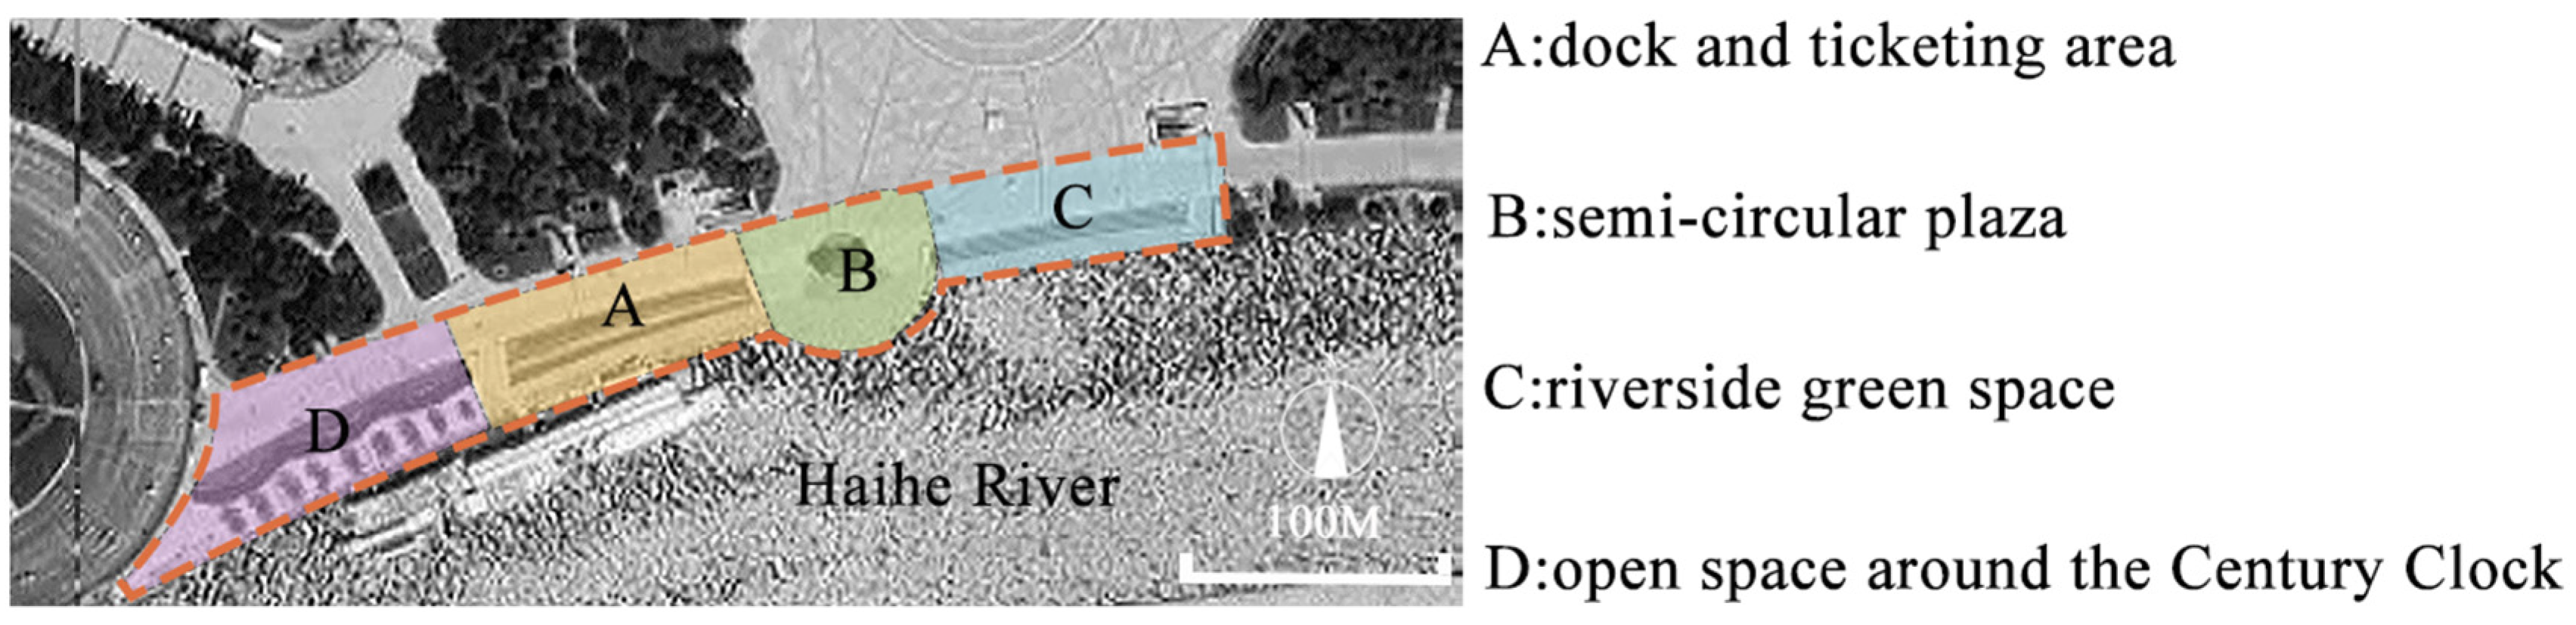
Observation areas: The site was divided into four observation zones to capture pedestrian activity in different areas: Zone A—dock and ticketing area, Zone B—semi-circular plaza, Zone C—riverside green space, Zone D—open space around the Century Clock (Figure 6).

Figure 6.
Observation zones for pedestrian behavior analysis.
Data recording steps. Step 1. Locate the observation area, using a map or area markers to define the current observation zone, ensuring all activities are clearly visible. Step 2. Begin recording. Within the observation area, record the following using the smartphone application: arrival time (record the time users enter the area); dwell time (track the duration users or groups stay in the area); activity type (select from preset activity categories (e.g., sightseeing, exercise, resting, fishing)); group size (indicate whether the activity is performed by individuals or groups (e.g., families or couples)). Step 3. Complete the recording. After users leave the area, save the record and apply appropriate labels.
Target groups. Qualitative observation focused on the following groups: tourists (mainly engage in sightseeing and photography); exercisers (jogging or walking in the green areas); resters (relaxing in shaded areas or seating zones); fishers (concentrated near the riverside steps); boat passengers (gather in the ticketing area, waiting area, and boarding points).
Data verification. After each observation, handwritten records are compared with timestamp data from the application to ensure accuracy and consistency.
2.4.2. Interview Data Collection
To deepen our understanding of user needs and validate the findings from the qualitative observations, semi-structured interviews were conducted with 40 tourists and 30 local residents, representing the five main user groups identified during the observation period: tourists, exercisers, resters, fishers, and boat passengers. Participants were selected based on their frequency of site use to ensure that the sample represented the key user groups observed. This step adds an interview-based qualitative layer, which is a widely used method in user experience research to complement observational data [28]. By directly engaging with users, we were able to obtain insights into their subjective experiences, spatial preferences, and needs. The aim of these interviews was not only to verify user behavior, but also to identify latent needs that might not have been fully captured through observation alone.
The primary aim of the interviews was to understand users’ preferences and needs regarding the different facilities at the site. Key questions included the following:
“Which facilities do you use most frequently?”
“What functions or features would you like the site to offer?”
“Which facilities are crucial to your experience?”
Responses were recorded through written notes, which were subsequently transcribed and analyzed using a coding method. During the coding process, key themes and user preferences were identified and categorized, and then compared with the data from the qualitative observations to validate and refine the demand classifications. Through the interviews, we were able to verify and complement the findings from the behavioral observations, confirming that the categorization of various facilities as Must-be and Attractive aligned with the observed user activity patterns. This hybrid approach of combining qualitative observation with in-depth interviews has proven effective in similar case studies [28] and helps fill a methodological gap where previous studies have primarily relied on quantitative surveys or simple spatial measurements. Our combined approach provides a nuanced understanding of user demand, ensuring that the renovation strategies are grounded in both empirical observation and user feedback. The interview results helped further refine the KANO model analysis, ensuring that it accurately reflected the needs of each user group.
2.4.3. Quantitative Spatial Data Collection
The tourism flow data mainly come from the official statistics provided by the Tianjin Municipal Bureau of Culture and Tourism. These statistics include the number of visitors received during the first quarter of 2023, as well as during major holidays such as the Mid-Autumn Festival and National Day. Spatial features such as greening coverage, building density, and the distribution of public service facilities were obtained through a combination of field observations and CAD2022 calculations (Table 2).
Table 2.
Data collection source.
2.5. Needs of Different Demographic Groups—KANO Model
The KANO model is a bivariable cognitive model introduced by Professor Noriaki Kano of the Tokyo Institute of Technology [29]. This model employs statistical analysis of both the positive and negative aspects of user satisfaction and needs, assisting in categorizing and assessing the importance of user demands. It helps identify which services best meet users’ needs in different scenarios [29]. In this study, we apply the KANO model to analyze the needs of different user groups at the Tianjin cruise terminal, a key public space that serves tourists and local residents. This analysis is aimed at understanding how different user behaviors, preferences, and time-based needs influence their satisfaction with public facilities. The findings are used to inform the prioritization of facilities and services during the design guidelines of the terminal, with a particular focus on enhancing spatial accessibility, public infrastructure, and outdoor comfort.
The KANO model identifies three main factors influencing customer satisfaction [30]: (1) Must-be attributes. These are basic requirements that, if unmet, lead to dissatisfaction, but their fulfillment does not increase satisfaction. (2) One-dimensional attributes. These needs directly affect customer satisfaction. Meeting them increases satisfaction, while failing to meet them decreases satisfaction. (3) Attractive attributes. These are needs that customers have not explicitly expressed. Their absence does not cause dissatisfaction, but their fulfillment enhances satisfaction and encourages positive word-of-mouth [30]. Additionally, customer perceptions of product and/or service quality can be analyzed from two other dimensions: indifferent quality and reverse quality. Those with indifferent quality have no significant impact on user satisfaction. The presence or absence of such elements does not elicit any specific response from users, as they do not concern themselves with this type of element. Reverse quality refers to service elements that are unnecessary, and user satisfaction decreases when such elements are not provided [31] (Figure 7).
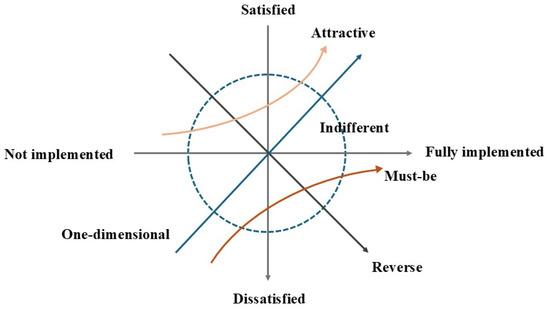
Figure 7.
Schematic diagram of the KANO model.
In this study, a five-point scale is utilized. Here, 5 (Must-be) represents essential facilities whose absence leads to dissatisfaction, 4 (One-dimensional) reflects facilities with a proportional effect on satisfaction, 3 (Attractive) denotes non-essential but satisfaction-enhancing features, 2 (Indifferent) identifies facilities with minimal impact, and 1 (Reverse) describes features that may reduce satisfaction (Table 3). This classification method, widely adopted in quality management research, ensures a systematic evaluation of user priorities [32].
Table 3.
KANO model-based facility scoring scale.
Evaluation Index System
Based on the analysis of the needs of different user groups in terms of spatial accessibility, public infrastructure, and outdoor comfort, a set of evaluation criteria was developed through field research on the current state of site facilities, combined with a literature review [33,34,35,36,37] and expert recommendations. Additionally, to enhance the applicability and practicality of the evaluation criteria, the research team conducted brief interviews with site users to gather their feedback and suggestions on the criteria. The interview results provided supplementary references for the optimization of the indicators. We here divide the evaluation criteria into three main dimensions: spatial convenience, public infrastructure, and outdoor comfort. The framework consists of three primary categories and twelve sub-indicators, as shown in Table 4.
Table 4.
Evaluation index system.
2.6. Enhancing KANO Model Classification with Weight Analysis
Building upon the existing KANO model, this study introduces a weight analysis method [38] aimed at enhancing the accuracy and scientific rigor of the classification process. While the traditional KANO model is widely used in demand analysis, it lacks the ability to account for differences among user groups. By incorporating a weight mechanism based on field survey data, this study assigns varying weights to the demands of different user groups, providing a more precise reflection of user needs in the actual site context. This approach not only improves the adaptability of the KANO model, but it also offers a novel perspective for demand classification in similar settings. The data for weight calculation are derived from field surveys. The study used handheld devices to record the distribution density and activity frequency of five user groups (exercisers, passengers, tourists, resters, and anglers) at the site over a 24 h period, capturing peak and off-peak times. The survey results include the distribution proportions of each user group at the site, and the demand preferences for facilities and services across different user groups.
In order to calculate the weight of each facility W, we use a formula that incorporates both the proportional distribution of user groups and their individual facility preferences,
where W—the comprehensive weight of facility j, representing its overall significance; Pi—the proportional distribution of user group i within the study population; Ri,j—the importance rating assigned to facility j by user group i.
By introducing weight analysis, this study not only enhances the accuracy of the KANO model, but also provides a method for dynamically adjusting the weight of user demands, allowing the specific needs of each user group to be more accurately reflected in the facility optimization process. The variation in the proportion of user groups can be effectively adjusted through the weighting mechanism, ensuring the adaptability and precision of the demand classification.
According to the research of Kano et al. [39], the KANO model is highly adaptable, allowing researchers to adjust the model parameters based on specific data distributions and user demands. Therefore, this study classifies the facilities into the five types of demand attributes in the KANO model based on the actual weight distribution of the user groups at the tourist site, with the classification rules shown in the Table 5.
Table 5.
Comprehensive weighted threshold classification table.
3. Results
3.1. Data Analysis: User Behavior and Patterns
This study conducted on-site observations of 250 participants to analyze the proportional distribution and demand preferences of user groups. The sample included five key user groups commonly found in the study area—tourists (36.4%, 91 individuals), resters (22.7%, 57 individuals), boat passengers (18.2%, 46 individuals), anglers (13.6%, 34 individuals), and exercisers (9.1%, 23 individuals). The sampling process covered different time periods throughout the day, including both peak and off-peak hours, to ensure data accuracy and representativeness. The sample size of this study accounted for approximately 10–15% of the daily total visitor count, aligning with common practices in tourism-related research [40]. This sampling proportion is widely adopted in similar studies to balance representativeness and the feasibility of data collection, ensuring sufficient representativeness in the analysis.
Figure 8 provides a detailed analysis of the activity frequency of different groups over a 24 h period, including exercisers, boat passengers, tourists, resters, and fishers. The results show that the usage patterns of each group vary, reflecting their behavioral characteristics and time preferences. The specific findings are as follows:

Figure 8.
(a) Population composition, (b) daily activity frequency.
1. Exercisers are mainly concentrated in the walking paths and riverside green areas of the site. The frequency of use peaks during the early morning period (6–9 AM), indicating a concentration of morning exercise activities. After this, the number of exercisers gradually decreases, reaching a low point during midday (12–3 PM), before gradually increasing again in the afternoon, reflecting the typical time distribution of exercise behavior. This suggests a demand for footpaths and greenbelts that provide safe and comfortable spaces for exercise. Additionally, seats are important for exercisers during rest periods, thus categorizing seating as an Attractive facility for this group;
2. Boat passengers are typically concentrated near the pier, boarding points, and ticketing areas. Their numbers gradually increase in the morning (9–12 AM), and peak in the evening (6–9 PM), which is closely related to the operating hours of the cruise services and people’s activity patterns. After 9 PM, as boat services cease, the number of boat passengers drops to zero. Ticketing rooms, waiting areas, and embarkation points are essential for boat passengers, making them Must-be facilities for this group. In addition, toilets are crucial in relation to long waiting times, while seats are necessary for waiting, especially during peak hours;
3. Tourists are more widely distributed, particularly favoring open scenic areas such as riverside platforms and observation decks. Their numbers start to rise in the morning (6–9 AM) and peak at midday (12–3 PM), and then stabilize. Although there is a slight decrease in the afternoon (3–6 PM), the number of tourists increases again in the evening (6–9 PM), reflecting the flow characteristics of tourists at different times of the day. Tourists often engage in activities like sightseeing and photography, making seating areas particularly important for them to rest during their visits. Shaded seating areas are considered an Attractive facility, offering comfort while allowing them to enjoy the views. However, unlike resters, tourists also prioritize identifiable outdoor spaces that guide their movements through the site, and road sign systems that ensure they can easily navigate between key points of interest;
4. Resters tend to choose quieter, shaded areas such as seating and green spaces within the site. Their numbers are lowest in the morning (6–9 AM), gradually increasing from 9 AM, reaching a peak at midday (12–3 PM), and then maintaining a relatively stable number, demonstrating the appeal of the site’s leisure spaces during the day. For resters, seating, shade areas, and greenbelts are critical for relaxation, making these facilities Must-be requirements. The presence of toilets is also necessary for comfort, particularly during extended periods of leisure;
5. Fishers are mostly concentrated in the waterside stair areas. Their activity peaks in the early morning (6–9 AM), then gradually decreases, reaching a low during midday (12–3 PM). After 3 PM, the number of fishermen rises again, indicating that this activity is mainly concentrated in the quieter early morning and late afternoon periods. The preference for quieter, more secluded areas such as the water steps suggests that these facilities are considered Attractive for fishers, providing a serene and enjoyable experience. Seating is also valuable to fishers, making it an Attractive facility, especially in areas where they rest while fishing.
These data reveal the usage peaks and troughs of different groups within the site, indicating that the resource and spatial needs of the site vary significantly during morning, midday, and evening periods. This distribution pattern provides important insights for facility management and resource allocation, especially in terms of arranging service facilities and spatial resources during peak times to alleviate congestion and enhance the service quality and efficiency of the site.
3.2. KANO Analysis
3.2.1. Categorization of Facilities and Services Based on KANO Analysis
Based on the activity patterns of various user groups throughout the day, and considering the activity needs and behavioral characteristics of each group, the core needs of different user groups were analyzed at various times of the day. This analysis guided the prioritization of key facilities to optimize the site’s functional layout.
In addition to the behavior observation data, the results from semi-structured interviews conducted with 40 tourists and 30 local residents were incorporated to further validate and refine the KANO model analysis. These interviews focused on understanding user preferences, satisfaction with current facilities, and expectations for improvements, which provided additional insights into the Must-be, One-dimensional, and Attractive needs for various facilities.
For example, the seating facility was categorized as Attractive for exercisers, who emphasized that the availability of comfortable seating in outdoor areas enhanced their experience, especially during breaks from physical activity. Conversely, for resters, seating was considered a Must-be facility, with many participants expressing that the absence of seating would significantly reduce the comfort and satisfaction of their experience. Similarly, a toilet was universally categorized as Must-be for tourists, boat passengers and resters, based on both behavior observation and interview results. The interviewees highlighted the necessity of having well-maintained toilets, especially during long visits or waiting periods. The water step facility, initially categorized as Attractive for exercisers and tourists, was further validated in the interviews, with respondents indicating that its scenic value and proximity to the water enhanced their overall experience, reinforcing its classification as Attractive. However, the tnteractive facility, which had been categorized as One-dimensional for tourists based on observation, was reassessed after the interviews. Many respondents indicated that while the interactive facility was a pleasant addition, it was not a primary reason for visiting the site and was not considered essential. As a result, its classification was adjusted in the final KANO model analysis to reflect its lower priority among user needs.
These findings from the interviews help confirm and refine the categorization of facilities and services, ensuring that the KANO model analysis accurately reflects the needs of each user group (Table 6) and contributes to the optimization of the site’s layout.
Table 6.
The KANO model analyzed the results according to different population classification.
3.2.2. Overall Prioritization and Prediction Using KANO Model
By incorporating the distribution characteristics and proportional distribution of various user groups throughout the day, an improvement in the priority and classification of facilities and services was enabled based on a weighted KANO model. By combining the proportional distributions of different user groups and their demand preferences, the weighted method provides a more comprehensive assessment of the importance of each facility. The results of this analysis are listed in Table 7.
Table 7.
Comprehensive weighted score table for facilities.
Based on scores calculated through weights and taking into account the demand preferences of different user groups, an overall prediction and classification of the KANO model for site facilities and services were performed (Table 8). This classification reflects the weighted importance of facilities for all users, providing guidance for the rational prioritization of facilities and the optimization of management strategies.
Table 8.
KANO model categorization of facilities in the study area.
3.3. Existing Problems
Through field research and KANO model data analysis, along with feedback collected from brief interviews, several key issues at the cruise terminal were identified and are summarized as follows:
- (a)
- Inadequate service facilities. The KANO model and user behavior analysis indicate that essential service facilities, such as restrooms, visitor service centers, and seating areas, are crucial for user satisfaction. However, the terminal has very limited service facilities, lacking essential visitor services such as luggage storage, information desks, and rest areas. This is particularly problematic during peak periods when passenger demand for these services increases.
- (b)
- Lack of infrastructure. The site currently lacks essential infrastructure, particularly in terms of seating, waiting areas, and shaded spaces. Visitors and boat passengers often stay for extended periods, but the absence of comfortable seating and sufficient shading facilities creates inconvenience during their waiting time, especially during peak periods. The lack of proper waiting areas significantly reduces the quality of rest for visitors, which negatively impacts their overall satisfaction with the site;
- (c)
- Pathway guidance and connectivity issues. The site lacks a clear internal navigation system, leading to fragmented movement between key areas. The absence of a defined pathway system makes it difficult for visitors to orient themselves within the space, which is particularly problematic for those unfamiliar with the site. Without effective road signage and identifiable outdoor spaces, users are often unsure of how to navigate between important facilities, such as the terminal and visitor service center. This lack of clarity significantly hinders smooth user flow and spatial efficiency;
- (d)
- Lack of waterfront interaction. The current design of the waterfront area does not offer sufficient opportunities for users to interact with the water, limiting the overall engagement with the natural environment. For fishers, this issue is particularly significant as they rely on direct access to the waterfront for fishing. There are no designated fishing platforms or steps, making it difficult for them to use the space effectively. Additionally, the lack of interactive features around the water reduces the site’s appeal for both tourists and other visitors who seek a more immersive experience with the waterfront.
4. Discussion
4.1. Retrofitting Strategies in Response to Findings
Using the KANO model, this study conducted a comprehensive analysis of the needs of different user groups. By integrating daily crowd activity frequencies and weighted analysis, the study summarized the characteristics of each user group’s needs and identified the existing issues in the current waterfront area. Through the introduction of weighted analysis, this study was able to more accurately identify the core needs of different user groups and provide data support for various design guidelines. For instance, the needs of tourists, leisure visitors, and exercisers were weighted to ensure that the design guidelines reflect the activity frequencies and behavioral characteristics of these groups.
As key user groups of the waterfront public space, the needs and perceptions of tourists, exercisers, resters, and other user groups must be fully considered during the renovation of the waterfront area. Design must not only account for the usage differences between these groups, but also integrate the personalized spatial needs of each group, ultimately creating public spaces that accommodate diverse user needs while balancing functionality and comfort. These findings provide valuable guidelines for the design process, but are not final solutions, as the creative design process will interpret and further adapt these insights to achieve optimal results.
The Table 9 below summarizes the existing problems identified through the KANO model analysis, and proposes corresponding design guidelines. Detailed descriptions of these solutions are provided following the table.
Table 9.
Identified issues and recommended guidelines.
- Improvement of service facilities. The site requires essential facilities such as toilets and visitor service centers. Adding these facilities in key locations will directly improve visitor comfort and satisfaction, particularly during peak periods. Prioritizing these upgrades will ensure a more pleasant experience for tourists and boat passengers.
- Infrastructure enhancement. To address these issues, it is crucial to add seating and resting areas in key locations to improve visitor comfort. By optimizing the layout of the site, benches and seating can be strategically placed along main pathways and areas of high visibility, providing more resting space. Additionally, considering the high temperatures during peak seasons and the extended time visitors spend on site, shading facilities are especially important. Installing canopies or shade nets around seating areas would help protect visitors and resters from prolonged sun exposure. These improvements will enhance the comfort of the waiting areas and significantly improve the overall visitor experience.
- Improving pathway guidance and connectivity. To resolve the issues related to internal navigation and connectivity, it is crucial to establish a clear and coherent pathway system that connects key areas within the site. The integration of a comprehensive wayfinding system, featuring clear and visible road signs, is necessary to guide visitors through the space. In particular, placing directional signage at strategic points, such as near the terminal and major facilities, would help enhance the site’s overall navigability. Furthermore, improving the identifiability of key spaces through distinct visual markers and signage will provide users with a clearer sense of orientation, facilitating smoother movement between important locations. By addressing these concerns, the site’s overall accessibility and user experience can be significantly improved.
- Waterfront interaction. The KANO model classifies waterfront interaction as an attractive feature, applicable to multiple user groups, including tourists, leisure visitors, exercisers, and fishermen. Interactive platforms enhance the user experience by facilitating interaction with the natural environment. The creation of waterfront platforms along the terminal will promote interaction between tourists, exercisers, and residents with the water, meeting aesthetic and experiential needs. Designing immersive experiences that incorporate elements allowing users to interact with the waterfront will satisfy their needs for immersion and enjoyable experiences.
4.2. Design Interventions and Broader Implications
The design guidelines proposed in this study have been carefully crafted to meet the diverse needs of various user groups, including tourists, exercisers, fishers, resters, and nearby residents. By utilizing a comprehensive analysis of user activity frequencies and their respective classifications in the KANO model, these guidelines ensure the overall improvement of site functionality and user satisfaction.
This study enhances the KANO model by introducing weighted analysis, which dynamically adjusts the importance of different user group needs. This approach increases the accuracy and flexibility of the KANO model, especially when analyzing the diverse demands of multiple groups. By incorporating weighted analysis, the model becomes more capable of addressing the varying needs of each user group, particularly as these needs shift across different times and seasons. This method not only strengthens the applicability of the KANO model in urban planning, but also provides a practical approach for prioritizing and categorizing user needs in similar projects. The resulting design interventions are more targeted and responsive, ensuring they align with the changing needs of various user groups at different times.
The study integrates the KANO model within the context of urban waterfront planning, expanding the existing literature. Li Qin et al. [32] studied the renovation of public spaces in old residential communities in Beijing from a female-friendly perspective, focusing primarily on a single user group. Ye et al. [30] examined the perceived importance of and satisfaction with dock attributes, targeting only sailing tourism groups. In contrast, this study adopts a more inclusive approach, incorporating statistical data from multiple user groups, including tourists, exercisers, fishermen, leisure visitors, and nearby residents. This comprehensive perspective not only enriches the application of the KANO model in urban planning, showcasing its multifunctionality in addressing complex, multi-faceted urban environments, but also provides a detailed understanding of how to strategically implement design guidelines to enhance overall site functionality and user satisfaction through the classification and prioritization of user needs across different groups. The findings resonate with practical applications in other urban renewal and waterfront design projects. For instance, William [41] suggests that when redeveloping waterfront areas, public spaces should focus on public restrooms, shaded areas, and waterfront interaction. Lagarense [12] highlights the importance of residents in tourism and waterfront development, and Yu Ping [42] argues that green spaces, waterfront interaction, leisure seating, and the recognizability of outdoor spaces are priority indicators for waterfront tourism area renovation, underscoring the model’s effectiveness in diverse contexts.
For similar waterfront areas, the design guidelines formulated in this study have high portability and are applicable to other urban waterfronts and tourism-centered areas. By optimizing spatial utilization and enhancing service facilities, these guidelines can be effectively implemented in different urban environments, regardless of city size or specific characteristics. For example, waterfront parks in metropolitan areas or small towns can adopt similar approaches to improve functionality and user experience, thus promoting the development of sustainable tourism within the urban planning framework. The proposed design guidelines provide a robust framework for future urban renewal projects and waterfront development, enabling urban planners to ensure the harmonious coexistence of tourism development with residential and recreational needs through the integration of multifunctional design principles and the user-centered classifications in the KANO model. This balanced approach not only aids in the creation of multifunctional urban spaces that meet the demands of various activities, enhancing the overall livability and attractiveness of cities, but it also provides a blueprint for incorporating user feedback and experiential data into the urban planning process, fostering a more responsive approach.
4.3. Limitations and Future Directions
The data used for this study were derived from field observations of 250 participants and interviews with 70 participants, thus meeting the typical standards for tourism research. However, limitations remain. The reliance on a single data source may affect the generalizability of findings, as user needs and satisfaction can vary across seasons. Additionally, the study’s focus on a specific site limits the applicability of conclusions to other geographic or cultural contexts. The lack of exploration into users’ motivations and psychological factors also constrains a deeper understanding of their needs.
Future research should consider diverse waterfront locations and seasonal variations to enhance representativeness. Expanding methods, such as using surveys, could further refine the analysis and better guide design interventions.
5. Conclusions
This study investigated the spatial behaviors and preferences of diverse user groups at the Tianjin Cruise Terminal, establishing an evaluation framework for waterfront public spaces that integrates the KANO model with weighted user group analysis. By identifying and categorizing spatial needs across three dimensions—spatial convenience, public infrastructure, and outdoor comfort—the research provided a systematic method for prioritizing improvements to optimize user satisfaction.
To guide the optimization of the terminal, the following design guidelines are proposed: Enhancing the allocation and placement of essential facilities, such as restrooms and shaded seating, to meet the fundamental needs of high-frequency users like boat passengers and tourists. Introducing participatory and interactive elements, such as water-access platforms and engaging public art, to foster user engagement and enrich the visitor experience. Expanding green infrastructure to improve environmental comfort while maintaining a balance between open activity areas and vegetation coverage. Furthermore, integrating visual landmarks and wayfinding features ensures better accessibility and navigation throughout the site.
Overall, the prioritization approach, combining the KANO model and weighted demand analysis, allows for the precise identification of critical improvements in waterfront spaces. This method ensures that resources are allocated to address the most pressing needs of diverse users, supporting the development of inclusive and user-centered public spaces. However, challenges remain, including the dynamic nature of user demands and the need for continuous evaluation and adjustment. Future research should incorporate larger datasets and longitudinal monitoring to refine the applicability and accuracy of the proposed strategies, ensuring their adaptability to evolving urban environments.
Author Contributions
Conceptualization, Y.Z. (Ying Zhao) and Y.Z. (Yin Zhang); methodology, C.C.; software, M.H. and X.L.; validation, Y.Z. (Ying Zhao), Y.L. and Y.Z. (Yin Zhang); formal analysis, M.H.; investigation, C.C.; resources, Y.Z. (Yin Zhang); data curation, Y.Z. (Ying Zhao); writing—original draft preparation, Y.Z. (Ying Zhao) and M.H.; writing—review and editing, X.L. and C.C.; visualization, Y.L.; supervision, Y.Z. (Yin Zhang) All authors have read and agreed to the published version of the manuscript.
Funding
This research is funded by Chengdu Social Science Research Program (No. 2024CS081) and Higher Education Reform Research Project of National Ethnic and Religious Affairs Commission of China (No. 23022).
Institutional Review Board Statement
Not applicable.
Informed Consent Statement
Not applicable.
Data Availability Statement
Data are available on request.
Conflicts of Interest
The authors declare no conflicts of interest.
References
- Heyman, A.V.; Sommervoll, D.E. House prices and relative location. Cities 2019, 95, 102373. [Google Scholar] [CrossRef]
- Gracias, J.S.; Parnell, G.S.; Specking, E.; Pohl, E.A.; Buchanan, R. Smart Cities—A Structured Literature Review. Smart Cities 2023, 6, 1719–1743. [Google Scholar] [CrossRef]
- Duca, G.; Trincone, B.; Bagamanova, M.; Meincke, P.; Russo, R.; Sangermano, V. Passenger Dimensions in Sustainable Multimodal Mobility Services. Sustainability 2022, 14, 12254. [Google Scholar] [CrossRef]
- Kuzior, A.; Pakhnenko, O.; Tiutiunyk, I.; Lyeonov, S. E-Governance in Smart Cities: Global Trends and Key Enablers. Smart Cities 2023, 6, 1663–1689. [Google Scholar] [CrossRef]
- Gunay, Z.; Dokmeci, V. Culture-led regeneration of Istanbul waterfront: Golden Horn Cultural Valley Project. Cities 2012, 29, 213–222. [Google Scholar] [CrossRef]
- Attia, S.; Ibrahim, A.A.A.M. Accessible and Inclusive Public Space: The Regeneration of Waterfront in Informal Areas. Urban Res. Pract. 2018, 11, 314–337. [Google Scholar] [CrossRef]
- Liu, S.; Lai, S.-Q.; Liu, C.; Jiang, L. What influenced the vitality of the waterfront open space? A case study of Huangpu River in Shanghai, China. Cities 2021, 114, 103197. [Google Scholar] [CrossRef]
- Li, Y.; Hu, C.; Huang, C.; Duan, L. The concept of smart tourism in the context of tourism information services. Tour. Manag. 2017, 58, 293–300. [Google Scholar] [CrossRef]
- Mihalic, T. Conceptualising overtourism: A sustainability approach. Ann. Tour. Res. 2020, 84, 103025. [Google Scholar] [CrossRef]
- Nematchoua, M.K.; Sadeghi, M.; Reiter, S. Strategies and scenarios to reduce energy consumption and CO2 emission in the urban, rural and sustainable neighbourhoods. Sustain. Cities Soc. 2021, 72, 103053. [Google Scholar] [CrossRef]
- Zhou, Z.; Yang, F.; Li, J.; Li, J.; Zou, Z. Identification of Critical Areas of Openness–Vitality Intensity Imbalance in Waterfront Spaces and Prioritization of Interventions: A Case Study of Xiangjiang River in Changsha, China. Land 2024, 13, 686. [Google Scholar] [CrossRef]
- Lagarense, B.E.S.; Walansendow, A. Exploring Residents’ Perceptions and Participation on Tourism and Waterfront Development: The Case of Manado Waterfront Development in Indonesia. Asia Pac. J. Tour. Res. 2015, 20, 223–237. [Google Scholar] [CrossRef]
- Wang, W.-C.; Lin, C.-H. Exploring the Importance of Destination Attributes of Sustainable Urban Waterfronts: Text and Data Mining of Tourists’ Online Reviews. Sustainability 2024, 16, 2271. [Google Scholar] [CrossRef]
- Segovia-Hernández, J.G.; Hernández, S.; Cossío-Vargas, E.; Sánchez-Ramírez, E. Challenges and opportunities in process intensification to achieve the UN’s 2030 agenda: Goals 6, 7, 9, 12 and 13. Chem. Eng. Process.-Process Intensif. 2023, 192, 109507. [Google Scholar] [CrossRef]
- Wang, W.; Ma, X. Vitality Assessment of Waterfront Public Space Based on Multi-Source Data:A Case Study of the Huangpu River Waterfront. Urban Plan. Forum 2020, 1, 48–56. [Google Scholar] [CrossRef]
- Pazzini, M.; Corticelli, R.; Lantieri, C.; Mazzoli, C. Multi-Criteria Analysis and Decision-Making Approach for the Urban Regeneration: The Application to the Rimini Canal Port (Italy). Sustainability 2023, 15, 772. [Google Scholar] [CrossRef]
- Ouyang, P.; Wu, X. Analysis and Evaluation of the Service Capacity of a Waterfront Public Space Using Point-of-Interest Data Combined with Questionnaire Surveys. Land 2023, 12, 1446. [Google Scholar] [CrossRef]
- Enseñat-Soberanis, F.; Blanco-Gregory, R. Crowding Perception at the Archaeological Site of Tulum, Mexico: A Key Indicator for Sustainable Cultural Tourism. Land 2022, 11, 1651. [Google Scholar] [CrossRef]
- Seebunruang, J.; Burns, R.C.; Arnberger, A. Is National Park Affinity Related to Visitors’ Satisfaction with Park Service and Recreation Quality? A Case Study from a Thai Forest National Park. Forests 2022, 13, 753. [Google Scholar] [CrossRef]
- China Statistics Press. China Statistical Yearbook; China Statistics Press: Beijing, China, 2023. [Google Scholar]
- Cui, D.; Li, Y.X.; Wu, D. Spatiotemporal evolution and influencing factors of tourism economic growth in Beijing-Tianjin-Hebei region. Acta Geogr. Sin. 2022, 77, 1391–1410. [Google Scholar]
- Wang, J. Transition of tianjin urban spatial form from the perspective of transition of haihe river. City Plan. Rev. 2009, 33, 71–77. [Google Scholar]
- 12 Million Visits, 12.185 Billion yuan! The “Hottest” Golden Week, Tianjin Ignites a New Wave of Urban Tourism. Available online: https://whly.tj.gov.cn/XWDTYXWZX6562/gzdtnew/202310/t20231007_6422247.html (accessed on 7 October 2023).
- Along a River, Polish the New Business Card of Jingu Consumption. Available online: http://fw.whly.tj.gov.cn/wlsj/mtjj/202410/t20241018_6756242.html (accessed on 18 October 2024).
- GB/T 18973-2022; Quality Requirements and Evaluation of Tourism Toilets. State Administration for Market Regulation and Standardization Administration of the People’s Republic of China: Beijing, China, 2022.
- GB 50442-2008; Code for Urban Public Facilities Planning. Ministry of Construction of the People’s Republic of China: Beijing, China, 2008.
- Sheydayi, A.; Dadashpoor, H. Conducting qualitative content analysis in urban planning research and urban studies. Habitat. Int. 2023, 139, 102878. [Google Scholar] [CrossRef]
- Wang, Y.; Wong, Y.D.; Du, B.; Lum, K.M.; Goh, K. Sociospatial inclusiveness of streets through the lens of urban pedestrian mobilities: Go-along interviews with less mobile pedestrians in Singapore. J. Transp. Geogr. 2024, 115, 103811. [Google Scholar] [CrossRef]
- Wei, L.; Duan, W.; Dong, S. Research on Leased Space of Urban Villages in Large Cities Based on Fuzzy Kano Model Evaluation and Building Performance Simulation: A Case Study of Laojuntang Village, Chaoyang District, Beijing. Buildings 2024, 14, 120. [Google Scholar] [CrossRef]
- Shen, Y.; Kokkranikal, J.; Christensen, C.P.; Morrison, A.M. Perceived importance of and satisfaction with marina attributes in sailing tourism experiences: A kano model approach. J. Outdoor Recreat. Tour. 2021, 35, 100402. [Google Scholar] [CrossRef]
- Madzík, P. Increasing accuracy of the Kano model—A case study. Total Qual. Manag. Bus. Excell. 2018, 29, 387–409. [Google Scholar] [CrossRef]
- Li, Q.; Hou, D.; Zhang, Z.; Chen, Z.; Li, W.; Liu, Y. Evaluation of Public Space in Beijing’s Old Residential Communities from a Female-Friendly Perspective. Sustainability 2024, 16, 8387. [Google Scholar] [CrossRef]
- Hu, R.; Tao, X.; Gong, J.; Wang, F. Quality function deployment approach to urban ecological public art design centred on resident needs. Sci. Rep. 2024, 14, 22814. [Google Scholar] [CrossRef]
- Tian, T.; Yu, T.; Qian, Y.; Deng, L.; Che, Y. Assessing public perceptions of the cultural ecosystem services waterfront spaces provide along the Huangpu River in Shanghai, China, in support of urban waterfront planning and design. Socio-Ecol. Pract. Res. 2024, 6, 141–154. [Google Scholar] [CrossRef]
- Amrousi, M.E.; Elhakeem, M.; Paleologos, E. Waterfront developments and engineered canals in the UAE. City Territ. Archit. 2024, 11, 10. [Google Scholar] [CrossRef]
- Luo, L.; Cao, Y. The museum method of reusing Shanghai waterfront industrial heritage: Continuation and reconstruction of urban memory. Built Herit. 2023, 7, 23. [Google Scholar] [CrossRef]
- Al-Saud, L.E.; Goussous, J.S. Waterfront Urban Regeneration and Its Impact on Socio-cultural Activities (The Case of Jeddah Waterfront). In Proceedings of the Cities’ Vocabularies and the Sustainable Development of the Silkroads; Springer Nature: Cham, Switzerland, 2023; pp. 21–32. [Google Scholar]
- Tu, E.; Zhou, Y. Investigating preferences and influencing factors of age-friendly housing environments across different age groups using the Delphi-Kano model and entropy weight TOPSIS method. Front. Archit. Res. 2024. [Google Scholar] [CrossRef]
- Kano, N.; Seraku, N.; Takahashi, F.; Tsuji, S.-I. Attractive Quality and Must-Be Quality. J. Jpn. Soc. Qual. Control 1984, 14, 147–156. [Google Scholar] [CrossRef]
- Daniels, M.J. Central place theory and sport tourism impacts. Ann. Tour. Res. 2007, 34, 332–347. [Google Scholar] [CrossRef]
- Salama, S.W. Towards developing sustainable design standards for waterfront open spaces. City Territ. Archit. 2022, 9, 26. [Google Scholar] [CrossRef]
- Yu, P.; Zhang, Y. A Satisfaction Study of Waterfront Public Spaces in Winter Cities from a Demand Perspective: A KANO-IPA Model Analysis Based on Northeastern China. Land 2025, 14, 92. [Google Scholar] [CrossRef]


Disclaimer/Publisher’s Note: The statements, opinions and data contained in all publications are solely those of the individual author(s) and contributor(s) and not of MDPI and/or the editor(s). MDPI and/or the editor(s) disclaim responsibility for any injury to people or property resulting from any ideas, methods, instructions or products referred to in the content. |
© 2025 by the authors. Licensee MDPI, Basel, Switzerland. This article is an open access article distributed under the terms and conditions of the Creative Commons Attribution (CC BY) license (https://creativecommons.org/licenses/by/4.0/).