Abstract
This study investigates the determinants of superior long-term business performance in Thai digital entrepreneurship through an innovative mixed-method approach combining Rough Set Fuzzy Theory and Second-order Confirmatory Factor Analysis. This research addresses a significant gap in the existing literature by incorporating business strategies, product innovation, social media adoption, and entrepreneurial orientation into a comprehensive framework, extending beyond traditional Technology–Organization–Environment (TOE) models. This study analyzes seven key factors that influence digital business success: technology, organization, external environment, social media adoption, business strategy, product innovation, and entrepreneurial orientation. The methodological approach employed for this study utilized expert consensus validation and model verification techniques to develop a novel integrated model specifically tailored for Thailand’s digital SME context. The findings reveal that business strategy and entrepreneurial orientation are primary drivers of business success. This research provides valuable insights for practitioners in the Thai digital entrepreneurship ecosystem, offering a structured approach to achieving sustainable long-term business success.
1. Introduction
Small and medium-sized enterprises (SMEs) face critical survival challenges in the global economy, with 67% of SME executives worldwide citing survival and expansion as their primary concern [1,2]. Despite generating approximately 70% of global jobs and GDP, they struggle with fundamental issues, including low profit margins, scaling difficulties, and market expansion challenges [3]. These challenges are particularly acute in Thailand, where SMEs have rapidly embraced digital transformation to meet evolving customer demands [4]. The digital transformation landscape presents both opportunities and challenges for Thai SMEs. While Thai enterprises have shown remarkable adoption rates of technology, with 71% accelerating investments in customer service technologies compared to 41% globally, many still face difficulties in maintaining sustainable long-term performance, defined as sustained growth in revenue, market share, and stakeholder value over a three-year period [5]. This challenge is particularly notable when compared to neighboring countries like Singapore and Malaysia, where digital transformation success rates are 15% and 10% higher, respectively [6]. In Thailand’s context, where 90% of SMEs have embraced digitalization under the Thailand 4.0 policy initiative, organizations must leverage digital technologies for both operational efficiency and environmental stewardship [7]. Research conducted between 2022 and 2024 indicates that Thai SMEs implementing sustainable digital practices have experienced a 35% increase in operational efficiency and a 28% improvement in stakeholder satisfaction [8]. Recent studies demonstrate that successful digital transformation, when aligned with sustainability initiatives, creates significant competitive advantages through improved operational efficiency and enhanced ESG performance, leading to an average 25% increase in market share and stronger stakeholder trust [9]. The integration of technology, organizational structure, and external environment factors has become crucial for business survival and growth in the digital age [10]. Previous research has established the Technology–Organization–Environment (TOE) framework as a foundational theoretical model, which, when integrated with social media adoption, significantly influences business performance through both financial metrics and non-financial outcomes [11,12]. Studies specific to Thai SMEs reveal that successful digital transformation requires more than technological adoption alone, with integrated approaches combining technology and sustainability initiatives achieving 40% higher performance outcomes than single-factor approaches [13]. Thai SMEs that exhibit a strong entrepreneurial orientation demonstrate superior performance in digital markets, with evidence showing a 30% higher survival rate during market disruptions compared to regional counterparts [14]. The current literature reveals several critical gaps in understanding how Thai SMEs maintain long-term performance post-digital adoption, integrate sustainability practices, and adapt frameworks to the Thai business context. The interplay between business strategy, product innovation, and entrepreneurial orientation has become increasingly critical for Thai SMEs’ sustainable growth, supported by government initiatives such as the Digital SME Development Program and SME Go Digital measures [15,16]. This research addresses these gaps by investigating the following question: “What are the key determinants influencing the superior long-term business performance of digital SMEs in Thailand”? Through a mixed-method approach combining quantitative analysis of performance metrics and qualitative assessment of successful cases, this study aims to develop and validate a comprehensive framework integrating TOE factors with social media adoption, business strategy, product innovation, and entrepreneurial orientation for Thai digital SMEs, and to identify critical success factors that drive superior long-term business performance in Thailand’s digital business ecosystem. This research contributes to both theoretical understanding and practical applications, ultimately supporting the development of more resilient and successful digital businesses in Thailand’s evolving business landscape, where integrated approaches have been shown to deliver higher long-term performance outcomes compared to traditional approaches. The findings will benefit multiple stakeholders, including SME owners, policy makers, and business development agencies, ultimately contributing to the sustainable growth of Thailand’s digital economy.
2. Theoretical Framework
This research investigates the determinants of business performance in Thai digital SMEs by examining seven critical elements through an innovative Fuzzy Rough Set analysis approach. The study integrates the traditional Technology–Organization–Environment (TOE) framework with four additional factors: business strategy, product innovation, entrepreneurial orientation, and social media adoption. Through seven hypotheses, we propose that each element positively influences superior long-term business performance, as illustrated in our conceptual framework (Figure 1). This comprehensive model combines Zadeh’s Fuzzy Logic and Pawlak’s Rough Set Theory to provide a sophisticated understanding of the factors driving success in Thai digital SMEs, detailed as follows.
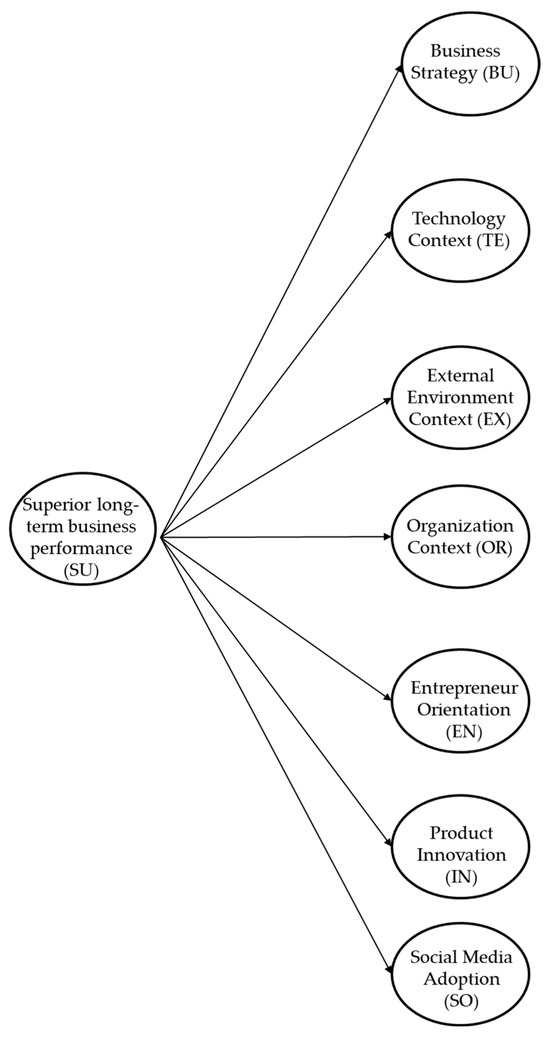
Figure 1.
Conceptual framework (Source: Author).
2.1. TOE
The technology–organization–environment (TOE) framework, introduced by Tornatzky and Fleischer in 1990 [17], explains organizational technology adoption through three key contexts: technological (internal tech capabilities and readiness), organizational (firm’s characteristics and resources), and environmental (external pressures, customer pressures, and external pressure). This comprehensive framework has proven to be valuable across various technological innovations, and it aligns well with social media adoption theories [18].
2.1.1. Technology Context (TE)
The technological context within the TOE framework encompasses both internal technological capabilities and infrastructure readiness that organizations must possess for successful technology adoption. This context specifically emphasizes the importance of skilled personnel and modern equipment as critical components for implementation. Organizations require both technical expertise in their workforce and up-to-date technological infrastructure to effectively adopt and implement new technologies [19]. Technological readiness includes the availability of skilled employees who can understand and utilize new technologies and appropriate technological tools and equipment that enable successful adoption processes [20]. Research has shown that organizations with strong internal technical expertise and modern infrastructure demonstrate higher success rates in technology adoption and implementation, particularly when they maintain current practices and equipment internal to the firm while remaining aware of available, external technologies [21].
2.1.2. Organization Context (OR)
The organizational context within the TOE framework emphasizes several critical internal factors that influence technology adoption. Organizations that maintain dedicated technology departments and demonstrate a clear technological vision show higher success rates in digital transformation initiatives [22]. These organizations typically emphasize continuous technological development through regular employee training programs and effective human resource planning [23]. The organizational culture plays a pivotal role, particularly when it promotes consistent technology usage and maintains open communication channels between management and employees. This cultural aspect, combined with strong leadership support and clear organizational vision, creates an environment conducive to successful technology implementation [24]. Furthermore, organizations that establish effective communication channels between employees and management, while maintaining a technology-oriented culture, demonstrate better adaptation to technological changes and higher levels of innovation adoption [25].
2.1.3. External Environment Context (EX)
The environmental context within the TOE framework emphasizes the competitive landscape and customer dynamics that organizations face in their market operations. In today’s rapidly evolving business environment, organizations experience increasing market competition and shifting customer demands. Companies face growing numbers of competitors who employ diverse strategies to attract customers through varied product and service offerings [26]. The competitive pressure intensifies as customers gain more purchasing options and leverage in negotiations, leading to higher bargaining power [27]. This shift in market dynamics requires organizations to continuously adapt their strategies and offerings to meet evolving customer preferences and demands [28]. Customer bargaining power has become particularly significant as buyers have access to more information and alternatives, enabling them to demand better value propositions and competitive pricing [29].
2.2. Business Strategy (BU)
Business strategy in modern organizations encompasses dual approaches of cost leadership and differentiation to maintain competitive advantage. Companies implement strategic pricing policies that enable them to offer products at lower prices than competitors while optimizing resource utilization for maximum efficiency and value creation [30]. Organizations achieve cost advantages through systematic reduction in operational expenses and efficient resource management, allowing them to maintain lower costs than competitors. Simultaneously, firms focus on building distinctive brand images and creating differentiated product offerings that stand out in the marketplace [31]. Companies enhance their competitive position by developing unique and innovative products or services, expanding their product portfolio beyond traditional offerings, and ensuring faster time-to-market compared to competitors [32].
2.3. Product Innovation (IN)
Product innovation involves a comprehensive approach to continuous development and improvement to maintain competitive advantage in the market. Organizations consistently develop new products and services to meet evolving customer needs while focusing on quality improvements that exceed competitor offerings [33]. Companies engage in ongoing research and design processes to bring innovative products to market, emphasizing both incremental improvements and radical innovations [34]. The innovation process includes continuous service process development and the adoption of modern equipment for production and service delivery [35]. This dual approach of market-driven development and technological advancement ensures that organizations can effectively respond to customer demands while maintaining operational excellence.
2.4. Entrepreneur Orientation (EN)
The entrepreneurial mindset represents a complex interplay of proactive innovation, strategic vision, and calculated risk-taking capabilities that drive business success. Entrepreneurs demonstrate leadership by identifying and pursuing new market opportunities before competitors, consistently seeking innovative approaches to establish market dominance [36]. They combine strong business expertise with ethical governance principles, ensuring high-quality service delivery while maintaining robust risk management strategies [37]. These leaders exhibit a balanced approach between pioneering new initiatives and strategic planning, often being first-to-market with innovative services despite uncertainties [38]. Their success stems from deep industry knowledge, continuous opportunity recognition, and an unwavering commitment to achieving market leadership through ethical business practices and quality-focused operations.
2.5. Social Media Adoption (SO)
Social media adoption has become a fundamental strategic imperative for modern business operations, transforming how organizations connect with and serve their customers [39]. Organizations leverage social platforms for rapid product promotion and marketing channel expansion, enabling them to reach broader audiences more effectively [40]. These digital platforms serve as powerful tools for enhancing customer engagement, facilitating improved customer relationships, and driving repeat purchase behavior. Through social media, businesses can develop personalized interactions, create meaningful customer experiences, and maintain ongoing relationships that foster customer loyalty [41]. The strategic use of various social platforms allows companies to establish a stronger market presence while simultaneously building and maintaining valuable customer relationships through consistent digital engagement.
2.6. Fuzzy Rough Set Theory
The integration of Fuzzy Set Theory and Rough Set Theory represents a powerful advancement in data analysis methodologies [42]. While Pawlak’s Rough Set Theory (1981) excels in handling imperfect data through set approximations and requires no preliminary information [43], Zadeh’s Fuzzy Logic (1965) manages imprecise information using partial truth values between 0 and 1 [44]. Their combination creates a more robust framework for dealing with real-world data complexity [45]. The hybrid Fuzzy–Rough Set approach leverages complementary strengths—Rough Set’s ability to work with inconsistent data and Fuzzy Logic’s capability to handle gradual transitions [46]. This synergistic combination enhances uncertainty handling, improves pattern recognition, and provides more sophisticated data analysis capabilities, particularly valuable in artificial intelligence, machine learning, and decision support systems where traditional single-theory approaches may fall short [47].
3. Research Methodology
This research employed a comprehensive mixed-methods approach to develop a new framework for superior long-term business performance of Thai digital SMEs. The research methodology framework, illustrated in Figure 2, is elaborated in detail below, The methodology proceeded in two distinct phases. In the first phase, this research utilized qualitative methods, beginning with an extensive literature review to identify potential factors, followed by the application of Rough Set Theory [48] and the Fuzzy Logic technique [49,50] to validate and refine these factors through expert opinions. This qualitative phase helped establish the initial theoretical framework, validate the constructs through expert consensus, and validate the questionnaire. This research was granted approval by the Ethics Review Board of Rangsit University (COA. NO. RSUERB2024-083). The second phase employed quantitative methods, starting with Exploratory Factor Analysis (EFA) [51] to identify the underlying factor structure of the constructs. Subsequently, Confirmatory Factor Analysis (CFA) [52] was conducted to validate each individual construct’s measurement model. The analysis then progressed to first-order CFA to examine the relationships between observed variables and their respective latent constructs, followed by second-order CFA to validate the hierarchical structure of the theoretical model. This systematic approach ensured both theoretical soundness through expert validation and statistical rigor through empirical testing, resulting in a comprehensive framework for understanding Thai digital SMEs’ long-term performance.
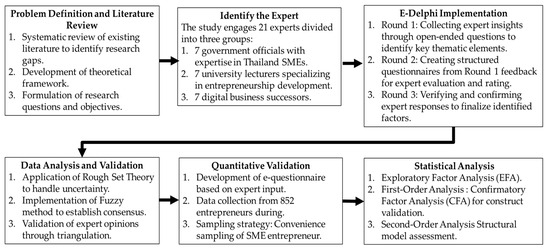
Figure 2.
Research methodology framework (Source: Author).
3.1. Qualitative Research
This research employed a qualitative methodological framework integrating the Rough Set and Fuzzy Logic techniques to examine expert consensus on factors driving superior long-term business performance. Following a comprehensive literature review, this study engaged 21 carefully selected experts representing three distinct domains of digital entrepreneurship expertise, government officials and university lecturers specializing in entrepreneurship development. Data collection proceeded through a structured electronic Delphi technique comprising three sequential rounds: initial open-ended inquiries, systematic variable extraction, and closed-ended confirmation questionnaires. The qualitative data gathered from this expert panel underwent rigorous analysis using an integrated Rough Set and Fuzzy Logic approach, enabling the synthesis and elucidation of consensus findings regarding critical success factors in digital entrepreneurship.
3.1.1. Population and Sampling
This study encompasses pertinent demographic groups and influences data analysis across multiple stakeholders. Following Macmillan’s (1971) theory [53], which states that a minimum of 17 experts in qualitative research yields a minimal error rate reduction, this study employed 21 experts to achieve an error rate of less than 0.02. The researcher stratified the participants into three distinct cohorts: Group 1 comprised 7 representatives from governmental institutions, Group 2 consisted of 7 digital entrepreneurs, and Group 3 included 7 university faculty members specializing in entrepreneurship development. The total sample size of 21 participants ensures statistical reliability while maintaining balanced representation across stakeholder groups.
3.1.2. Research Instruments
The researcher developed a comprehensive data collection instrument, an online questionnaire system that proceeded in two distinct phases. The first phase employed open-ended questions to identify and extract key thematic elements from expert insights. The second phase utilized a structured questionnaire with a 7-point Likert scale (1 = strongly disagree to 7 = strongly agree) [54] to enable experts to systematically evaluate and rate the identified factors the Step of the quantitative research present in Figure 3. This dual-phase approach facilitated both qualitative exploration and quantitative assessment of expert opinions while ensuring methodological rigor in the data collection process.

Figure 3.
Quantitative research step (Source: Author).
3.1.3. Data Collection
The data collection process utilized a systematic three-round electronic Delphi survey administered via email over a three-month timeframe spanning from June to August 2024. The structured iterative protocol employed sequential questionnaires, with each subsequent round building upon and refining the insights gathered from previous responses. This methodological approach ensured comprehensive expert input while maintaining analytical rigor throughout the survey administration, facilitating the progressive development and validation of expert consensus through a carefully designed framework that maximized the depth and quality of expert contributions.
3.1.4. Data Analysis
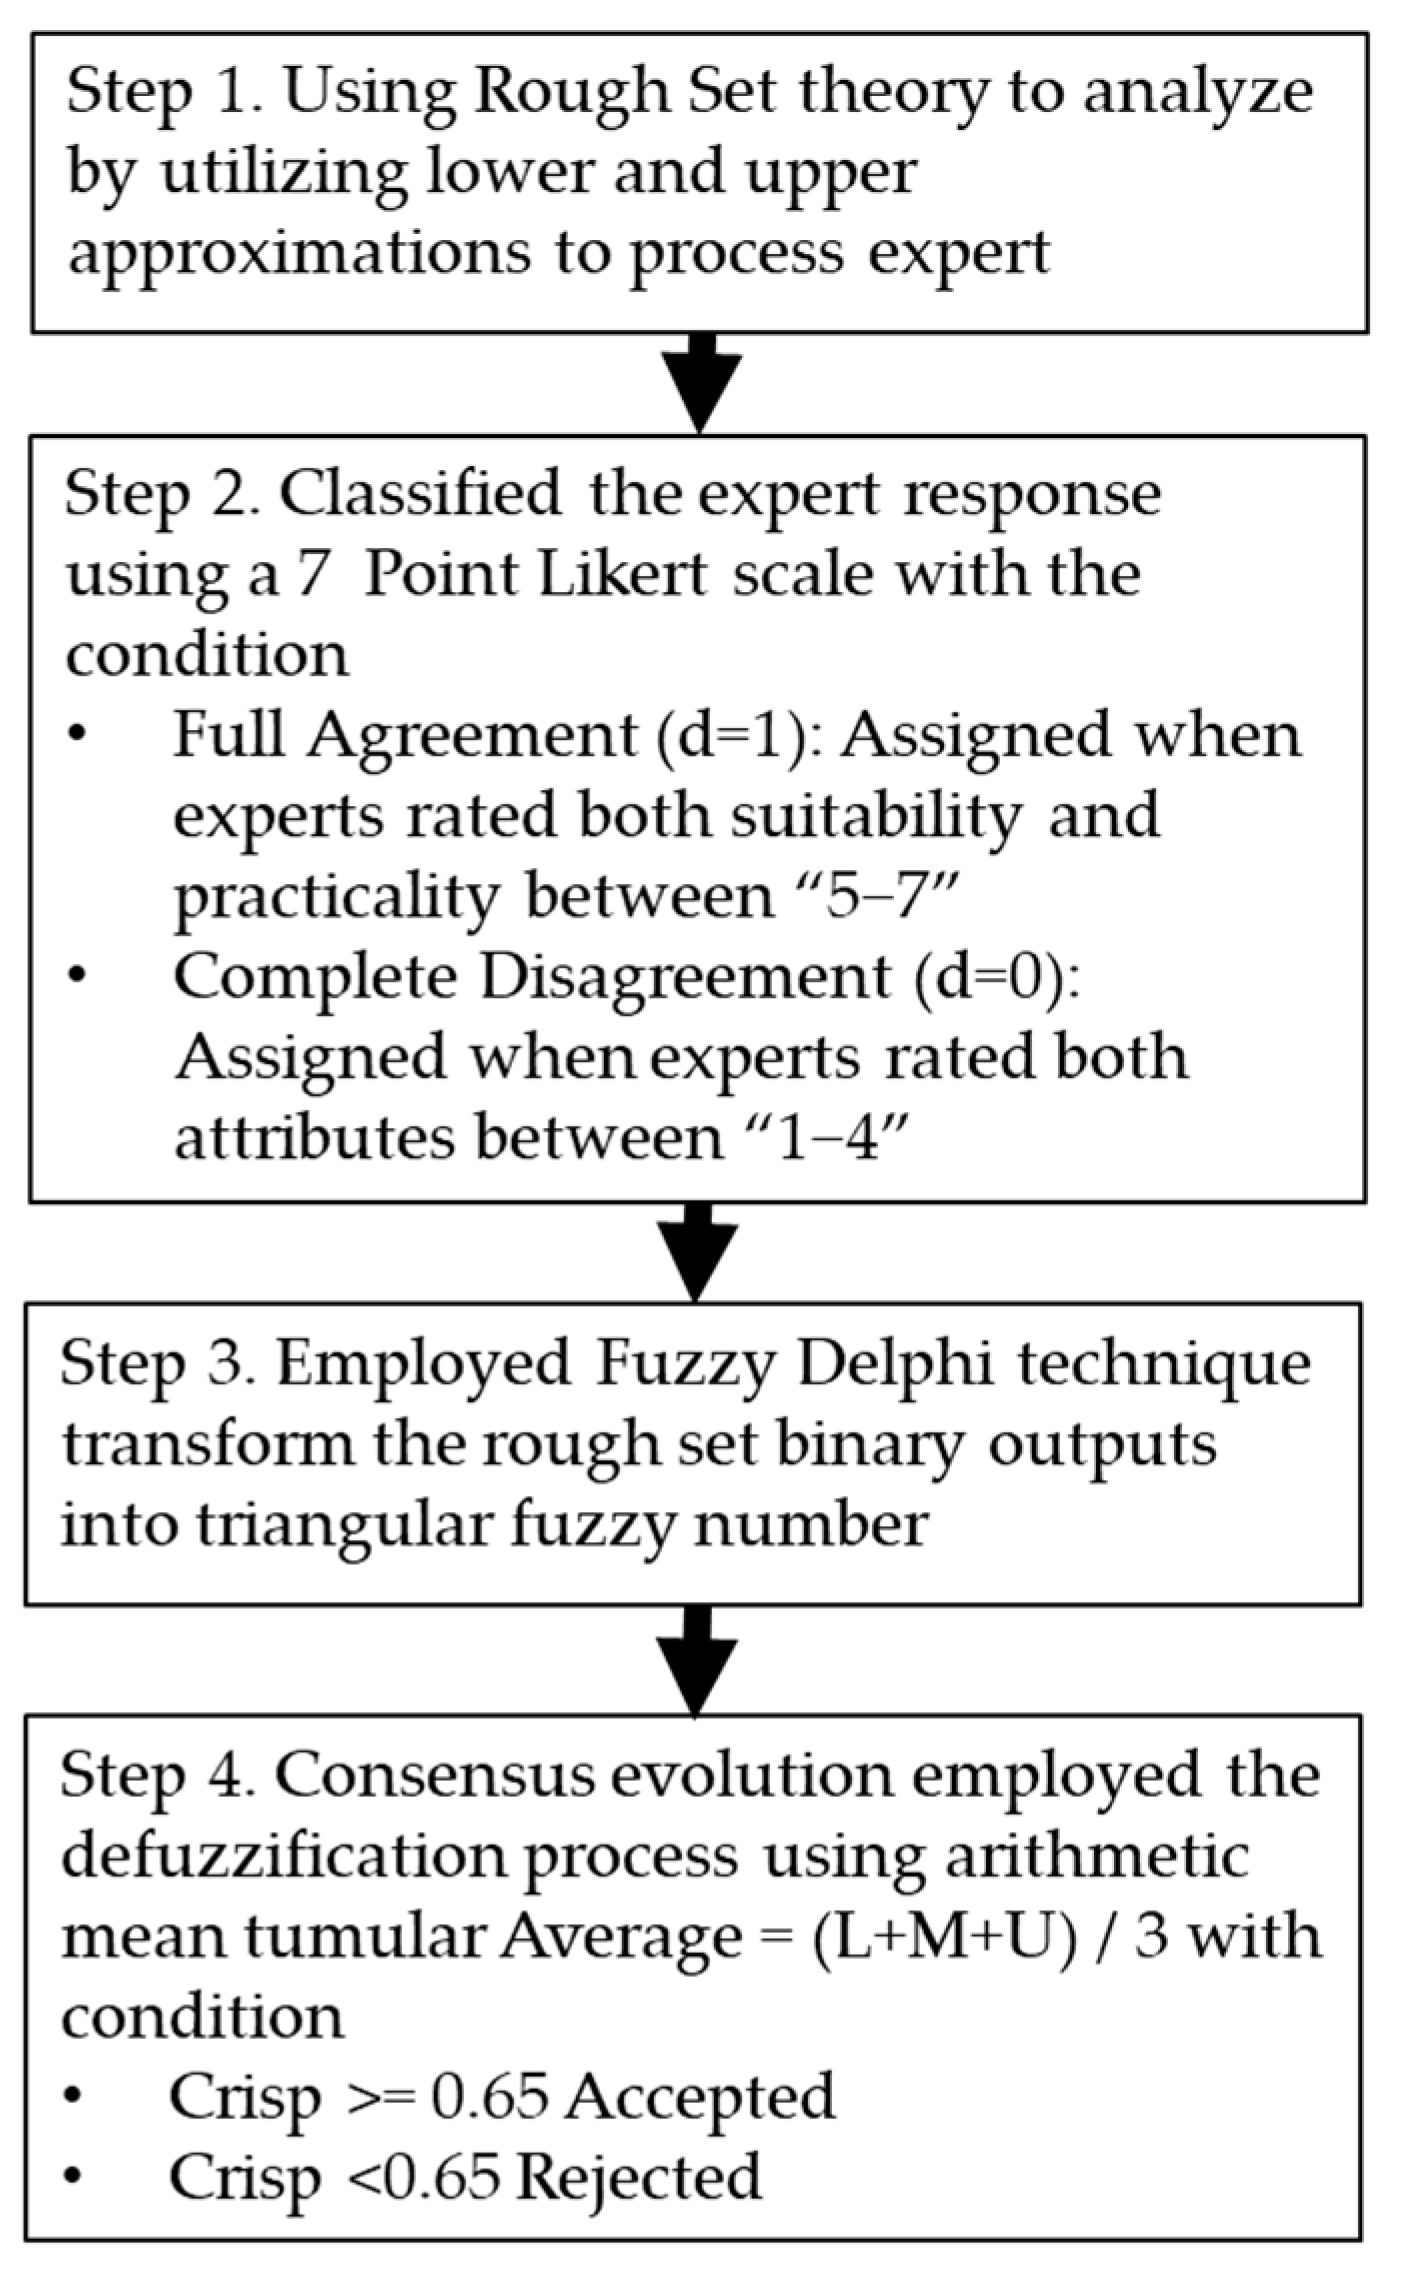
This research implemented a hybrid analytical methodology integrating Rough Set Theory and Fuzzy Logic techniques to evaluate expert consensus data. This innovative approach was designed to enhance the precision of expert opinion analysis while addressing the inherent uncertainty in decision-making processes. A 4-step analysis, as detailed below, was conducted to evaluate the expert consensus data. The integration of these complementary techniques enhanced the precision and reliability of expert opinion analysis.
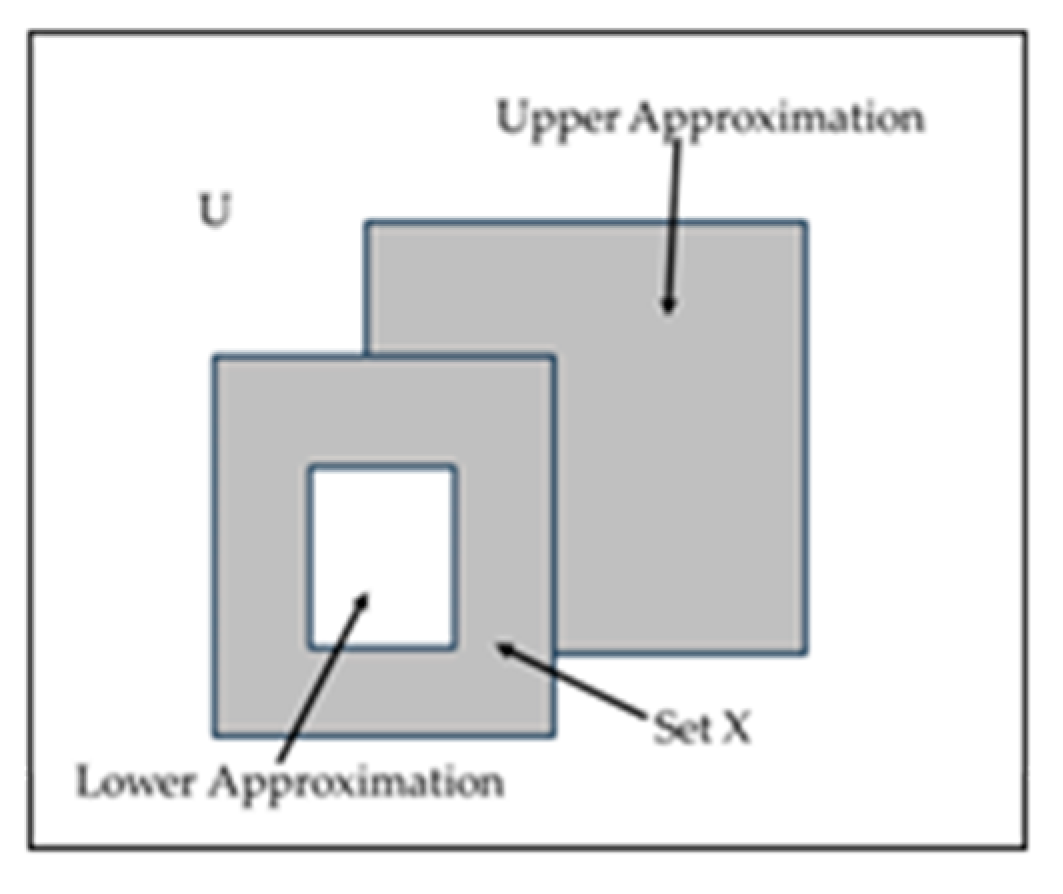
- Step 1. The analysis began with Rough Set Theory [55] the rough set theory conceptual farmwork shown in Figure 4 by implementation, utilizing boundary region concepts through the following:
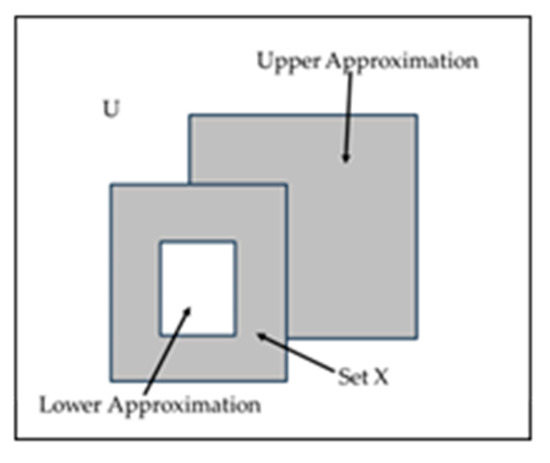 Figure 4. Rough Set Theory conceptual framework (Source: Author).
 - Lower Approximation = {x ∈ U: [x]R ⊆ X};
- Upper Approximation = {x ∈ U: [x]R ∩ X ≠ ∅}.
The decision-making process follows two distinct rules based on suitability and practicality attributes: full agreement (d = 1), when both attributes score 5–7, considered lower approximation, and complete disagreement (d = 0), when both score 1–4, considered upper approximation, to systematically process expert opinions with the rough set condition rule shown in Table 1. This mathematical framework provided a foundation for handling uncertainty in expert responses.

Table 1.
Rough Set condition rules (Source: Author).
- Step 2. Expert evaluations, collected through a 7-point Likert scale, were classified using binary decision rules.
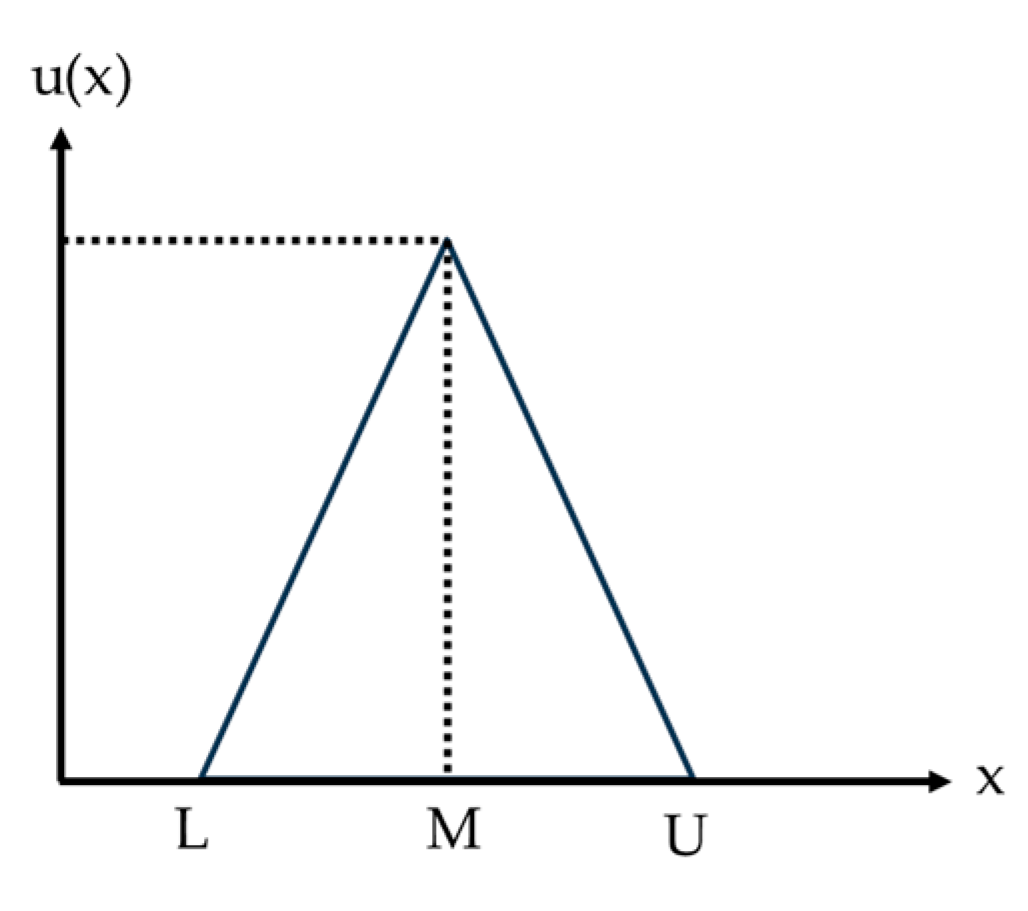
- Step 3. The secondary phase employed the Fuzzy Logic technique [56], which extends the traditional Delphi by incorporating Fuzzy Set Theory to handle the fuzziness in expert judgments by using a triangle of membership function, as shown and calculated below in Figure 5.
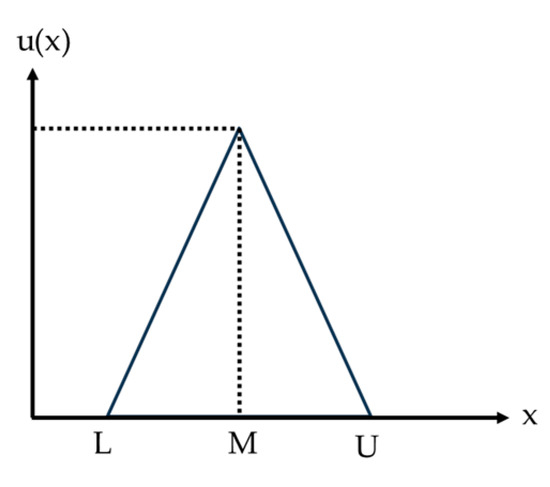 Figure 5. Triangular Fuzzy number membership function (Source: Author).
F = (L, M, U) L = the smallest numerical value of a member of Fuzzy; M = the largest numerical value of a member of Fuzzy; and U = Fuzzy’s greatest membership fee.
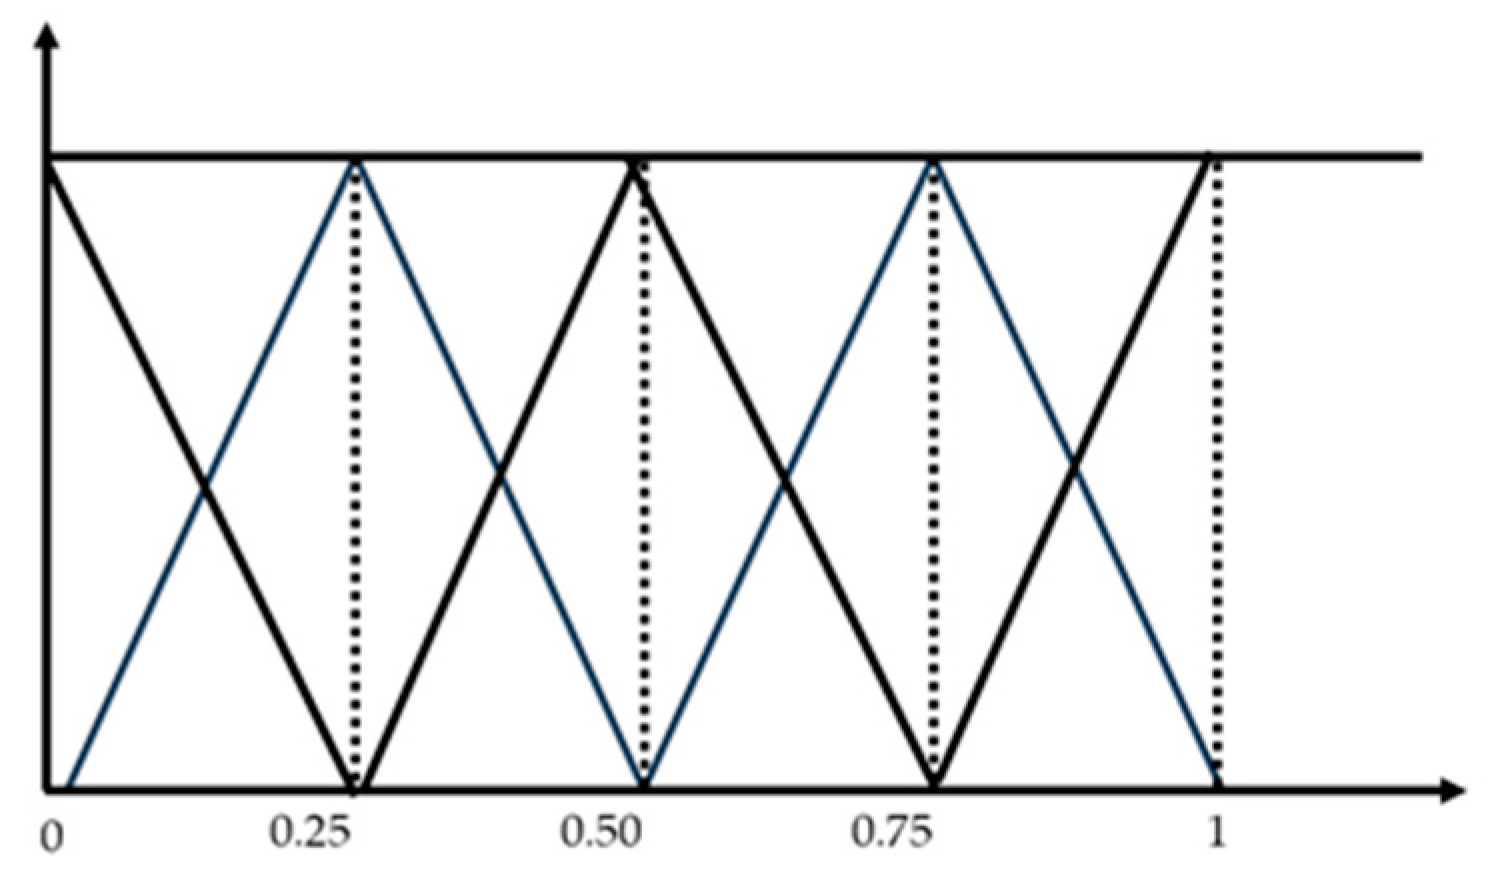
The process transformed the Rough Set binary outputs as Figure 6 into triangular Fuzzy numbers (TFN) using the following parameters in Table 2.
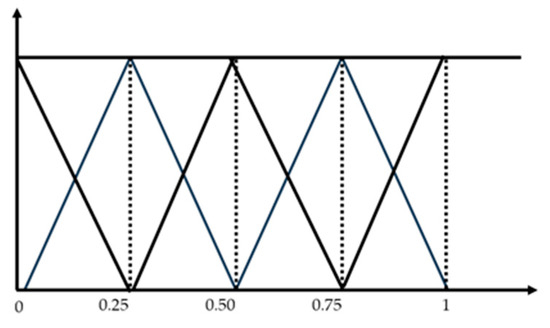
Figure 6.
Selection of factors in Fuzzy Theory (Source: Author).
Table 2.
Triangular Fuzzy number (TFN) parameters (Source: Author).
- Step 4. The final consensus evaluation employed a defuzzification process using the following arithmetic mean formula: Average = (L + M + U)/3, where L, M, and U represent the lower and upper bounds of the triangular fuzzy numbers, respectively. The threshold value was established at 0.65, with variables accepted when exceeding this threshold and rejected when falling below.
3.2. Quantitative Research
This research employed a quantitative methodology to develop and validate a comprehensive model of digital, superior long-term business performance, building upon the qualitative findings from expert consensus. This study transformed the previously identified 7 factors and 42 variables into a structured online questionnaire, which was administered to 852 digital entrepreneurs. Exploratory Factor Analysis (EFA) and Confirmatory Factor Analysis (CFA) were implemented to validate the construct validity, utilizing both first-order and second-order analyses to assess model fit indices. This rigorous analytical approach enabled the systematic evaluation and refinement of the theoretical framework, ensuring robust validation of the proposed model’s structural relationships and dimensional integrity within the context of digital entrepreneurship performance.
3.2.1. Population and Sampling
The study targeted Thailand’s SME population of approximately 3,225,743 enterprises (as of July 2024), focusing on online business operators. Following established statistical guidelines requiring 10–20 participants per observed variable and a minimum threshold of 200 participants for model validity, this study’s 42 observable variables necessitated a minimum sample size of 420 participants. The final dataset comprised 852 valid responses, exceeding the minimum requirement and ensuring robust statistical analysis for the causal relationship model examination (See Table 3).
Table 3.
Descriptive statistics of categorical and continuous demographic variables.
3.2.2. Research Instruments
The research instrument consisted of a structured online questionnaire developed from expert consensus findings, incorporating 7 validated factors with 42 variables. The measurement system employed a 7-point Likert scale where respondents rated their agreement level from 1 (Strongly Disagree) to 7 (Strongly Agree). This comprehensive measurement tool enabled systematic quantitative data collection while maintaining alignment with the established theoretical framework.
3.2.3. Data Collection
Data collection was executed through a comprehensive online questionnaire distributed across multiple channels, including IT events, social media platforms, and direct email outreach, during a three-month period from August to October 2024. This study employed a single screening criterion to verify participants’ status as digital business entrepreneurs of SMEs in Thailand, resulting in 852 valid and complete questionnaires that were retained for analysis after rigorous data validation. This sampling approach ensured a representative cross-section of Thailand’s digital entrepreneurship ecosystem, providing a robust foundation for subsequent statistical analysis.
3.2.4. Data Analysis
The data analysis process followed a comprehensive four-step methodology, beginning with Exploratory Factor Analysis (EFA) [57] that employed the Kaiser–Meyer–Olkin (KMO) measure requiring values exceeding 0.6 [58], followed by Confirmatory Factor Analysis (CFA) [59] to evaluate the measurement model fit. The CFA phase involved a systematic examination of individual constructs, progressing through first- and second-order factor analyses, while utilizing multiple fit indices for validation. These indices included CMIN/DF (≤3.0) [60], along with AGFI, GFI, NFI [61], CFI and TLI [62] (all requiring values greater than or equal to 0.9), RMSEA, and RMR (both needing to be less than or equal to 0.08) [63], as well as the statistical value factor loading (≥0.70) [64], CR (≥0.70) [65], AVE (≥0.50) [65], CA (≥0.70) [66], and R2 (≥0.20) [67] as the established acceptance criteria.
4. Results
This study analyzed qualitative data using Rough Set and Fuzzy Logic Theory to examine expert-provided information. The quantitative analysis employed Exploratory Factor Analysis (EFA) and Confirmatory Factor Analysis (CFA) to evaluate model fit. Subsequently, first-order and second-order factor analyses were conducted to assess the overall model’s goodness of fit. The results are presented below.
4.1. Qualitative Result
The validation process employed expert evaluation using CRIP (Composite Reliability Index for Panels) analysis, with a threshold value of 0.65 determining acceptability detail of Expert Consensus result shown in Table 4. All seven key dimensions received “Acceptable” ratings, demonstrating robust validation results. The technology context showed strong performance (0.726–0.750), particularly in modern technology adoption. The organization context exhibited similar strength (0.726–0.750), excelling in technology operations, vision implementation, and employee development. The external environment context maintained consistent levels at 0.679, while business strategy varied positively (0.679–0.750), notably in brand differentiation. Entrepreneur orientation demonstrated solid results (0.702–0.750), especially in vision and expertise. Product innovation showed steady scores (0.702–0.726), and social media adoption emerged as particularly strong with uniform scores of 0.750. All dimensions surpassed the minimum threshold of 0.65, thereby confirming the reliability of the research findings.
Table 4.
Expert consensus results (Source: Author).
4.2. Quantitative Results
In addition to the quantitative analysis, the researchers conducted both Exploratory Factor Analysis (EFA) and Confirmatory Factor Analysis (CFA) to evaluate the model’s fit. The analysis incorporated both first-order and second-order factor structures. The detailed findings are presented below.
4.2.1. Exploratory Factor Analysis (EFA) Results
The Exploratory Factor Analysis (EFA) was applied to examine internal reliability and discover the factor structure, ultimately helping the researchers create a more robust measurement instrument and establish stronger evidence for construct validity before conducting the CFA. The analysis utilized the Kaiser–Meyer–Olkin (KMO) measure of sampling adequacy, where the recommended threshold exceeds 0.60. The results yielded a KMO value of 0.985, meeting the measurement criteria. Additionally, Bartlett’s Test of Sphericity was significant (χ2 = 25,937.663, df = 1081, p < 0.001), confirming the appropriateness of factor analysis, as shown in Table 5 KMO and Bartlett’s Test with result accepted and Table 9 also provides the EFA outcomes, indicating that individual item loadings were greater than 0.5, with all values falling within acceptable ranges and all items loaded appropriately on their respective factors.
Table 5.
KMO and Bartlett’s Test (Source: Author).
4.2.2. CFA Test Result for Each Contract
Confirmatory Factor Analysis (CFA) was conducted on each construct as a preliminary step before testing the higher-order model, aiming to validate the consistency of observed variables with their intended constructs and ensure alignment with theoretical frameworks. The analysis revealed that all factor loadings surpassed the recommended 0.7 threshold, with model fit indices meeting established criteria. The CFA results shown in Table 6 demonstrated exceptional model fit across all constructs, with indices consistently exceeding recommended thresholds—CMIN/DF (2.08–2.94, threshold ≤ 3), AGFI (0.96–0.99, threshold ≥ 0.9), and optimal scores of 0.99 for GFI, CFI, NFI, and TLI (threshold ≥0.9). Additionally, RMSEA (0.04–0.05) and RMR values (0.01–0.03) remained well below the acceptable threshold of 0.08. These comprehensive results confirmed strong construct validity and excellent model fit for all seven constructs in the research framework: business strategy (BU), technology context (TE), organization context (OR), external Environment context (EX), entrepreneur orientation (EN), product innovation (IN), and social media adoption (SO), leading to the acceptance of all constructs.
Table 6.
CFA index result for each construct.
4.2.3. First-Order Confirmatory Factor Analysis
The First-order Confirmatory Factor Analysis (CFA) was conducted as a crucial prerequisite step before proceeding with second-order testing, validating the measurement model’s fundamental structure and ensuring that the measured variables accurately represented their intended constructs. The analysis shown in Table 7 revealed significant factor loadings exceeding the 0.7 threshold, demonstrating good construct validity and reliability. The results showed excellent model fit across all indices, with strong absolute fit measures including CMIN/DF = 1.60 (threshold ≤ 3), GFI and AGFI both at 0.93 (threshold ≥ 0.9), RMSEA = 0.03, and RMR = 0.02 (both threshold ≤ 0.08), while incremental fit indices demonstrated superior fit with CFI = 0.98, NFI = 0.94, and TLI = 0.98 (all exceeding threshold ≥ 0.9) as shown in Figure 7. These comprehensive results not only met but exceeded their respective criteria, confirming that the lower-level factors were properly specified and providing a solid foundation for subsequent second-order testing while maintaining theoretical integrity and avoiding potential violations of regression assumptions.
Table 7.
Fit index of First-order Confirmatory Factor Analysis.
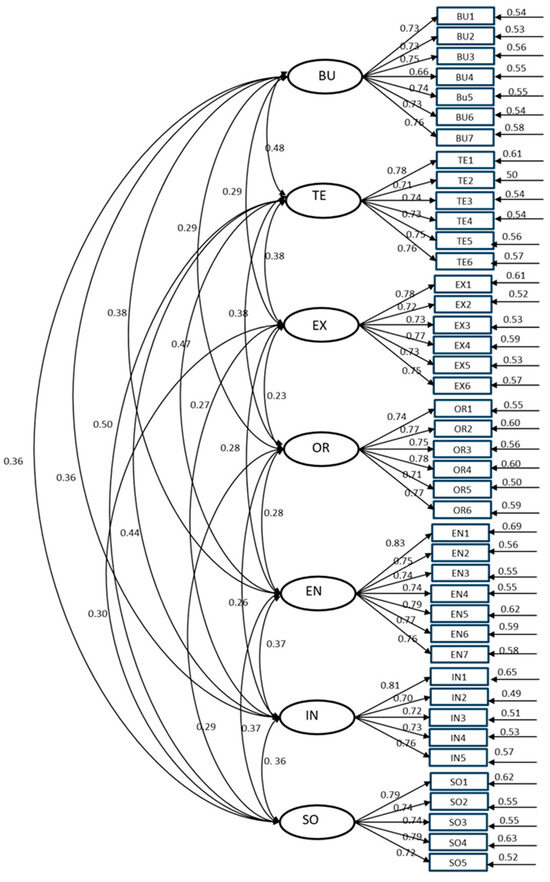
Figure 7.
First-order Confirmatory Factor Analysis (Source: Author).
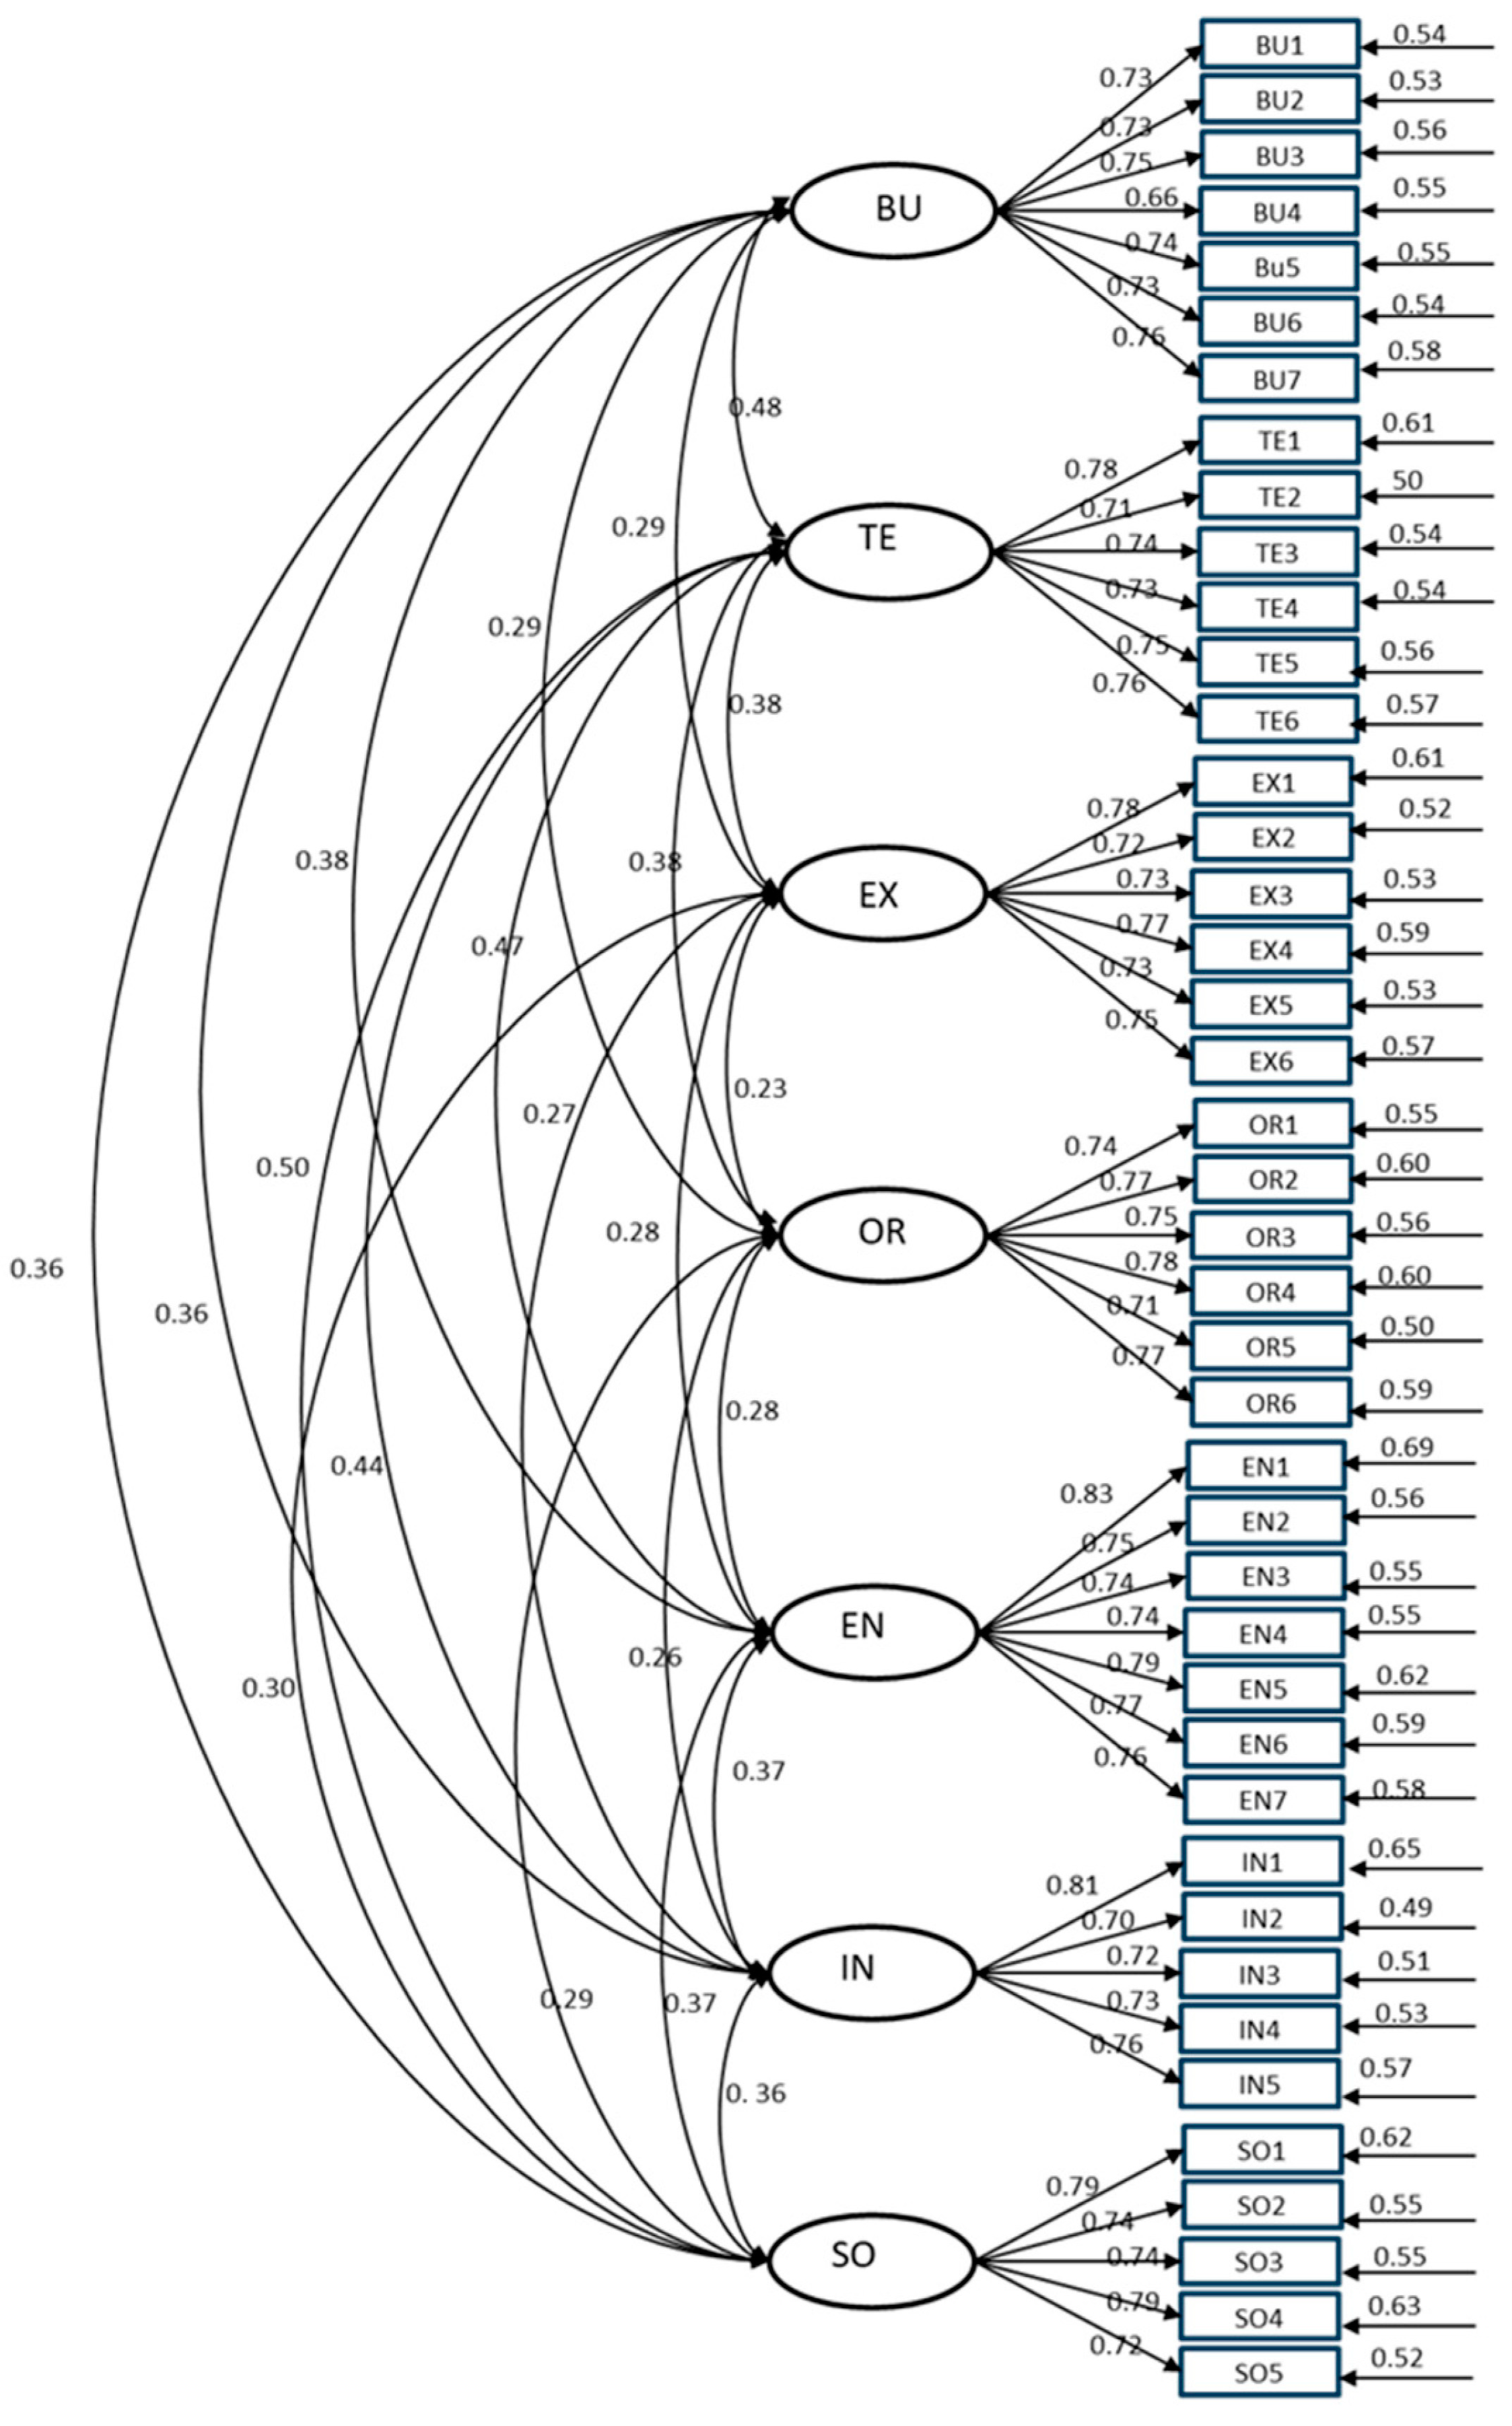
4.2.4. Second-Order Confirmatory Factor Analysis
Second-order Confirmatory Factor Analysis plays a vital role in research by simplifying complex data structures, particularly in this research, which comprises seven constructs. The analytical results shown in Table 8 from the Second-order Confirmatory Factor Analysis revealed strong model fit indices, demonstrating the validity of the hierarchical structure. The analysis yielded satisfactory results with CMIN/DF = 1.60, well below the acceptable threshold of 3. The model demonstrated excellent fit with GFI = 0.93, CFI = 0.98, and NFI = 0.94, all meeting or exceeding the recommended cutoff value of 0.90. The TLI value of 0.98 further supports the model’s robustness. Additionally, RMSEA = 0.03 and RMR = 0.02 indicate excellent model fit, as they are well below the 0.08 threshold as shown in Figure 8. The model fit results not only improve theoretical models by creating more nuanced frameworks but also enable researchers to account for both specific and general patterns in the data, ultimately leading to more accurate and meaningful conclusions.
Table 8.
Fit index of Second-order Confirmatory Factor Analysis.
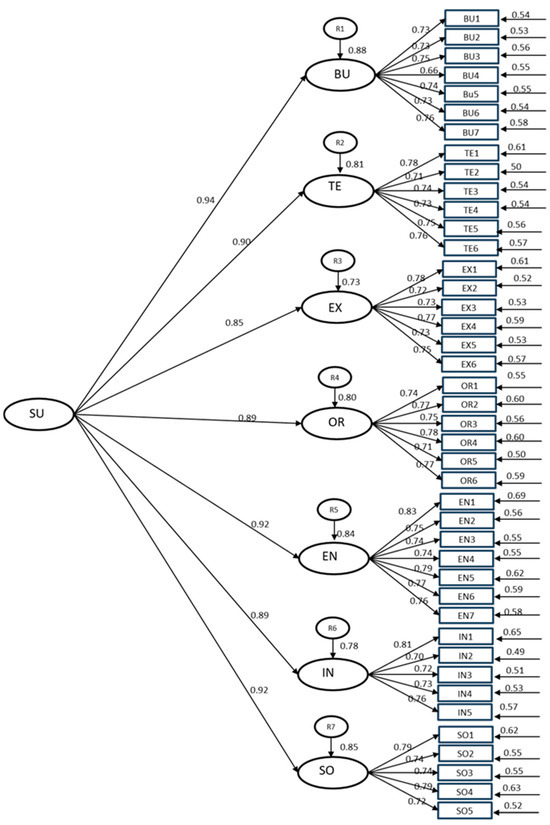
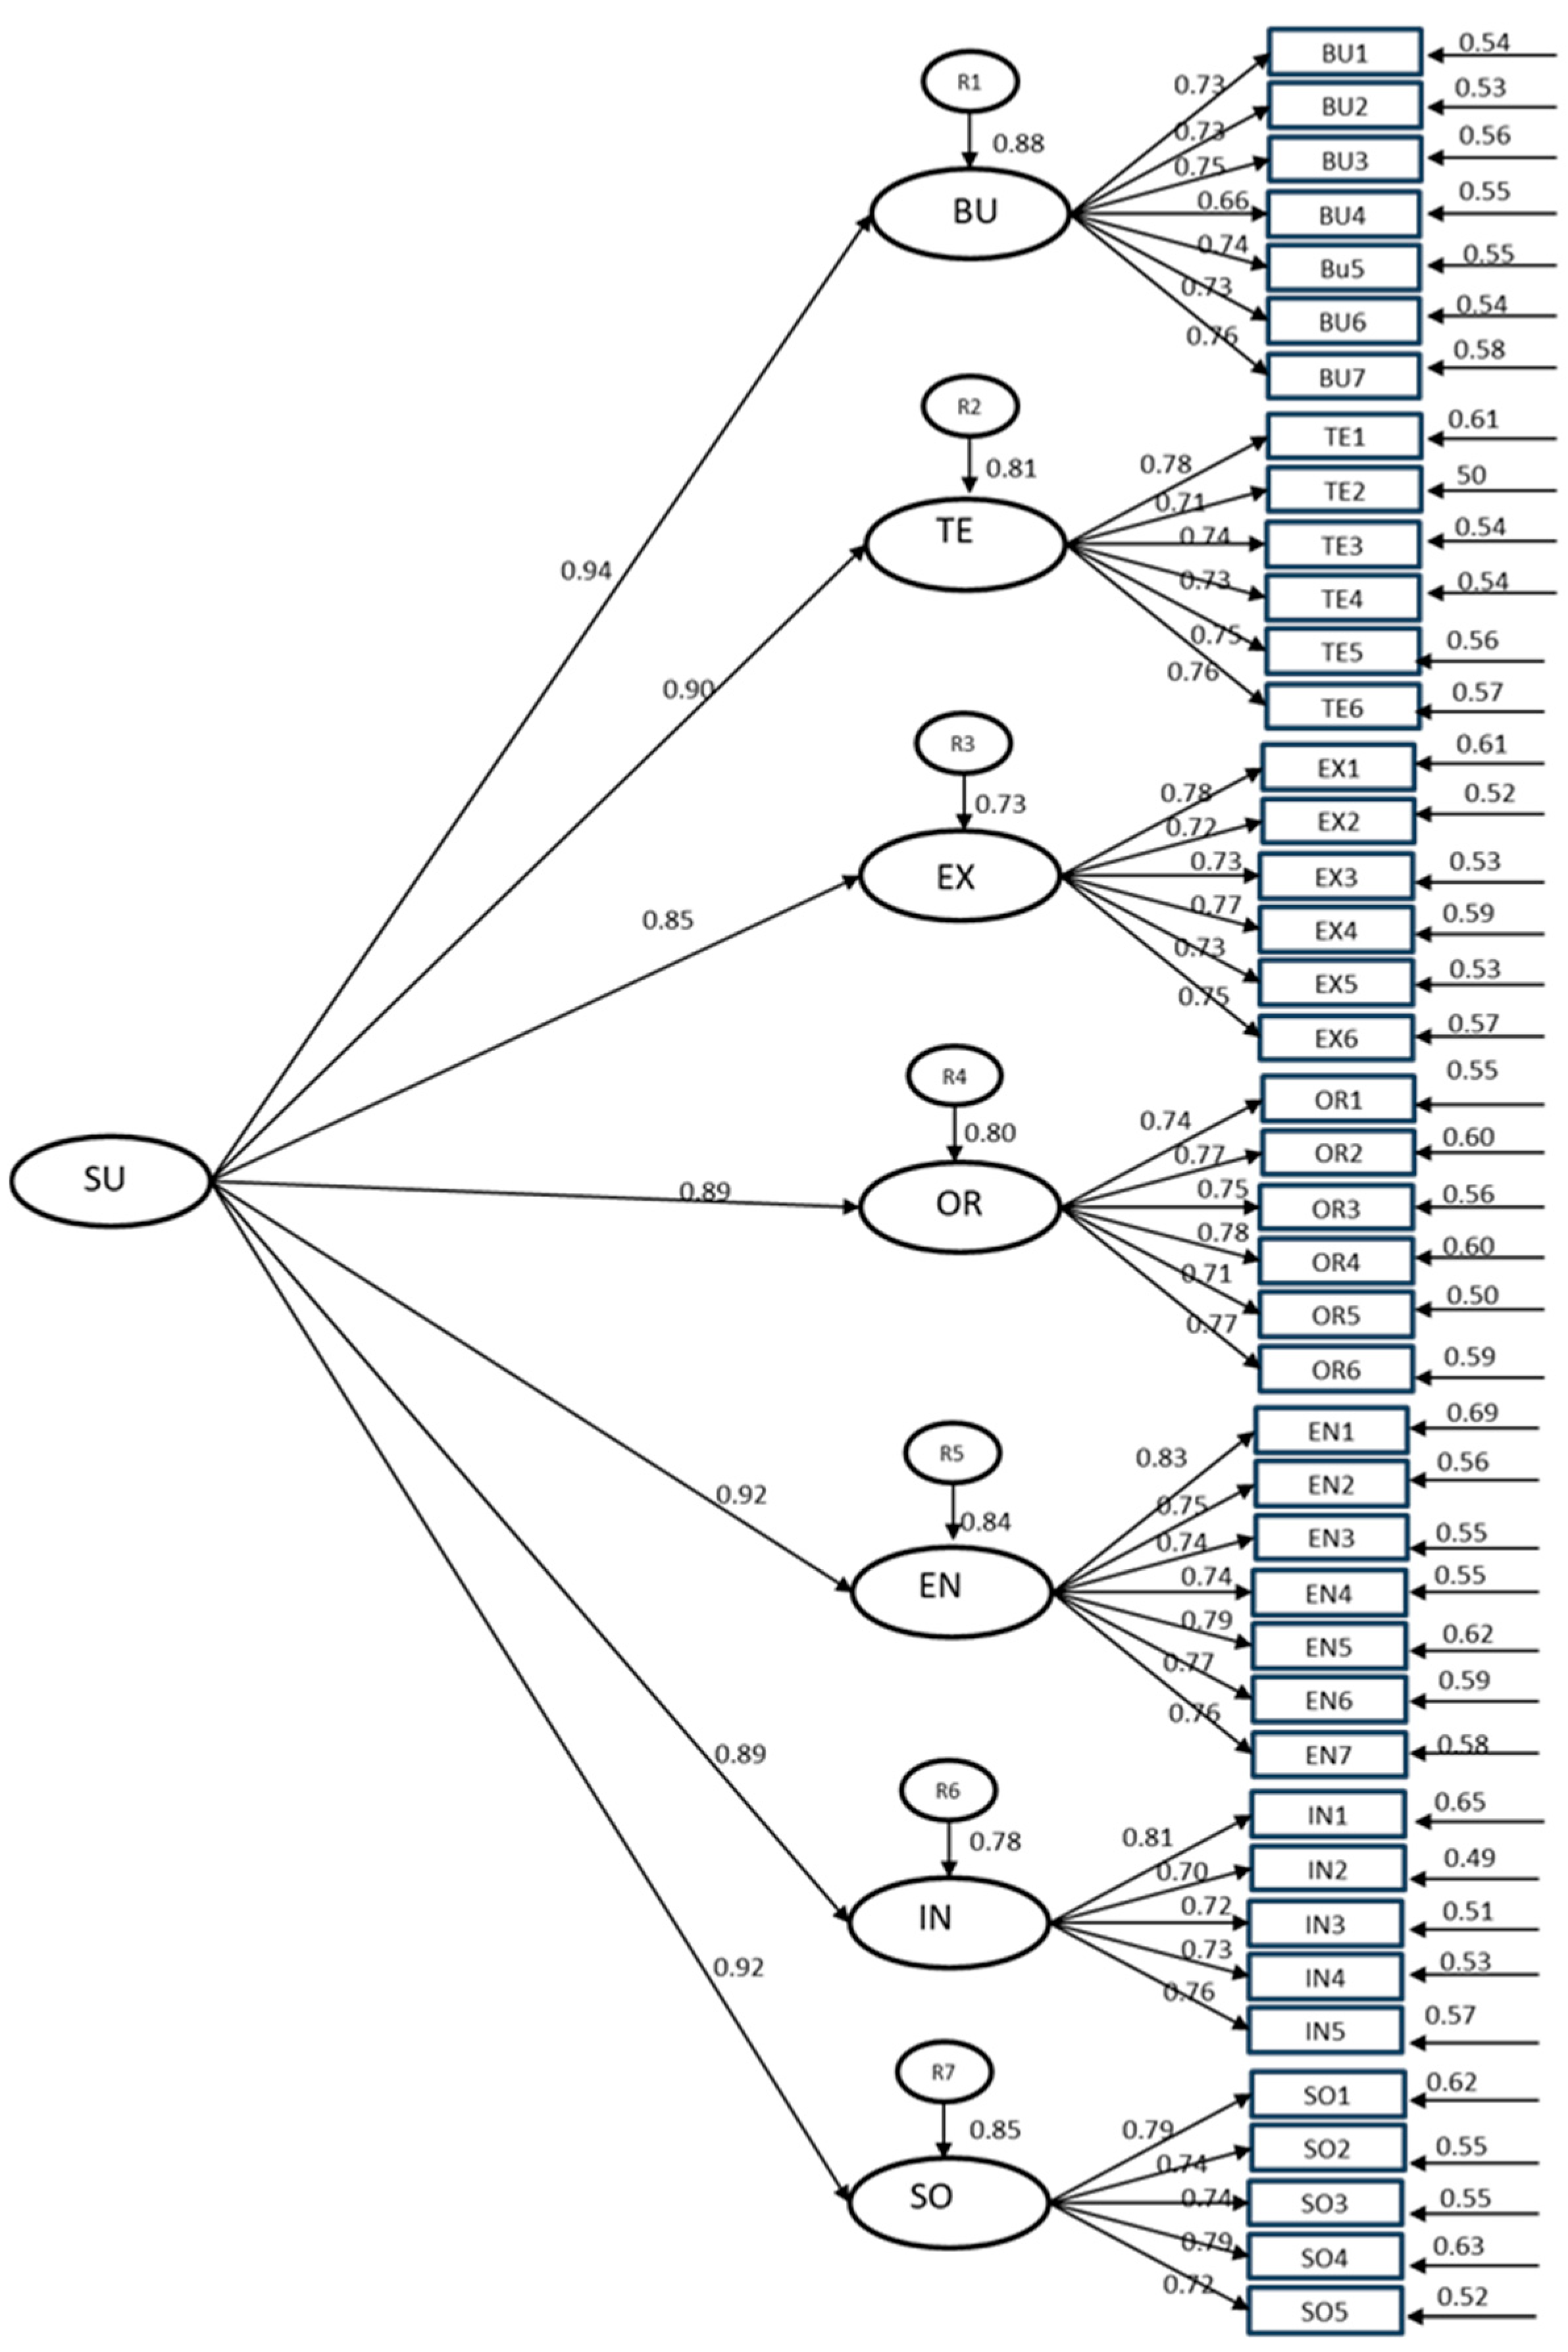
Figure 8.
Second-order Confirmatory Factor Analysis (Source: Author).
The structural equation modeling analysis revealed that the Second-order Confirmatory Factor Analysis demonstrated excellent model fit indices, as shown in Table 9, with all results meeting acceptable criteria. The measurement model reported strong construct reliability with CR values (0.86 to 0.91) exceeding 0.7 and AVE values (0.55 to 0.59) above 0.5. Factor loadings across all seven factors exceeded 0.7, with business strategy (0.94), entrepreneur orientation (0.92), and social media adoption (0.92) demonstrating the strongest loadings for this model. The model exhibited strong explanatory power through R-squared values ranged from 0.73 to 0.88, with business strategy showing the highest value at 0.88 and entrepreneur factor at 0.84, indicating high explained variance. The Standard Error (S.E.) values were consistently low, ranging from 0.03 to 0.05, indicating high precision in the parameter estimates. The statistical significance of all relationships was confirmed (p < 0.001), with Critical Ratio (C.R.) values well above 1.96, collectively establishing strong construct validity and reliability of the measurement model. Additionally, all constructs exceeded the threshold for Cronbach’s alpha (>0.7). The residual measures (RMSEA = 0.03, RMR = 0.02) indicated minimal discrepancy between observed and model-implied matrices, further confirming the model’s excellent fit. These comprehensive results validate the measurement model’s reliability and validity for examining social media adoption factors among Thai digital SMEs.
Table 9.
Statistical value of Second-order and EFA outcomes.
Table 9.
Statistical value of Second-order and EFA outcomes.
| NO. | Factor Landing | EFA | S.E. | C.R. | p | CR | AVE | CA | R2 |
|---|---|---|---|---|---|---|---|---|---|
| Business strategy (BU) | 0.94 | 0.90 | 0.55 | 0.90 | 0.88 | ||||
| BU1 | 0.73 | 0.61 | |||||||
| BU2 | 0.73 | 0.56 | 0.05 | 21.07 | *** | ||||
| BU3 | 0.75 | 0.58 | 0.05 | 21.75 | *** | ||||
| BU4 | 0.74 | 0.61 | 0.05 | 21.54 | *** | ||||
| BU5 | 0.74 | 0.56 | 0.05 | 21.58 | *** | ||||
| BU6 | 0.73 | 0.57 | 0.05 | 21.24 | *** | ||||
| BU7 | 0.76 | 0.55 | 0.05 | 22.14 | *** | ||||
| Technology Context (TE) | 0.90 | 0.88 | 0.55 | 0.88 | 0.81 | ||||
| TE1 | 0.78 | 0.67 | |||||||
| TE2 | 0.71 | 0.69 | 0.03 | 23.81 | *** | ||||
| TE3 | 0.74 | 0.59 | 0.04 | 25.30 | *** | ||||
| TE4 | 0.73 | 0.57 | 0.04 | 25.03 | *** | ||||
| TE5 | 0.75 | 0.58 | 0.04 | 25.89 | *** | ||||
| TE6 | 0.76 | 0.59 | |||||||
| Organization Context (OR) | 0.89 | 0.89 | 0.57 | 0.89 | 0.80 | ||||
| OR1 | 0.74 | 0.66 | |||||||
| OR2 | 0.77 | 0.64 | 0.04 | 22.62 | *** | ||||
| OR3 | 0.75 | 0.61 | 0.05 | 21.88 | *** | ||||
| OR4 | 0.78 | 0.59 | 0.04 | 22.75 | *** | ||||
| OR5 | 0.71 | 0.63 | 0.05 | 20.63 | *** | ||||
| OR6 | 0.77 | 0.66 | 0.05 | 22.42 | *** | ||||
| External Environment Context (EX) | 0.86 | 0.88 | 0.56 | 0.88 | 0.73 | ||||
| EX1 | 0.78 | 0.71 | |||||||
| EX2 | 0.72 | 0.69 | 0.04 | 24.45 | *** | ||||
| EX3 | 0.73 | 0.59 | 0.04 | 24.69 | *** | ||||
| EX4 | 0.77 | 0.63 | 0.04 | 26.67 | *** | ||||
| EX5 | 0.73 | 0.63 | 0.04 | 24.74 | *** | ||||
| EX6 | 0.75 | 0.69 | |||||||
| Entrepreneur Orientation (EN) | 0.92 | 0.91 | 0.59 | 0.91 | 0.84 | ||||
| EN1 | 0.83 | 0.58 | |||||||
| EN2 | 0.75 | 0.63 | 0.03 | 24.91 | *** | ||||
| EN3 | 0.74 | 0.67 | 0.04 | 24.79 | *** | ||||
| EN4 | 0.74 | 0.66 | 0.03 | 24.72 | *** | ||||
| EN5 | 0.79 | 0.60 | 0.03 | 27.06 | *** | ||||
| EN6 | 0.77 | 0.58 | 0.03 | 25.90 | *** | ||||
| EN7 | 0.76 | 0.60 | 0.04 | 25.76 | *** | ||||
| Product Innovation (IN) | 0.89 | 0.86 | 0.55 | 0.86 | 0.78 | ||||
| IN1 | 0.81 | 0.61 | 0.04 | 23.79 | *** | ||||
| IN2 | 0.70 | 0.69 | 0.04 | 20.33 | *** | ||||
| IN3 | 0.72 | 0.68 | 0.04 | 20.92 | *** | ||||
| IN4 | 0.73 | 0.60 | 0.04 | 21.21 | *** | ||||
| IN5 | 0.76 | 0.59 | |||||||
| Social Media Adoption (SO) | 0.92 | 0.87 | 0.58 | 870.00 | 0.84 | ||||
| SO1 | 0.79 | 0.60 | |||||||
| SO2 | 0.74 | 0.60 | 0.04 | 23.01 | *** | ||||
| SO3 | 0.74 | 0.61 | 0.04 | 23.01 | *** | ||||
| SO4 | 0.79 | 0.58 | 0.04 | 24.87 | *** | ||||
| SO5 | 0.72 | 0.54 | 0.04 | 22.27 | *** |
statistically significant *** = p < 0.001.
5. Discussion
This research successfully developed a comprehensive framework for digital entrepreneurship in Thailand through an innovative mixed-methods approach that combined qualitative expert insights with quantitative validation. The methodological integration proved particularly effective in establishing a robust understanding of the factors driving superior long-term business performance.
The measurement model demonstrated excellent psychometric properties, with factor loadings consistently above 0.70 across all constructs. This robust factor structure aligns with similar findings by Chatterjee and Kar [68] in their study of social media adoption in emerging economies and Abdullah and Ampauleng [69] in social media usage on MSME’s performance. The model’s exceptional fit indices (CFI = 0.98, TLI = 0.98, RMSEA = 0.03) surpass those reported in comparable studies, such as the study by Ahmad et al. [70], who found similar but slightly lower fit values in their investigation of SME digital transformation.
The business strategy construct showed the highest explained variance (R2 = 0.88) and strong reliability (CR = 0.90), suggesting its crucial role in social media adoption. This finding reinforces conclusions from Palladan et al. [71] and Qalati et al. [72], who identified strategic alignment as a key determinant of successful social media implementation in SMEs. The high factor loadings (0.73–0.76) for business strategy items indicate that SMEs are increasingly viewing social media as a strategic tool rather than merely a communication channel.
The technology factor (CR = 0.86) and organization factor (CR = 0.89) demonstrated strong reliability, supporting the Technology–Organization–Environment (TOE) framework’s applicability. These results parallel findings by Cvjetković [73], who reported similar construct validities in their study of digital technology adoption among Asian SMEs. The high convergent validity suggests that both technological readiness and organizational capacity are fundamental to successful social media adoption.
The external environment factor (AVE = 0.56) and entrepreneur factor (AVE = 0.59) showed significant influence on social media adoption, consistent with research by Scholtz et al. [74,75]. The entrepreneur’s role, in particular, emerged as a critical factor with the highest reliability (CR = 0.91), supporting previous findings about the importance of leadership in technology adoption decisions.
The innovation factor’s strong relationship with social media adoption (factor loadings 0.70–0.76) suggests that innovative capacity significantly influences social media implementation. This finding aligns with recent work by Kamboj [76], and Gun [77], who found similar correlations between innovation capability and digital platform adoption in SMEs.
These findings contribute to the growing body of literature on social media adoption in SMEs by validating previously identified factors while providing new insights into their relative importance and interrelationships in the current digital business environment. For practical implementation, Thai SMEs can leverage these research findings through several actionable approaches. First, businesses should integrate social media strategies into their overall business planning by setting clear objectives and KPIs aligned with their business goals (business strategy, R2 = 0.88). Second, organizations need to assess and enhance their technological readiness (technology factor, CR = 0.86) through systematic infrastructure development and staff training programs. Leadership teams should actively promote digital transformation (entrepreneur factor, CR = 0.91) by cultivating a digital-first mindset and allocating appropriate resources. Additionally, establishing innovation teams and regular workshops can strengthen innovative capabilities (innovation factor, 0.70–0.76), while building strategic partnerships with technology providers can support successful implementation. These practical steps can help Thai SMEs effectively translate the theoretical frameworks into tangible business outcomes in their digital transformation journey.
6. Conclusions
This research advances our understanding of social media adoption in Thai digital SMEs through a novel integrated framework that extends beyond the traditional TOE model. This study employed a robust dual-methodology approach combining Rough Set and Fuzzy Theory with Confirmatory Factor Analysis, which validates the integration of business strategy, entrepreneurial orientation, and innovation factors with the TOE framework. The structural model demonstrated strong relationships between all constructs, with business strategy and entrepreneurial factors showing particularly strong influence on social media adoption outcomes. The findings reveal that successful digital transformation requires a holistic approach that considers strategic alignment, entrepreneurial capabilities, and innovative capacity alongside technological factors. This comprehensive approach not only provides valuable insights for practitioners but also establishes a more robust theoretical foundation for understanding social media adoption in SMEs. By incorporating these additional dimensions into the traditional TOE framework, this study contributes to both theory and practice by offering a more complete understanding of the factors that drive successful social media adoption and implementation in the context of Thai digital SMEs.
Limitations and Suggestions
This study acknowledges several methodological limitations that warrant consideration. The research sample was predominantly composed of small enterprises (44% with revenue less than 50 M Baht) using quota sampling, which may limit the generalizability of findings to larger SMEs. Additionally, the research scope was confined to non-manufacturing sectors, excluding potential insights from manufacturing industries that might be significantly impacted by digital transformation. The strategic framework analysis was narrowly focused on cost leadership and differentiation strategies, while the external environment assessment was constrained to customer and competitor factors, omitting other critical environmental elements such as technological changes, regulatory environments, and economic conditions. The cross-sectional nature of this research provided only a snapshot view rather than capturing long-term strategic impacts. To address these limitations, future research should aim to achieve the following: (1) expand the investigation to larger SMEs and manufacturing industries, (2) incorporate additional strategic frameworks, (3) broaden the external environment analysis, (4) implement mixed-methods approaches combining quantitative and qualitative insights, and (5) conduct longitudinal studies to track strategy implementation and its long-term performance impacts. These research directions would enhance our understanding of how firm size and industry context influence digital transformation outcomes in the evolving business landscape.
Author Contributions
Conceptualization, T.P. and S.P.; methodology, T.P. and S.P.; software, T.P.; validation, T.P. and S.P.; formal analysis, T.P. and S.P.; investigation, T.P. and S.P.; resources, T.P.; data curation, T.P.; writing—original draft preparation, T.P.; writing—review and editing, T.P. and S.P.; visualization, T.P.; supervision, S.P. All authors have read and agreed to the published version of the manuscript.
Funding
This research received no external funding.
Institutional Review Board Statement
This study was conducted in accordance with the Declaration of Helsinki, The Belmont Report, CIOMS Guidelines, and International Conference on Harmonization in Good Clinical Practice. Ethical review and approval were granted by the Ethics Review Board of Rangsit University (Certification Number: COA.No. RSUERB2024-083).
Informed Consent Statement
Informed consent was obtained from all subjects involved in the study.
Data Availability Statement
All original research contributions presented in this study are fully documented within the main article. For additional information or clarification, please contact the corresponding author(s).
Conflicts of Interest
The authors declare no conflicts of interest.
Abbreviations
The following abbreviations are used in this manuscript:
| TE | Technology context |
| BU | Business strategy |
| OR | Organization context |
| EX | External environments context |
| EN | Entrepreneur orientation |
| IN | Product innovation |
| SO | Social media adoption |
| TOE | Technology–Organization–Environment |
References
- Tran, H.T.; Le, Q.B. Survival Challenges and Performance of Small and Medium Enterprises: A Global Perspective. J. Risk Financ. Manag. 2024, 17, 12. [Google Scholar]
- International Trade Centre. SME Competitiveness Outlook 2023: Small Businesses in Fragility: From Survival to Growth; International Trade Centre: Geneva, Switzerland, 2023. [Google Scholar]
- European Commission. New 2024 SME Performance Review: SMEs Driving Job Creation Despite High Inflation; European Commission Single Market Economy News; European Commission: Brussels, Belgium, 2024. [Google Scholar]
- Nithisathian, K.; Rattanawicha, P. How Could Digital Transformation Help Medium-Sized Enterprises Access Thailand’s New Capital Market Financing (LiVEx) to Support Sustainable Growth in the Digital Economy Era? Sustainability 2024, 16, 3470. [Google Scholar] [CrossRef]
- Vongurai, R. Factors affecting digital transformation of small and medium enterprises: A case study of Thailand. J. Asian Finance. Econ. Bus. 2021, 8, 143–153. [Google Scholar]
- Ha, H.; Chuah, C.K.P. Digital economy in Southeast Asia: Challenges, opportunities and future development. South East Asian J. Manag. 2023, 23, 19–35. [Google Scholar]
- Juthathip, J.; Archanun, K. Digital Technology Adoption and SMEs’ Financial Performance; Faculty of Economics, Thammasat University: Bangkok, Thailand, 2024. [Google Scholar]
- Jongwanich, J.; Kohpaiboon, A. Digital Technology Adoption and SMEs’ Financial Performance: Evidence from Thailand; Faculty of Economics, Thammasat University: Bangkok, Thailand, 2024. [Google Scholar]
- Gupta, S.; George, J. Digital transformation and sustainable performance: The role of management control system. Int. J. Acad. Res. Account. Financ. Manag. Sci. 2024, 13, 458–472. [Google Scholar]
- Martínez-Peláez, R. Sustainable Digital Transformation for SMEs: A Comprehensive Framework for Informed Decision-Making. Sustainability 2024, 16, 4447. [Google Scholar] [CrossRef]
- Qalati, S.A.; Yuan, L.W.; Khan, M.A.S.; Anwar, F. Examining the Factors Affecting SME Performance: The Mediating Role of Social Media Adoption. Sustainability 2021, 13, 75. [Google Scholar] [CrossRef]
- Marolt, M.; Zimmermann, H.D.; Pucihar, A. Social Media Use and Business Performance in SMEs: The Mediating Roles of Relational Social Commerce Capability and Competitive Advantage. Sustainability 2022, 14, 15029. [Google Scholar] [CrossRef]
- Ramingwong, S.; Sopadang, A. Factory Logistics Improvement: A Case Study Analysis of Northern Thailand. J. Asian Financ. Econ. Bus. 2024, 8, 88. [Google Scholar]
- Lekmat, L.; Eurjirapongpun, B. Is Social Media Usage Enough to Achieve Superior Performance in Thai SMEs? The Mediation of Entrepreneurial Orientation. Creat. Bus. Sustain. J. 2022, 44, 1–21. [Google Scholar]
- Intrawong, W. Effects of entrepreneurial behaviors and product innovation performance towards start-up business survival in Thailand. SSRN Electron. J. 2023, 6, 141–157. [Google Scholar]
- Untachai, S.; Dullayaphut, P.; Junla, J.; Bast, C. An Exploratory Study of the Effect of Entrepreneurial Marketing Orientation on the Performance of Community Enterprises in Thailand. Creat. Bus. Sustain. J. 2024, 46, 44–61. [Google Scholar] [CrossRef]
- Tornatzky, L.G.; Fleischer, M. The Processes of Technological Innovation; Lexington Books: Lanham, MD, USA, 1990. [Google Scholar]
- Alkateeb, M.; Abdalla, R. The adoption of social media marketing in SMEs: A systematic review using TOE framework. Int. J. Inf. Manag. 2021, 23, 45–67. [Google Scholar]
- Zhu, K.; Kraemer, K.L.; Xu, S. The process of innovation assimilation by firms in different countries: A technology diffusion perspective on e-business. Manag. Sci. 2020, 52, 1557–1576. [Google Scholar] [CrossRef]
- Farcane, N.; Deliu, D.; Bleotu, V. The Role of Technological Readiness in Enhancing the Quality of Audit Work: Evidence from an Emerging Market. J. Risk Financ. Manag. 2024, 17, 489. [Google Scholar]
- Nguyen, T.H.; Le, N.T. What Drives Industry 4.0 Technologies Adoption? Evidence from a SEM-Neural Network Approach in the Context of Vietnamese Firms. Sustainability 2023, 15, 5969. [Google Scholar] [CrossRef]
- Gimpel, H.; Hosseini, S.; Huber, R.X.R.; Probst, L.; Röglinger, M.; Faisst, U. Structuring Digital Transformation: A Framework of Action Fields and its Application at ZEISS. J. Inf. Technol. Theory Appl. 2018, 19, 31–54. [Google Scholar]
- Michelotto, F.; Joia, L.A. Organizational Digital Transformation Readiness: An Exploratory Investigation. J. Theor. Appl. Electron. Commer. Res. 2024, 19, 3283–3304. [Google Scholar] [CrossRef]
- Ferrer-Dávalos, R.M. Influence of technology adoption on organizational performance: Evidence from Paraguayan microenterprises. South Fla. J. Dev. 2023, 4, 696–718. [Google Scholar] [CrossRef]
- Yamin, M.; Tsai, H. Understanding Organizational Culture and Communication in Technology Implementation Success. Sustainability 2023, 15, 3265. [Google Scholar]
- Naidoo, R.; Hoque, M. A framework for digital transformation and business model innovation. Manag. J. Contemp. Manag. Issues 2021, 26, 111–138. [Google Scholar]
- Monken, S.; Rampasso, I.S.; Anholon, R.; Silva, D.; Quelhas, O.L.G. Technology-Organization-External-Sustainability (TOES) Framework for Technology Adoption: Critical Analysis of Models for Industry 4.0 Implementation Projects. Sustainability 2024, 16, 11064. [Google Scholar] [CrossRef]
- Zhang, W.; Zeng, X.; Liang, H.; Xue, Y.; Cao, X. Understanding How Organizational Culture Affects Innovation Performance: A Management Context Perspective. Sustainability 2023, 15, 6644. [Google Scholar] [CrossRef]
- Wasudawan, K.; Sim, C.H. Shaping a Digital Future: Examining Technology, Organisation and Environment (TOE) Framework. J. Technol. Manag. Bus. 2024, 11, 80–97. [Google Scholar] [CrossRef]
- Zhang, L.; Wang, H. Price Dispersion, Bargaining Power, and Consumers’ Online Shopping Behavior. J. Consum. Res. 2023, 15, 1–22. [Google Scholar]
- Suprihono, S.; Prasetya, A.; Abdillah, Y. Improving firm performance through Competitive Advantage: A Literature Review. Int. J. Artif. Intell. Res. 2024, 6, 331. [Google Scholar]
- Ajala, O.P.; Egwakhe, J.A.; Adeoye, S.O. Talent Management Programmes and Cost Leadership in Deposit Money Banks in Lagos State, Nigeria. J. Hum. Resour. Leadersh. 2023, 7, 58–75. [Google Scholar] [CrossRef]
- Shah, N.; Zehri, A.W.; Saraih, U.N.; Abdelwahed, N.A.A.; Soomro, B.A. The role of digital technology and digital innovation towards firm performance in a digital economy. Kybernetes 2024, 53, 620–644. [Google Scholar] [CrossRef]
- Sharma, R.; Keller, R.T. Competitive advantage through new product development capabilities. Arch. Bus. Res. 2020, 8, 202–209. [Google Scholar]
- Zhang, X. Incremental Innovation: Long-Term Impetus for Design Business Creativity. Sustainability 2022, 14, 14697. [Google Scholar] [CrossRef]
- de la Calle, A.; Freije, I.; Oyarbide, A. Digital Product–Service Innovation and Sustainability: A Multiple-Case Study in the Capital Goods Industry. Sustainability 2021, 13, 6342. [Google Scholar] [CrossRef]
- Daspit, J.J.; Fox, C.J.; Findley, S.K. Entrepreneurial mindset: An integrated definition, a review of current insights, and directions for future research. J. Small Bus. Manag. 2021, 61, 12–44. [Google Scholar] [CrossRef]
- Iqbal, A.; Nazir, T.; Ahmad, M.S. Entrepreneurial leadership and employee innovative behavior: An examination through multiple theoretical lenses. Eur. J. Innov. Manag. 2022, 25, 173–190. [Google Scholar] [CrossRef]
- Fu, C.; Indiran, L.; Kohar, U.H.; Wiyata. Entrepreneurship Orientation (EO) and Innovation: A Systematic Review. KnE Soc. Sci. 2024, 2024, 1–15. [Google Scholar] [CrossRef]
- de Oliveira Santini, F.; Ladeira, W.J.; Pinto, D.C.; Herter, M.M.; Sampaio, C.H.; Babin, B.J. Customer engagement in social media: A framework and meta-analysis. J. Acad. Mark. Sci. 2020, 48, 1211–1228. [Google Scholar] [CrossRef]
- Banerji, R.; Singh, A. Do social media marketing activities promote customer loyalty? A study on the e-commerce industry. Libr. Bus. Sch. J. Manag. Res. 2024, 22, 93–109. [Google Scholar] [CrossRef]
- Jensen, R.; Shen, Q. New approaches to fuzzy-rough feature selection. IEEE Trans. Fuzzy Syst. 2009, 17, 824–838. [Google Scholar] [CrossRef]
- Cornelis, C.; Van der Merwe, F. Decision Making in Fuzzy Rough Set Theory. Mathematics 2023, 11, 4187. [Google Scholar] [CrossRef]
- Dubois, D.; Prade, H. Bridging gaps between several forms of granular computing. Granul. Comput. 2015, 1, 115–126. [Google Scholar] [CrossRef]
- Wu, W.Z.; Leung, Y.; Mi, J.S. Granular computing and knowledge reduction in formal contexts. IEEE Trans. Knowl. Data Eng. 2019, 21, 1461–1474. [Google Scholar]
- Raza, I.; Jamal, M.H.; Qureshi, R.; Shahid, A.K.; Vistorte AO, R.; Samad, M.A.; Ashraf, I. Adaptive neighborhood rough set model for hybrid data processing: A case study on Parkinson’s disease behavioral analysis. Sci. Rep. 2024, 14, 7635. [Google Scholar] [CrossRef]
- Cornelis, C.; Jensen, R.; Hurtado, G.; Ślęzak, D. Attribute selection with fuzzy decision reducts. Inf. Sci. 2010, 180, 209–224. [Google Scholar] [CrossRef]
- Pankham, S.; Chadcham, S. Development of an Expert Panel Consensus Measurement Procedure using Rough Set Theory in the e-Delphi Technique. Res. Methodol. Cogn. Sci. 2017, 14, 87–101. [Google Scholar]
- Robkob, N.; Pankham, S. Employing Fuzzy Delphi Techniques to Validate the Components and Contends of Role of Social Media in a Technology Acceptance Model Towards Perception and Investment Intention in Cryptocurrency. J. Law Sustain. Dev. 2023, 11, e2032. [Google Scholar] [CrossRef]
- Saelee, R.; Pankham, S. The Impact of Social Media and Emotional Intelligence on InvestmEN Decision: A Fuzzy Set Delphi Study Among Investors in Thailand’s Stock Market. TEM J. 2024, 13, 2208–2217. [Google Scholar] [CrossRef]
- Fabrigar, L.R.; Wegener, D.T.; MacCallum, R.C.; Strahan, E.J. Evaluating the use of exploratory factor analysis in psychological research. Psychol. Methods 1999, 4, 272–299. [Google Scholar] [CrossRef]
- Jöreskog, K.G. A general approach to confirmatory maximum likelihood factor analysis. Psychometrika 1969, 34, 183–202. [Google Scholar] [CrossRef]
- Macmillan, T.T. The Delphi Technique. In Proceedings of the Annual Meeting of the California Junior Colleges Associations Committee on Research and Development, Monterey, CA, USA, 3–5 May 1971. [Google Scholar]
- Likert, R. A technique for the measurement of attitudes. Arch. Psychol. 1932, 22, 1–55. [Google Scholar]
- Pawlak, Z. Rough Sets. Int. J. Comput. Inf. Sci. 1982, 11, 341–356. [Google Scholar] [CrossRef]
- Murray, T.J.; Pipino, L.L.; van Gigch, J.P. A pilot study of fuzzy set modification of Delphi. Hum. Syst. Manag. 1985, 5, 76–80. [Google Scholar] [CrossRef]
- Haig, B.D. Exploratory Factor Analysis, Theory Generation, and Scientific Method. Multivar. Behav. Res. 1990, 40, 303–329. [Google Scholar] [CrossRef]
- Kaiser, H.F.; Rice, J. Little Jiffy, Mark IV. Educ. Psychol. Meas. 1974, 34, 111–117. [Google Scholar] [CrossRef]
- Brown, T.A. Confirmatory Factor Analysis for Applied Research, 2nd ed.; The Guilford Press: New York, NY, USA, 2015. [Google Scholar]
- Kline, R.B. Principles and Practice of Structural Equation Modeling, 4th ed.; The Guilford Press: New York, NY, USA, 2016. [Google Scholar]
- Bentler, P.M.; Bonett, D.G. Significance tests and goodness of fit in the analysis of covariance structures. Psychol. Bull. 1980, 88, 588–606. [Google Scholar] [CrossRef]
- Hu, L.; Bentler, P.M. Cutoff criteria for fit indexes in covariance structure analysis: Conventional criteria versus new alternatives. Struct. Equ. Model. 1999, 6, 1–55. [Google Scholar] [CrossRef]
- Steiger, J.H. Understanding the limitations of global fit assessment in structural equation modeling. Personal. Individ. Differ. 2007, 42, 893–898. [Google Scholar] [CrossRef]
- Hair, J.F.; Black, W.C.; Babin, B.J.; Anderson, R.E. Multivariate Data Analysis, 8th ed.; Cengage Learning: Singapore, 2019. [Google Scholar]
- Fornell, C.; Larcker, D.F. Evaluating structural equation models with unobservable variables and measurement error. J. Mark. Res. 1981, 18, 39–50. [Google Scholar] [CrossRef]
- Nunnally, J.C.; Bernstein, I.H. Psychometric Theory, 3rd ed.; McGraw-Hill: New York, NY, USA, 1994. [Google Scholar]
- Cohen, J. Statistical Power Analysis for the Behavioral Sciences, 2nd ed.; Lawrence Erlbaum Associates: Mahwah, NJ, USA, 1988. [Google Scholar]
- Chatterjee, S.; Kar, A.K. Why do small and medium enterprises use social media marketing and what is the impact: Empirical insights from India. Int. J. Inf. Manag. 2020, 53, 102103. [Google Scholar] [CrossRef]
- Ahmad, A.; Bhatti, S.H.; Gölgeci, I.; Arslan, A. Digital platform capability and organizational agility of emerging market manufacturing SMEs: The mediating role of intellectual capital and the moderating role of environmental dy-namism. Technol. Forecast. Soc. Change 2022, 177, 121554. [Google Scholar] [CrossRef]
- Abdullah, N.; Ampauleng, M. Social Media Usage On MSMEs’ Performance: The Moderating Role of Innovation Capability. J. Manaj. 2024, 28, 175–199. [Google Scholar]
- Palladan, A.A.; AbdulKadir, K.; Ahmed, I.S.; Abubakar, Y. Effects of social media adoption on SME performance: The moderating role of business strategy. Int. J. Technol. Eng. 2023, 4, 297–320. [Google Scholar] [CrossRef]
- Qalati, S.A.; Yuan, L.W.; Khan, M.A.S.; Anwar, F. A mediated model on the adoption of social media and SMEs’ performance in developing countries. Technol. Soc. 2021, 64, 101513. [Google Scholar] [CrossRef]
- Cvjetković, M. Organizational use and adoption of social media through TOE framework: Empirical research on Croatian small and medium-sized enterprises. Manag. J. Contemp. Manag. Issues 2023, 28, 73–92. [Google Scholar] [CrossRef]
- Scholtz, B.M.; Yakobi, K. The Technology, Organization, and Environment Framework for Social Media Analytics in Government: The Cases of South Africa and Germany. Afr. J. Inf. Syst. 2023, 15, 280–290. [Google Scholar]
- Chairaksa, N.; Pankham, S. Modern Entrepreneur for the Success of Online Businesses for Small and Medium Enterprise in Thailand. TEM J. 2023, 12, 956–966. [Google Scholar] [CrossRef]
- Kamboj, S.; Sharma, M. Social media adoption behaviour: Consumer innovativeness and participation intention. Int. J. Consum. Stud. 2022, 46, 523–544. [Google Scholar] [CrossRef]
- Gun, L. Effect of Digital Transformation on Firm Performance in the Uncertain Environment: Transformational Leadership and Employee Self-Efficacy as Antecedents of Digital Transformation. Sustainability 2024, 16, 1200. [Google Scholar] [CrossRef]


Disclaimer/Publisher’s Note: The statements, opinions and data contained in all publications are solely those of the individual author(s) and contributor(s) and not of MDPI and/or the editor(s). MDPI and/or the editor(s) disclaim responsibility for any injury to people or property resulting from any ideas, methods, instructions or products referred to in the content. |
© 2025 by the authors. Licensee MDPI, Basel, Switzerland. This article is an open access article distributed under the terms and conditions of the Creative Commons Attribution (CC BY) license (https://creativecommons.org/licenses/by/4.0/).