Article

Construction and Application of Enterprise Electric Carbon Model: A Study Based on Key Enterprises in Qinghai Province

1
Information and Communication Company of State Grid Qinghai Electric Power, Xining 816099, China
2
School of Statistics, Beijing Normal University, Beijing 100875, China
3
School of Economics, Peking University, Beijing 100871, China
*
Authors to whom correspondence should be addressed.
Sustainability 2025, 17(5), 2243; https://doi.org/10.3390/su17052243
Submission received: 10 January 2025 / Revised: 22 February 2025 / Accepted: 27 February 2025 / Published: 5 March 2025

Abstract

:
As the coverage of China’s carbon emissions trading market expands from the power industry to the cement, steel, and electrolytic aluminum industries, the measurement and verification of carbon emissions of Chinese enterprises become increasingly important. This paper draws on the IPCC inventory compilation method and constructs an electric carbon model at the enterprise level in terms of energy consumption and production process; at the same time, it collects microdata from a total of 44 enterprises in three industries, namely, electrolytic aluminum, cement, and ferroalloy, in Qinghai Province. Based on the constructed electric carbon model, high-frequency measurement of enterprise carbon emissions was conducted. In order to verify the validity of the results, this paper examines the results from the perspectives of internal logic and external standards. The examination shows that the carbon model constructed in this paper has advantages such as cost-effectiveness, high measurement frequency, and accuracy, and it is suitable for third-party verification organizations or relevant management departments to use in the wide-scale measurement and verification of carbon emissions of enterprises.

1. Introduction

In September 2020, China formally announced at the United Nations General Assembly the timetable for “carbon peak” and “carbon neutrality”. In August 2024, the General Office of the State Council of China issued the “Work Program for Accelerating the Construction of a Dual Carbon Emission Control System”, which incorporates carbon emission targets and related requirements into national planning. It will establish and improve the policy system and management mechanism for local carbon assessment, industry carbon control, enterprise carbon management, project carbon evaluation, product carbon footprint, etc., and effectively connect with the national carbon emissions trading market, so as to build a systematic and complete dual-control system of carbon emissions and provide a strong guarantee for realizing the goal of carbon peak and carbon neutrality. This means that in the future, companies may also face the requirement of a “dual control of carbon emissions” assessment. Immediately following this, in September 2024, China’s Ministry of Ecology and Environment released the “Work programme for the national carbon emissions trading market covering the cement, iron and steel, and electrolytic aluminium industries” which is the first expansion of the national carbon trading market after it officially operated in Wuhan in June 2021, with 2225 key enterprises in the power generation industry being included in the first batch of companies to be included in the market. This expansion implies increased participation of enterprises in the carbon trading market, highlighting the growing importance of enterprise-level carbon emission data.
At present, the most developed and active corporate carbon trading market in the world is the European Union Emissions Trading System (EU ETS). Its measurement method of enterprise carbon emission has been improved continuously, resulting in the formation of two carbon emission measurement methods based on calculation and measurement. Among them, the calculation-based enterprise carbon emission measurement method is based on the enterprise’s own annual energy use and production process, using the corresponding emission factors and annual enterprise carbon emission measurement. Meanwhile, measurement-based corporate carbon emissions measurement methodology, which is used by the European Commission and its Member States to account for the carbon emissions of companies participating in the transaction by means of actual measurements. Both of these two corporate carbon emission measurement methods have the disadvantages of low frequency and high measurement costs, which obviously have a negative impact on the activity of the carbon trading market (Despite the EU’s continuous improvement and refinement of the EU ETS, which has ensured the stability of its trading and the gradual expansion of its trading scale, the trading activity is still insufficiently limited by the frequency of data. The World Carbon Emissions Trading Database (CMD) (2023) shows that the current underlying micro-enterprise carbon emissions data for the EU ETS is still annual).
In order to solve the shortcomings of low-frequency carbon emission data, many researchers have introduced external data (e.g., lighting data, electric power big data) for high-frequency measurement of carbon emissions. Shi et al. (2023) constructed a relationship model between carbon emissions and lighting data and conducted high-frequency measurements of regional carbon emissions [1]. Moreover, Shi et al. (2023) constructed an electric-carbon model on the basis of electric power big data from the aspects of energy consumption and production processes and conducted high-frequency measurements of regional carbon emissions [1]. Wang et al. (2024) constructed an electric-carbon model based on electric power big data on the industry’s carbon emissions and realized the high-frequency measurement of industry carbon emissions [2]. In this paper, according to the IPCC (Intergovernmental Panel on Climate Change) (2006, 2019) inventory method [3], we draw on the research results of Shi et al. (2021), whose paper constructed an electric carbon model for measuring regional carbon emissions at the enterprise level [4].
Considering the breadth and accuracy of electric power big data coverage, this paper constructs an enterprise-level “electricity-carbon” model to measure the carbon emissions of enterprises from the dimensions of energy use and production process with high frequency, which enriches the existing theory of enterprise carbon emission measurement and has certain theoretical innovations. Realistically speaking, the high-frequency carbon emission measurement of key emitting enterprises based on electric power big data can significantly reduce the cost of carbon emission measurement and provide the efficiency of related work on the one hand, and on the other hand, it enables high-frequency carbon emission data collection for the existing enterprise carbon trading market. The motivation of this article is to explore a low-cost and accurate method for monitoring corporate carbon emissions from both theoretical and practical applications, providing a main method for relevant government management departments to conduct large-scale corporate carbon emission verification. Monthly carbon emission monitoring not only meets the above motivation but also plays a timely monitoring role in determining whether the government’s dual control goals (total carbon emission control and intensity control) can be achieved. (In August 2024, the General Office of the State Council of China issued the “Work Plan for Accelerating the Construction of a Dual Control System for Carbon Emissions”, marking the official shift of China’s local government’s target assessment from energy intensity control to carbon emission total control and carbon emission intensity control “dual control”). Obviously, in order to implement the national dual control goals, enterprises need to conduct monthly monitoring of carbon emissions and intensity.
The contribution of this paper is mainly reflected in the following two aspects. Firstly, it constructs an enterprise-level electric carbon model and applies the model to calculate the specific micro carbon emission data of enterprises. Secondly, in constructing the enterprise electric carbon model, for the characteristics of enterprise data with large fluctuations, we constructed a model capacity library containing only trend cyclic sequences (TC sequences) on the basis of Shi et al. (2023) and Wang et al. (2024), which can effectively solve the fitting problem of data with large fluctuations in enterprises and reduce the cost of model selection, improving the effectiveness of the model.

2. Literature Review

Since the signing of the Kyoto Protocol, despite extensive research on carbon measurement methodologies, no universally accepted approach has been established. Existing literature tends to explore how to measure carbon emissions through two types of methods: top-down and bottom-up.
For top-down disaggregated accounting, which mainly refers to macro-measurement at the national or regional level, the main method is the IPCC series of standards, which is the earliest developed and the most authoritative carbon accounting system, which is now widely used. It mainly accounts for carbon emissions and removals from six major sectors: energy, industrial processes and product use, agriculture, forestry and other land use, waste, and others [3]. There are two main types of data captured for the IPCC methodology, one of which is the activity data, and the other is the emission coefficients. The product of the two is used to roughly estimate the carbon emissions [5,6].
A bottom-up accounting system mainly refers to accounting based on organizations or projects and products. The currently accepted methodology for organization- or project-based accounting is the Greenhouse Gas Protocol: Guidelines for Accounting and Reporting by Enterprises (GHG). GHG was jointly developed by the World Resources Institute (WRI) and the World Business Council for Sustainable Development (WBCSD). The first edition of the GHG was released in October 2001, and the second edition was released in 2004 with amendments. It covers the six greenhouse gases restricted by the Kyoto Protocol. The GHG is the first global standard for corporate carbon emissions, and most existing carbon emission measurement methods follow this standard [7]. The GHG follows the financial accounting standard by first defining the organizational boundaries, then identifying the emission facilities and sources within the boundaries, collecting the activity level data, and calculating the carbon emissions [8]. For product-based accounting, the most complete specification is PAS2050 [9], which was developed as the first mandatory harmonized carbon footprint measurement standard for products and services in the UK based on strict adherence to the procedures set out by the BSI [10,11]. According to the PAS2050 standard, calculating the carbon footprint of a good or service over its full life cycle mainly consists of the following four basic steps, i.e., firstly, establishing a product life cycle flow chart; secondly, evaluating the verification boundaries and the level of importance of the emission sources; thirdly, collecting the information on the activity data base; and fourthly, quantifying the full-life-cycle carbon emissions [12].
In addition to the above standards, the International Organization for Standardization (ISO) has also published an internationally accepted verification standard, ISO 14064 [13], which provides a model for the management, reporting, and validation of GHG information and data, allowing for the calculation and validation of emission values through the use of a standardized methodology.
From a comprehensive perspective, the top-down carbon measurement system is more suitable for the macro level, can have a rough control of the overall emission situation in a specific region, and has advantages in measuring the overall carbon emission of a country or region due to the simplicity of calculation in the case of known energy consumption. However, due to the differences in regional technology levels, energy quality, and combustion efficiency, the statistics of activity data and the determination of emission factors are prone to large deviations and high uncertainty. A bottom-up carbon accounting system accounts for the carbon emissions of enterprises or products. Theoretically, the results are accurate and can reflect the emissions in production and consumption, but this requires more data and is more difficult to collect.
Regarding the emission measurement of specific industries or enterprises, different scholars have different choices of methods, focusing on the specific industries to be measured and the scope of application of different measurement methods. Current research mainly adopts the IPCC method to measure carbon emissions through the emission factors given by the IPCC or make corrections to the factors according to the status quo of the industry and region, derive the annual data on the emissions of coal, manufacturing, cement, thermal power generation, iron, and steel, etc., study the efficiency of the industry’s emissions, influencing factors and drivers, and give recommendations for emission reduction [1,2,3,7,14]. There is also some research based on the life cycle (LCA) theory, which established the carbon emission measurement method of the life cycle of coal power and calculated the carbon emission coefficients of the coal-to-energy chain [15]. Some scholars also compared the measurement results of the IPCC method, CEMS actual measurement method, emission calculation based on fuel sample analysis, and fuel consumption measurement, and the uncertainty of the IPCC method is lower than that of the actual measurement method. It is basically the same as the calculation results based on sample analysis, and the measurement effect is better [16]. In addition, other scholars have conducted high-frequency measurements of regional and industry carbon emissions based on electric power big data [17,18], and the biggest advantages of this type of measurement are the relative ease of data collection, the high-frequency measurement results, and the low cost of measurement, which makes it suitable for large-scale carbon emission measurement and carbon emission verification.
In addition to focusing on the methodology of carbon emission measurement, the frequency of carbon emission measurement is also important for the fulfillment of carbon reduction targets. The accuracy of more high-frequency data is improved, and the seasonal factors and emission characteristics are more obvious, which helps to formulate more targeted emission reduction policies [4]. However, there are few articles on high-frequency carbon measurement, both at home and abroad, and even fewer studies on high-frequency carbon measurement for enterprises. The vast majority of them measure carbon emissions generated by specific industries, specific cities, energy consumption, etc. on an annual basis [4,12,15,16], and do not go deeper to construct a framework for high-frequency measurement. Shi et al. (2023), based on electric power big data, constructed an electricity-carbon model to conduct monthly high-frequency measurement of regional carbon emissions [1]; Wang et al. (2024) constructed an electricity-energy-carbon model to conduct monthly high-frequency carbon emission measurement of carbon emissions in key industries based on electric power big data [2].
Based on the existing studies, it can be found that most of the measurement methods in the literature are mainly based on IPCC’s inventory weaving method, the data used in the measurement are mostly statistical data or survey data, which is difficult to collect, and the measurement objects are mainly concentrated in regions and key industries (e.g., electric power industry, energy consumption industry, etc.), and there are fewer literature on the batch calculation of the carbon emissions of specific enterprises.

3. Materials and Methods

3.1. Data Acquisition and Preprocessing

Here, we collect micro-data on product output, electricity consumption, and energy consumption (including primary energy sources such as coal, oil, and gas) of a total of 44 enterprises of cement, electrolytic aluminum, and ferroalloy in Qinghai Province. Except for electricity consumption, the data of the other indicators are all annual indicators, which come from the primary survey data collected by relevant organizations such as CQC (China Quality Certification Centre) and the Classification Society. In order to ensure data availability, improve data accessibility, and collect data quality, and at the same time, considering the data requirements of the enterprise’s electro-carbon model, we require that the enterprise data collected are annual data only, and the data length is only for the past five years. The enterprise’s electricity consumption data is monthly indicator data, which comes from Qinghai Electric Power Company, and the monthly electricity consumption data of similar enterprises is, at least, the monthly data for the past five years.
For missing data, we use trend interpolation to fill in the blanks. All annual indicator data are converted to monthly indicator data based on the frequency conversion method. All monthly indicators used the seasonal adjustment method to convert them into trend cyclic series (TC series), seasonal series (S series), and irregular series (I series).

3.2. Settings of the Electric Carbon Model

For the construction method of the “electricity-carbon” model, based on Shi et al. (2023) and Wang et al. (2024), we have made improvements, which are mainly reflected in the deletion of the capacity pool of the model [1,2]. Through a large number of tests of microenterprises, in order to improve the efficiency of enterprise electric carbon model selection and reduce the computational cost of model selection, taking into account the characteristics of large fluctuations in enterprise data, we constructed a model capacity library that contains only the trend cyclic series (TC series). The specific steps for the construction of the enterprise’s “electric carbon” model are as follows:
Firstly, we collected annual energy consumption data (coal, oil, gas, electricity), annual production data, and monthly electricity consumption data of enterprises, interpolated the missing data, and verified the logical relationship.
Secondly, the Litterman frequency conversion technique and X-12-ARIMA seasonal adjustment technique were used to decompose the monthly data into sequences after monthly frequency conversion of annual data to obtain TC sequences, I sequences, and S sequences of various monthly indicators.
Thirdly, considering the characteristics of enterprise data with large fluctuation, when we constructed the capacity library of the enterprise electro-carbon model, we only considered the model of each series of TC series, and the specific model expression is as follows:
B(L)(y1_TCt) = α0 + A(L)(x_TCt) + εt
C ( L ) ( l n ( y1_TC t ) ) = α 0 + D ( L ) ( l n ( x_TC t ) ) + ε t
Here, B ( L ) = 1 γ 1 L γ p L p ,   A ( L ) = 1 + α 1 L + + α q L q , C ( L ) = 1 b 1 L b s L s ,   D ( L ) = 1 + a 1 L + + a m L m , and y 1 denotes the total monthly energy consumption (when calculating the carbon emission of the production process, it is sufficient to replace y 1 with y 2 to denote the product output (The y2 here has the same meaning as the y2 in the fifth and sixth steps, and the variables in the fifth and sixth steps have been subscripted t to represent monthly values)), x denotes the monthly electricity consumption, and y1_TCt, x_TCt, εt, L denote the TC sequence of y 1 , the TC sequence of x , the white noise, and the lag operator, respectively. γ i ,   α j , bl, and an are the parameters to be estimated, where  i = 1 , , p ;   j = 1 , , q ;   l = 1 , , s ;   n = 1 , , m . p , q , s , m are the parameters to be selected.
Fourthly, the screening of the optimal corporate e-carbon model is performed based on maximizing the minimum generalization error m a x ( m i n ( E h ) , h ) criterion, where E is the generalization error, h is the different models in the model capacity library, h = 1 , , N , and N is the total number of models in the model capacity library.
Fifthly, based on the optimal electro-carbon model of the enterprise’s energy consumption and the optimal electro-carbon model of the production process obtained from the screening, the enterprise’s monthly total energy consumption (y1t) and monthly product output (y2t) are calculated with the help of the monthly electricity consumption data.
Sixthly, with the help of the emission coefficient of standard coal (F1) and the emission coefficient of the production process (F2), the carbon emission of the monthly energy consumption (c1t) and the carbon emission of the production process (c2t) of the enterprise are calculated, c1t = y1t ∗ F1, c2t = y2t ∗ F2, which leads to the total carbon emission of the enterprise in a month, ct = c1t + c2t.
Based on electricity big data and the IPCC (2006, 2019) inventory compilation method, the first step is to calculate energy consumption carbon emissions. The specific calculation process is as follows: firstly, estimate the parameters of model (1) and model (2); secondly, screen the final model based on the criterion of maximizing the minimum generalization error; thirdly, calculate the latest monthly energy consumption based on the screened final model and the latest monthly electricity consumption data; fourthly, the calculation of energy consumption carbon emissions was based on the results of the product emission coefficients of industrial industries in the Study on Multidimensional High-Frequency Monitoring of Carbon Emissions in Qinghai Province [4]. Similar calculations can be made for the carbon emissions of a company’s monthly production process. Finally, the total monthly emissions of the enterprise can be obtained by adding the carbon emissions from the production process and energy consumption.

4. Results and Evaluations

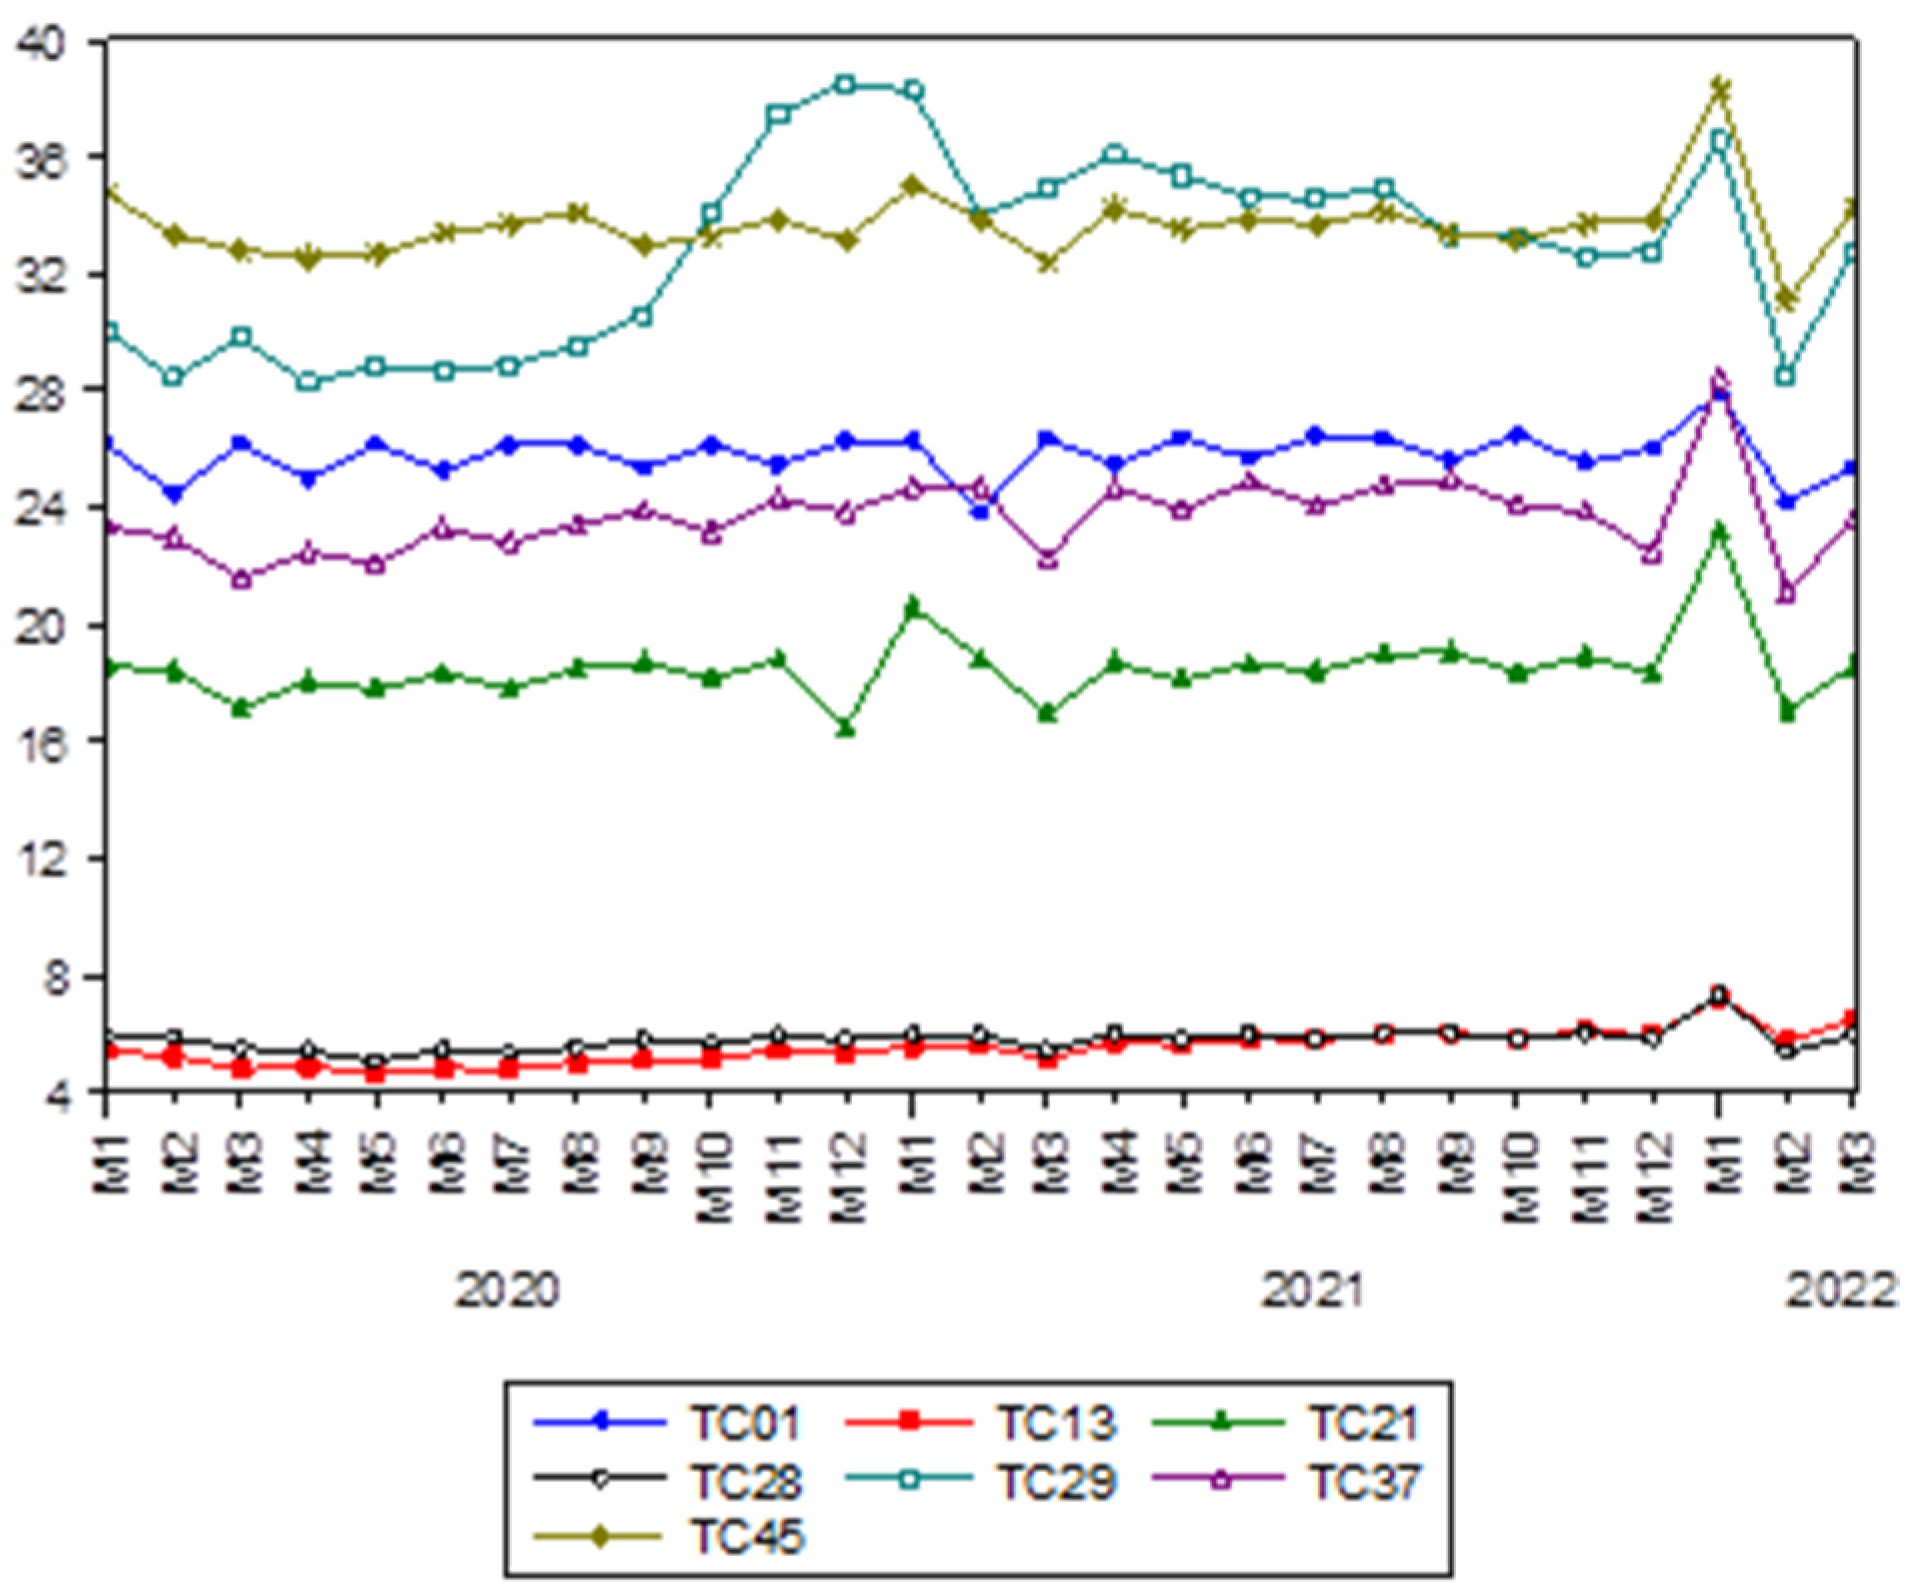
4.1. Carbon Emission Measurement Results of Sample Enterprises in the Electrolytic Aluminum Industry

In this section, NC is used to denote the carbon emissions from the energy consumption of the enterprise, PC to denote the carbon emissions from the production process of the enterprise, TC to denote the total emissions of the enterprise, and EI to denote the carbon intensity of the enterprise (CO2 (tons)/production (tons)). The numbers following NC, PC, TC, and EI denote the code of the enterprise among the 45 enterprises measured.
Figure 1 shows the sequence diagram of the total carbon emissions of seven electrolytic aluminum enterprises in Qinghai Province. Through the comparison of the calculation results, it is found that there are two electrolytic aluminum enterprises in Qinghai Province with a small emission scale, three with a medium emission scale, and two with a large emission scale, and the specific results are shown in Table 1. From the sequence diagram and the comparison of calculation results, we can get the following basic conclusions.
Firstly, the size order of carbon emissions from energy consumption, carbon emissions from the production process, and total carbon emissions of the seven electrolytic aluminum enterprises in Qinghai Province basically remains consistent, i.e., the electrolytic aluminum enterprises with high total carbon emissions have relatively higher corresponding carbon emissions from energy consumption and carbon emissions from the production process as well. Secondly, the carbon emissions of electrolytic aluminum enterprises in Qinghai Province vary greatly, with the carbon emissions of enterprises with the largest production capacity being 6.16 times higher than those of enterprises with the smallest production capacity on average. Thirdly, the measured results of electrolytic aluminum enterprises have a high degree of consistency with those of the industry, and the average relative error rate of the two is −2.1%. Fourthly, in terms of enterprise scale and enterprise carbon emission intensity, there is a large difference in the carbon emission intensity of enterprises with a small scale and a small difference in the carbon emission intensity of enterprises with a large scale. Among them, the enterprise with the smallest carbon emission scale has the largest carbon emission intensity (9.73); the internal extreme difference in carbon emission intensity of enterprises with a small scale is 2.9; the internal extreme difference in carbon emission intensity of enterprises with a medium scale is 0.96; and the internal extreme difference of carbon emission intensity of enterprises with a large scale is only 0.46. The specific results are shown in Table 1. Fifthly, the average carbon emission intensity of the electrolytic aluminum industry measured from the enterprise dimension is 7.16 (of which the carbon emission intensity of the production process (emission parameter) is 1.65, and the average carbon emission intensity of energy consumption is 5.51). There is not much difference between the carbon emission intensity of the electrolytic aluminum industry measured from the industry dimension, and the average carbon emission intensity of the electrolytic aluminum industry measured from the industry dimension is 7.81 (with the relative error of the two at 8.32%), which indicates that the overall credibility of the results of the calculations is high. The difference between the two may be due to the difference between the two sets of data reporting mode and statistical caliber.

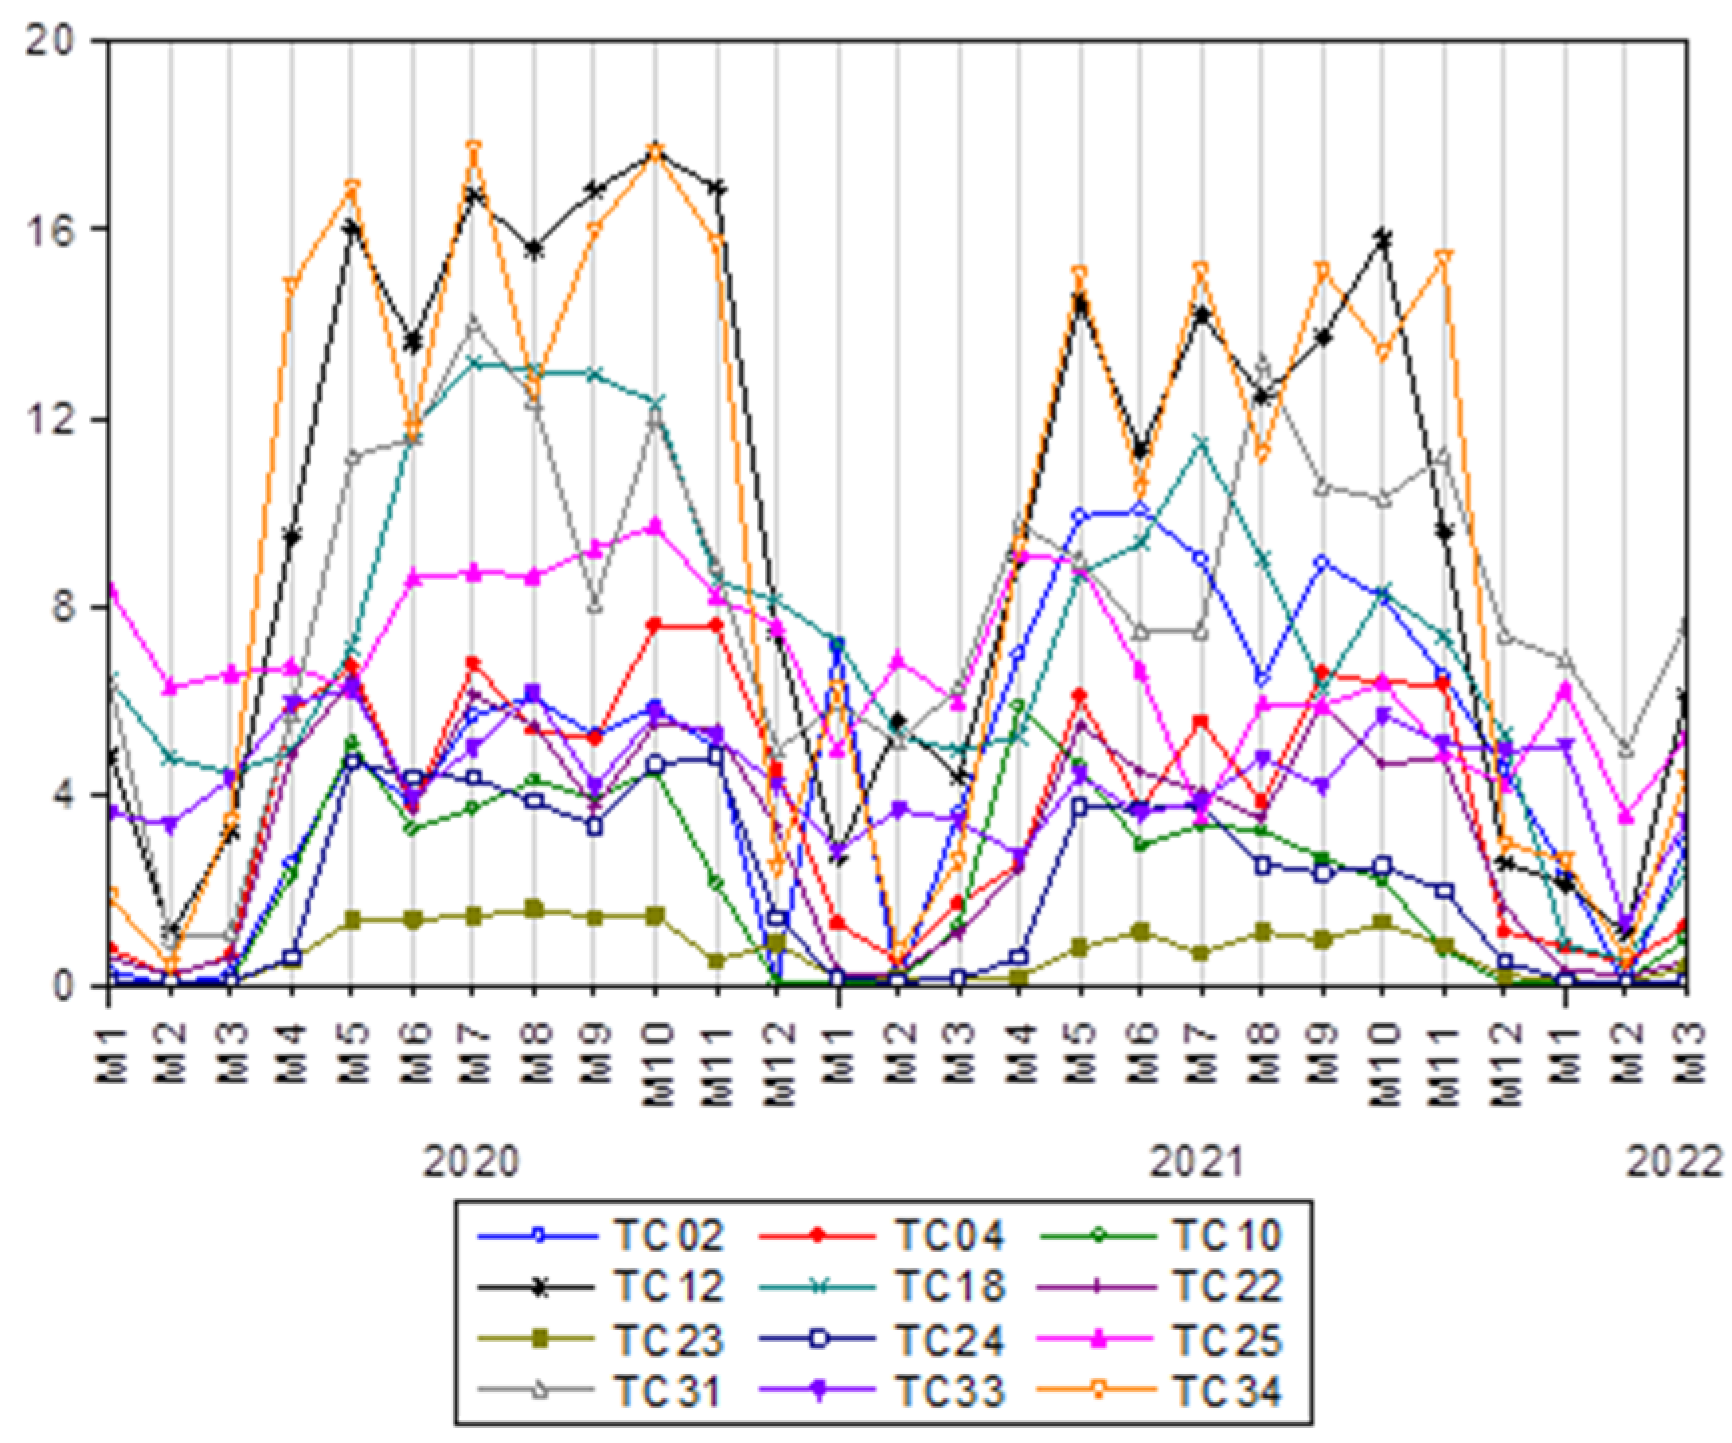
4.2. Carbon Emission Measurement Results of Sample Enterprises in the Cement Industry

Figure 2 shows the total carbon emission sequence diagram of 13 cement enterprises in Qinghai Province. Combined with the monthly average carbon emission scale of the enterprises and the monthly average carbon emission intensity of the enterprises, we organize the calculation results of the 13 enterprises as shown in Table 2. From the sequence diagram and the comparison of the calculation results, we can get the following basic conclusions.
Firstly, the order of carbon emissions from energy consumption, carbon emissions from the production process, and total carbon emissions of the 13 cement enterprises in Qinghai Province is basically consistent, i.e., cement enterprises with high total carbon emissions have relatively high carbon emissions from energy consumption and carbon emissions from the production process.
Secondly, the carbon emissions of cement enterprises in Qinghai Province vary greatly, with the enterprise with the largest monthly average total carbon emissions being 14.07 times larger than the enterprise with the smallest monthly average total emissions. Thirdly, the carbon emissions of cement enterprises in Qinghai Province show a more obvious seasonal factor, with emissions being relatively low in December, January, February, and March each year, while emissions in other months are relatively high. Fourthly, in general, the results of total carbon emissions measured by the cement enterprise dimension have a high degree of consistency with the results of total carbon emissions measured by the industry dimension, and the average relative error rate of the two is −1.15%. It should be noted that although the average relative error rate is low, the relative error rate of the two results stays at a high level in the months with strong seasonality, such as January and February, every year, which provides a direction for the improvement of the enterprise electric carbon model in the future. This means that in order to improve the accuracy of corporate carbon emissions in the future, it is necessary to strengthen research on months with significant seasonality. Fifthly, in terms of enterprise size and carbon emission intensity, the cement industry has small differences in carbon emission intensity for small-sized enterprises and large differences in carbon emission intensity for large-sized enterprises. Sixthly, the average carbon emission intensity of the cement industry measured from the enterprise dimension is 0.78 (of which the carbon emission intensity of the production process (emission parameter) is 0.45 and the average carbon emission intensity of energy consumption is 0.33), and the average carbon emission intensity of the cement industry measured from the industry dimension is 0.33 (of which the carbon emission intensity of the production process (emission parameter) is 0.45 and the average carbon emission intensity of energy consumption is 0.33). The average carbon emission intensity of the cement industry measured from the industry dimension of 0.87 is not much different (the relative error is 10.34%), indicating that the overall credibility of the results is higher. The difference between the two may be due to the difference between the two sets of data reporting mode and statistical caliber.

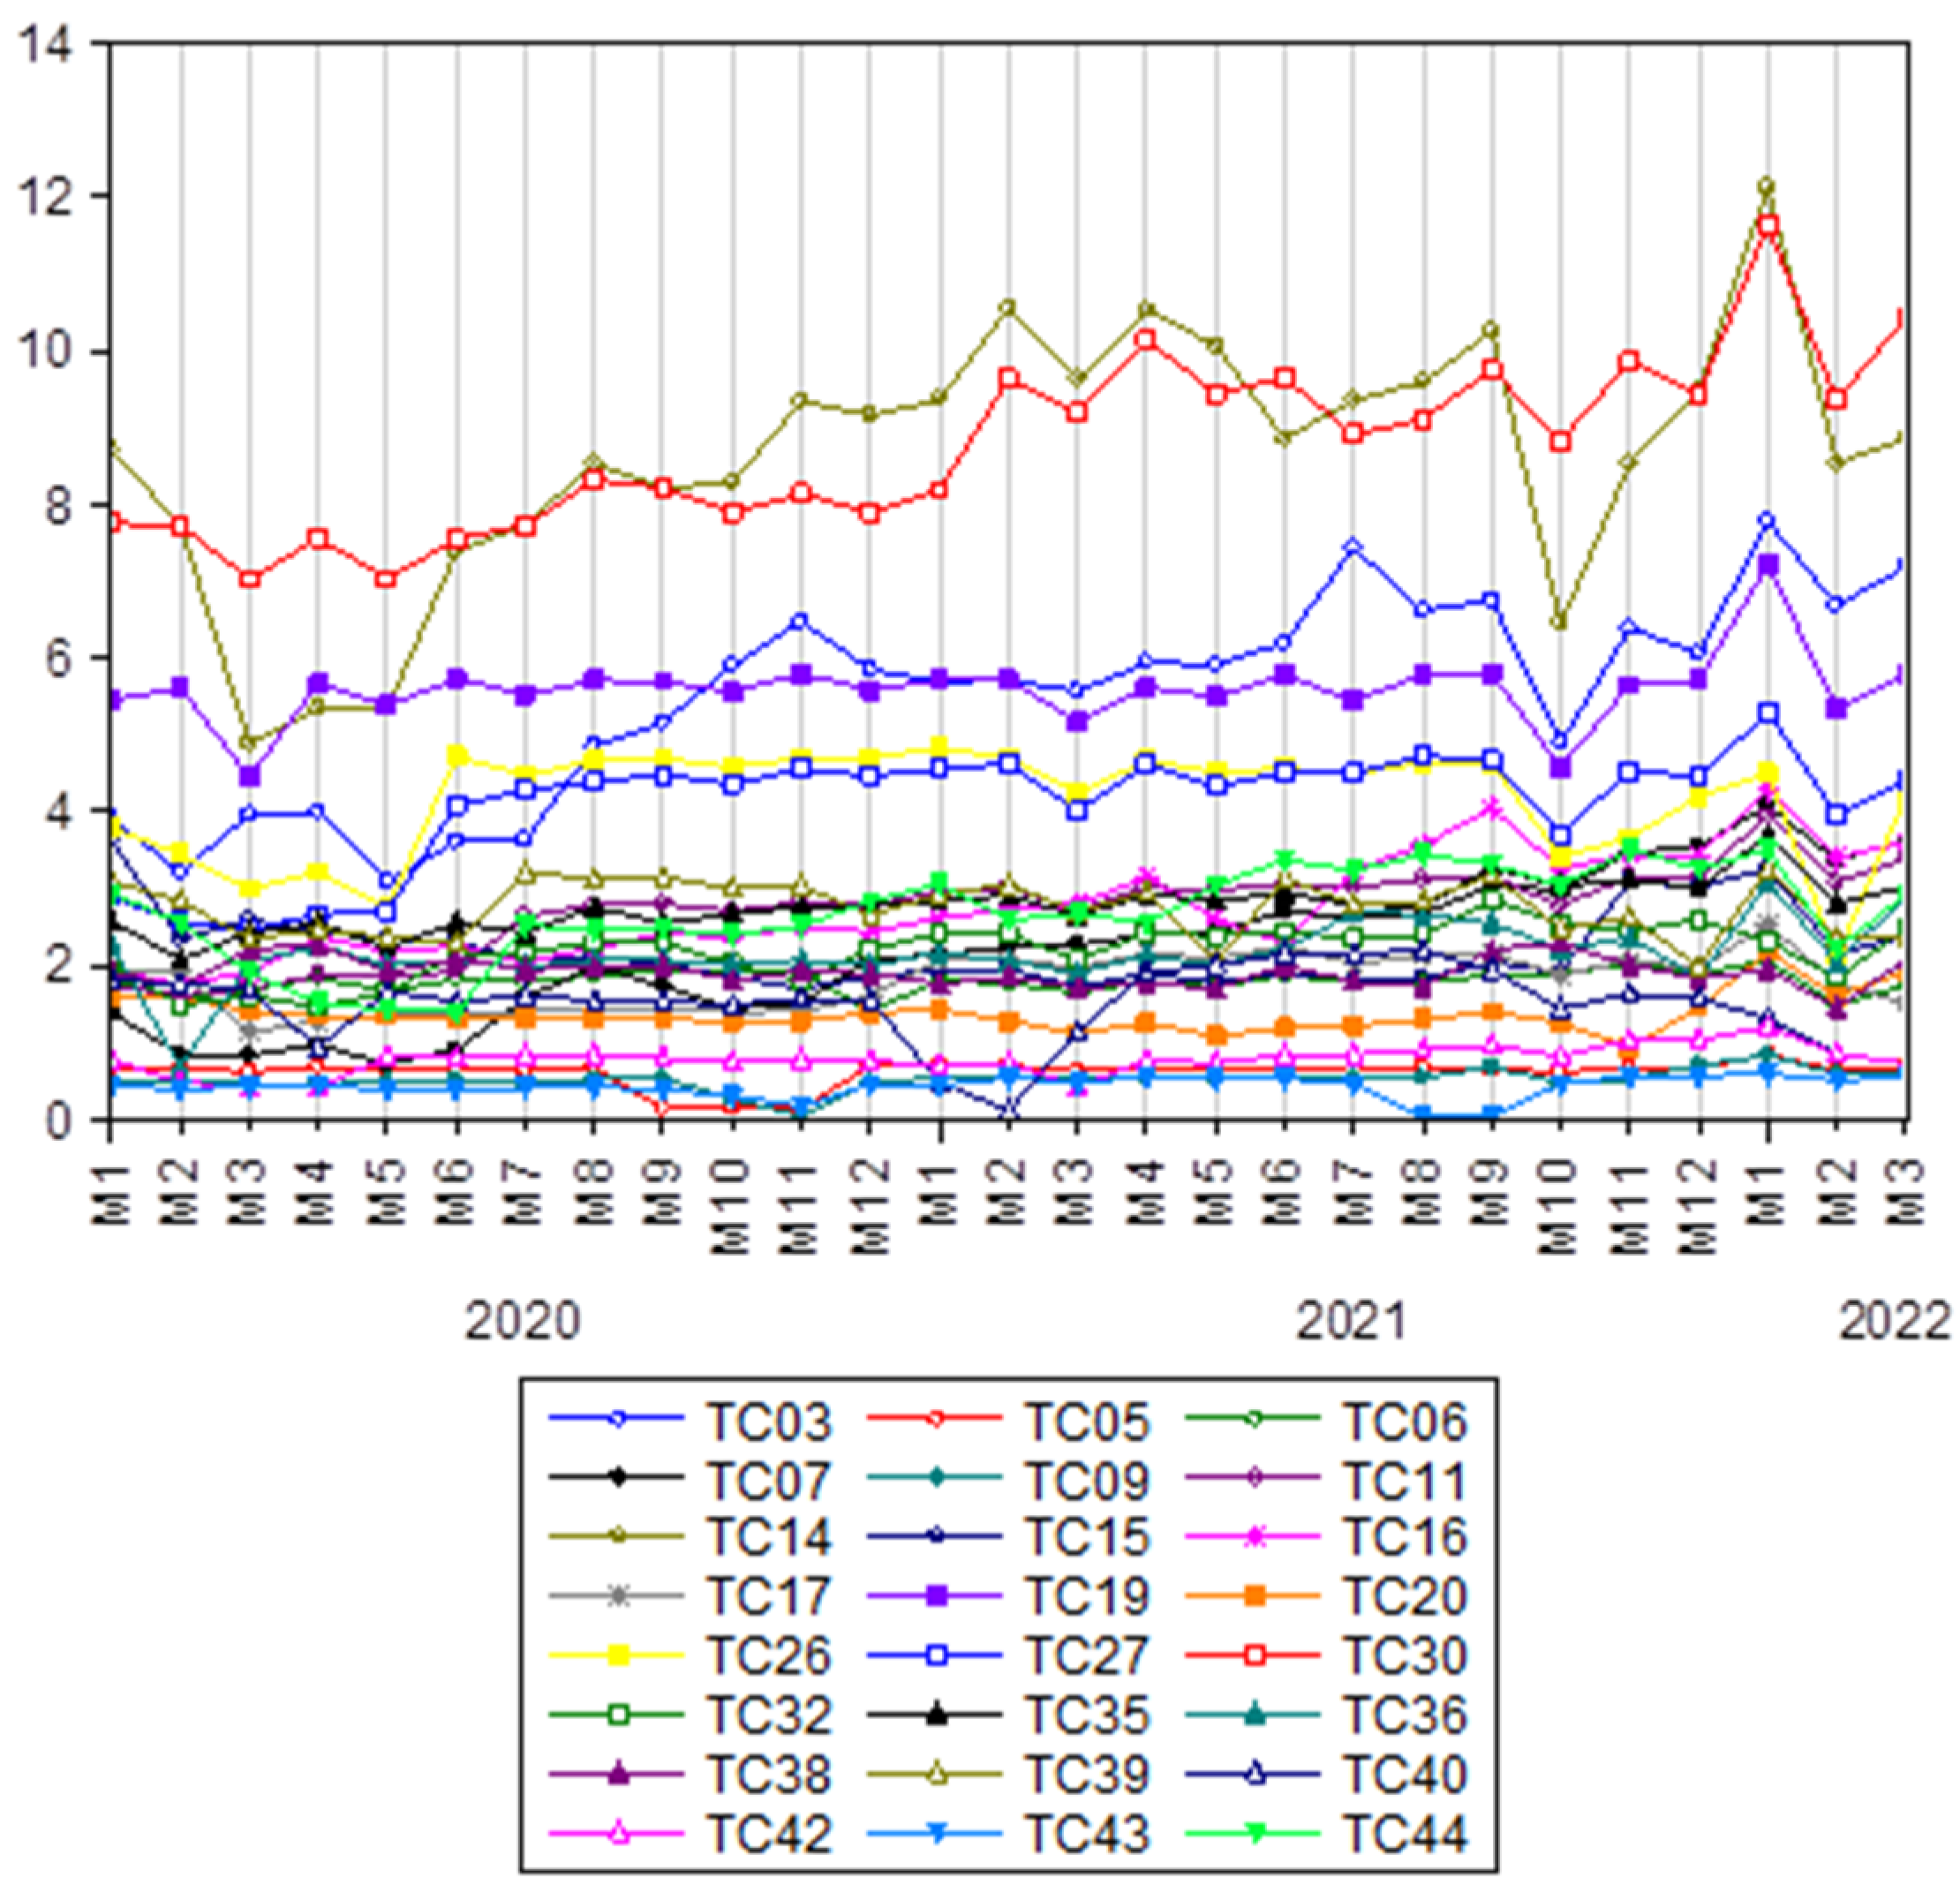
4.3. Carbon Emission Measurement Results of Sample Enterprises in the Ferroalloy Industry

Figure 3 shows the total carbon emission sequence of 24 ferroalloy enterprises in Qinghai Province. Combining the monthly average carbon emission scale of the enterprises and the monthly average carbon emission intensity of the enterprises, we organize the measurement results of the 24 enterprises, as shown in Table 3. From the sequence diagram and the comparison of the calculation results, we can get the following basic conclusions.
Firstly, the order of magnitude of carbon emissions from energy consumption, carbon emissions from the production process, and total carbon emissions of 24 ferroalloy enterprises in Qinghai Province is basically consistent, i.e., ferroalloy enterprises with high total carbon emissions have relatively higher corresponding carbon emissions from energy consumption and carbon emissions from the production process as well.
Secondly, the carbon emissions of ferroalloy enterprises in Qinghai Province vary greatly, and the enterprise with the largest monthly average total carbon emissions is 21.04 times larger than the enterprise with the smallest monthly average total emissions. Thirdly, in general, the results of total carbon emissions measured by the dimension of ferroalloy enterprises and the results of total carbon emissions measured by the dimension of industry have high consistency, and the average relative error rate of the two is 1.29%. Fourthly, in terms of enterprise scale and carbon emission intensity of enterprises, there is a big difference in the carbon emission intensity of small-sized enterprises and a small difference in the carbon emission intensity of large-sized enterprises in the ferroalloy industry. The internal extreme difference in carbon emission intensity of small-sized enterprises is 4.99 (after excluding the outlier 53.04), the internal extreme difference in carbon emission intensity of medium-sized enterprises is 3.46, and the internal extreme difference in carbon emission intensity of large-sized enterprises is only 1.79. This pattern is similar to that of the electrolytic aluminum industry. Fifthly, the average carbon emission intensity of ferroalloy industry measured from the enterprise dimension is 6.15 (of which the carbon emission intensity of the production process (emission parameter) is 1.35 and the average carbon emission intensity of energy consumption is 4.40), which is not much different from that of the ferroalloy industry measured from the industry (with a relative error of 12.68%), indicating that the overall credibility of the results of the estimation is high. The difference between the two may be due to the difference between the two sets of data reporting mode and statistical caliber. Sixthly, regarding the abnormal enterprises, from the viewpoint of carbon emission intensity, the carbon emission intensity of the enterprise with code 42 is as high as 53.04, which is much higher than the average level of the industry. This abnormality may be caused by two reasons. The first reason is that it is due to the special circumstances of the enterprise itself; for example, some of the products produced by the enterprise are not included in the normal statistics for some reason, while energy consumption is normally counted, resulting in excessive carbon emission intensity. The second reason is due to abnormal data collection or reporting, such as reporting production data too low or energy consumption data too small, which can lead to excessive carbon emission intensity.

5. Conclusions and Policy Implications

This paper utilizes electric power big data, based on the constructed enterprise electric carbon model, to test the carbon emissions of enterprises from the perspective of energy consumption and production process. The following four conclusions are drawn as follows. Firstly, the monthly average total carbon emissions among ferroalloy, cement, and electrolytic aluminum enterprises in Qinghai Province differ greatly, and the order of the size of the carbon emissions from energy consumption, carbon emissions from the production process, and total carbon emissions within each enterprise basically maintains consistency, and the enterprise with high total carbon emissions corresponds to relatively high carbon emissions from energy consumption and carbon emissions from production as well. The results have inherent logical consistency. Secondly, the average relative error rate between the total carbon emissions measured by the enterprise dimension and the total carbon emissions measured by the industry dimension is small, and the overall credibility of the results is high. Thirdly, the average carbon emission intensity of the electrolytic aluminum, cement, and ferroalloy industry measured from the enterprise dimension is 7.16, 0.78, and 6.15, respectively. Among the three industries, the electrolytic aluminum industry has the highest carbon emission intensity, while the cement industry has the lowest carbon emission intensity. Fourthly, months with significant measurement errors usually have obvious seasonality, such as January and February in the cement industry every year. In order to improve the accuracy of corporate carbon emissions in the future, it is necessary to strengthen research on months with significant seasonality.
The policy recommendations given in this paper are as follows. Firstly, due to the advantages of easy data collection, low calculation cost, and high credibility of the calculation results proposed in this article, it is recommended that relevant management departments try to introduce this method when conducting large-scale verification of corporate carbon data, which can significantly reduce verification costs and improve verification efficiency. Secondly, the expansion of China’s carbon trading market is imminent. In September 2024, China’s Ministry of Ecology and Environment released the “National Carbon Emission Trading Market Coverage of Cement, Steel, and Electrolytic Aluminum Sectors Work Plan”, which will increase the number of enterprises included in the expanded carbon trading market from the current status quo of more than 2000 to tens of thousands. It is suggested that the management of China’s carbon trading market should try to introduce high-frequency calculation methods of corporate carbon emissions to provide high-frequency and accurate corporate carbon emissions data to support the efficient and smooth development of the carbon trading market. Thirdly, for micro-enterprises, high-frequency carbon emission measurement based on the electro-carbon model can not only reduce the carbon verification cost of enterprises but also help enterprises to grasp their own carbon emission situation in time, carry out carbon emission reduction practice work in a targeted manner, and realize the green and low-carbon goals of enterprises. Fourthly, we suggest that the EU ETS, which is globally representative, adopt the method proposed in this article to measure corporate carbon emissions, which can effectively address the shortcomings of its existing measurement methods, such as low frequency and high cost.

Author Contributions

Conceptualization, Z.L., Q.P., J.S. and H.J.; Methodology, Z.L., Q.P., J.S. and H.J.; Software, Z.L.; Validation, J.S.; Resources, J.S.; Data curation, J.S.; Writing—original draft, Z.L., Q.P., J.S. and H.J.; Writing—review & editing, Z.L., J.S. and H.J.; Visualization, H.J.; Supervision, J.S. All authors have read and agreed to the published version of the manuscript.

Funding

This article is supported by the Science and Technology Project (522814240007) of State Grid Qinghai Electric Power Company.

Institutional Review Board Statement

Not applicable.

Informed Consent Statement

Not applicable.

Data Availability Statement

Data can be obtained on request from the authors.

Conflicts of Interest

Author Zengwei Li was employed by Information and Communication Company of State Grid Qinghai Electric Power. The remaining authors declare that the research was conducted in the absence of any commercial or financial relationships that could be construed as a potential conflict of interest.

References

  1. Shi, J.; Tang, H.; Zhou, Q.; Han, L.; Hao, R. High frequency measurement of carbon emissions based on power big data: A case study of Chinese Qinghai province. Sci. Total Environ. 2023, 902, 166075. [Google Scholar] [CrossRef] [PubMed]
  2. Wang, Y.; Ji, H.; Wang, S.; Wang, H.; Shi, J. Research on Carbon Emissions Estimation in Key Industries Based on the Electricity–Energy–Carbon Model: A Case Study of Henan Province. Energies 2024, 17, 2933. [Google Scholar] [CrossRef]
  3. IPCC. Guidelines for National Greenhouse Gas Inventories; Report of the Intergovernmental Panel on Climate Change; IPCC: Geneva, Switzerland, 2006; Volume 2, Chapter 6. [Google Scholar]
  4. Shi, J.; Zhou, Q.; Han, L.; Si, Y. High-Frequency Multi-Dimensional Monitoring of Carbon Emissions in Qinghai Province; Research Report; Carbon Economy and Econometrics Research Center, Beijing University of Posts and Telecommunications: Beijing, China, 2021. [Google Scholar]
  5. Zhang, M. Carbon Emissions Measurement of Sub-industries in China’s Manufacturing Sector—Also on the Existence of EKC in Manufacturing. Soft Sci. 2015, 29, 113–116. [Google Scholar] [CrossRef]
  6. Shen, L.; Gao, T.; Zhao, J.; Wang, L.; Wang, L.; Liu, L.; Chen, F.; Xue, J. Factory-level measurements on CO2 emission factors of cement production in China. Renew. Sustain. Energy Rev. 2014, 34, 337–349. [Google Scholar] [CrossRef]
  7. UNFCCC. The United States: United Nations Framework Convention on Climate Change; United Nations General Assembly: New York, NY, USA, 2006. [Google Scholar]
  8. Guo, J.; Liu, C.; Sun, P. Carbon Emissions of China’s Industrial Sectors: Influencing Factors and Emission Reduction Potentials. Resour. Sci. 2011, 33, 1630–1640. [Google Scholar]
  9. Sinden, G. The contribution of PAS 2050 to the evolution of international greenhouse gas emission standards. Int. J. Life Cycle Assess. 2009, 14, 195–203. [Google Scholar] [CrossRef]
  10. Shan, Y.; Guan, D.; Liu, J.; Mi, Z.; Liu, Z.; Liu, J.; Schroeder, H.; Cai, B.; Chen, Y.; Shao, S.; et al. Methodology and applications of city level CO2 emission accounts in China. J. Clean. Prod. 2017, 161, 1215–1225. [Google Scholar] [CrossRef]
  11. Ma, X.; Wang, C.; Dong, B.; Gu, G.; Chen, R.; Li, Y.; Zou, H.; Zhang, W.; Li, Q. Carbon emissions from energy consumption in China: Its measurement and driving factors. Sci. Total Environ. 2019, 648, 1411–1420. [Google Scholar] [CrossRef] [PubMed]
  12. Feng, X.; Lai, X.; Tian, C. Focusing on the Development Trends of Low-Carbon Standards—The UK PAS 2050 Carbon Footprint Standard. Environ. Prot. 2010, 2010, 74–76. [Google Scholar] [CrossRef]
  13. ISO 14064-1:2018; Greenhouse Gases—Part 1: Specification with Guidance at the Organization Level for Quantification and Reporting of Greenhouse Gas Emissions and Removals. International Organization for Standardization (ISO): Geneva, Switzerland, 2018.
  14. Hao, R. Study on the Spatiotemporal Patterns and Spatial Effects of Carbon Emission Efficiency in the Beijing-Tianjin-Hebei Region Based on Nighttime Light Data. Master’s Thesis, Beijing Normal University, Beijing, China, 2023. [Google Scholar]
  15. Yu, S.; Wei, Y.M.; Guo, H.; Ding, L. Carbon emission coefficient measurement of the coal-to-power energy chain in China. Appl. Energy 2014, 114, 290–300. [Google Scholar] [CrossRef]
  16. Bryant, R.A.; Bundy, M.F.; Zong, R. Comparing Methods for Determining Carbon Dioxide Emissions from Stationary Sources. In Proceedings of the 38th Stationary Source Sampling and Analysis for Air Pollutants Conference, Point Clear, AL, USA, 2–7 March 2014. [Google Scholar]
  17. Whittaker, C.; McManus, M.C.; Hammond, G.P. Greenhouse gas reporting for biofuels: A comparison between the RED, RTFO and PAS2050 methodologies. Energy Policy 2011, 39, 5950–5960. [Google Scholar] [CrossRef]
  18. Schaefer, F.; Blanke, M. Opportunities and Challenges of Carbon Footprint, Climate or CO2 Labelling for Horticultural Products. Erwerbs-Obstbau 2014, 56, 73–80. [Google Scholar] [CrossRef]
Figure 1. Total carbon emissions of seven electrolytic aluminum enterprises (unit: tons).
Sustainability 17 02243 g001
Figure 2. Time series plot of total carbon emissions of 13 cement enterprises (unit: tons).
Sustainability 17 02243 g002
Figure 3. Time series plot of total carbon emissions of 24 ferroalloy enterprises (unit: tons).
Sustainability 17 02243 g003
Table 1. Carbon emission scale and carbon emission intensity of seven electrolytic aluminum enterprises.
Enterprise Code 1Emission Scale 2Monthly Total Emission Range (10,000 tons)Average Monthly Carbon Emission Intensity (tons/ton)Remarks
13Small5–79.73Enterprises in the table are generally arranged by their average monthly total emissions, from smallest to largest.
285–76.83
21Medium15–307.48
3715–306.75
115–307.71
29Large30–406.7
4530–407.16
1 In order to eliminate sensitive information of enterprises, we assign an enterprise code to each enterprise to replace its name. 2 The division of emission scale mainly considers the order of magnitude differences in monthly emissions, combined with the subjective experience of researchers.
Table 2. Monthly average total carbon emission scale and carbon emission intensity results of 13 cement enterprises.
Enterprise CodeEmission ScaleMonthly Average Total Emission (tons)Carbon Emission Intensity (tons/ton)Remarks
23Small0–30.69Enterprises in the table are generally arranged by their average monthly total emissions, from smallest to largest.
240–30.8
100–30.76
22Medium3–60.92
43–60.69
333–60.78
23–60.81
25Large6–100.99
186–100.74
316–100.85
346–100.74
126–100.76
Table 3. Monthly average total carbon emission scale and carbon emission intensity of 24 ferroalloy enterprises.
Enterprise CodeEmission ScaleMonthly Average Total Emission (tons)Carbon Emission Intensity (tons/ton)Remarks
43Small0–26.61Enterprises in the table are generally arranged by their average monthly total emissions, from smallest to largest.
90–26.71
50–29.08
420–253.04
200–27.71
400–24.09
170–26.96
60–26.54
380–26.48
36Medium2–56.3
322–57.13
72–56.52
152–56.66
442–56.37
112–56.18
392–57.26
162–54.48
352–56.96
272–53.8
262–56.2
3Large5–107.93
195–106.3
145–106.51
305–106.14
Disclaimer/Publisher’s Note: The statements, opinions and data contained in all publications are solely those of the individual author(s) and contributor(s) and not of MDPI and/or the editor(s). MDPI and/or the editor(s) disclaim responsibility for any injury to people or property resulting from any ideas, methods, instructions or products referred to in the content.

