Article

The Influencing Factors and Emission Reduction Pathways for Carbon Emissions from Private Cars: A Scenario Simulation Based on Fuzzy Cognitive Maps

1
School of Business, Central South University of Forestry and Technology, Changsha 410004, China
2
School of Public Administration, Hunan University, Changsha 410082, China
3
Chongqing Research Institute, Hunan University, Chongqing 404100, China
*
Author to whom correspondence should be addressed.
Sustainability 2025, 17(5), 2268; https://doi.org/10.3390/su17052268
Submission received: 31 January 2025 / Revised: 2 March 2025 / Accepted: 4 March 2025 / Published: 5 March 2025

Abstract

:
The promotion of carbon reduction in the private car sector is crucial for advancing sustainable transportation development and addressing global climate change. This study utilizes vehicle trajectory big data from Guangdong Province, China, and employs machine learning, an LDA topic model, a gradient descent-based fuzzy cognitive map model, and grey correlation analysis to investigate the influencing factors and emission reduction pathways of carbon emissions from private cars. The findings indicate that (1) population density exhibits the strongest correlation with private car carbon emissions, with a coefficient of 0.85, rendering it a key factor influencing emissions, (2) the development of public transportation emerges as the primary pathway for carbon reduction in the private car sector under a single-factor scenario, and (3) coordinating public transport with road network density and fuel prices with traffic congestion are both viable pathways as well for reducing carbon emissions in the private car sector. This study attempts to integrate multiple factors and private car carbon emissions within a unified research framework, exploring and elucidating carbon reduction pathways for private cars with the objective of providing valuable insights into the green and low-carbon transition of the transportation sector.

1. Introduction

In pursuit of achieving a carbon peak by 2030 and carbon neutrality by 2060, effective promotion of energy conservation and emission reduction has become an urgent and critical issue that necessitates interdisciplinary collaboration and cross-sector cooperation. Road traffic is one of the most rapidly growing sources of carbon emissions in the global transportation sector. Approximately 10.4% of the nation’s total terminal carbon emissions are attributed to carbon emissions from China’s transportation sector in 2022, with road traffic accounting for nearly 90% of these emissions [1]. The rapid proliferation of private cars is a primary factor contributing to the increase in carbon emissions from road transportation. By the end of 2022, China’s private car ownership reached 2.78 billion, with an average annual growth rate of 245.17% over the past decade [2]. To address the challenges posed by the growing number of private cars and carbon emissions, China has implemented a series of low-carbon transportation governance policies and measures such as promoting new energy vehicles and developing public transport. However, because of the constraints in collecting private car energy consumption data and regional disparities in resource endowment, effectively promoting carbon control and emission reduction in the private car sector necessitates not only accurate calculations of private car carbon emissions but also comprehensive consideration of the influential role of economic, technological, and policy factors to propose a viable carbon emission reduction strategy for the private car sector [3,4]. This is crucial for elucidating the mechanisms behind private car carbon emissions, and it is important to formulate targeted and effective emission reduction policies and measures. Our primary objective is to identify the key factors influencing carbon emissions from private cars and determine effective pathways for carbon reduction in private car emissions.
A critical issue in the governance of emission reduction in the private car sector is the accurate and precise calculation of carbon emissions. However, existing research on the calculation of private cars carbon emissions mainly employs methods such as questionnaire surveys, the IPCC’s “top-down” or “bottom-up” approaches, mixed life cycle methods, and estimation based on mileage and energy consumption data [5,6]. Nevertheless, these methods fail to account for the actual deviations of various complex factors in real-world scenarios, resulting in significant discrepancies in the carbon emissions calculated for private cars based on different research approaches [7]. Some scholars have estimated vehicle carbon emissions using onboard carbon emission data and high-resolution smartphone data [8], developed multi-scale high-resolution monitoring platforms and portable emission measurement systems to provide more precise data sources [9,10], and attempted to construct more reliable models employing big data and machine learning technologies [11,12].
Existing research primarily employs methods such as econometrics, system dynamics, and scenario analysis to study the factors influencing carbon emissions from private cars [13,14]. Mechanistic explanations are provided from various aspects, including socioeconomic factors, the individual characteristics of residents, the urban built environment, transportation policies, technological advancements, and traffic planning. Socioeconomic factors encompass economic activities, demographic characteristics, and infrastructure construction, which play crucial roles in measuring regional economic and social development, and are believed to better explain the variation in private car ownership rates [15]. Individual characteristics of residents, such as income levels, driving behavior habits, and travel choices, determine their preferences for using private cars to a certain extent, thus influencing carbon emissions from private cars [16]. The built environment serves as an environmental carrier for human urban living, including factors such as density, the land-use mix, design, the proximity to public transport, and accessibility, all of which are closely related to carbon emissions from private cars [17]. Traffic policy refers to government-implemented measures aimed at regulating the transportation system to achieve emission-reduction goals. Traffic policies can change residents’ travel choices, reduce the use of private cars, and promote the sustainable development of the private car sector [18]. Technological advancements affect the carbon emissions from private cars by improving vehicle travel efficiency, promoting shared mobility, encouraging the application of green technologies, and providing low-carbon behavioral choices for the production and use of private cars [19]. Rational traffic planning can optimize the traffic structure, reduce residents’ preferences for using private cars, and guide residents towards low-carbon travel [20]. In addition, geographic spatial elements, such as vehicle speed, the degree of relief, and the urban layout also impact residents’ demand and motivation to choose private cars for travel [21].
For carbon emission reduction in the private car sector, existing research primarily considers the supply, demand, and environmental aspects. On the supply side, effective measures for controlling environmental pollution in transportation include promoting new energy vehicles, strengthening road infrastructure, and raising vehicle emission standards [22]. On the demand side, the substantial development of public transportation, the encouragement of shared mobility, and guiding residents towards low-carbon travel are effective strategies for reducing the ownership and usage of private cars [23]. On the environmental side, the importance of policies such as traffic restrictions, congestion charges, and raising residents’ environmental awareness cannot be ignored [24]. Furthermore, carbon reduction policy instruments such as carbon taxes and individual carbon trading schemes have been proposed for implementation in the private car sector. These measures aim to enhance the efficacy of carbon reductions in private cars through economic mechanisms, stimulating technological innovation, and promoting sustainable development [25].
Based on the aforementioned research, a few scholars have been able to utilize micro-level real-world scenario data to calculate carbon emissions from private cars. This study attempts to use vehicle trajectory big data for machine learning predictions of private car carbon emissions, providing a potential new calculation method. In addition, existing research often examines the influencing factors of private car carbon emissions from a singular perspective, focusing on individual residents, urban built environments, and socioeconomic factors. There is a lack of comprehensive integration of the various factors influencing carbon emissions from private cars within a unified research framework. This study constructs a comprehensive analytical framework by integrating multiple models and methods to identify the factors influencing carbon emissions from private cars. Furthermore, we simulated different system scenarios to explore carbon emission reduction pathways for private cars. The aim is to provide valuable insights into the management of private car carbon emissions and the formulation of emission reduction policies, contributing to the realization of carbon peaking and carbon neutrality goals, as well as the development of green transportation.
The structure of the paper is as follows: Section 2 predicts carbon emissions from private cars at the city level using machine learning methods based on vehicle trajectory data, and constructs the outcome variable of the fuzzy cognitive map. Section 3 identifies the factors influencing carbon emissions from private cars using the LDA topic model based on Web of Science text data, constructing the factor variables of the fuzzy cognitive map. Section 4 integrates the carbon emissions from private cars (outcome variable) and their influencing factors (factor variables) into the research framework, constructing a fuzzy cognitive map to explore and elucidate the core factors and reduction pathways of carbon emissions from private cars. Section 5 presents the discussion and conclusion. The research framework is illustrated in Figure 1.

2. Materials and Methods

2.1. Data Source

The vehicle trajectory data used in this study were sourced from 21 prefecture-level cities in Guangdong Province (the data collection scope includes the following cities in Guangdong province, China: Guangzhou, Shenzhen, Foshan, Dongguan, Zhongshan, Zhuhai, Jiangmen, Zhaoqing, Huizhou, Shantou, Chaozhou, Jieyang, Shanwei, Zhanjiang, Maoming, Yangjiang, Yunfu, Shaoguan, Qingyuan, Meizhou, and Heyuan), China, with a sample period from 3 September to 9 September 2022. The sampling frequency and time resolution is 1 Hz and 0.01 s, and the spatial resolution is 0.1 m, with an average location error controlled within 10 m [26]. The data primarily include the vehicle ID, trip start and end times, starting and ending point coordinates (in degrees), driving distance (in meters), travel time (in seconds), and fuel consumption (in milliliters), with a total of 428,974 records, as listed in Table 1 [27].
The detailed data-collection process is outlined in the literature [28,29]. The detailed data can be accessed at https://github.com/HunanUniversityZhuXiao/PrivateCarTrajectoryData (accessed on 15 December 2022). Patent data were sourced from the China National Intellectual Property Administration, and data on new energy vehicles came from the “Energy Saving and New Energy Vehicles Statistical Yearbook” and local government websites. Fuel price data were sourced from Eastmoney (https://data.eastmoney.com, accessed on 15 December 2022). The remaining data came from the “Guangdong Statistical Yearbook”, which is supplemented by statistical yearbooks from each prefecture-level city, along with the National Economic and Social Development Statistical Bulletin.

2.2. Research Method

2.2.1. Machine Learning Methods

The vehicle trajectory data used in this study are a large-scale individual-level dataset that does not provide a time-series trend for carbon emissions from private cars at the urban level. Therefore, traditional regression models are inadequate for predicting urban private car carbon emissions. Machine learning algorithms, with their superior nonlinear modeling and adaptability, are better at capturing the mapping relationship between vehicle input features and carbon emissions, providing reliable support for predicting carbon emissions from private cars at the urban level based on individual vehicle data.
In this study, back propagation (BP) neural network, support vector machine (SVM), and random forest (RF) models are used as comparative simulation models for predicting carbon emissions from private cars. The BP neural network can automatically adjust weights through the backpropagation algorithm, adapt to different data distributions, and capture complex nonlinear relationships. The SVM is particularly effective in handling data in high-dimensional spaces, and its regularization mechanism helps prevent overfitting. RF is capable of efficiently handling large-scale datasets and optimizing the model performance through feature selection and importance assessment. By comparing the simulations of the BP, SVM, and RF models, we can capture the distinct characteristics of each model, thereby improving the accuracy and stability of the predictions.
The BP neural network model is a type of feedforward neural network with error backpropagation based on the gradient descent method. It possesses excellent nonlinear mapping capabilities and consists of an input layer, a hidden layer, and an output layer. In this study, a three-layer feedforward neural network is constructed using MATLAB 2018a, where X = ( x 1 , x 2 , x n ) T represents the input vector, V = ( v 1 , v 2 , v n ) T represents the hidden layer vector, and Y = ( y 1 , y 2 , y n ) T represents the output vector. The output of the n -th neuron in the hidden layer is calculated as follows:
v n = f ( m = 1 m w m n x m a n )   ( n = 1,2 , k ) .
In the equation, v n is the output value of hidden layer node n , w m n is the weight between node m and node n , a n is the threshold of node n , and f is the activation function. The output of the j -th neuron in the output layer is given by:
y j = f ( n = 1 n w n j v n b j )   ( j = 1,2 , , k ) ,
where y j is the output value of node j in the output layer, w n j is the weight between nodes n and j , and b j is the threshold for node j . Considering the tendency of backpropagation neural networks to get stuck in local optima and the limitations of fitting generalization ability when optimizing complex objective functions, this study employs SVM and RF models using R Studio (2024.04.2) for simulation and comparison. The SVM utilizes the kernel function principle, mapping data from a low-dimensional space to a high-dimensional space, effectively avoiding the “curse of dimensionality” and enhancing the fitting capability for nonlinear data. For a given sample ( x i , y i ) , the SVM model employs high-dimensional mapping from the feature space R n to R m and then approximates the linear function in the feature space:
y = f x = w , φ x + b ,
where w and f x are m-dimensional vector data, b is the function threshold, and y is the value of the function after dot product processing. The regression function obtained by fitting the minimum objective function in the SVM is as follows:
m i n   w , b : 1 2 w 2 + c i = 1 n | y i [ w , φ ( x i ) b i ] | ,
where c represents the penalty coefficient controlling the model loss 1 2 w 2 and training model complexity, and i = 1,2 , n represents the number of support vector machine points. The RF model consists of multiple decision trees, capable of aggregating randomized data and variables to generate results from multiple trees, exhibiting strong data-mining capabilities and prediction accuracy. It can effectively address the issue of nonlinear “overfitting”. The classification formula for the RF model is as follows:
f x = m { h i x i n } i = 1 t r e e ,
where x i n represents the i -th test sample with n attribute features, h i x i n is the prediction result of the i -th decision tree, m is the maximum predicted classification result, and t r e e is the number of decision trees. This study fits the carbon emissions of private cars based on their travel time, travel mileage, and fuel consumption. The fitting performance is compared using regression evaluation metrics, such as the root mean square error, mean absolute error, and mean square error. Smaller values of these metrics indicate a better model performance. After simulating and comparing the three machine learning models, the optimal model is selected to predict the carbon emissions from private cars. The expected carbon emissions of private cars are calculated using the IPCC road transport “bottom-up” method, with the following formula:
T C O 2 = i = 1 n Q i E F i ,
where T C O 2 represents the carbon emissions of private cars, Q i is the consumption of the i -th type of fuel, and E F i is the emission factor for the i -th type of fuel. Because the vast majority of fuel types in the big data of vehicle trajectories collected in this study are gasoline, with only a small amount of hybrid fuel, E F i is calculated using the vehicle gasoline emission factor from the 2019 refinement to the 2006 IPCC guidelines for national greenhouse gas inventories.

2.2.2. LDA Topic Model

LDA is an unsupervised topic classification method that provides document topics in a probability form and clusters or categorizes documents based on these topics. It is widely applied in generating hot topics, mining important influencing factors, and in other areas [30]. The fundamental assumption is that documents are composed of multiple latent topics, and that these latent topics are composed of specific feature words. The feature words in a document are obtained through a process of “choosing a feature topic with a certain probability and selecting a specific feature word from this topic with a certain probability.” The formula for calculating the probability of occurrence of each feature word is as follows:
P ( w o r d \ d o c u m e n t ) = t o p i c P ( w o r d \ t o p i c ) × P ( t o p i c \ d o c u m e n t ) .
The LDA topic model consists of three layers: word, topic, and document layers. The word layer set is C = { C 1 , C 2 C n } , representing the collection of document words in the text data after tokenization and the removal of numbers, prepositions, conjunctions, and stop words. The topic layer set is T = { T 1 , T 2 T n } , where any topic T i in the set T is a probability multinomial distribution of the word layer set C and can be represented by a topic vector P . The document layer set is D i = { d i , 1 , d i , 2 d i , n } , indicating a relationship set of word frequency vectors. The set d i , j is the number of times word j appears in document i. Compared with the topic layer, the collection of document layers can be represented as the probability distribution of document topics θ = { θ 1 , θ 2 θ n } . Therefore, any vector can be obtained through θ d = p d , 1 , p d , 2 , p d , i , where p d , i is the probability of topic i appearing in document d . This study constructs the LDA topic model to identify hot topics related to carbon emissions from private cars. The process involves three main steps: text preprocessing, model construction, and topic identification.

2.2.3. Construction of Fuzzy Cognitive Maps Based on Gradient Descent Method

The method of constructing fuzzy cognitive maps based on gradient descent involves the application of neural network learning principles to discover the concepts and representation methods of fuzzy cognitive maps from objective data resources. The construction of traditional fuzzy cognitive map models relies heavily on expert knowledge and experience, often making them challenging to implement owing to inherent limitations. Enhancing the construction of fuzzy cognitive maps through dynamic simulation behavior can improve the adaptability and robustness of the model. Therefore, this study attempts to use the gradient descent method of neural networks to establish and optimize the weight coefficient matrix of fuzzy cognitive maps, aiming to identify the key influencing factors in private car carbon emissions. The specific assumptions of the model construction are as follows: (1) Organize objective data resources to obtain m data nodes N 1 , N 2 , N m . (2) Each node N i is influenced by other nodes N j ( i j ) , with the degree of influence denoted as w i j . If no relationship exists between N i and N j , then w i j = 0 . (3) The nodes do not have an impact on themselves. Based on these assumptions, the cognitive map with m nodes is considered as a “single-layer neural network graph”, where m nodes represent m neural elements, and the weight coefficient matrix is obtained as 0 w 1 m w m 1 0 . The specific optimization formula for the model is shown in Equation (8), aiming to minimize the error between the theoretical output and the actual output generated by the activation function among the m nodes.
min w = i = 1 m j = 1 n ( d j i y j ( i ) ) 2 y j i = f ( t = 1 j 1 w t j d j i + t = j + 1 m w t j d j i ) ,
where w is the weight matrix, m and n are the number of attributes and records in the data, respectively. d j i is the normalized actual output value, and y j ( i ) is the theoretical output value. The gradient descent method involves iterative processes to find the optimal weight coefficients w i j , aiming to minimize the objective function. The weights are updated based on the gradient values, as shown in Equation (9), where q is the iteration variable, and ρ is the learning factor.
δ i j = g ( w ) w i j ( q ) w i j q + 1 = w i j q + ρ δ i j .
A fuzzy cognitive map is an extended form of a cognitive map that uses graphical representations to simulate the expression and inference of interrelationships in complex systems. Fuzzy cognitive maps can be expressed in the form of a quadruple ( M , E , X , F ) , where M = { M 1 , M 2 , M n } is the set of factor nodes in the fuzzy cognitive map. E is the association matrix of the fuzzy cognitive map, E : e i , e j w i j , w i j [ 1,1 ] represents a mapping relationship reflecting the association between nodes e i and e j , w i j > 0 indicates a positive association between nodes e i and e j , w i j < 0 indicates a negative association between nodes e i and e j , and w i j = 0 indicates no association between nodes e i and e j . X : e i x t represents the state of node e i at time t , X t = [ x 1 t , x 2 t , , x n t ] . F is the threshold function, and this study chooses a sigmoid function. Fuzzy cognitive maps implement iteration, inference, and prediction using the following formula:
x i t + 1 = F ( i = 1 , j i x j t w i j ) .

2.2.4. Grey Relational Analysis

The fundamental concept behind grey relational analysis is to utilize the geometric shape between curves to assess the degree of correlation between factors or sequences. This reflects the strength of the correlation between the independent and dependent variables, making it particularly suitable for dynamic simulation studies [31]. Fuzzy cognitive maps, on the other hand, excel at capturing the dynamics of causal relationships within a system. By introducing grey relational analysis based on fuzzy cognitive maps, this study can determine the key factors influencing private car carbon emissions based on the order of correlation. Assuming the reference sequence and comparison sequence are X 0 = x 0 1 , x 0 2 , x 0 t , X i = x i 1 , x i 2 , x i t ( i = 1,2 , n ) , the relational relationship R between the two sequences is expressed as:
R X 0 , X i = 1 n k = 1 n r ( x 0 k , x i k ) ,
where r x 0 k , x i k is the grey relational degree of sequence X 0 and sequence X i , the calculation formula is as follows:
r x 0 k , x i k = m i n i m i n k x 0 k x i k + ρ m a x i m a x k x 0 k x i k x 0 k x i k + ρ m a x i m a x k x 0 k x i k .

3. The Prediction of Carbon Emissions from Private Cars

The BP neural network, SVM, and RF models are all composed of training and testing sets in a 7:3 ratio. The number of hidden layer neurons in the BP neural network model is set to 8, the kernel function of the SVM model is set to a radial basis function, and the number of decision trees in the RF model is set to 50. The evaluation metrics for the fitting results for each model are listed in Table 2. It can be observed that the root mean square error (RMSE), mean absolute error (MAE), and mean square error (MSE) of the RF model are all smaller than those of the other two models. Therefore, in this study, the RF model is selected as the prediction model for carbon emissions from private cars.
The steps for predicting carbon emissions from private cars in prefecture-level cities are as follows: (1) Train the RF model based on vehicle trajectory big data. (2) Import data on private car travel mileage, travel times, and fuel consumption for prefecture-level cities in Guangdong province. (3) Use the pretrained RF model to make predictions. This study adopts the conversion of private car ownership in each city to estimate private car carbon emissions [32]. The daily average mileage for private cars is set to 27.32 km, with an average fuel consumption of 6.65 L per hundred kilometers and a daily average travel time of 0.81 h (2022 Automotive Aftermarket Market Conditions Report White Pape. https://www.pcauto.com.cn (accessed on 2 February 2022)). The prediction results are shown in Figure 2. In this study, ArcGIS 10.2 is employed, using the natural break method based on carbon emission magnitudes to categorize the carbon emissions from private cars in prefecture-level cities into five classes for visual analysis. Areas with high amounts of carbon emissions from private cars are economically developed regions such as Guangzhou, Foshan, Shenzhen, and Dongguan, exhibiting a clear regional clustering phenomenon. Carbon emissions from private cars show a significant decreasing trend from central cities to peripheral cities.

4. The Influencing Factors Analysis of Private Car Carbon Emissions

4.1. The Identification of Influencing Factors

4.1.1. Corpus Collection and Topic Model Construction

This study selects papers indexed in the Web of Science core collection as research objects, aiming to extract abstracts from these papers to build a corpus for exploring the factors influencing carbon emissions from private cars. The Web of Science database is chosen because of its reputation as a well-known academic database that encompasses the high-quality scholarly literature from various disciplines. It provides scientific research resources that are conducive to an in-depth exploration of the factors affecting carbon emissions from private cars.
First, using the keywords “private car” and “carbon emission”, the study conducts a topic search in the Web of Science core collection, resulting in 177 relevant papers. Subsequently, the abstracts of 177 papers are exported, yielding a corpus of 41,959 words. Next, the study utilizes the tm library in R Studio to preprocess the text of the abstracts. This preprocessing involves converting text to lowercase, removing punctuation and stop words, and removing text spaces. These steps aim to enhance the effectiveness of the textual data, ensuring that the constructed model generates topics composed of meaningful words. Before constructing the topic model, it is essential to determine the optimal number of topics. This study employs the perplexity metric to evaluate the model fit, where a lower perplexity corresponds to a more optimal number of topics. Assuming a range of topics from 1 to 30, we calculate the perplexity values and their changes for different topic numbers based on the principle of “lower perplexity and a moderate number of topics”. The perplexity decreases negatively when the number of topics is 19, indicating a decrease in perplexity. Therefore, 19 is chosen as the optimal number of topics. For the processed text, the study uses the LDA function from the topic models module in R studio to extract topic words. Finally, out of the identified 19 topics, 14 effective topics related to the factors influencing carbon emissions from private cars are manually curated by the authors. The clustering results for the topic words are presented in Table 3.

4.1.2. Topic Summarization and Selection of Influencing Factors

Environmental economics theory posits that resources are finite, while human needs are infinite. To effectively meet unlimited human needs with limited resources, it is necessary to allocate the resources efficiently. However, the “invisible hand” of the market mechanism may fail to allocate environmental resources. Pigou argued that a free-market economy is not always efficient, leaving ample room for government intervention. Therefore, studying the impact of market economic activities on the environment and formulating environmental policies is the main focus of environmental economics. Private car carbon emissions, as a non-market commodity that causes negative externalities leading to ecological degradation, can provide an analytical framework for the impact of economic factors, price mechanisms, and environmental policies on private car carbon emissions from the perspective of environmental economics. In light of this, this study categorizes topics 6, 9, and 12 as environmental economic factors, selecting the economic development level ( g d p ) and traffic environmental policies ( p o l ) as influencing factors on private car carbon emissions. For instance, the regional level of economic development can influence residents’ quality of life and purchasing power, thereby affecting demand for private cars. The implementation of environmental policies can influence the behavioral choices of firms and residents through legal constraints and economic incentives, enhancing residents’ inclination to use clean energy.
Urban planning theory suggests that the development and design of cities should consider comprehensiveness, fairness, and sustainability. Urban planning should comprehensively consider the integrated effects of various factors, including the economic, social, and environmental aspects, and balance the relationships between different stakeholders. This involves the rational use of land, the improvement of urban spatial layouts, achieving the efficient operation and coordinated development of cities, a focus on protecting the ecological environment, and further promoting the use of low-carbon, green, and clean energy for sustainable development [33]. Consequently, the primary focus of urban planning is the examination of urban structures, transportation networks, and spatial layout. Private cars, as a significant component of road traffic, must be considered in balance with other modes of transportation. The rational planning and the designing of road networks and transportation hubs are crucial for improving the efficiency of urban transportation systems and promoting coordinated development, with an emphasis on protecting the ecological environment. This is vital for advancing low-carbon, green, and sustainable development in the road-transportation sector. Therefore, the study categorizes topics 3, 4, 7, and 14 as urban planning factors and selects population density ( p o p ), road network density ( r o d ), traffic congestion ( t r a f ), and public transport scale ( p u b ) as influencing factors on private car carbon emissions. Population and road network densities can affect urban transportation demand, road connectivity, and accessibility, thereby influencing the frequency and timing of residents’ use of private cars. Alleviating traffic congestion and building low-carbon transport cities oriented towards public transit are key strategies for reducing carbon emissions from private cars. This can enhance urban traffic circulation and efficiency, contributing to sustainable urban transportation development.
The neoclassical school of technological innovation believes that appropriate government intervention can promote technological innovation [34]. In the field of private cars, the government can stimulate progress in low-carbon technologies and enhance energy efficiency by implementing innovation policies and providing R&D funding. The Schumpeterian school of technological innovation emphasizes entrepreneurs as the main driving force behind innovation. Entrepreneurs can make innovative decisions to develop more energy-efficient and environmentally friendly car technologies or provide shared mobility services to reduce carbon emissions from private cars. The institutional innovation school of technological innovation argues that technological and institutional innovations interact with each other. For example, the government can reduce the demand for private cars by implementing traffic policies and promoting the development of public transportation. The national innovation system school of technological innovation suggests that technological innovation is driven by the national innovation system. The government can promote the widespread adoption of new energy vehicles by providing subsidies or tax exemptions, improving infrastructure, such as charging stations, and supporting research and development. These schools offer different perspectives on the motives, processes, and impact of technological innovation. However, they all agree that technological progress can reduce energy consumption and lower carbon emissions. In the context of factors influencing carbon emissions from private cars, the theory of technological innovation can provide an analytical framework for understanding the impact of technological innovation, energy structure, and the urban innovation environment. Therefore, this study categorizes topics 2, 5, 11, and 13 as factors related to technological progress, selecting technological innovation ( i n o ), new energy vehicle numbers ( n e w ), and research and development (R&D) investment ( r e s ) as factors influencing private car carbon emissions. Technological innovation can reduce carbon emissions from private cars by promoting technological progress and improving fuel efficiency. The promotion of strategic emerging industries, represented by new energy vehicles, is a crucial initiative to drive the transformation of the energy structure in the transportation sector, reducing dependence on traditional fuel-powered private cars. R&D investment aims to drive technological innovation, achieve economies of scale, enhance the market competitiveness of enterprises, and promote clean energy use.
The theory of consumer behavior posits that residents’ decision-making processes in purchasing and using goods involves rational and conscious calculations. Given their preferences, product availability, and related product prices, residents make purchasing decisions for necessary goods based on their income, with the objective of maximizing utility [35]. In other words, the theory of consumer behavior helps understand the motivations and behaviors of households and individuals when buying and using private cars. This includes considerations between carbon emissions and economic costs, whether residents tend to purchase more energy-efficient and environmentally friendly cars or opt for low-carbon travel methods. In the context of the factors influencing private car carbon emissions, the theory of consumer behavior can provide an analytical framework for understanding the impact of personal disposable income and environmental awareness on private car carbon emissions. Therefore, this study categorizes topics 1, 8, and 10 as consumer behavior factors and selects personal disposable income ( i n c ) and fuel price ( o i l ) as factors influencing private car carbon emissions. Resident income reflects the demand for private cars. The economic cost of using a private car is relatively high for low-income residents, making them more likely to opt for other low-carbon transportation options. Fuel prices are key factors that influence residents’ preferences for fuel-powered vehicles. High fuel prices directly or indirectly reduce the frequency and demand for private car usage. The factors affecting carbon emissions from private cars, as summarized in this study, are listed in Table 4.

4.2. Variable Setting

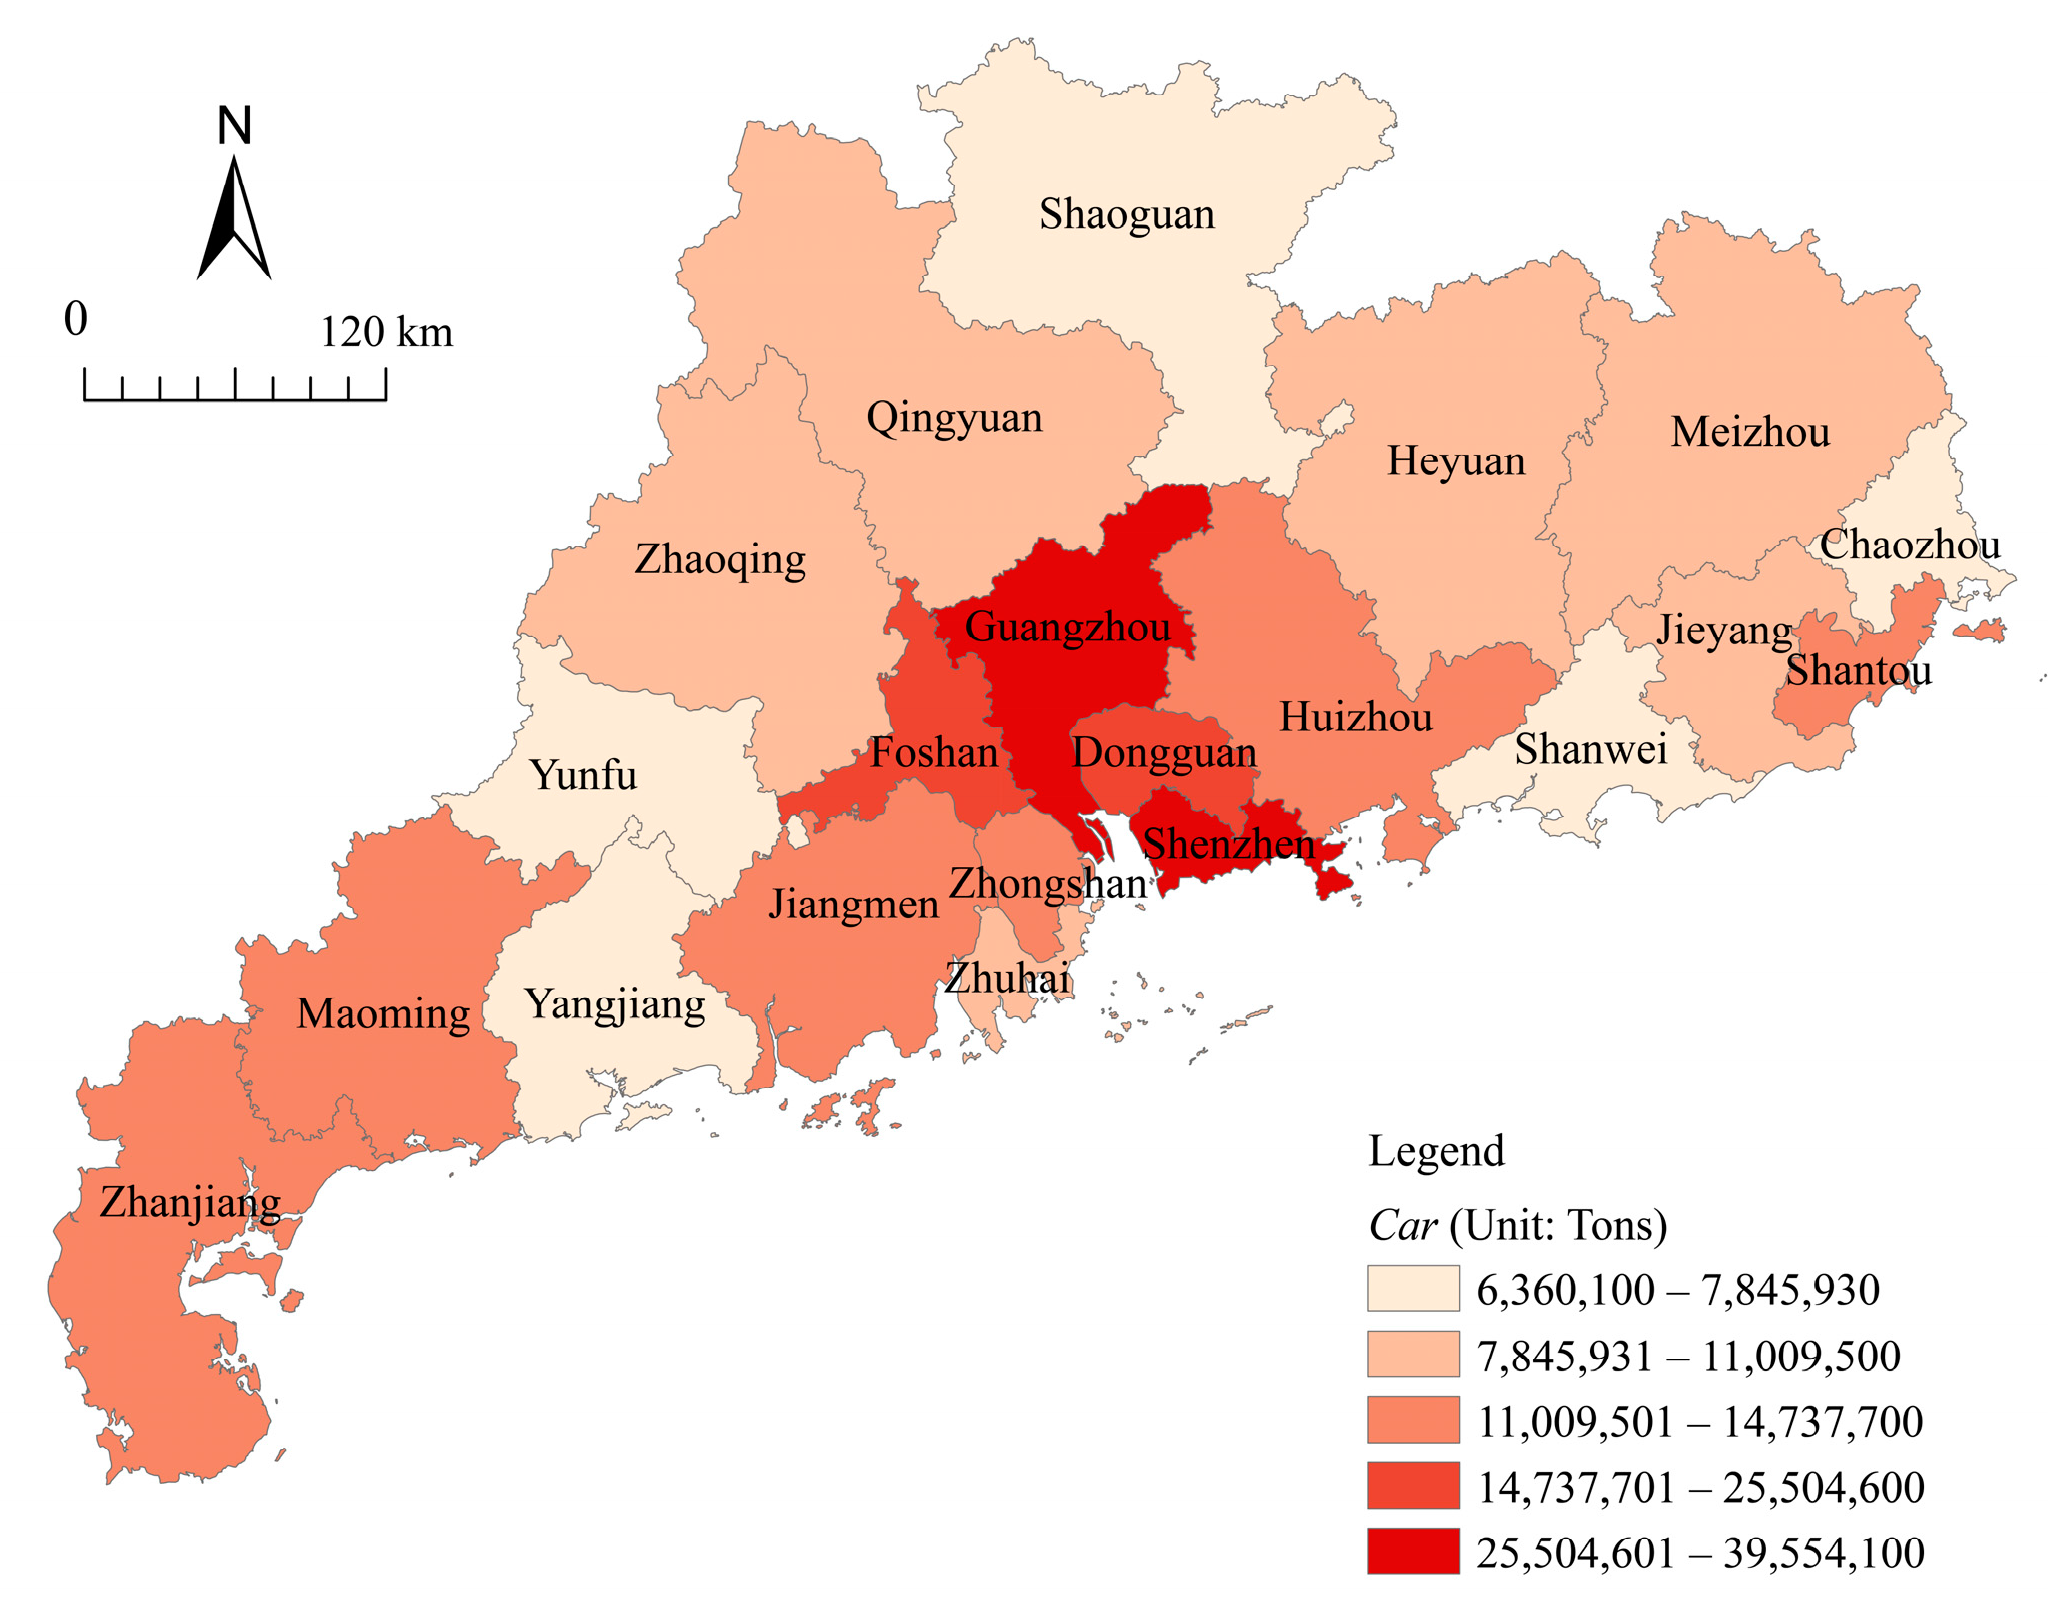
  • The dependent variable was the amount of carbon emissions from private cars ( c a r ). We predicted carbon emissions for each prefecture-level city in Guangdong Province using the RF model based on vehicle trajectory big data.
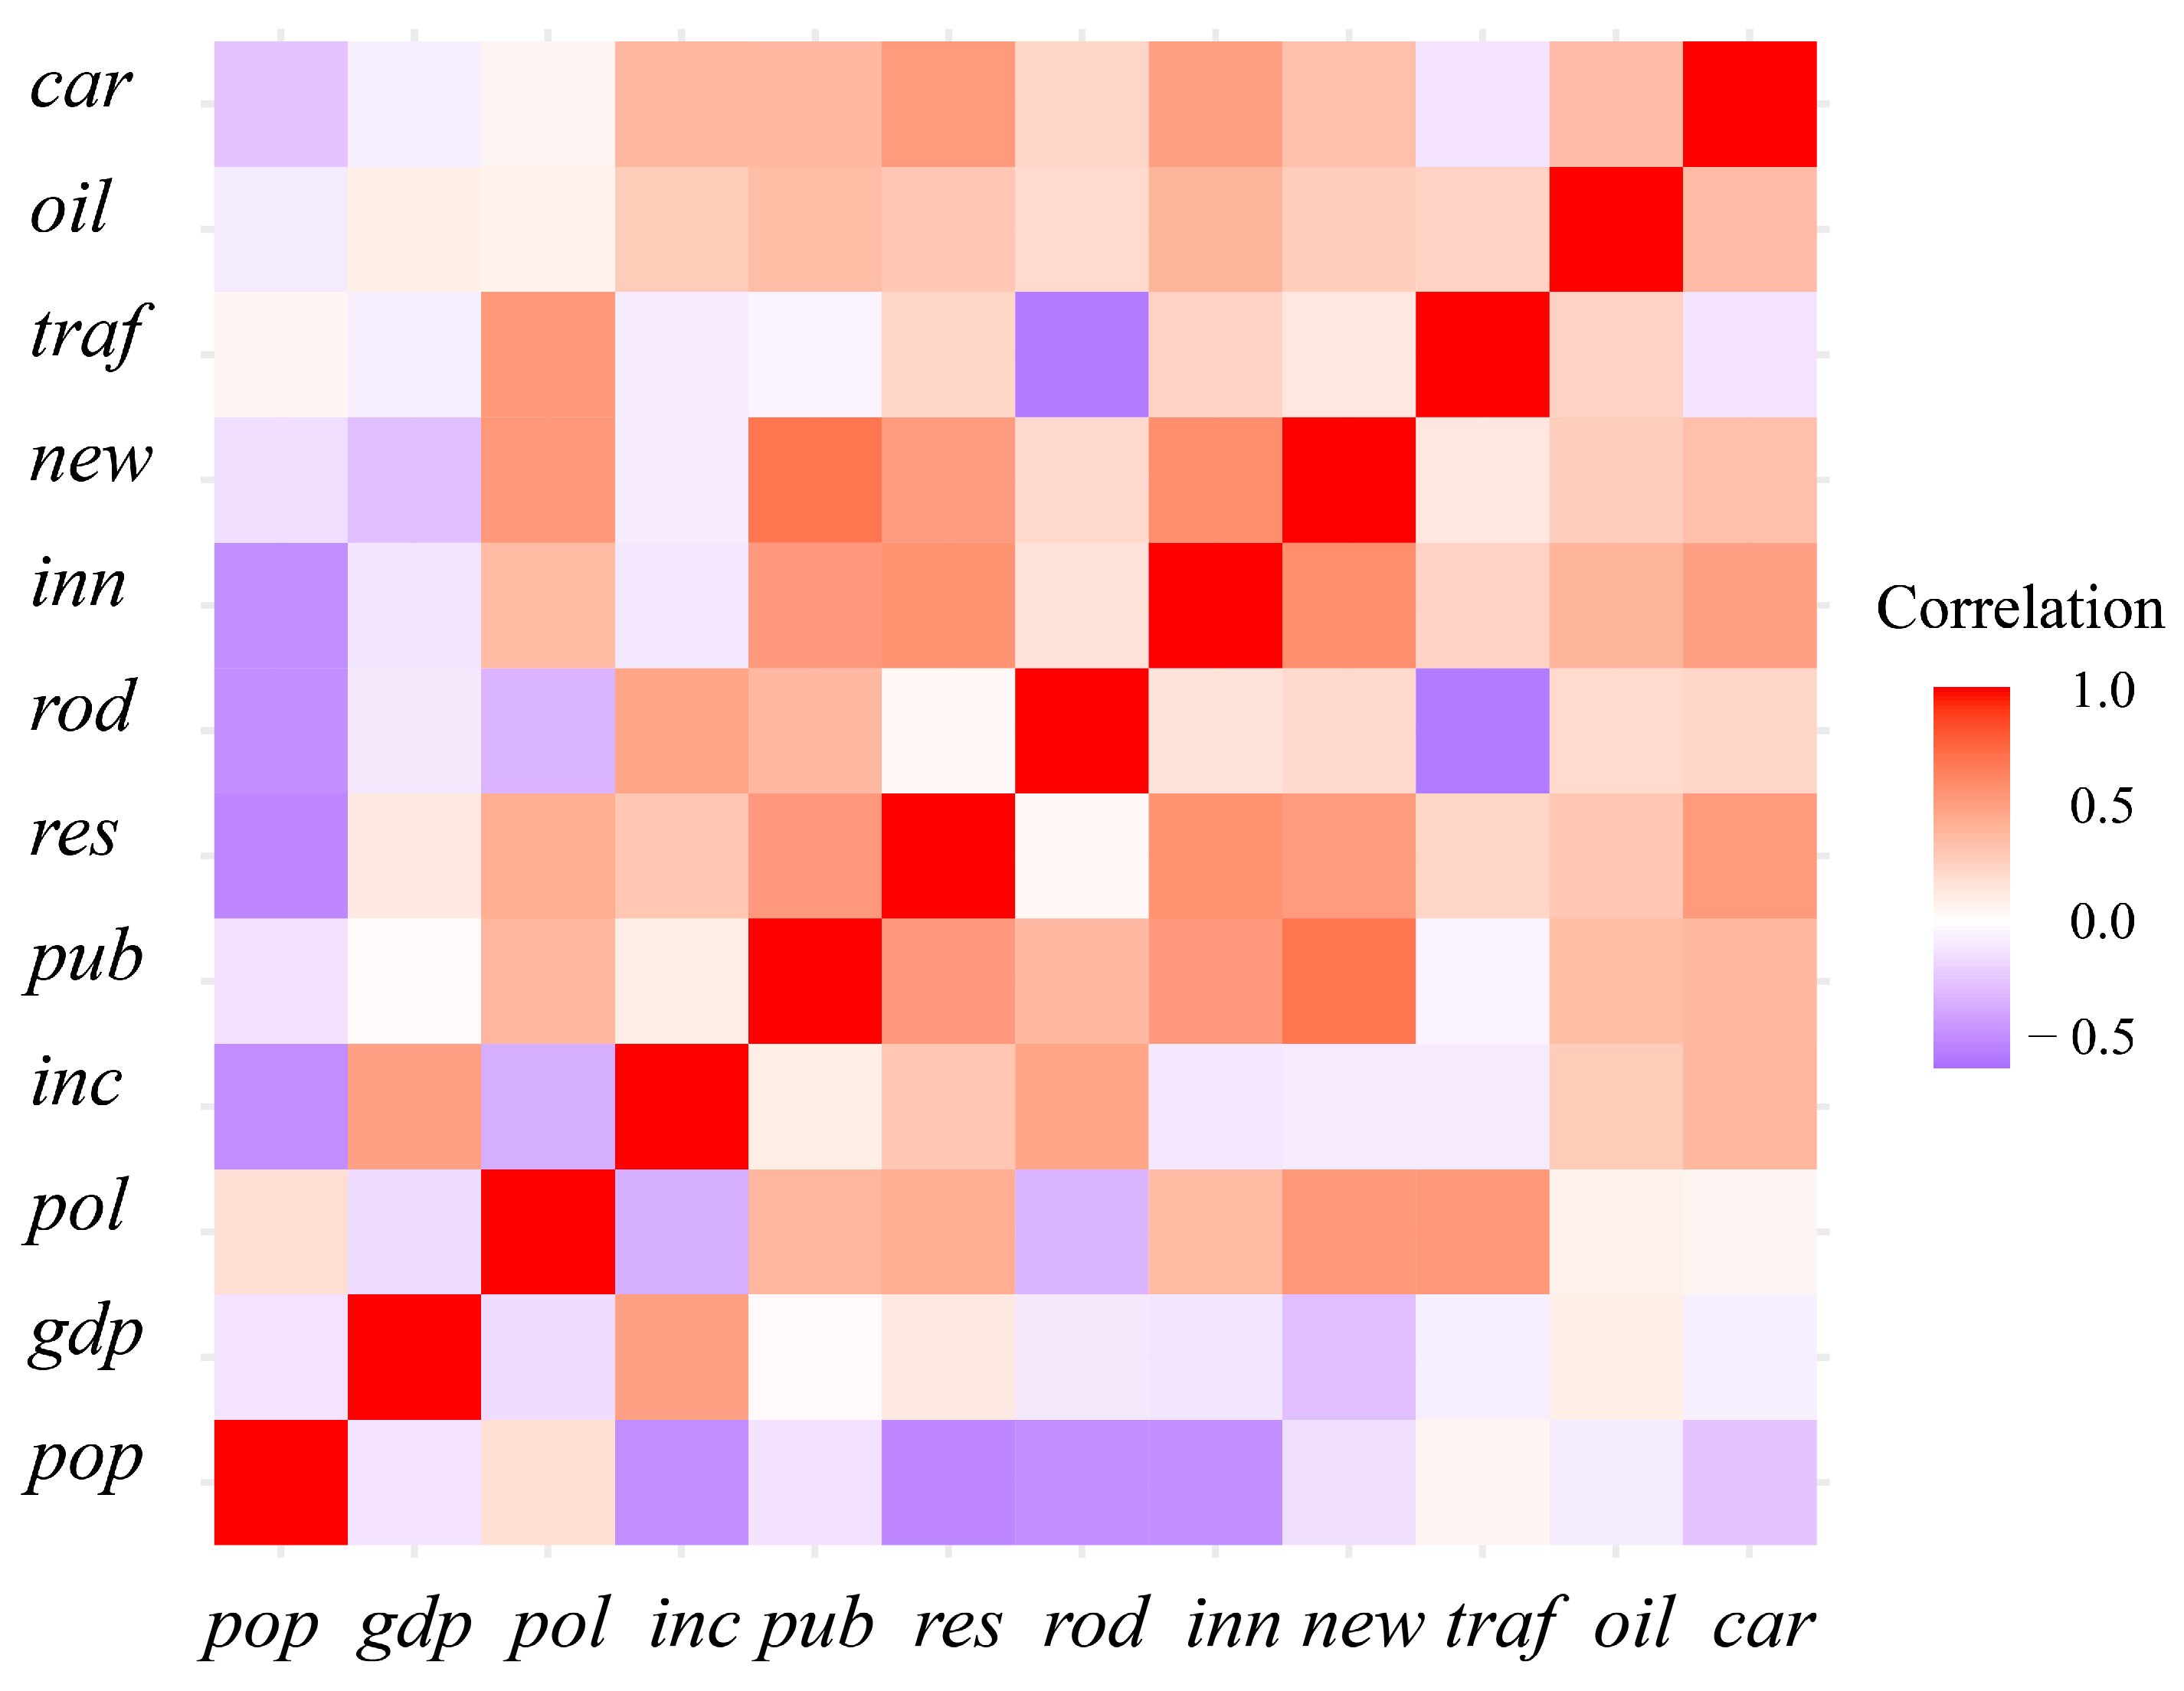
  • Independent variables included the following: (1) Population density ( p o p ) was measured as the ratio of the urban population to the regional area. (2) Economic development level ( g d p ) was measured by GDP per capita. (3) Traffic environmental policy ( p o l ). If the prefecture-level city is included in a low-carbon transportation pilot program (Beijing, Kunming, and 16 other cities have been selected for the second batch of low-carbon transportation pilot programs. Chinese government website. https://www.gov.cn (accessed on 9 February 2012)), it is assigned a value of 1; otherwise, it is 0. (4) Resident income ( i n c ) was measured by the per capita disposable income of urban residents. (5) The public transport scale ( p u b ) was measured by the number of operating public gas (electric) vehicles in the city. (6) R&D investment ( r e s ) was measured by the total research and experimental development expenditure in the city. (7) Road network density ( r o d ) was measured as the ratio of urban road length to regional area. (8) Technological innovation ( i n n ) was measured by the number of patent applications in the B60L category according to the International Patent Classification Table published by the China National Intellectual Property Administration. (9) New energy vehicles ( n e w ) amounted to the number of new energy vehicles promoted in the city. (10) Traffic congestion ( t r a f ) was measured by the weighted average of vehicle speed for individual vehicles based on trajectory data, representing the average driving speed of cars at the city level. (11) Fuel price ( o i l ) was measured by the ratio of urban fuel prices to residents’ disposable income, reflecting the real effect of fuel prices in the city.

4.3. Fuzzy Cognitive Map Analysis

In the fuzzy cognitive map, there are concept nodes representing the dependent variable (result concept nodes) and concept nodes representing the independent variables (factor concept nodes). In this study, private car carbon emissions serve as the result variable, and the influencing factors of private car carbon emissions serve as the factor variables. The weight coefficient matrix constructed using the gradient descent method is illustrated in Figure 3. Economic development level, resident income, research and development investment, and technological innovation are positively correlated with private car carbon emissions, while population density, traffic environmental policies, road network density, new energy vehicles, public transport scale, traffic congestion, and fuel prices are negatively correlated with private car carbon emissions. This provides a novel perspective for exploring the influencing factors and emission reduction pathways of private car carbon emissions through the application of data-mining techniques.
Given the weight coefficient matrix W obtained through gradient descent, and considering that all factor nodes exhibit neutral effects on the result node (with an initial state value of 0), the initial state of each factor node converges to a final state through iteration according to Equation (10), based on the operational mechanism of the fuzzy cognitive map. The reference sequence P is formed by iterating the state values of private car carbon emissions at each step of the result node, and the comparison sequence X is formed by iterating the state values at each step of the factor node. The correlation between sequence P and sequence X is calculated using Equation (11), and the grey relationship between each influencing factor and private car carbon emissions is obtained to determine the correlation between each influencing factor and private car carbon emissions. The grey relational degree values calculated using the R Studio are presented in Table 5. The magnitudes of the grey relational degree values indicate the influence strength and order of each factor on carbon emissions from private cars.
The grey correlation degree between population density and private car carbon emissions reaches the highest value of 0.85, showing the strongest correlation among all factors. Technological innovation follows, demonstrating a correlation of 0.80 with private car carbon emissions. Next are research and development investment and traffic congestion, with correlations of 0.75 and 0.70 with private car carbon emissions. Fuel prices, traffic environmental policies, road network density, and new energy vehicles exhibit correlations of 0.5, 0.45, 0.45, and 0.40, respectively. The correlation between the public transport scale, resident income, and economic development level with private car carbon emissions is relatively low, at only 0.30.
The correlation between population density and private car carbon emissions is significantly stronger than that with technological and economic factors, which may stem from the path dependence in urban development. The strong correlation between population density and private car carbon emissions reflects the locking effect of the urban spatial form. On the one hand, residents are the direct users of private cars. Areas with a high population density tend to have a higher demand for private cars. In the absence of sufficient public transport infrastructure, an increase in population density leads to overcrowded urban spaces, traffic congestion, and other issues, exacerbating carbon emissions, whereas compact cities, which shorten commuting distances and improve public transport accessibility, can more directly reduce dependence on private cars, thereby reducing energy consumption and carbon emissions. Population density, through altering travel patterns and adjusting urban spatial structures, is a key variable influencing private car carbon emissions. Nevertheless, focusing solely on the optimization of population density may prove to be counterproductive. This necessitates the scientific configuration of urban spatial layouts, the optimization of intelligent transportation management, and the effective conversion of density advantages into low-carbon benefits.
Technological innovation and R&D investment show a high degree of correlation with carbon emissions from private cars. However, a weak correlation with new energy vehicles indicates barriers to technology adoption. The promotion of low-carbon technologies depends not only on the technology itself, but also on the lag in infrastructure updates. Taking new energy vehicles as an example, the coverage of charging infrastructure and regional differences in grid capacity may lead to significant variations in the effectiveness of new energy vehicle promotion, even with the same level of R&D investment. Therefore, the government should emphasize regional differentiation, prioritize infrastructure planning, augment infrastructure investment, establish phased objectives for promoting low-carbon innovative technologies, and comprehensively consider future technological trends, market demand fluctuations, and the long-term development of infrastructure.
Economic factors, such as fuel prices, resident income, and economic development levels, show a relatively low correlation with private car carbon emissions. This may be because transportation policies and low-carbon technologies offset the effects of economic factors. For example, government subsidies for new energy vehicles reduce residents’ reliance on fuel-powered cars, while low-carbon transport policies and strict fuel emission standards mitigate the impact of economic factors through technological barriers. Furthermore, improvements in public transport infrastructure and the optimization of work-residence proximity reduce residents’ reliance on private cars. The increased environmental consciousness among residents suggests that even with rising incomes, there is no corresponding increase in private car usage.

5. The Carbon Emission Reduction Pathway Analysis of Private Cars

This paper proposes the following carbon reduction pathways: first, promoting technological innovation and new energy vehicles to enhance fuel efficiency and facilitate clean energy transition in transportation; second, developing public transport and optimizing urban planning to encourage more compact travel patterns and optimize population density to reduce private car usage intensity; third, enhancing road network infrastructure to improve travel accessibility for private cars; fourth, regulating fuel prices to reduce total private car trips; fifth, integrating intelligent traffic systems and promoting shared mobility solutions to optimize the utilization of existing transport infrastructure and reduce carbon emissions.
This study attempts to simulate different system scenarios to analyze the impact of various factors on private car carbon emissions after being subjected to shocks. The initial iteration values for each factor are set to 1, 0.5, and 0.1, representing heavy, moderate, and light shocks within the system, respectively, while the remaining factors are assigned neutral initial iteration values. When the system iterations reach a stable value, the difference between the final stable carbon emissions and the initial iteration value is compared to reflect the impact of different factors on private car carbon emissions after being subjected to shocks.

5.1. Single Factor Scenario Analysis

Table 6 shows the impact of different factors on private car carbon emissions after being subjected to shocks. When the other factors in the system remain neutral, as the shock intensity increases, the absolute impact of all factors on private car carbon emissions tends to increase. The findings suggest that as shock intensity escalates, the influence of individual factors on private car carbon emissions becomes more pronounced. Notably, technological innovation exhibits a positive correlation with private car carbon emissions, implying that advancements in technology have not mitigated emissions but rather they have triggered a “rebound effect”. Specifically, although technological innovation improves energy utilization efficiency, it may also reduce product costs and prices, leading to increased demand and consumption. This results in energy savings from technological innovation being offset by additional energy consumption, causing an energy rebound effect. In other words, technological innovation can reduce per-mile carbon emissions from private cars by improving energy efficiency. However, this may also result in a reduction in the cost and price of related products in the private car sector, thereby stimulating consumer demand and consumption. As a result, the carbon emissions mitigated through improved energy efficiency are counterbalanced by increased consumption, ultimately resulting in an increase in private car carbon emissions.
The impact of population density, road network density, public transport scale, traffic congestion, fuel prices, and new energy vehicles on private car carbon emissions is negative. This suggests that optimizing population density, improving road network density, developing public transport, alleviating traffic congestion, raising fuel prices, and promoting new energy vehicles are all effective and feasible paths for reducing carbon emissions in the private car sector. Among these factors, public transport has the largest absolute effect on private car carbon emissions after being subjected to shocks (0.007, 0.037, and 0.072), indicating that the development of public transport is the primary and most effective path for mitigating carbon emissions in the private car sector. Therefore, to progressively attain carbon reduction objectives in the private car sector, priority should be given to the development of public transport, promoting more concentrated travel patterns, improving road traffic network layouts, reducing urban traffic congestion, enhancing transportation accessibility, and advocating for collaborative emission reduction involving the government, businesses, and residents. This will help drive the low-carbon transition in the urban private car sector.

5.2. Two-Factor Mix Scenario Analysis

Focusing solely on individual factors in carbon reduction in the private car sector may not fully account for the changes brought about by external factors. Therefore, it is necessary to consider the synergistic effects of multiple factors on private car carbon emissions. This study aims to simulate the impact of multiple scenarios on carbon emissions from private cars, including a technological advancement scenario (incorporating the promotion of new energy vehicles and technological innovation), an infrastructure development scenario (incorporating public transport scale and road network density), a consumer behavior scenario (incorporating fuel prices and traffic congestion), and a differentiated population density scenario, each under heavy, moderate, and light shocks. The aim is to explore carbon reduction pathways in the private car sector through multi-factor combinations (Table 7).
1.
Technological advancement scenario. With other factors in the system held as neutral, the shock degree from the promotion of new energy vehicles is gradually increased while keeping technological innovation constant, or the impact of technological innovation is increased while keeping new energy vehicles’ promotion constant, or both factors are gradually increased together, and the degree of impact on private car carbon emissions is positive and gradually increased (from 0.015 to 0.157). This indicates that the synergy between technological innovation and new energy vehicles results in a carbon increase.
The reason for this is that introducing new energy vehicles into the road transport sector can reduce carbon emissions by optimizing the energy structure and improving energy conversion efficiency. However, the increase in new energy vehicle numbers also occupies road space, exacerbates traffic congestion, increases the frequency of car stops and starts, and reduces driving speeds, which in turn increases carbon emissions. As technological innovation leads to a “rebound effect”, the impact of new energy vehicles on traffic congestion becomes even stronger. Therefore, while promoting green technological innovation in the private car sector, it is important to introduce economic policy tools to limit and constrain the additional energy consumption caused by technological progress. Policies should also encourage shared and low-carbon travel, raise public awareness of carbon emissions and environmental issues, and guide individuals towards carbon reduction behaviors to mitigate the positive effect of the “rebound effect”.
2.
Infrastructure development scenario. As the degree of shock from road network density and public transport scale increases incrementally, the effect on private car carbon emissions changes from −0.007 to −0.073. This demonstrates that the synergistic relationship between road network density and public transport scale contributes to carbon emission reductions in private cars. First, cities with high road network density facilitate improved traffic flow, reduced congestion, and enhanced traffic efficiency, consequently lowering vehicle energy consumption and carbon emissions. Second, an improved public transportation system can optimize the transport structure, promote environmentally sustainable transport options, encourage residents to use shared travel modes, increase energy efficiency, and mitigate carbon emissions from private cars.
Consequently, relying solely on the development of public transport and the enhancement of road network density presents a risk of limited carbon reduction potential. To achieve carbon reduction objectives, it is essential to integrate information technologies, such as geographic information systems, big data, and the Internet of Things, to consolidate private car data resources, optimize residents’ travel routes, and enhance driving behavior. Moreover, customized public transport services should be investigated through the systematic integration of private cars, public transport, pedestrian modes, and shared travel options to enhance residents’ propensity for low-carbon travel. Furthermore, it is imperative to consider commuting distances between urban residential areas, commercial activities, and public infrastructure. Enhancing urban road network planning and the spatial layout will improve the accessibility and efficiency of public transport by addressing the “last mile” challenge.
3.
Consumer behavior scenario. As the impact of fuel prices and traffic congestion increases, the effect on private car carbon emissions changes from −0.008 to −0.085, indicating an enhanced synergistic effect of raising fuel prices and alleviating traffic congestion in reducing private car carbon emissions. On the one hand, increasing fuel prices diminish residents’ preference for conventional fuel vehicles, thereby reducing the overall utilization of private cars and traffic consumption, which contributes to a reduction in carbon emissions; on the other hand, mitigating urban traffic congestion can enhance private car travel velocities, decrease stop-and-go frequency, improve travel efficiency, and consequently lower carbon emissions.
Consequently, the combination of rising fuel costs and the mitigation of traffic congestion can synergistically contribute to a reduction in private car usage, improvement in travel efficiency, and a decrease in both vehicular energy consumption and carbon emissions. For instance, fuel prices can be dynamically adjusted based on the severity of urban traffic congestion to guide residents to reduce private car usage during periods of peak congestion, thereby alleviating traffic pressure and promoting low-carbon transportation alternatives. Furthermore, it is essential to consider the implementation of a congestion-charging mechanism and the establishment of differentiated road usage fees based on urban traffic conditions, which are correlated with fuel prices.
4.
Differentiated population density scenarios. As shown in Figure 4, when technological innovation remains unchanged and the shock degree of population density increases, the effect on private car carbon emissions decreases from 0.07 to 0.04. This suggests that the regional population concentration attenuates the “rebound effect” resulting from technological innovation, thereby reducing the amount of carbon emissions from private cars. When maintaining the constancy of the number of new energy vehicles, road network density, fuel prices, traffic congestion, and public transport scale, an increase in the shock degree of population density exerts a negative impact on private car carbon emissions, with the absolute value of this impact intensifying. This suggests that an increase in regional population density strengthens the effectiveness of these carbon reduction measures for private cars. Furthermore, compared with other factors, irrespective of the variation in the shock degree of population density, the combined influence of public transport scale and population density on private car carbon emissions remains the greatest. This indicates that the development of public transport enhances the “agglomeration effect” of the regional population, thus maximizing its carbon reduction impact.
Hence, it is imperative to enhance the synergy between population concentration and urban planning by implementing a compact urban development paradigm. This entails guiding the concentration of the population towards core urban areas and transportation hubs, creating high-density, balanced work-residence communities, and averting the traffic efficiency losses resulting from “disorderly high-density sprawl”. In addition, priority should be given to the development of public transport and multimodal transport networks, expanding the coverage of rail transit and buses, and constructing a comprehensive and convenient transfer system. This ensures that public transport plays a primary role in densely populated areas, and systematically promotes a green and low-carbon transition in the transportation sector.

6. Discussion and Conclusions

First, this study utilizes large-scale vehicle trajectory data from Guangdong Province as a starting point to construct machine learning models for the prediction of private car carbon emissions. In contrast to existing studies that rely on surveys or macroeconomic statistical data for estimation, this approach minimizes the bias from real-world scenarios, offering a potentially novel method for calculating private car carbon emissions.
Next, based on the text statistics extracted from the Web of Science and urban-level economic data, we employ models such as the LDA topic model, fuzzy cognitive maps based on gradient descent, and grey relational analysis to explore the influencing factors of private car carbon emissions. Our analysis reveals that the correlation between population density and private car carbon emissions exhibit the highest significance. This finding aligns substantially with the conclusions of Long et al. [36], who suggest that demographic characteristics constitute the primary determinants influencing carbon emissions from private cars in Japan. From a different research perspective, Chen et al. argue that technological innovation exhibits the strongest explanatory power for private car carbon emissions [26]. Ashik, Chan, and others contend that the built environment and commuting conditions demonstrate a more significant correlation with carbon emissions [14,37]. We believe that residents, as direct users of private cars, are more directly influenced by the relationship between regional population density and the city’s transportation pattern, traffic demand, and the effectiveness of the public transportation system.
Subsequently, this study employs fuzzy cognitive maps to simulate the carbon reduction pathways for private cars in a single-factor system scenario. It finds that improving road network density, developing public transport, alleviating traffic congestion, increasing fuel prices, and promoting new energy vehicles are all effective means for reducing carbon emissions in the private car sector. The development of public transport is the primary pathway for carbon emission reduction in the private car sector. These findings are supported by theories such as Transit-Oriented Development, compact urban development, and the research conclusions of scholars such as Cheng [38] and Pang [39]. Furthermore, this study finds that technological innovation increases the amount of carbon emissions from private cars. This provides new insights for attempting to reduce carbon emissions in the private car sector from the perspective of the “energy rebound effect”.
Finally, this study utilizes fuzzy cognitive maps to simulate carbon reduction pathways for private cars in a two-factor combination scenario. The findings indicate that the synergy between technological innovation and the promotion of new energy vehicles increases private car carbon emissions. However, technological innovation and the promotion of new energy vehicles are generally considered effective synergistic strategies for achieving carbon reduction [40]. This study suggests that this difference arises from the “energy rebound effect” caused by technological innovation. The synergy between the public transport scale and road network density, as well as the relationship between fuel prices and traffic congestion, both contribute to the reduction in the amount of private car carbon emissions, a finding corroborated by existing research [39,41] Moreover, developing public transport can more effectively leverage the carbon reduction effect of population agglomeration. Our research provides differentiated strategies for promoting carbon reduction in the private car sector from a synergistic perspective.
As a representative developing nation experiencing rapid growth in private car ownership, China’s investigation into the factors influencing private car carbon emissions and the identification of mitigation strategies provides valuable insights for other developing countries with similar trends in vehicle ownership in formulating carbon reduction policies.
Based on the aforementioned research findings, the following policy implications are proposed.
  • Advocate a public-transport-oriented development model that utilizes public transport as an alternative to private cars. This approach provides residents with increased travel options and reduced commuting costs, thereby encouraging a decrease in private car usage and achieving economic and environmental benefits in urban transportation.
  • It is imperative to consider the “rebound effects” resulting from the promotion of technological innovation and the adoption of new energy vehicles. Such considerations should aim to maximize the marginal effects of technological advancements and enhance the carbon and emission reduction potential of new energy vehicles in transforming the energy structure. Furthermore, it is advisable to introduce innovative policies such as differentiated personal carbon trading and carbon taxes. These measures should ensure alignment with national carbon reduction goals, guide the optimization and green transition of urban economic structures, and reduce dependence on traditional fuels in the private car sector.
  • We recommend enhancing urban road network infrastructure and traffic management systems, facilitating the integration and development of regional public transportation networks, establishing transfer hubs that combine transportation and commercial services, encouraging residents to prioritize public transit utilization, and promoting the development of a low-carbon urban economy.
This study has certain limitations. Owing to constraints in acquiring vehicle trajectory data and associated research information, the investigation primarily focuses on examining the factors influencing private car carbon emissions and potential reduction strategies, without considering variables such as vehicle age, public transport pricing, and private car usage costs. Consequently, these findings may be subject to specific bias. Nevertheless, the application of fuzzy cognitive maps for scenario simulation in this study represents a valuable approach for addressing carbon reduction in the private car sector. As more comprehensive data become available, future research could further investigate the real-world impacts of macroeconomic policies and micro-level consumer behavior on private car carbon emissions, thereby contributing to the green transition of the transportation sector.

Author Contributions

W.C., writing—review and editing; X.W., writing—original draft; Z.X., data curation. All authors have read and agreed to the published version of the manuscript.

Funding

Changsha Natural Science Foundation, Smart Transportation Governance Innovation under the Goal of “Dual Carbon” (Grant No. kq2402264), the Scientific Research Project of Hunan Provincial Department of Education, Research on Innovation-Driven Green High-Quality Development Path from the Perspective of New Quality Productivity (Grant No. 24C0105), the National Social Science Foundation of China Low-carbon Transition Path and Policy Mix Innovation Based on Green Governance (Grant No. 19CGL043), the Natural Science Foundation Project of Chongqing, Chongqing Science and Technology Commission (Grant No. CSTB2024NSCQ-MSX0920).

Institutional Review Board Statement

Not applicable.

Informed Consent Statement

Not applicable.

Data Availability Statement

The data used to support the findings of this study have not been made available because of confidentiality agreements with the research collaborators. These data are part of an ongoing commercial program and study.

Conflicts of Interest

The authors declare that they have no conflicts of interest.

References

  1. National Bureau of Statistics of China. 2022 Statistical Bulletin on National Economic and Social Development of the People’s Republic of China; National Bureau of Statistics of China: Beijing, China, 2023. [Google Scholar]
  2. Zhang, X.; Bai, X. Incentive policies from 2006 to 2016 and new energy vehicle adoption in 2010–2020 in China. Renew. Sustain. Energy Rev. 2017, 70, 24–43. [Google Scholar] [CrossRef]
  3. Nakamura, K.; Hayashi, Y. Strategies and instruments for low-carbon urban transport: An international review on trends and effects. Transp. Policy 2013, 29, 264–274. [Google Scholar] [CrossRef]
  4. Gonzalez, J.N.; Perez-Doval, J.; Gomez, J.; Vassallo, J.M. What impact do private vehicle restrictions in urban areas have on car ownership? Empirical evidence from the city of Madrid. Cities 2021, 116, 103301. [Google Scholar] [CrossRef]
  5. Liu, Q.; Zhang, Y.; Xiao, Y.; Yuan, Y.; Xia, H. Characteristics and determinants of carbon emissions from daily private cars travel in central area of Jinan. Res. Sci. 2018, 2, 262–272. [Google Scholar]
  6. Paravantis, J.; Georgakellos, D. Trends in energy consumption and carbon dioxide emissions of passenger cars and buses. Technol. Forecast. Soc. Change 2007, 74, 682–707. [Google Scholar] [CrossRef]
  7. Zhang, L.; Long, R.; Chen, H.; Geng, J. A review of China’s road traffic carbon emissions. J. Clean. Prod. 2019, 207, 569–581. [Google Scholar] [CrossRef]
  8. Lu, D.-N.; He, H.-D.; Zhao, H.-M.; Lu, K.-F.; Peng, Z.-R.; Li, J. Quantifying traffic-related carbon emissions on elevated roads through on-road measurements. Environ. Res. 2023, 231, 116200. [Google Scholar] [CrossRef]
  9. Liu, J.; Li, J.; Chen, Y.; Lian, S.; Zeng, J.; Geng, M.; Zheng, S.; Dong, Y.; He, Y.; Huang, P.; et al. Multi-scale urban passenger transportation CO2 emission calculation platform for smart mobility management. Appl. Energy 2023, 331, 120407. [Google Scholar] [CrossRef]
  10. Kousoulidou, M.; Fontaras, G.; Ntziachristos, L.; Bonnel, P.; Samaras, Z.; Dilara, P. Use of portable emissions measurement system (PEMS) for the development and validation of passenger car emission factors. Atmos. Environ. 2013, 64, 329–338. [Google Scholar] [CrossRef]
  11. Zhao, X.; Jiang, Y.; Zhao, J.; Wang, Y.; Cai, Z.; Zeng, M.; Dong, J.; Cong, W.; He, K.; Liu, H. Carbon emission inventory and mitigation potential for private cars in Chinese cities. Transp. Res. Part D Transp. Environ. 2025, 140, 104614. [Google Scholar] [CrossRef]
  12. Montoya-Torres, J.; Akizu-Gardoki, O.; Iturrondobeitia, M. Measuring life-cycle carbon emissions of private transportation in urban and rural settings. Sustain. Cities Soc. 2023, 96, 104658. [Google Scholar] [CrossRef]
  13. Xue, F.; Yao, E. Impact analysis of residential relocation on ownership, usage, and carbon-dioxide emissions of private cars. Energy 2022, 252, 124110. [Google Scholar] [CrossRef]
  14. Ashik, F.R.; Rahman, M.H.; Antipova, A.; Zafri, N.M. Analyzing the impact of the built environment on commuting-related carbon dioxide emissions. Int. J. Sustain. Transp. 2023, 17, 258–272. [Google Scholar] [CrossRef]
  15. Vega-Gonzalo, M.; Gomez, J.; Christidis, P. How has COVID-19 changed private car use in European urban areas? An analysis of the effect of socio-economic characteristics and mobility habits. Transp. Res. Part A Policy Pract. 2023, 172, 103679. [Google Scholar] [CrossRef]
  16. Karjalainen, L.E.; Tiitu, M.; Lyytimäki, J.; Helminen, V.; Tapio, P.; Tuominen, A.; Vasankari, T.; Lehtimäki, J.; Paloniemi, R. Going carless in different urban fabrics: Socio-demographics of household car ownership. Transportation 2023, 50, 107–142. [Google Scholar] [CrossRef]
  17. Yang, Y.; Takase, T. Spatial characteristics of carbon dioxide emission intensity of urban road traffic and driving factors: Road network and land use. Sustain. Cities Soc. 2024, 113, 105700. [Google Scholar] [CrossRef]
  18. Dong, D.; Duan, H.; Mao, R.; Song, Q.; Zuo, J.; Zhu, J.; Wang, G.; Hu, M.; Dong, B.; Liu, G. Towards a low carbon transition of urban public transport in megacities: A case study of Shenzhen, China. Resour. Conserv. Recycl. 2018, 134, 149–155. [Google Scholar] [CrossRef]
  19. Li, T.; Song, S.; Yang, Y. Driving restrictions, traffic speeds and carbon emissions: Evidence from high-frequency data. China Econ. Rev. 2022, 74, 101811. [Google Scholar] [CrossRef]
  20. Hicks, J. The Theory of Wages; Springer: Berlin/Heidelberg, Germany, 1963. [Google Scholar]
  21. Alimujiang, A.; Jiang, P. Synergy and co-benefits of reducing CO2 and air pollutant emissions by promoting electric vehicles—A case of Shanghai. Energy Sustain. Dev. 2020, 55, 181–189. [Google Scholar] [CrossRef]
  22. Wang, K.; Zheng, L.J.; Zhang, J.Z.; Yao, H. The impact of promoting new energy vehicles on carbon intensity: Causal evidence from China. Energy Econ. 2022, 114, 106255. [Google Scholar] [CrossRef]
  23. Javaid, A.; Creutzig, F.; Bamberg, S. Determinants of low-carbon transport mode adoption: Systematic review of reviews. Environ. Res. Lett. 2020, 15, 103002. [Google Scholar] [CrossRef]
  24. Zhang, X.; Song, G.; Yan, Y. The impact of urban low-carbon transportation system on the improvement of the structure of energy consumption-evidence from 14 cities in China. Chin. J. Manag. Sci. 2020, 28, 173–183. [Google Scholar]
  25. Li, W.; Long, R.; Chen, H.; Yang, M.; Chen, F.; Zheng, X.; Li, C. Would personal carbon trading enhance individual adopting intention of battery electric vehicles more effectively than a carbon tax? Resour. Conserv. Recycl. 2019, 149, 638–645. [Google Scholar] [CrossRef]
  26. Chen, W.; Wu, X.; Xiao, Z. Spatial distribution and influencing factors of carbon emissions from private cars in China: Simulation analysis based on trajectory big data. Environ. Dev. Sustain. 2024, 1–29. [Google Scholar] [CrossRef]
  27. Havyarimana, V.; Xiao, Z.; Sibomana, A.; Wu, D.; Bai, J. A fusion framework based on sparse Gaussian–Wigner prediction for vehicle localization using GDOP of GPS satellites. IEEE Trans. Intell. Transp. Syst. 2019, 21, 680–689. [Google Scholar] [CrossRef]
  28. Xiao, Z.; Chen, Y.; Alazab, M.; Chen, H. Trajectory data acquisition via private car positioning based on tightly-coupled GPS/OBD integration in urban environments. IEEE Trans. Intell. Transp. Syst. 2021, 23, 9680–9691. [Google Scholar] [CrossRef]
  29. Xiao, Z.; Li, F.; Wu, R.; Jiang, H.; Hu, Y.; Ren, J.; Cai, C.; Iyengar, A. TrajData: On Vehicle Trajectory Collection with Commodity Plug-and-Play OBU Devices. IEEE Internet Things J. 2020, 7, 9066–9079. [Google Scholar] [CrossRef]
  30. Yu, D.; Fang, A.; Xu, Z. Topic research in fuzzy domain: Based on LDA topic modelling. Inf. Sci. 2023, 648, 119600. [Google Scholar] [CrossRef]
  31. Lu, N.; Liu, S.; Du, J.; Fang, Z.; Dong, W.; Tao, L.; Yang, Y. Grey relational analysis model with cross-sequences and its application in evaluating air quality index. Expert Syst. Appl. 2023, 233, 120910. [Google Scholar] [CrossRef]
  32. Zhang, H.; Zhang, J.X. The impact mechanism of built environment in small cities on carbon emissions from residents’ travel and transportation. Urban Probl. 2020, 300, 4–10. [Google Scholar]
  33. Sheydayi, A.; Dadashpoor, H. Conducting qualitative content analysis in urban planning research and urban studies. Habitat Int. 2023, 139, 102878. [Google Scholar] [CrossRef]
  34. Fan, H.; Liang, C. Effective Government and Regional Technological Innovation: Evidence from 284 Cities in China. Regul. Gov. 2024. [Google Scholar] [CrossRef]
  35. Bhukya, R.; Paul, J. Social influence research in consumer behavior: What we learned and what we need to learn?—A hybrid systematic literature review. J. Bus. Res. 2023, 162, 113870. [Google Scholar] [CrossRef]
  36. Long, Y.; Huang, D.; Lei, T.; Zhang, H.; Wang, D.; Yoshida, Y. Spatiotemporal variation and determinants of carbon emissions generated by household private car. Transp. Res. Part D Transp. Environ. 2020, 87, 102490. [Google Scholar] [CrossRef]
  37. Chan, L.; Chan, C.; Qin, Y. The effect of commuting microenvironment on commuter exposures to vehicular emission in Hong Kong. Atmos. Environ. 1999, 33, 1777–1787. [Google Scholar] [CrossRef]
  38. Cheng, Q.; Xiong, Y. Low-carbon sustainable development driven by new energy vehicle pilot projects in China: Effects, mechanisms, and spatial spillovers. Sustain. Dev. 2024, 32, 979–1000. [Google Scholar] [CrossRef]
  39. Pang, J.; An, L.; Shen, S. Gasoline prices, traffic congestion, and carbon emissions. Resour. Energy Econ. 2023, 75, 101407. [Google Scholar] [CrossRef]
  40. Zhao, M.; Sun, T.; Feng, Q. Capital allocation efficiency, technological innovation and vehicle carbon emissions: Evidence from a panel threshold model of Chinese new energy vehicles enterprises. Sci. Total Environ. 2021, 784, 147104. [Google Scholar] [CrossRef]
  41. Xie, R.; Fang, J.; Liu, C. The effects of transportation infrastructure on urban carbon emissions. Appl. Energy 2017, 196, 199–207. [Google Scholar] [CrossRef]
Figure 1. Research framework.
Sustainability 17 02268 g001
Figure 2. The prediction of carbon emissions from private cars.
Sustainability 17 02268 g002
Figure 3. Fuzzy cognition map of influencing factors of private car carbon emissions.
Sustainability 17 02268 g003
Figure 4. Difference scenario of population density.
Sustainability 17 02268 g004
Table 1. Recorded trip sample dataset.
Vehicle IDTrip
Start Time
Start
Point
Longitude
Start Point
Latitude
Trip
End
Time
End
Point
Longitude
End
Point
Latitude
Travel Mileage Fuel
Consumption
Travel Time
2033404351 July 2022 17:16125.25570643.835041 July 2022 17:37125.29867843.860568611210231244
Table 2. Comparison of fitting error.
Model/IndexRMSEMAEMSE
BP0.35690.08490.1274
SVM1.28810.21461.6592
RF0.29070.01480.0846
Table 3. Topics and high-frequency representative words.
NumberTopicHigh-Frequency Representative Words
1Travel behavior, Ownership, ConsumerTravel, Greenhouse Gas, Behavior, Ownership, Ghg, Energy, Emissions, Models, Consumer, Mobility, Inventory, Shopping, Usage, Behaviour, European, Iron, Fuels, Discrete Continuous, Train
2Consumption, Sustainability, Technology, Network, PriceConsumption, Impact, Sustainable, Systems, Data, Evaluation, Modelling, Storage, Modeling, Panel, Framework, Hydrogen, Rate, Technologies, Networks, Price, Cointegration, Uncertainty, Area
3Vehicle, Cities, Infrastructure, TelecommunicationsCarbon, Vehicle, Fuel, Footprint, Cities, Charging, Infrastructure, Alternative, Gasoline, Water, Low, Stations, Telecommunications, Problem, Additive, Motor, Nonparametric, Elasticities, Cell
4Demand, Incentives, Built, Distribution, OzoneDemand, Atmospheric, Meteorology, Environment, Lca, Incentives, Efficiency, Energy, Built, Walking, Spatial, Power, Distribution, Cycling, Ozone, Europe, Group, Metals, Discount
5Technology, Facilities, Mobility, EfficiencyScience, Technology, Topics, Computer, Acceptance, Energy Saving, Materials, Facilities, Recreational, Citizen, Energy, Biodiesel, China, Mobility, Efficiency, Transportation, Europe, Physical Activity, Pathways
6Economic Growth, Urbanization, Tax, Transition, Bus, ResidentialEmission, Energy, Economic Growth, Market, Urbanization, Mobility, Tax, Economy, Transition, Scenarios, Bus, Reduce, Volatile, Standards, Residential, Organic Compounds, Nox, Service, Euro
7Urban, Passenger, Public,
Density, Sprawl, City Level, Buildings
Transportation, Urban, Passenger, Public, Cars, Travel, Thermodynamics, Occupational, Active, Density, Heat, Particles, Evolution, Occupancy, Sprawl, Biodiversity, City Level, Buildings, Insights
8Household, Building, Preferences, ChargersEmissions, Dioxide, Carbon Dioxide, Household, Building, Preferences, Characteristics, Construction, Black, Carbon, Energy Requirements, Office, Vehicular, Noise, Gaseous, Chargers, Low Power, Solid Waste, Municipal
9Road, Policies, Congestion, StructureTransport, Choice, Traffic, Road, Policies, Mode, Low-Carbon, Experiment, Diesel, Method, Exhaust, Cost Benefit, Measurement, Pems, Light, Load, Dematel, Congestion, Structure
10Network, Population, Lifecycle, Distance, MetroSector, Reduction, Health, Air Pollution, Network, Decomposition, Performance, Climate Change, Population, Lifecycle, Impact, Trends, Transit, Form, Distance, Metro, Decarbonization, Planning, Energy
11Electric, Battery, Smart, ProgrammingModel, Vehicles, Electric, Stirpat, Battery, Diffusion, Engineering, Bottom-Up, Smart, Logit, Programming, Linear, Effect, Natural Gas, Nitrogen, Cng, Times, Heterogeneity, Duty
12Economics, Business, Cycle, Life, Regional, Personal, ElectrificationAnalysis, Economics, Business, Cycle, Energy, Life, Factors, Use, Regional, Decision, Personal, Barriers, Dentistry, Support, Grid, Influencing, Estimation, Electrification, Differences
13Hybrid, Private, Batteries, Lithium IonEngineering, Car, China, Impacts, Assessment, Sustainability, Hybrid, Private, Air Quality, Batteries, Driving, Mining, Plugin, Standard, Patterns, Integration, Lithium Ion, Conditions, Buffer
14Renewable, Design, CommuterEnergy, Fuels, Cost, Exposure, Renewable, Particulate, Design, Matter, Bioenergy, Production, Effects, Potentials, Rebound, Sensitivity, Fine, Abatement, Curve, Algorithm, Commuter
Table 4. Influencing factors of carbon emissions from private cars.
Theoretical SupportInfluencing FactorVariable Abbreviation
Environmental economic theoryEconomic development level g d p
Traffic environmental policies p o l
Urban planning theoryPopulation density p o p
Road network density r o d
Traffic congestion t r a f
Public transport scale p u b
Technology innovation theoryR&D investment r e s
Technological innovation i n n
New energy vehicle n e w
Consumer behavior theoryPersonal disposable income i n c
Fuel price o i l
Table 5. Grey relational analysis results.
Variable p o p g d p p o l i n c p u b r e s r o d i n n n e w t r a f o i l
Relation0.85 0.30 0.45 0.300.300.75 0.45 0.80 0.40 0.70 0.50
Table 6. Scenario simulation of single factors.
VariableLight ImpactModerate ImpactHeavy Impact
p o p −0.003−0.018−0.037
p u b −0.007−0.037−0.072
r o d −0.000−0.001−0.002
i n n 0.0150.0780.155
n e w −0.000−0.001−0.002
t r a f −0.002−0.009−0.017
o i l −0.007−0.035−0.069
Table 7. Mix scenario simulation.
VariableInitiative Iteration i n n r o d o i l
LightModerateHeavyLightModerateHeavyLightModerateHeavy
light0.0150.0770.155
n e w moderate0.0160.0780.156
heavy0.0170.0790.157
light −0.007−0.007−0.008
p u b moderate −0.036−0.037−0.038
heavy −0.072−0.072−0.073
light −0.008−0.036−0.070
t r a f moderate −0.015−0.043−0.077
heavy −0.024−0.052−0.085
Disclaimer/Publisher’s Note: The statements, opinions and data contained in all publications are solely those of the individual author(s) and contributor(s) and not of MDPI and/or the editor(s). MDPI and/or the editor(s) disclaim responsibility for any injury to people or property resulting from any ideas, methods, instructions or products referred to in the content.

