Abstract
This study employs a comparative fuzzy-set qualitative comparative analysis (fsQCA) to examine the combined effects of traditional factors and green patents on innovation performance in Chinese listed agricultural enterprises, offering insights into sustainability in agriculture through innovation. By analyzing 84 valid cases from 107 agricultural companies, we conduct two fsQCA analyses to compare innovation pathways with and without green patents as a conditional factor. The first analysis investigates the impacts of five factors—firm size, executives’ educational background, return on net assets, ownership concentration, and government subsidies—on non-green innovation performance, identifying four distinct pathways: executive-dispersed, employee-financed, executive-centralized, and executive-profitable. In the second analysis, green patents are introduced as an independent variable. The overall solution coverage remains stable, but the configurational landscape shifts, with two original pathways persisting and two new pathways emerging—both involving green patents. The findings suggest that the impact of green patents on innovation is condition-dependent rather than universally beneficial. Green patents amplify innovation performance only when supported by strong managerial education, financial stability, and policy incentives, particularly in the executive green synergy pathway, where raw coverage reaches 0.41, underscoring their role as a conditional multiplier in sustainable innovation. These results provide theoretical and empirical evidence for balancing economic benefits with environmental responsibility in agricultural enterprises and emphasize the need for targeted policy subsidies, enhanced managerial education, and optimized shareholder structures to drive sustainable innovation.
1. Introduction
In the context of the growing importance of global sustainable development, agricultural enterprises are under significant pressure to innovate, particularly in integrating green transformation with technological advancement [1]. Agricultural companies differ from technology and manufacturing firms in their resource intensity, longer innovation cycles, and reliance on government support [2]. Innovation in agriculture—spanning seed development, soil improvement, and sustainable farming—requires extended research and implementation periods. Unlike technology firms driven by private investment, agricultural enterprises depend on state-supported research, subsidies, and tax incentives due to their role in food security and rural development [3]. These factors make policy support and financial backing essential for green innovation adoption.
In recent years, green innovation has been recognized as a key factor in enhancing the sustainable competitiveness of agricultural enterprises, as it not only helps mitigate environmental impacts [4] but also provides long-term economic benefits [5]. As a resource-intensive industry, the progress of agricultural enterprises in applying green technology is crucial for the sustainable development of the sector. This innovation is especially important as it directly addresses global challenges, such as climate change, resource conservation, and ecological sustainability [2].
Understanding the impact of green innovation on agricultural enterprises first requires the clarification of the role of traditional innovation factors, which refer to firm-level and policy-related determinants widely recognized in prior research as key drivers of innovation. More than 50 influencing factors were discussed in the early stages of innovation research [6]. A recent study on Chinese listed agricultural enterprises identified five key factors: company size, managerial education, financial performance, shareholder concentration, and government subsidies [7]. Larger companies often have a stronger capacity for risk tolerance and resource advantages, making them more likely to engage in innovative activities [8,9,10]. The knowledge and educational background of the management team play a critical role in guiding enterprise innovation, especially in high-tech fields [11,12]. Shareholder structure [13,14] and financial performance [15] are also key factors influencing the allocation of resources for innovation, with companies with lower shareholder concentration tending to make more efficient use of innovation resources. Government subsidies, as an important incentive, are especially notable in encouraging innovation in green technologies [3,16].
As the diversity and complexity of innovation drivers in agricultural enterprises become increasingly evident, the influence of single factors on innovation can no longer fully reveal how enterprises perform in innovation under a dynamic environment. Consequently, a growing number of studies are using configurational analysis methods to explore how combinations of various factors jointly influence innovation activities. Configurational studies emphasize the complementarity and synergy between different conditional variables, allowing the identification of innovation pathways that result from the joint effect of multiple factors, thus providing a unique perspective on understanding complex innovation mechanisms [17]. For example, Fan et al. [18] found that the quality of innovation in agricultural enterprises often depends on a combination of entrepreneurship, green technology capabilities, and market demand, as a single factor cannot meet the requirements for sustainable innovation. Yu et al. [19] used fuzzy-set qualitative comparative analysis (fsQCA) to examine how various capability combinations enhance the performance and sustainability of agricultural cooperatives, offering successful pathways for different types of agricultural managers.
However, despite these advances, a lack of systematic research persists as to how traditional factors can be effectively combined with green innovation to further enhance the performance of agricultural enterprises. The interaction between green patents and firm-specific or policy-related innovation factors remains insufficiently explored. This study seeks to fill this gap by utilizing a comparative fsQCA approach, which not only examines the influence of traditional factors on agricultural enterprises’ innovation activities but also introduces green patents as a key variable to assess their impact on corporate innovation performance. This methodological approach provides a more structured analytical framework compared to conventional single fsQCA, thereby improving the identification of complex causal pathways in green innovation.
2. Methodology and Data
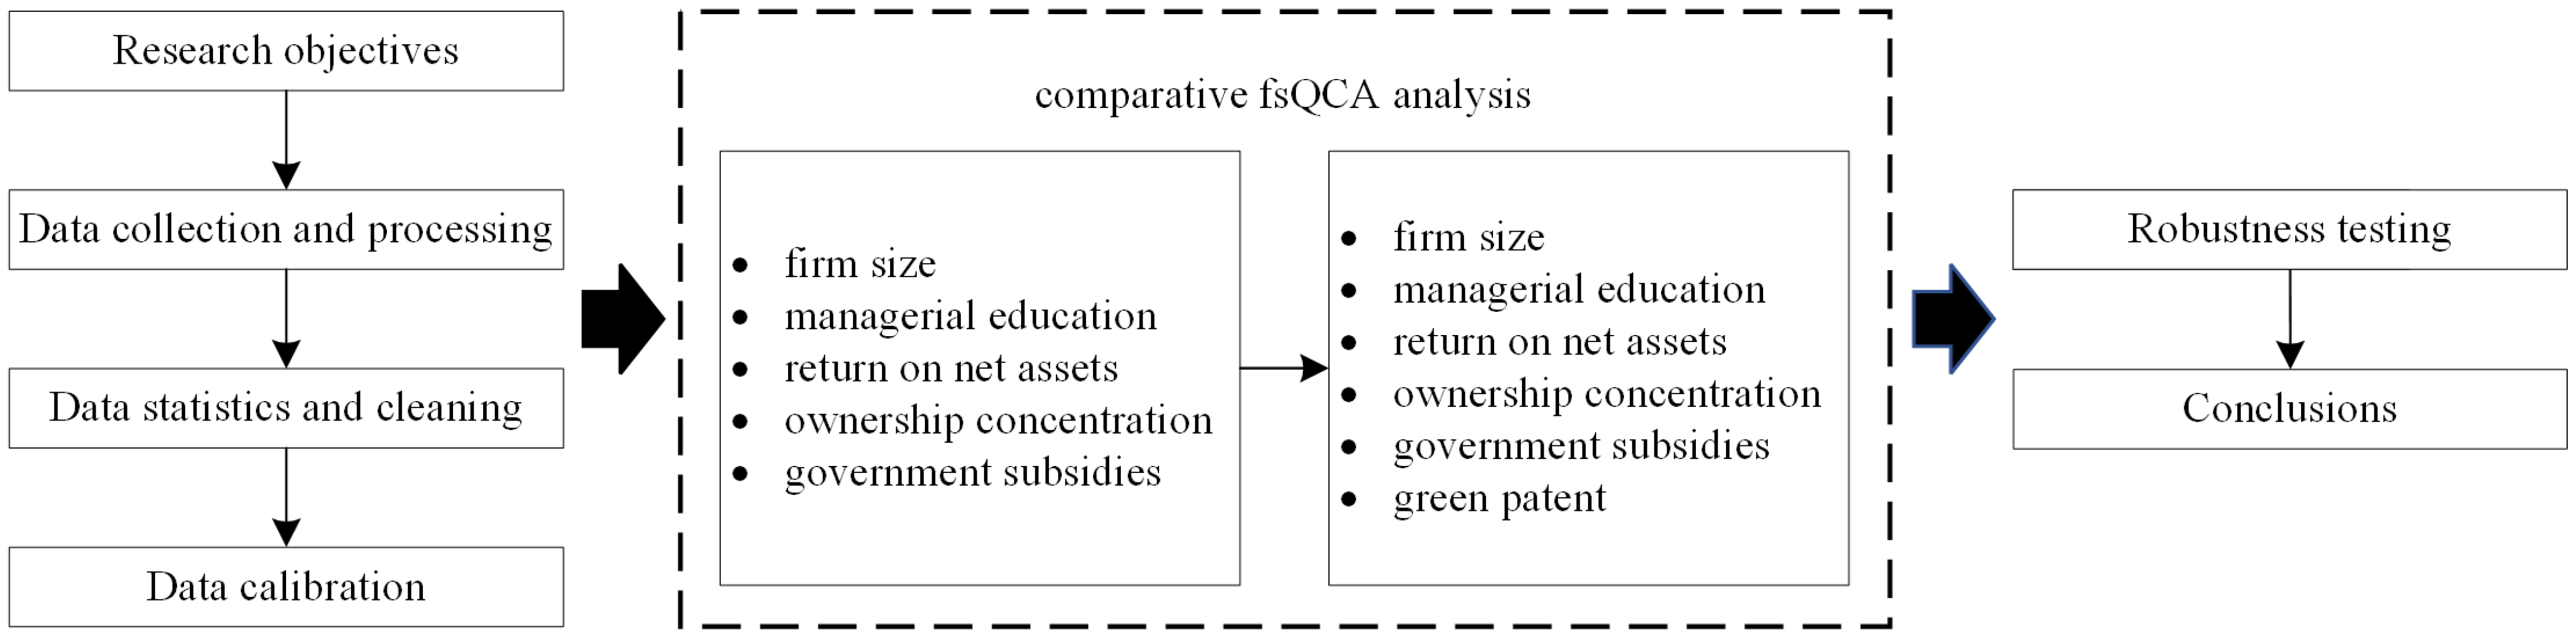
The research process is divided into the following main steps: data collection and processing, variable calibration, comparative fsQCA, result verification, and robustness testing. Figure 1 presents the overall research design flow.
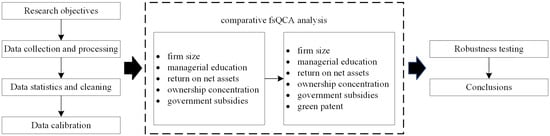
Figure 1.
Technical roadmap.
2.1. Comparative fsQCA
Traditional fsQCA methods analyze the combined effects of multiple factors simultaneously, making it difficult to isolate the specific contribution of individual variables, particularly when examining complex interactions, such as the role of green patents in innovation. To address this challenge, this study employs a comparative fsQCA approach [20,21], conducting two separate fsQCA analyses to assess how the inclusion of green patents as a conditional factor reshapes innovation pathways. This approach enables a structured comparison between models with and without green patents, allowing a clearer interpretation of their role in corporate innovation.
- First Analysis—identifying core innovation pathways: The first fsQCA analysis examines the influence of traditional factors on non-green innovation performance in agricultural enterprises. Specifically, five key variables were selected: company size [6,7], managerial education [8,9], return on net assets (ROE) [12], shareholder concentration [10,11], and government subsidies [3,13]. The choice of these variables is based on their influence on innovation capacity and their common role as innovation drivers in prior research, as also illustrated in the Introduction section. These factors represent different dimensions of enterprise resources (company size), management capabilities (managerial education), financial performance (return on net assets), governance structure (shareholder concentration), and policy incentives (government subsidies). The objective is to identify distinct pathways that firms utilize to enhance innovation.
- Second analysis—introducing green patents: The second fsQCA analysis introduces green patents as an additional conditional variable to assess their impact on innovation pathways. This comparative approach allows us to examine whether innovation pathways persist when green patents are introduced, whether new pathways emerge due to the presence of green patents, and whether green patents fundamentally alter or merely refine existing innovation configurations. By systematically comparing the results of both analyses, this approach isolates the role of green patents, demonstrating whether they expand overall innovation potential or act as conditional amplifiers within specific firm contexts.
Compared to a single fsQCA, this comparative approach enhances analytical clarity by identifying baseline innovation drivers before integrating green patents, allowing their distinct role to be explored systematically. By implicitly incorporating elements of the technology–organization–environment (TOE) framework [22,23,24], this approach captures key organizational and environmental influences on innovation. Variables, such as company size, managerial education, and ownership concentration, reflect organizational determinants, while government subsidies represent the policy environment. Though not explicitly adopted, the TOE framework reinforces the relevance of the selected variables in assessing firm-level innovation.
Both analyses use fsQCA 4.1 software for data processing. Two key indicators, path consistency and coverage, are employed in fsQCA to assess the credibility and impact of the results. Path consistency measures the strength of the relationship between specific condition combinations and the outcome, while coverage evaluates the explanatory power of these combinations. In this study, combinations with a path consistency of over 0.8 are considered valid [18], and the coverage metric ensures the broad representativeness of the results.
2.2. Data Collection and Processing
The CSMAR database [25] provides comprehensive enterprise characteristic data, including indicators related to company finances, management information, and patents for agricultural enterprises. Meanwhile, the China Research Data Services Platform (CNRDS) [26] contains green patent information for Chinese listed companies. The long-term data accumulation in these two databases on Chinese listed companies makes them suitable for conducting multi-year longitudinal studies.
Based on the 2021 revised version of the “Shenwan Industry Classification” [27], 107 listed agricultural companies were selected as samples from the CSMAR database. Data on the following indicators were collected from CSMAR and CNRDS for agricultural companies from 2014 to 2023 (the past ten years): number of employees, managerial education background, return on net assets, shareholding ratio of the top ten shareholders, government subsidies for R&D, green patent applications, and non-green patent applications (as shown in Table 1).

Table 1.
Overview of research variables and data.
To ensure data accuracy and usability, the collected data were matched by company stock codes and years. After filtering and merging, only data containing all necessary variables were retained, resulting in a final dataset of 84 valid records. Detailed descriptions of each variable, including mean, standard deviation, minimum, and maximum values, were provided to aid in understanding the overall characteristics of the sample and to assess the reasonableness and representativeness of the data (see Table 2).
Table 2.
Statistical summary of research variables and data.
2.3. Data Calibration
Data calibration converts raw data into fuzzy set membership scores to facilitate further configurational analysis. Thresholds for full membership, the crossover point, and full non-membership were calculated based on the 95th, 50th, and 5th percentiles of each variable, respectively, as shown in Table 3. Raw data were calibrated into fuzzy set membership scores based on the 95th, 50th, and 5th percentiles (Table 3). Given the nonlinear nature of green innovation [28], a three-value fuzzy set was applied to green patents (low: 0.33, medium: 0.66, and high: 0.99). The calibrated scores were then used in the fsQCA.
Table 3.
Threshold settings for data calibration.
3. Results
3.1. Necessity Analysis
Necessity analysis assesses whether any single condition is consistently present in all cases of successful innovation. As shown in Table 4, while all variables exhibit consistency above 0.5, none exceed the 0.9 threshold, indicating that no single factor is strictly necessary for non-green patent applications.
Table 4.
Necessity analysis results.
Among the tested conditions, “return on net assets” shows the highest consistency (0.71), suggesting a strong association with corporate innovation, though it does not meet the strict necessity criterion. Government subsidies exhibit the highest coverage (0.79), highlighting their crucial role in explaining non-green patent applications. Green patent applications demonstrate both high consistency (0.71) and coverage (0.75), implying their potential contribution to innovation in specific configurations. These findings reinforce the importance of configurational analysis to explore how multiple conditions interact to drive non-green patent applications, rather than relying on any single explanatory factor.
3.2. Results of First fsQCA
When running the fsQCA, the frequency threshold was set to 1 to ensure empirical support for each configuration. A 0.80 consistency threshold was applied to retain only highly consistent configurations, while a 0.65 PRI threshold was used to eliminate contradictions and enhance robustness.
The configurational analysis reveals four distinct configurations explaining the diversity of innovation in Chinese listed agricultural enterprises in the agricultural sector. Each configuration represents a unique pathway to innovation, incorporating various conditions, such as the number of employees, managerial education, shareholder structure, return on net assets, and government R&D subsidies. These configurations indicate that different types of agricultural enterprises can achieve innovation through multiple pathways, reflecting the diversity and complexity of agricultural innovation. Table 5 summarizes these three configurations, including metrics, such as their consistency, raw coverage, and unique coverage.
Table 5.
First fsQCA configurational analysis results.
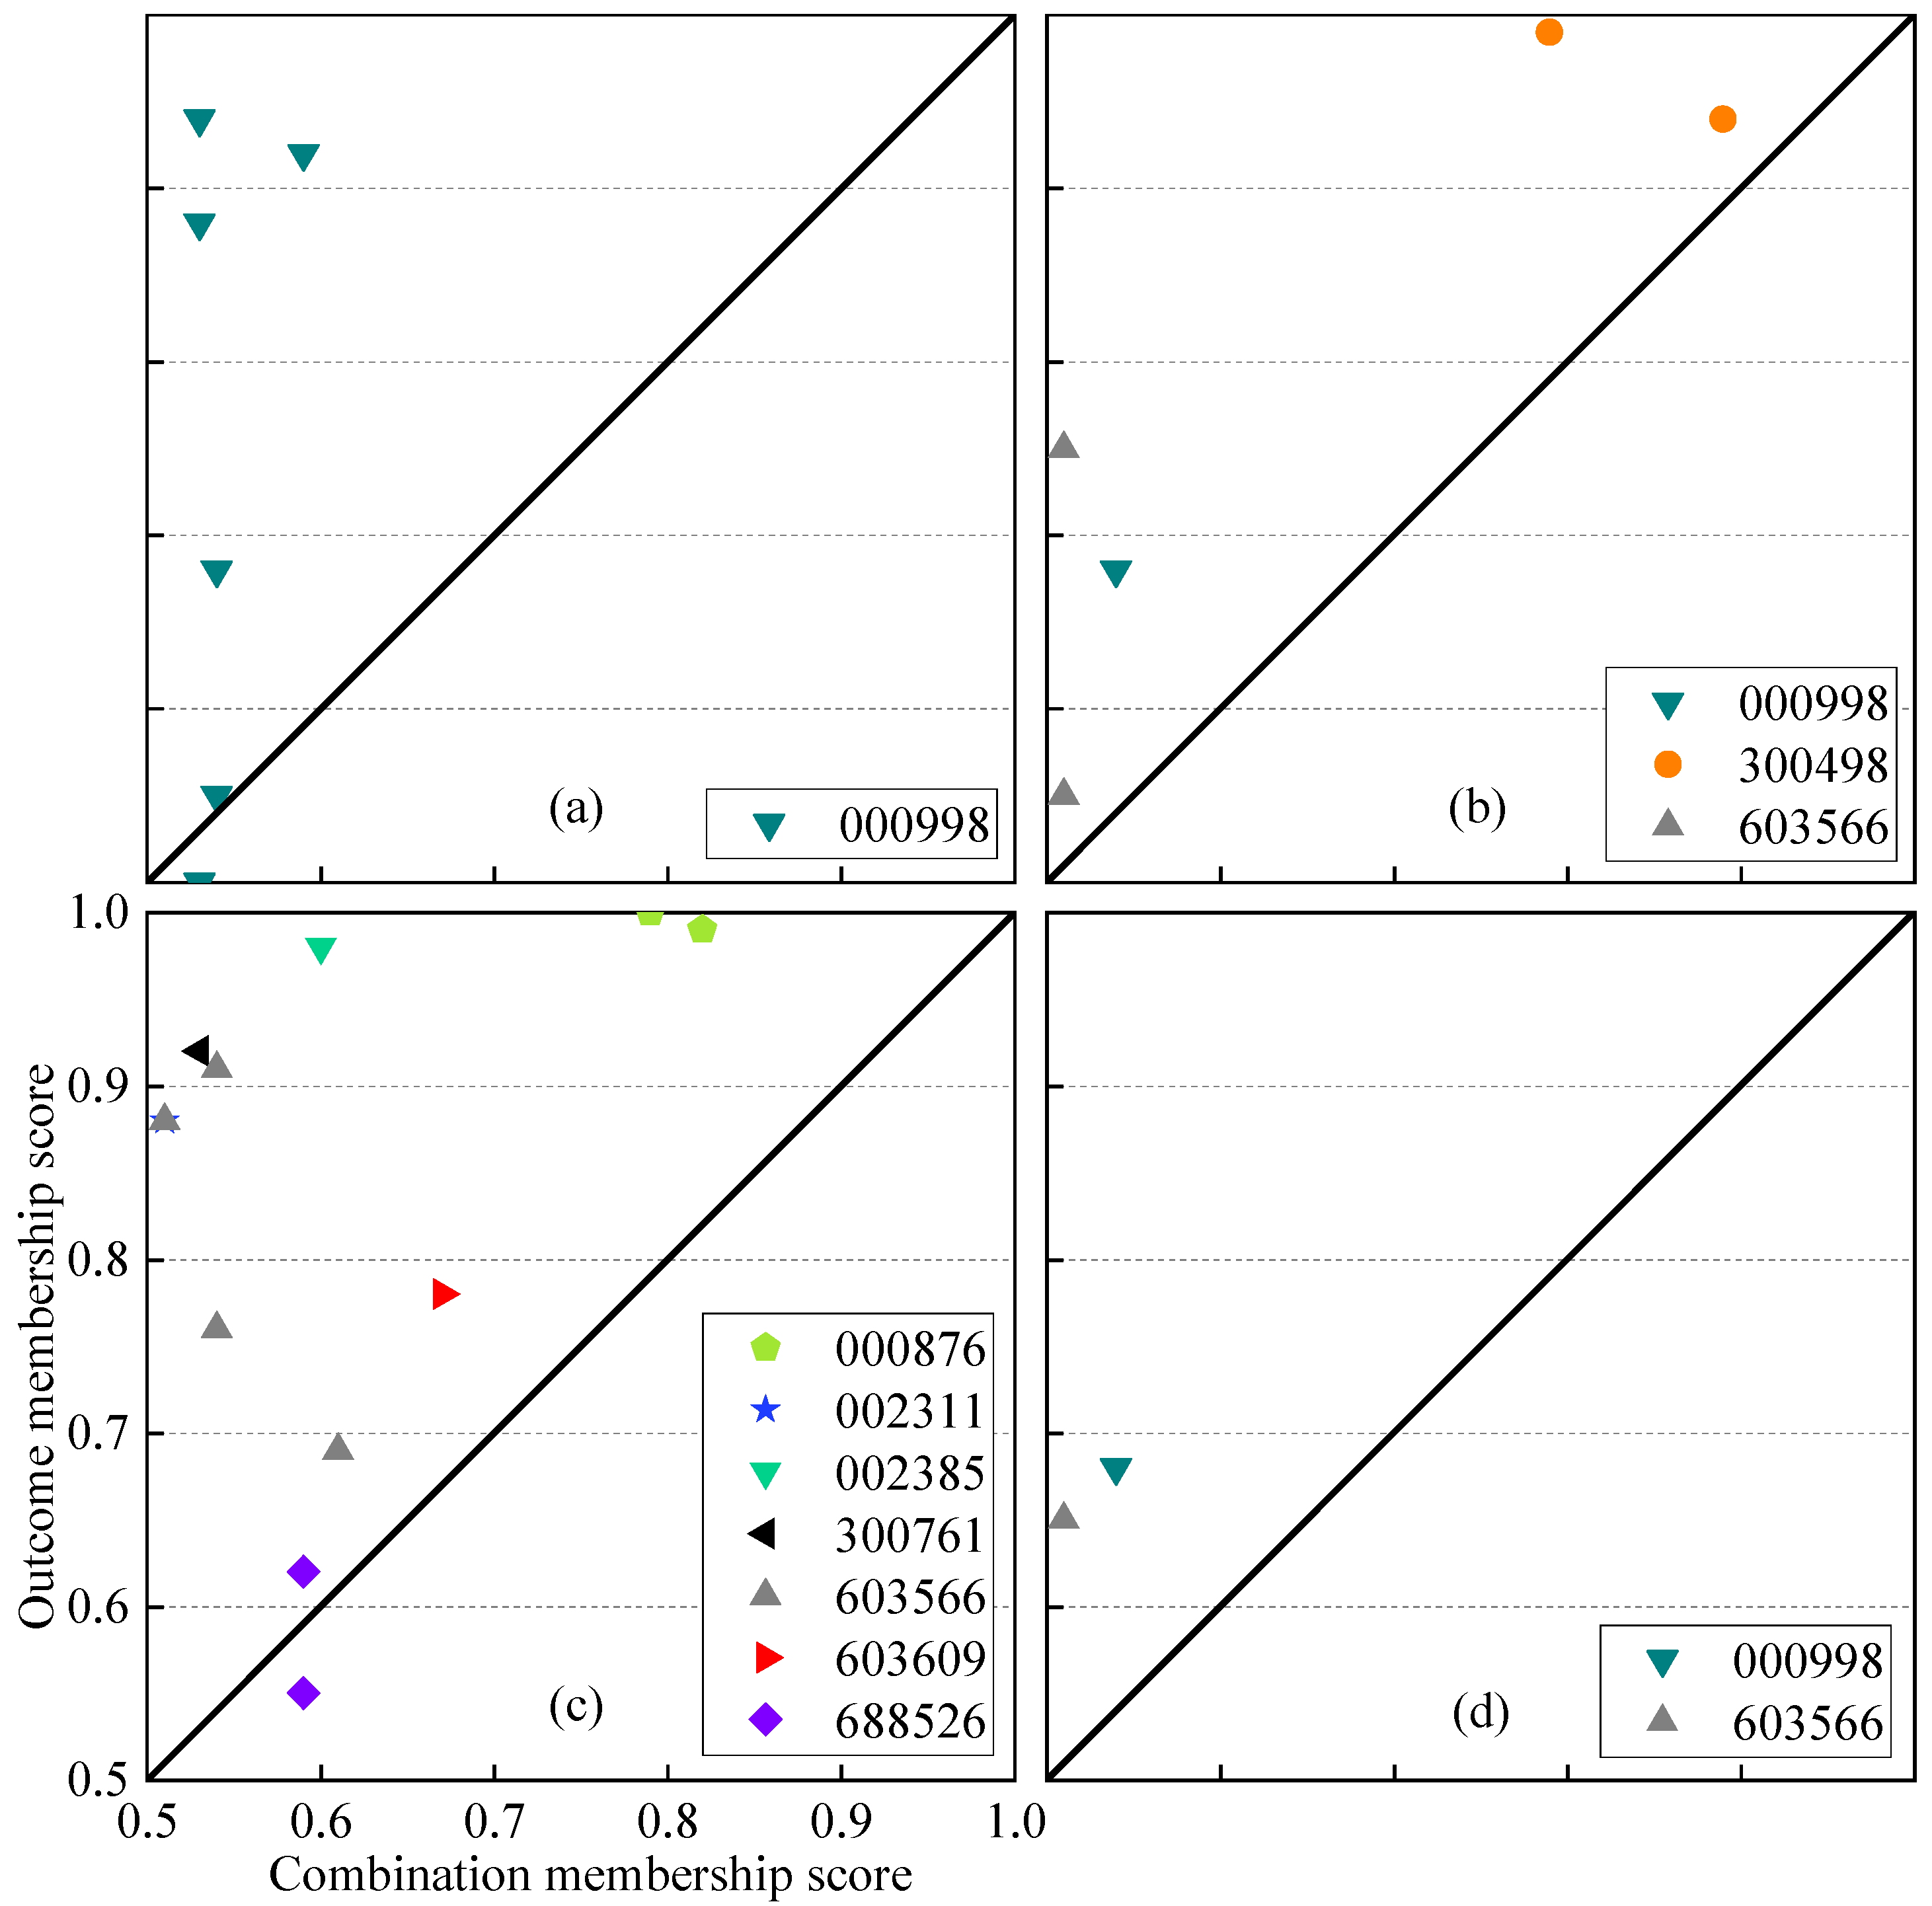
The overall solution consistency is 0.91, suggesting that these identified configurations demonstrate high robustness and consistency in explaining innovation outcomes. The overall coverage is 0.58, indicating that the four configurations collectively account for approximately 58% of the innovation outcomes. Figure 2 summarizes the cases corresponding to each configuration, selecting only cases with both combined membership and outcome membership scores greater than 0.5.
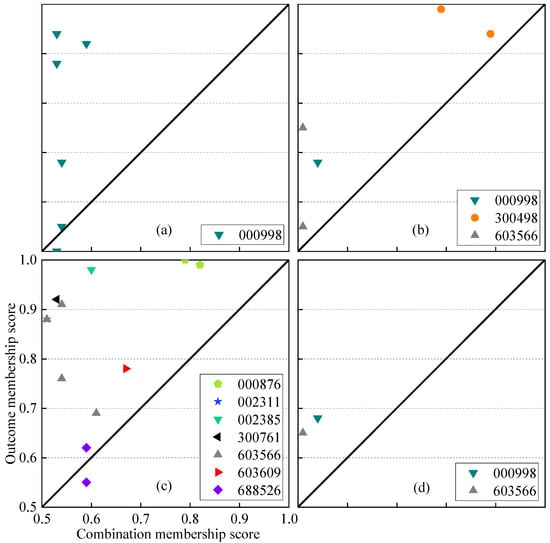
Figure 2.
Case distribution map for the first fsQCA. (a) Executive-dispersed model; (b) employee-financed model; (c) executive-centralized model; (d) executive-profitable model. Numbers in the legend correspond to the stock codes of listed companies.
3.2.1. Configuration 1: Executive-Dispersed Innovation
The consistency for the executive-dispersed innovation pathway is 0.95. This path is primarily driven by managerial education, a dispersed shareholder structure, and government R&D subsidies. In this configuration, the number of employees also plays a marginal role in supporting innovation. This configuration suggests that companies with highly educated executives and a dispersed shareholder structure are more likely to engage in innovation activities, aided by substantial government R&D subsidies. The high level of education among executives provides the company with strategic vision and technical absorptive capacity for innovation [29]. A dispersed shareholder structure, by reducing information asymmetry, enhances managerial autonomy and supports innovation [13]. The high consistency indicates that this configuration is a reliable pathway for promoting innovation; however, due to the low unique coverage (0.04), its ability to uniquely explain innovation outcomes is limited and may require combination with other paths for a comprehensive explanation.
The sole case in this configuration is Longping High-Tech (stock code 000998), corresponding to Cases 11 to 16. Data from different years show the long-term impact of this configuration on the company’s innovation. For example, in 2016, the top ten shareholders’ ratio peaked at 42.74% (Case 12), with a low innovation membership score of 0.55. By 2023, when this ratio decreased to 37.16% (Case 16), the innovation membership score increased to 0.92, supporting the positive impact of a dispersed ownership structure on corporate innovation, particularly in agricultural seed companies. The combination of executive education and government subsidies further enhances innovation capacity.
3.2.2. Configuration 2: Employee-Financed Innovation
The consistency for the employee-financed innovation pathway is 0.92, highlighting the importance of the number of employees, return on net assets, a dispersed shareholder structure, and government R&D subsidies. In this configuration, the number of employees (i.e., company size) is a core factor driving innovation. Large agricultural enterprises have more resources to undertake innovation risks and investments. Additionally, return on net assets as a core condition suggests that financially strong companies are better positioned to invest in innovation, especially with solid financial health, which encourages increased R&D expenditure and innovation investment [15]. Similar to Configuration 1, a dispersed shareholder structure plays a crucial role here, allowing management greater autonomy in innovation decisions. The unique coverage of 0.08 indicates a degree of uniqueness, making this configuration suitable for explaining innovation outcomes not covered by Configuration 1 and characterizing an innovation pathway driven by employee- and financial performance.
The typical case for this configuration is Wens Foodstuff Group (300498), represented by Cases 41 and 42. Wens has expanded its business scale through the “company + farmer” model, providing ample resources for innovation. Since its IPO, Wens has shown strong financial performance, with a net profit of CNY 12 billion in 2016, supporting ongoing technological innovation and employee motivation. The company’s employee stock ownership plan aligns employee interests with corporate growth, effectively stimulating employee innovation, and validating the importance of a dispersed ownership structure in promoting innovation, as seen in Configuration 1. Wens’ success in innovation aligns with the “employee-financed innovation” pathway through a combination of scale, financial performance, and incentive mechanisms.
3.2.3. Configuration 3: Executive-Centralized Innovation
The consistency for the executive-centralized innovation pathway is 0.94, with the highest raw coverage at 0.39, representing an innovation pathway driven by managerial education, a concentrated shareholder structure, return on net assets, and government R&D subsidies. Unlike the previous two configurations, this configuration’s key factor is concentrated ownership, suggesting that, in some cases, a concentrated shareholder structure can drive innovation. Supervision and strategic involvement by major shareholders can encourage innovation, especially in high-risk projects [30]. Highly educated executives and strong financial performance also indicate that these enterprises possess adequate leadership and financial resources to drive innovation. The unique coverage of 0.17 shows a higher level of uniqueness, establishing this configuration as a unique and robust pathway for innovation.
The typical case for this configuration is KC Bio (688526), represented by Cases 83 and 84. KC Bio has the highest managerial education level among the 84 cases, with an executive education level exceeding 4.28. Six out of the top ten shareholders are professors or researchers, collectively holding over 50% of the shares. This high level of education within the executive team provides strong intellectual support for innovation, while the concentrated ownership structure enables effective oversight and strategic engagement by major shareholders, promoting innovation.
3.2.4. Configuration 4: Executive-Profitable Innovation
The executive-profitable innovation pathway has a consistency of 0.93 and is characterized by managerial education, return on net assets, and company size, while shareholder concentration is not a defining factor. This suggests that firms with strong financial performance and well-educated executives can allocate resources effectively to sustain R&D. While this configuration has a unique coverage of 0.01, indicating a minimal contribution distinct from other pathways, the agricultural enterprises associated with the valid cases in this configuration also appear in other configurations. As a result, no unique companies are solely classified under this configuration. This suggests that profitability and managerial education reinforce other innovation pathways rather than forming an independent route to innovation. The findings imply that financial resources alone are insufficient to drive innovation and must be combined with structural or policy factors to create sustainable innovation pathways.
3.3. Results of Second fsQCA
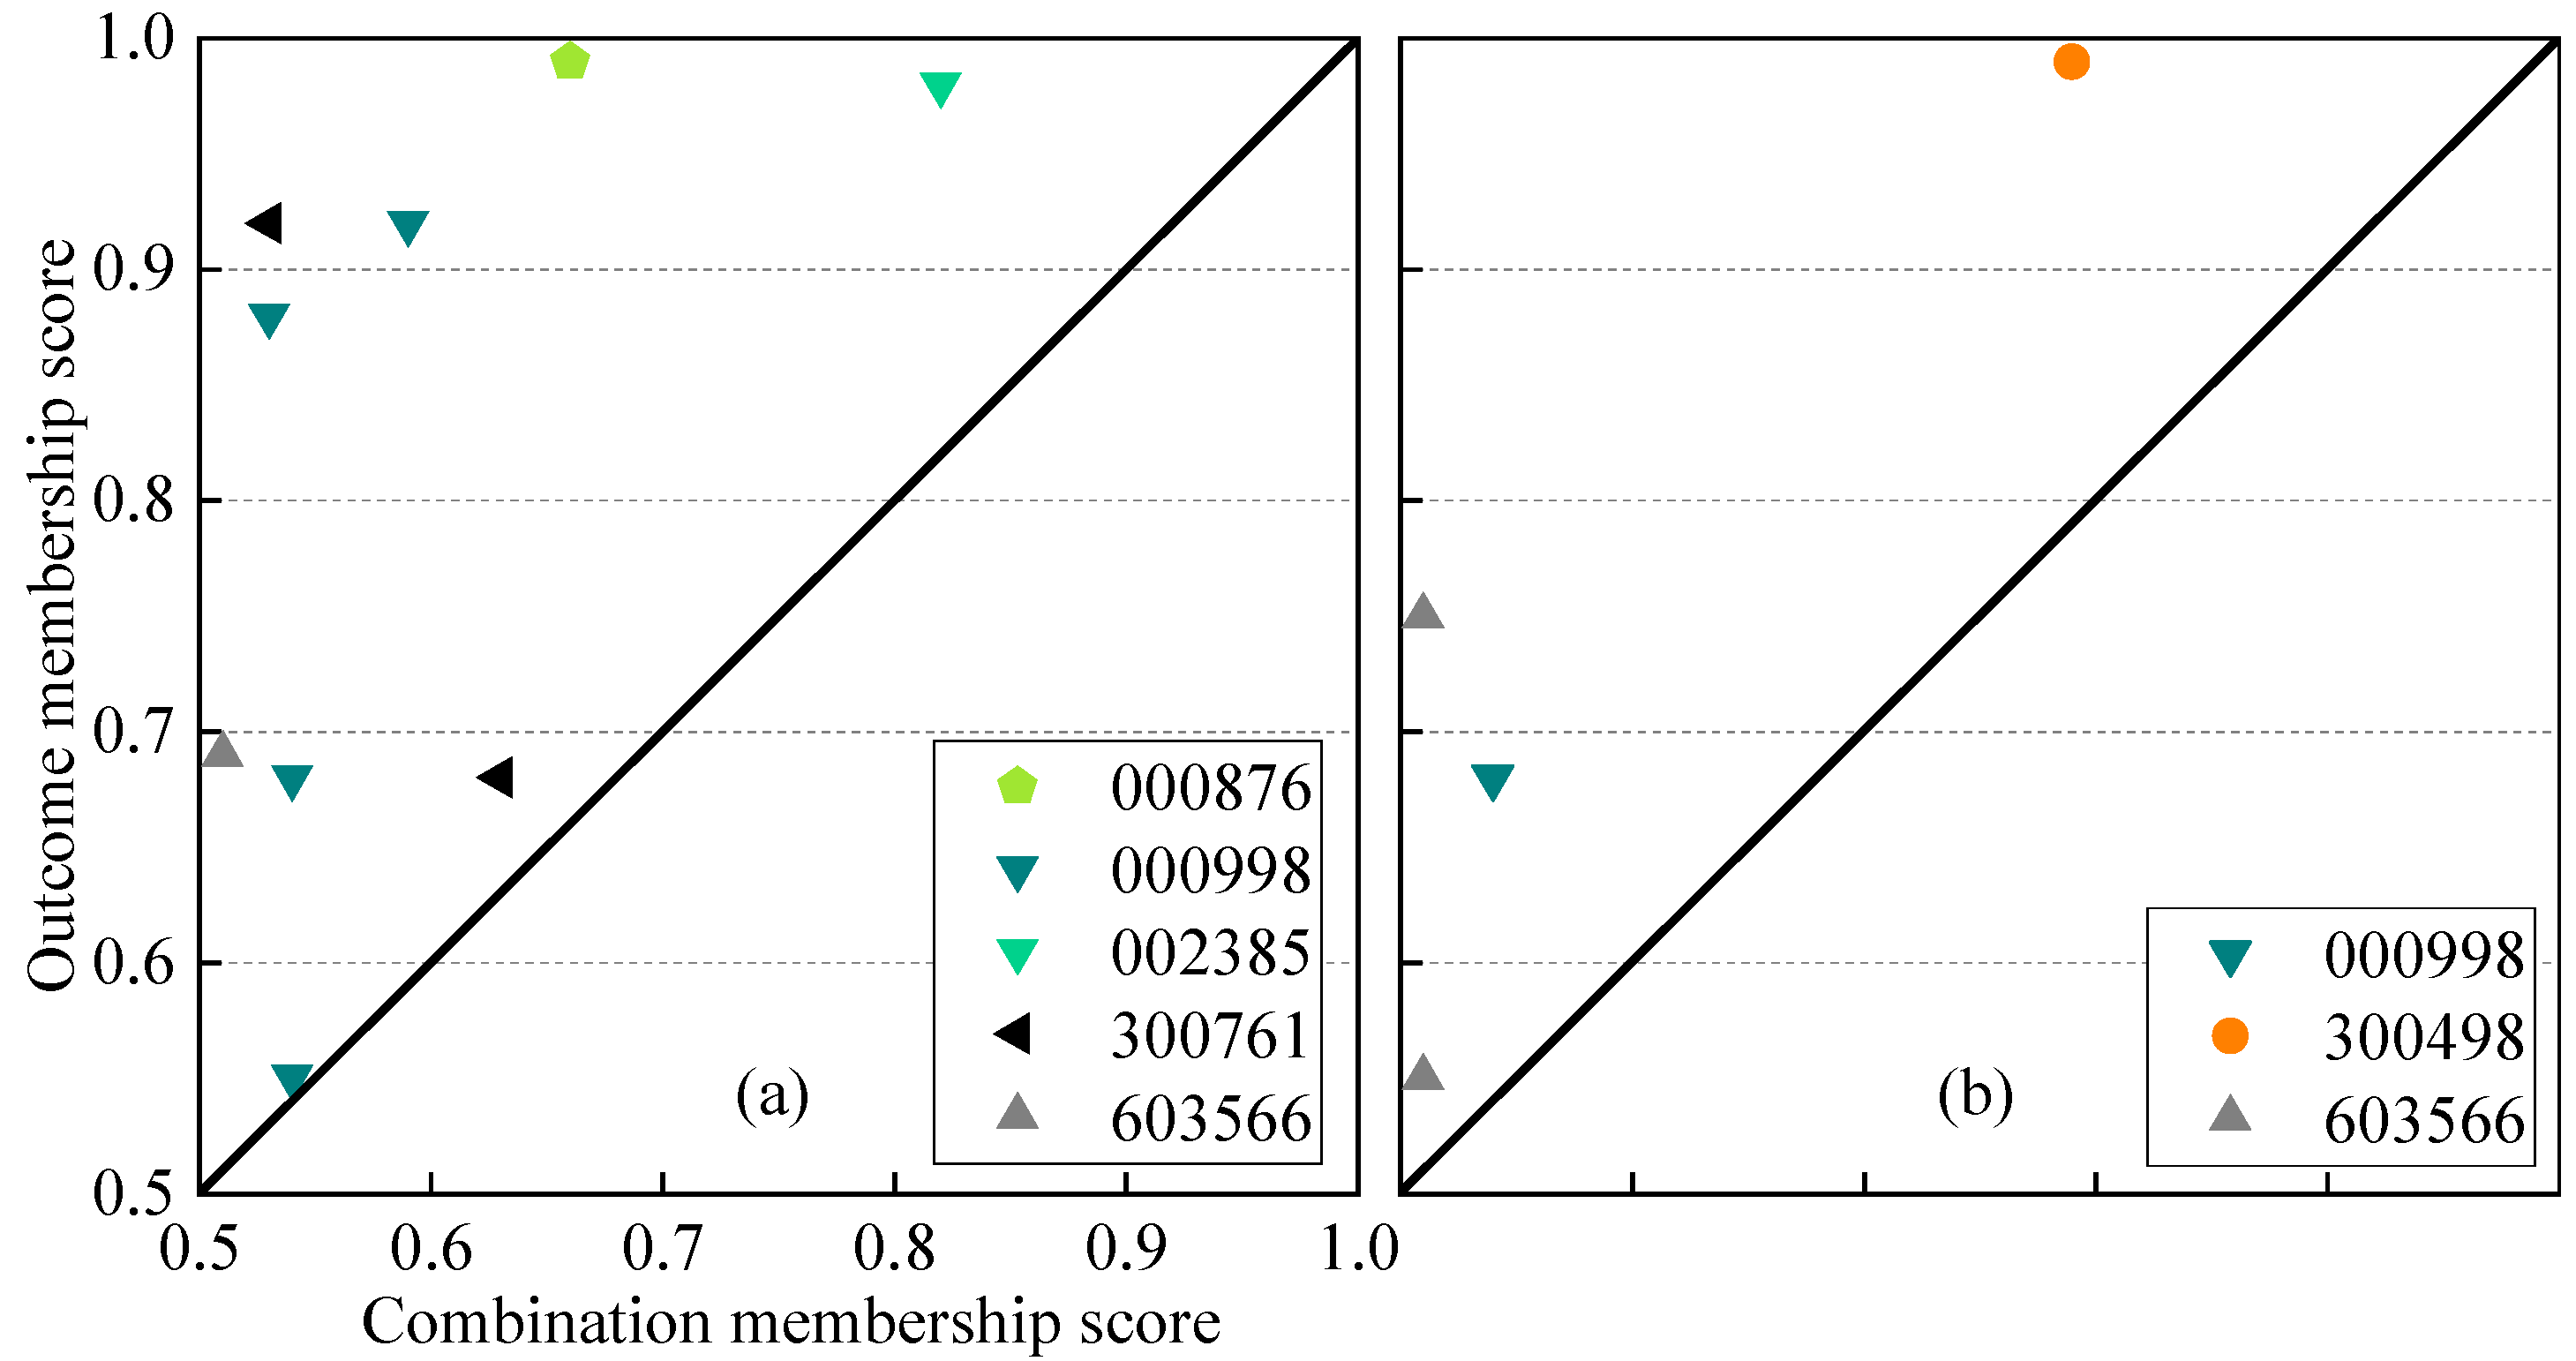
The second configurational analysis results are presented in Table 6. After incorporating green patents as a conditional factor, the overall solution consistency and coverage remained unchanged, maintaining values of 0.91 and 0.58, respectively. However, the configurational landscape evolved significantly, with two previous configurations—employee-financed and executive profitable—disappearing, while two new configurations integrating green innovation emerged: executive green synergy and employee green-financed.
Table 6.
Second fsQCA configurational analysis results.
Coverage was chosen as the primary interpretative measure for its ability to assess a configuration’s empirical relevance in explaining observed cases, as supported by prior study [31]. The newly identified pathway, “Executive Green Synergy”, includes green patents and achieves a raw coverage of 0.41, surpassing other pathways. This indicates that combining green patents with other factors, such as the number of employees, managerial education level, and government subsidies, enhances the effectiveness of corporate innovation. This finding suggests that green patents amplify and support foundational innovation conditions, thereby fostering higher innovation output [32,33].
From a pathway perspective, the executive green synergy configuration explains some innovation cases that could not be fully accounted for without green patents. This implies that green patents provide additive support to the foundational conditions, resulting in a more pronounced innovation effect compared to relying solely on the basic factors. This additive effect reflects the amplifying role of green innovation in corporate innovation, highlighting the multiplier effect of green patents under certain conditions.
Figure 3 presents the case distribution map of second fsQCA. The case of DBN Group (stock code 002385) aligns with the “Executive Green Synergy” configuration, corresponding to Case 25, and illustrates the synergy between green patents, employee count, managerial education, and government subsidies in driving corporate innovation. DBN has made significant investments in green technology, with the highest number of green patent applications among all 84 cases, underscoring the company’s commitment to green innovation. With over 20,000 employees, the company has a substantial human resource base supporting innovation in several fields, such as bio-breeding and smart agriculture. Furthermore, several senior executives hold doctoral degrees, such as the chairman with a Ph.D. in Agronomy, providing intellectual support for the company’s green innovation initiatives. Government subsidies also help reduce R&D costs, enhancing the sustainability of green innovation. These factors work together to propel DBN’s remarkable progress in green innovation.
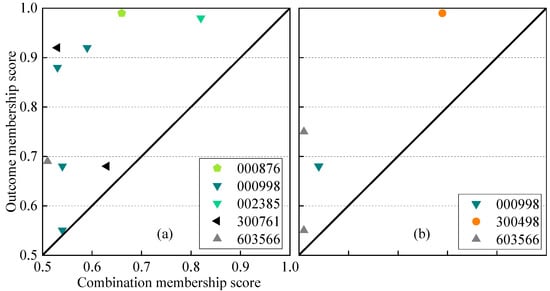
Figure 3.
Case distribution map for the second fsQCA. (a) Executive green synergy model; (b) employee green-financed model. Numbers in the legend correspond to the stock codes of listed companies.
The Employee Green-Financed configuration, while identified as a distinct pathway, does not represent a unique innovation strategy from a company-level perspective. Although it has a unique coverage of 0.06, all companies in this configuration also appear in other pathways, indicating that this is not an independent route to innovation but rather a variation of existing financial and workforce-driven strategies. The findings suggest that green patents contribute to corporate innovation only when firms already possess financial stability and external support, rather than being a universal driver of patenting activities [34,35].
3.4. Robustness Testing
For both fsQCA analyses, a constant consistency threshold of 0.80 and a PRI threshold of 0.65 were used. To verify the robustness and reliability of the results, this study conducted robustness testing by adjusting the consistency threshold from 0.80 to 0.85, which did not alter the configuration results. Similarly, when the PRI threshold was increased from 0.65 to 0.70, the first configurational outcomes remained unchanged, while the second configurational results became a subset of the original findings. These findings indicate that even with stricter threshold settings, the core configurational structures remain stable, further confirming the robustness and reliability of the analysis.
4. Discussion
The solution consistency and overall coverage remained stable between the first and second analysis. While the overall explanatory power remained unchanged, the configurational landscape evolved significantly after introducing green patents as a conditional variable. Two configurations from the first analysis persisted in the second analysis, showing that some firms maintain stable innovation pathways regardless of green patent adoption. Two new configurations emerged in the second analysis, and both involve green patents, indicating that green innovation plays a role in creating alternative routes to non-green patenting. This suggests that green patents do not universally enhance innovation across all firms but rather reshape how firms innovate under specific conditions.
The first fsQCA results identify four distinct innovation pathways, each demonstrating different combinations of firm-level and external influences. Managerial education, return on net assets, and government subsidies repeatedly emerge as core conditions, highlighting their significant role in driving non-green patent applications [36]. Interestingly, ownership concentration does not exert a uniform effect, as both dispersed and concentrated ownership structures contribute to innovation under different conditions. This reinforces the idea that corporate governance does not determine innovation success in isolation but interacts with financial and knowledge resources to shape innovation trajectories [37].
The second fsQCA results show that green patents do not universally enhance non-green innovation but serve as conditional amplifiers when combined with key firm capabilities. The executive green synergy pathway demonstrates that green patents enhance non-green innovation when aligned with managerial education, financial stability, and government subsidies. This suggests that green innovation efforts are most effective when firms have the absorptive capacity to integrate them into broader technological advancements [38]. However, the employee green-financed pathway, while present in the solution, does not represent a distinct innovation trajectory at the firm level, as all firms in this category also appear in other configurations. This indicates that green patents alone are not sufficient to drive non-green patent innovation but must be supported by complementary financial and managerial resources.
These results refine our understanding of green innovation spillovers. While prior research suggests that green innovation contributes to broader technological advancements [39], our findings highlight that such spillovers are conditional, requiring a firm’s ability to integrate green knowledge into its overall innovation framework. This aligns with studies emphasizing the importance of firm-level absorptive capacity in leveraging green technologies [40].
5. Conclusions and Recommendations
5.1. Conclusions and Future Work
This study investigates the role of green patents in innovation among listed Chinese agricultural enterprises, employing a comparative fsQCA approach to analyze how the inclusion of green patents reshapes non-green patent innovation pathways. The findings highlight that green patents do not universally drive innovation but instead act as amplifiers within specific configurations of firm capabilities and policy support.
The first fsQCA analysis, which focused on traditional factors, identified four innovation pathways shaped by managerial education, financial performance, ownership structure, and government subsidies. The second fsQCA analysis, incorporating green patents as an additional condition, revealed that two configurations persisted from the first analysis, while two new configurations emerged—both involving green patents. This indicates that green patents do not fundamentally change overall innovation potential but rather introduce alternative innovation routes for firms that have the necessary absorptive capacity.
Although solution consistency and overall coverage remained unchanged between the two analyses, the reconfiguration of pathways demonstrates that green patents influence innovation strategies by modifying how firms leverage their existing resources. Specifically, the executive green synergy pathway confirms that green patents enhance innovation when aligned with managerial education, financial stability, and government support, whereas the employee green-financed pathway does not form a distinct innovation strategy at the firm level, as all firms in this group also appear in other configurations.
Future research will expand the analysis to include unlisted agricultural enterprises and cross-sector comparisons to provide a broader perspective on the role of green innovation. In addition, incorporating qualitative methods, such as case studies or interviews with executives, could offer deeper insights into the practical challenges and strategies for integrating green technologies effectively. Furthermore, considering the impact of interest rates on innovation financing would be valuable, as different types of innovation often require external funding, and financial conditions can significantly influence firms’ ability to invest in green technologies.
5.2. Recommendations
From policy and management perspectives, this study offers the following recommendations:
- For policymakers, the results suggest that long-term and stable R&D subsidies should be provided to support firms investing in both green and non-green innovation, ensuring that financial incentives are structured to facilitate the integration of green patents into broader innovation strategies. In addition to financial support, investment in managerial education programs is crucial, as the study highlights the role of executive expertise in maximizing the benefits of green patents. Policies should promote leadership development and training programs tailored to agricultural enterprises, equipping managers with the necessary skills to effectively leverage green innovation.
- From a corporate management perspective, firms should focus on strategically aligning green patents with their existing R&D efforts rather than treating them as isolated innovation assets. The findings indicate that green patents alone are insufficient to drive non-green patent innovation unless complemented by strong managerial education, financial stability, and policy incentives. To optimize innovation performance, firms should ensure that their governance structures are adapted to support long-term innovation investment, recognizing that ownership concentration alone does not determine success. A well-balanced governance model should allow for both managerial autonomy and strategic oversight, fostering an environment where green patents can be effectively utilized.
- Promoting green innovation in agricultural enterprises contributes to broader sustainability goals, reducing environmental impact and supporting the transition to more sustainable agricultural practices. By fostering green patents and technological advancements, societies benefit from improved resource efficiency and environmental conservation.
Author Contributions
Conceptualization, Y.Z., B.G. and D.Y.; methodology, Y.Z. and B.G.; software, Y.Z.; validation, B.G.; investigation, Y.Z.; resources, B.G. and X.X.; data curation, Y.Z.; writing—original draft preparation, Y.Z.; writing—review and editing, B.G., X.X. and D.Y.; supervision, B.G.; project administration, B.G.; funding acquisition, B.G. All authors have read and agreed to the published version of the manuscript.
Funding
This work is supported by the Zhoushan Science and Technology Plan Project (2022C41024), the General Project of the National Social Science Fund of China (24BGL222), and the Major Project of the National Social Science Fund of China (22&ZD152).
Institutional Review Board Statement
Not applicable.
Informed Consent Statement
Not applicable.
Data Availability Statement
Dataset available on request from the authors.
Conflicts of Interest
The authors declare no conflicts of interest.
References
- Lioutas, E.D.; Charatsari, C. Green Innovativeness in Farm Enterprises: What Makes Farmers Think Green? Sustain. Dev. 2018, 26, 337–349. [Google Scholar] [CrossRef]
- Shen, J.; Zhu, Q.; Jiao, X.; Ying, H.; Wang, H.; Wen, X.; Xu, W.; Li, T.; Cong, W.; Liu, X.; et al. Agriculture Green Development: A Model for China and the World. Front. Agric. Sci. Eng. 2020, 7, 5–13. [Google Scholar] [CrossRef]
- Xu, R.; Shen, Y.; Liu, M.; Li, L.; Xia, X.; Luo, K. Can Government Subsidies Improve Innovation Performance? Evidence from Chinese Listed Companies. Econ. Model. 2023, 120, 106151. [Google Scholar] [CrossRef]
- Yang, D.; Qin, Y.; Xu, Y.; Xing, K.; Chen, Y.; Jia, X.; Aviso, K.B.; Tan, R.R.; Wang, B. Sequestration of Carbon Dioxide from the Atmosphere in Coastal Ecosystems: Quantification, Analysis, and Planning. Sustain. Prod. Consum. 2024, 47, 413–424. [Google Scholar] [CrossRef]
- Jovanović, M.; Krstić, B.; Berezjev, L. Green Patents as a Determinant of Sustainable Economic Growth. Econ. Sustain. Dev. 2022, 6, 1–15. [Google Scholar] [CrossRef]
- Rubenstein, A.H.; Chakrabarti, A.K.; O’Keefe, R.D.; Souder, W.E.; Young, H.C. Factors Influencing Innovation Success at the Project Level. Res. Manag. 1976, 19, 15–20. [Google Scholar] [CrossRef]
- Yin, P. Research on Efficiency and Influencing Factors of Scientific and Technological Innovation of Agricultural Iisted Companies. Master’s Thesis, Shandong Agricultural University, Taian, China, 2024. [Google Scholar] [CrossRef]
- Vakulenko, M. The Moderating Role of Innovation Capability in the Relationship between the Liability of Smallness and Innovative Outputs. Technol. Anal. Strateg. Manag. 2021, 33, 914–926. [Google Scholar] [CrossRef]
- Matras-Bolibok, A. Does Firm’s Size Impact Innovative Performance? Int. J. Innov. Learn. 2014, 15, 422–431. [Google Scholar] [CrossRef]
- Setiawan, D.; Asrihapsari, A.; Maisaroh, S.; Widawati, M.W. Determinants of Environmental Performance: Evidence from the Agriculture Industry in Indonesian Stock Exchange. IOP Conf. Ser. Earth Environ. Sci. 2021, 905, 012006. [Google Scholar] [CrossRef]
- Duan, Y.; Wang, K.; Chang, H.; Liu, W.; Xie, C. The Moderating Effect of Organizational Knowledge Utilization on Top Management Team’s Social Capital and the Innovation Quality of High-Tech Firms. J. Knowl. Manag. 2024, 28, 3104–3128. [Google Scholar] [CrossRef]
- Mazzarol, T.; Reboud, S.; Volery, T. The Influence of Size, Age and Growth on Innovation Management in Small Firms. Int. J. Technol. Manag. 2010, 52, 98–117. [Google Scholar] [CrossRef]
- Mathers, A.M.; Wang, B.; Wang, X. Shareholder Coordination and Corporate Innovation. J. Bus. Financ. Account. 2020, 47, 730–759. [Google Scholar] [CrossRef]
- Deng, Z.; Hofman, P.S.; Newman, A. Ownership Concentration and Product Innovation in Chinese Private SMEs. Asia Pac. J. Manag. 2013, 30, 717–734. [Google Scholar] [CrossRef]
- Qian, M.; Han, K. An Empirical Study on the Impact of Government Audit on the Performance of State-Owned Energy Listed Companies. In Proceedings of the 2018 15th International Conference on Service Systems and Service Management (ICSSSM), Hangzhou, China, 21–22 July 2018; Volume 166, pp. 1–5. [Google Scholar]
- Zhang, H.; Yu, S.; Zhu, H. Can Government Subsidies Improve Corporate Innovation Performance? In Proceedings of the Sixth International Conference on Information Management and Technology, Jakarta Indonesia, 19–20 August 2021; ACM: New York, NY, USA, 2021; pp. 1–6. [Google Scholar]
- Florea, A.M.; Bercu, F.; Radu, R.I.; Stanciu, S. A Fuzzy Set Qualitative Comparative Analysis (FsQCA) of the Agricultural Cooperatives from South East Region of Romania. Sustainability 2019, 11, 5927. [Google Scholar] [CrossRef]
- Fan, X.; Li, J.; Wang, Y. The Driving Factors of Innovation Quality of Agricultural Enterprises—A Study Based on NCA and FsQCA Methods. Sustainability 2023, 15, 1809. [Google Scholar] [CrossRef]
- Yu, X.; Liu, W.; Qing, L.; Zhang, D. Improving Farm Cooperatives’ Performance and Sustainability: A Study of Agricultural Managers’ Competencies Based on the Grounded Theory and the FsQCA Methods. Sustainability 2023, 15, 1263. [Google Scholar] [CrossRef]
- Cheng, C.-F.; Chang, M.-L.; Li, C.-S. Configural Paths to Successful Product Innovation. J. Bus. Res. 2013, 66, 2561–2573. [Google Scholar] [CrossRef]
- Khedhaouria, A.; Thurik, R. Configurational Conditions of National Innovation Capability: A Fuzzy Set Analysis Approach. Technol. Forecast. Soc. Change 2017, 120, 48–58. [Google Scholar] [CrossRef]
- Qian, M.; Yang, J.; Qiu, M. Configuration Paths for High-Quality Development of Listed Companies Based on the TOE Framework: Evidence from China’s High-Tech Enterprises. Sustainability 2025, 17, 1082. [Google Scholar] [CrossRef]
- Luo, W.; Zuo, S.; Tang, S.; Li, C. The Formation of New Quality Productivity of Agriculture Under the Perspectives of Digitalization and Innovation: A Dynamic Qualitative Comparative Analysis Based on the “Technology-Organization-Environment” Framework. Sustainability 2025, 17, 597. [Google Scholar] [CrossRef]
- Xie, Z.; Yang, X. How Can the Business Environment Promote Urban Innovation and High-Quality Development?—A Qualitative Comparative Analysis Based on the Perspective of Configuration. Sustainability 2025, 17, 463. [Google Scholar] [CrossRef]
- CSMAR. China Stock Market & Accounting Research Database. Available online: https://data.csmar.com/ (accessed on 6 November 2024).
- CNRDS. Chinese Research Data Services Platform. Available online: https://www.cnrds.com/Home/Login (accessed on 6 November 2024).
- Xi, J.; Wen, C.; Tang, Y.; Zhao, F. A Factor Score Clustering Approach to Analyze the Biopharmaceutical Sector in the Chinese Market during COVID-19. Financ. Innov. 2024, 10, 135. [Google Scholar] [CrossRef]
- Luo, X.; Zhang, W. Green Innovation Efficiency: A Threshold Effect of Research and Development. Clean Technol. Environ. Policy 2021, 23, 285–298. [Google Scholar] [CrossRef]
- Xia, Y.; Fan, M.; Zuo, X.; Hao, W.; Jia, Y. Government Innovation Subsidy, Executives’ Academic Capital and Innovation Quality: Evidence from Pharmaceutical Companies in China. Front. Psychol. 2023, 13, 1092162. [Google Scholar] [CrossRef] [PubMed]
- Zulfiqar, M.; Hussain, K. CEO Compensation and Firm Innovation: Moderating Role of Ownership Concentration. Int. J. Innov. Manag. 2020, 24, 2050058. [Google Scholar] [CrossRef]
- Hanckel, B.; Petticrew, M.; Thomas, J.; Green, J. The Use of Qualitative Comparative Analysis (QCA) to Address Causality in Complex Systems: A Systematic Review of Research on Public Health Interventions. BMC Public Health 2021, 21, 877. [Google Scholar] [CrossRef]
- Frare, A.B.; Beuren, I.M. The Role of Green Process Innovation Translating Green Entrepreneurial Orientation and Proactive Sustainability Strategy into Environmental Performance. J. Small Bus. Enterp. Dev. 2022, 29, 789–806. [Google Scholar] [CrossRef]
- Afeltra, G.; Alerasoul, S.A.; Strozzi, F. The Evolution of Sustainable Innovation: From the Past to the Future. Eur. J. Innov. Manag. 2023, 26, 386–421. [Google Scholar] [CrossRef]
- Pan, X.; Xu, L. Factors Influencing Corporate Innovation: A Literature Review. J. Econ. Bus. Manag. 2024, 12, 214–218. [Google Scholar] [CrossRef]
- Xu, J.; Liu, F.; Shang, Y. R&D Investment, ESG Performance and Green Innovation Performance: Evidence from China. Kybernetes 2021, 50, 737–756. [Google Scholar] [CrossRef]
- Wu, L.; Hu, K.; Lyulyov, O.; Pimonenko, T.; Hamid, I. The Impact of Government Subsidies on Technological Innovation in Agribusiness: The Case for China. Sustainability 2022, 14, 14003. [Google Scholar] [CrossRef]
- Albort-Morant, G.; Leal-Millán, A.; Cepeda-Carrión, G. The Antecedents of Green Innovation Performance: A Model of Learning and Capabilities. J. Bus. Res. 2016, 69, 4912–4917. [Google Scholar] [CrossRef]
- Abu Seman, N.A.; Govindan, K.; Mardani, A.; Zakuan, N.; Mat Saman, M.Z.; Hooker, R.E.; Ozkul, S. The Mediating Effect of Green Innovation on the Relationship between Green Supply Chain Management and Environmental Performance. J. Clean. Prod. 2019, 229, 115–127. [Google Scholar] [CrossRef]
- Cheng, P.; Wang, X.; Choi, B.; Huan, X. Green Finance, International Technology Spillover and Green Technology Innovation: A New Perspective of Regional Innovation Capability. Sustainability 2023, 15, 1112. [Google Scholar] [CrossRef]
- Qin, B.; Gai, Y.; Ge, L.; Sun, P.; Yu, Y.; Zheng, Y. FDI, Technology Spillovers, and Green Innovation: Theoretical Analysis and Evidence from China. Energies 2022, 15, 7497. [Google Scholar] [CrossRef]
Disclaimer/Publisher’s Note: The statements, opinions and data contained in all publications are solely those of the individual author(s) and contributor(s) and not of MDPI and/or the editor(s). MDPI and/or the editor(s) disclaim responsibility for any injury to people or property resulting from any ideas, methods, instructions or products referred to in the content. |
© 2025 by the authors. Licensee MDPI, Basel, Switzerland. This article is an open access article distributed under the terms and conditions of the Creative Commons Attribution (CC BY) license (https://creativecommons.org/licenses/by/4.0/).