
Assessing the Impact of Graphene Nanoplatelets Aggregates on the Performance Characteristics of Cement-Based Materials


Abstract
1. Introduction
2. Materials and Methods
2.1. Physical and Chemical Characterization of GNAs
2.2. Hydration and Phase Analysis
2.3. Flow Test and Compressive Strength
2.4. Bulk Electrical Resistivity
2.5. Water Absorption
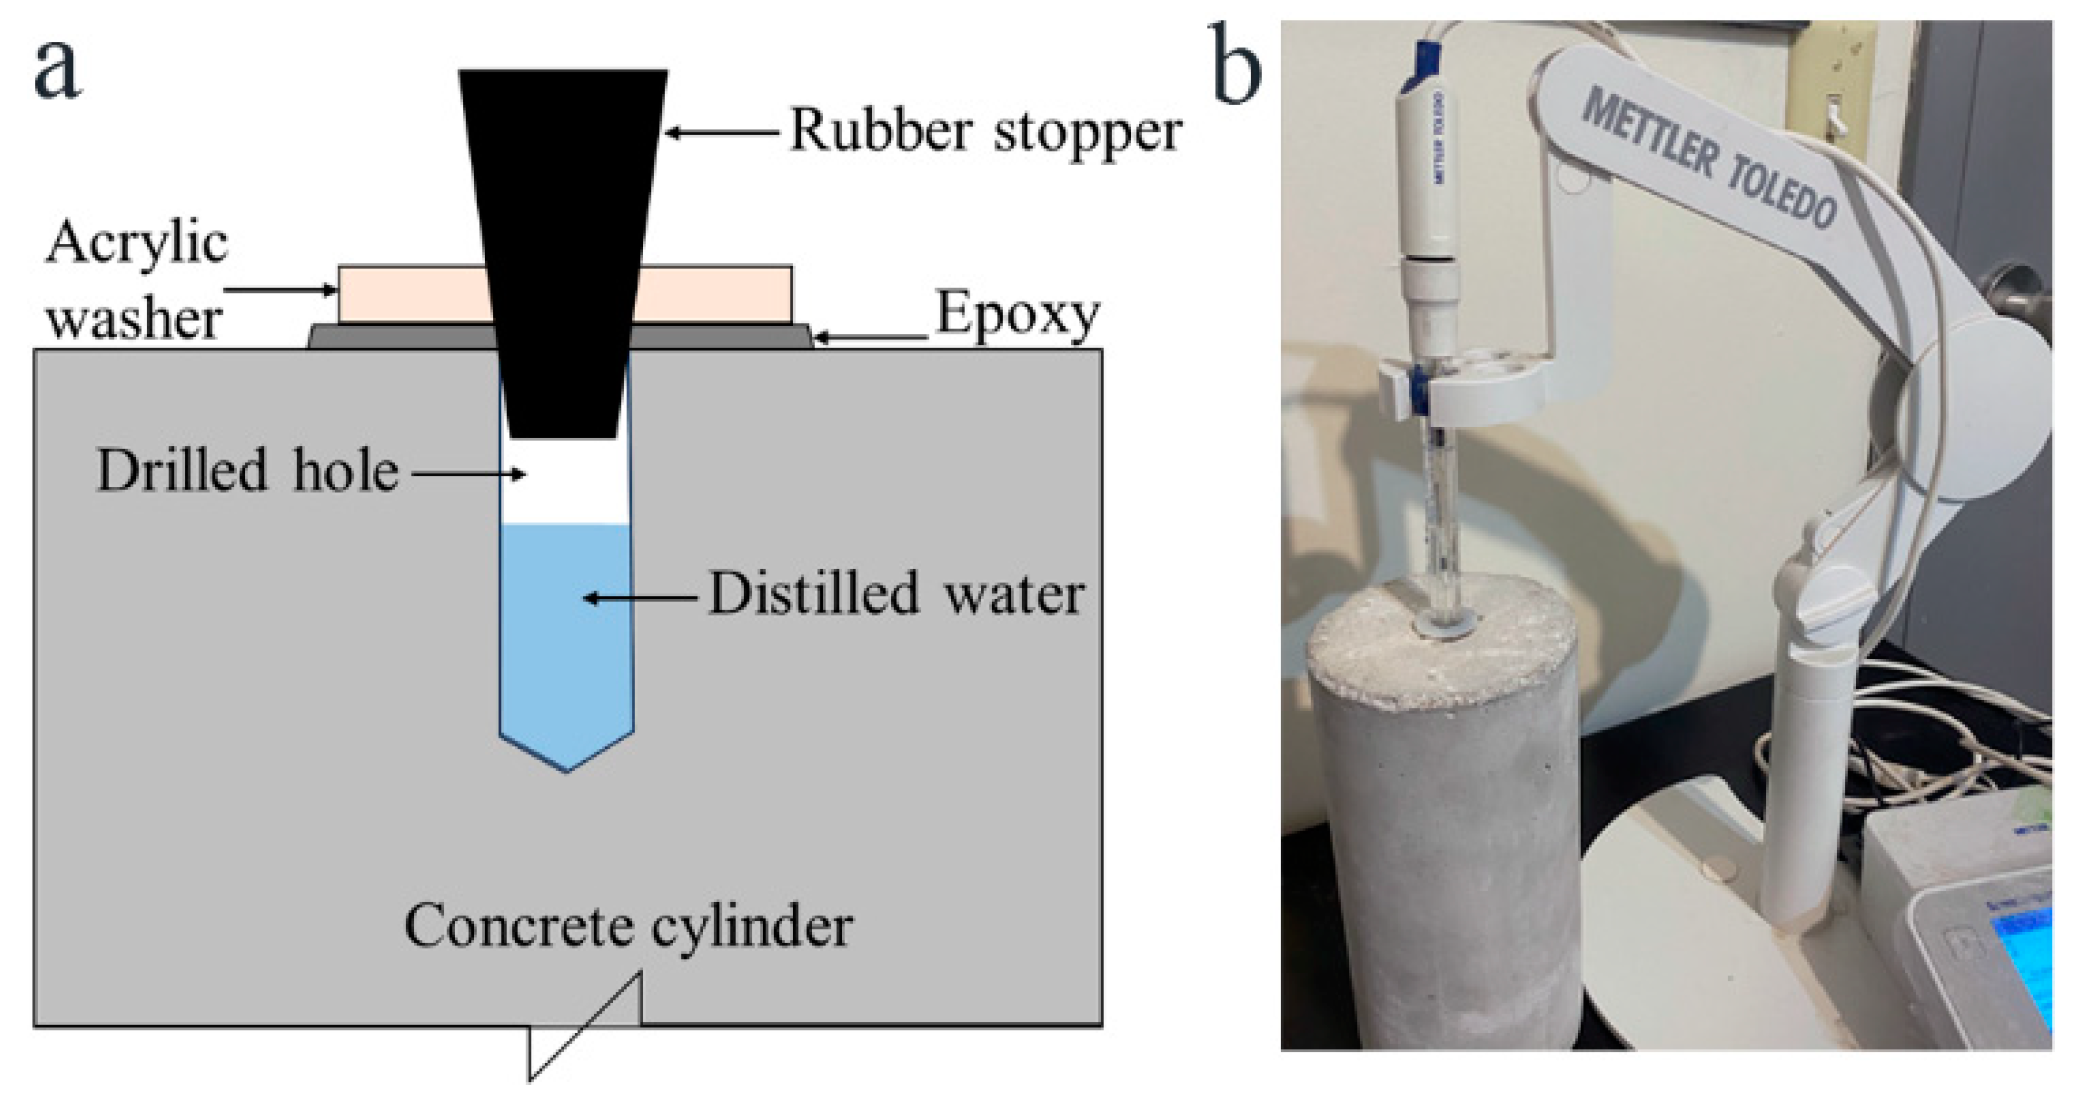
2.6. pH Measurements
3. Results and Discussion
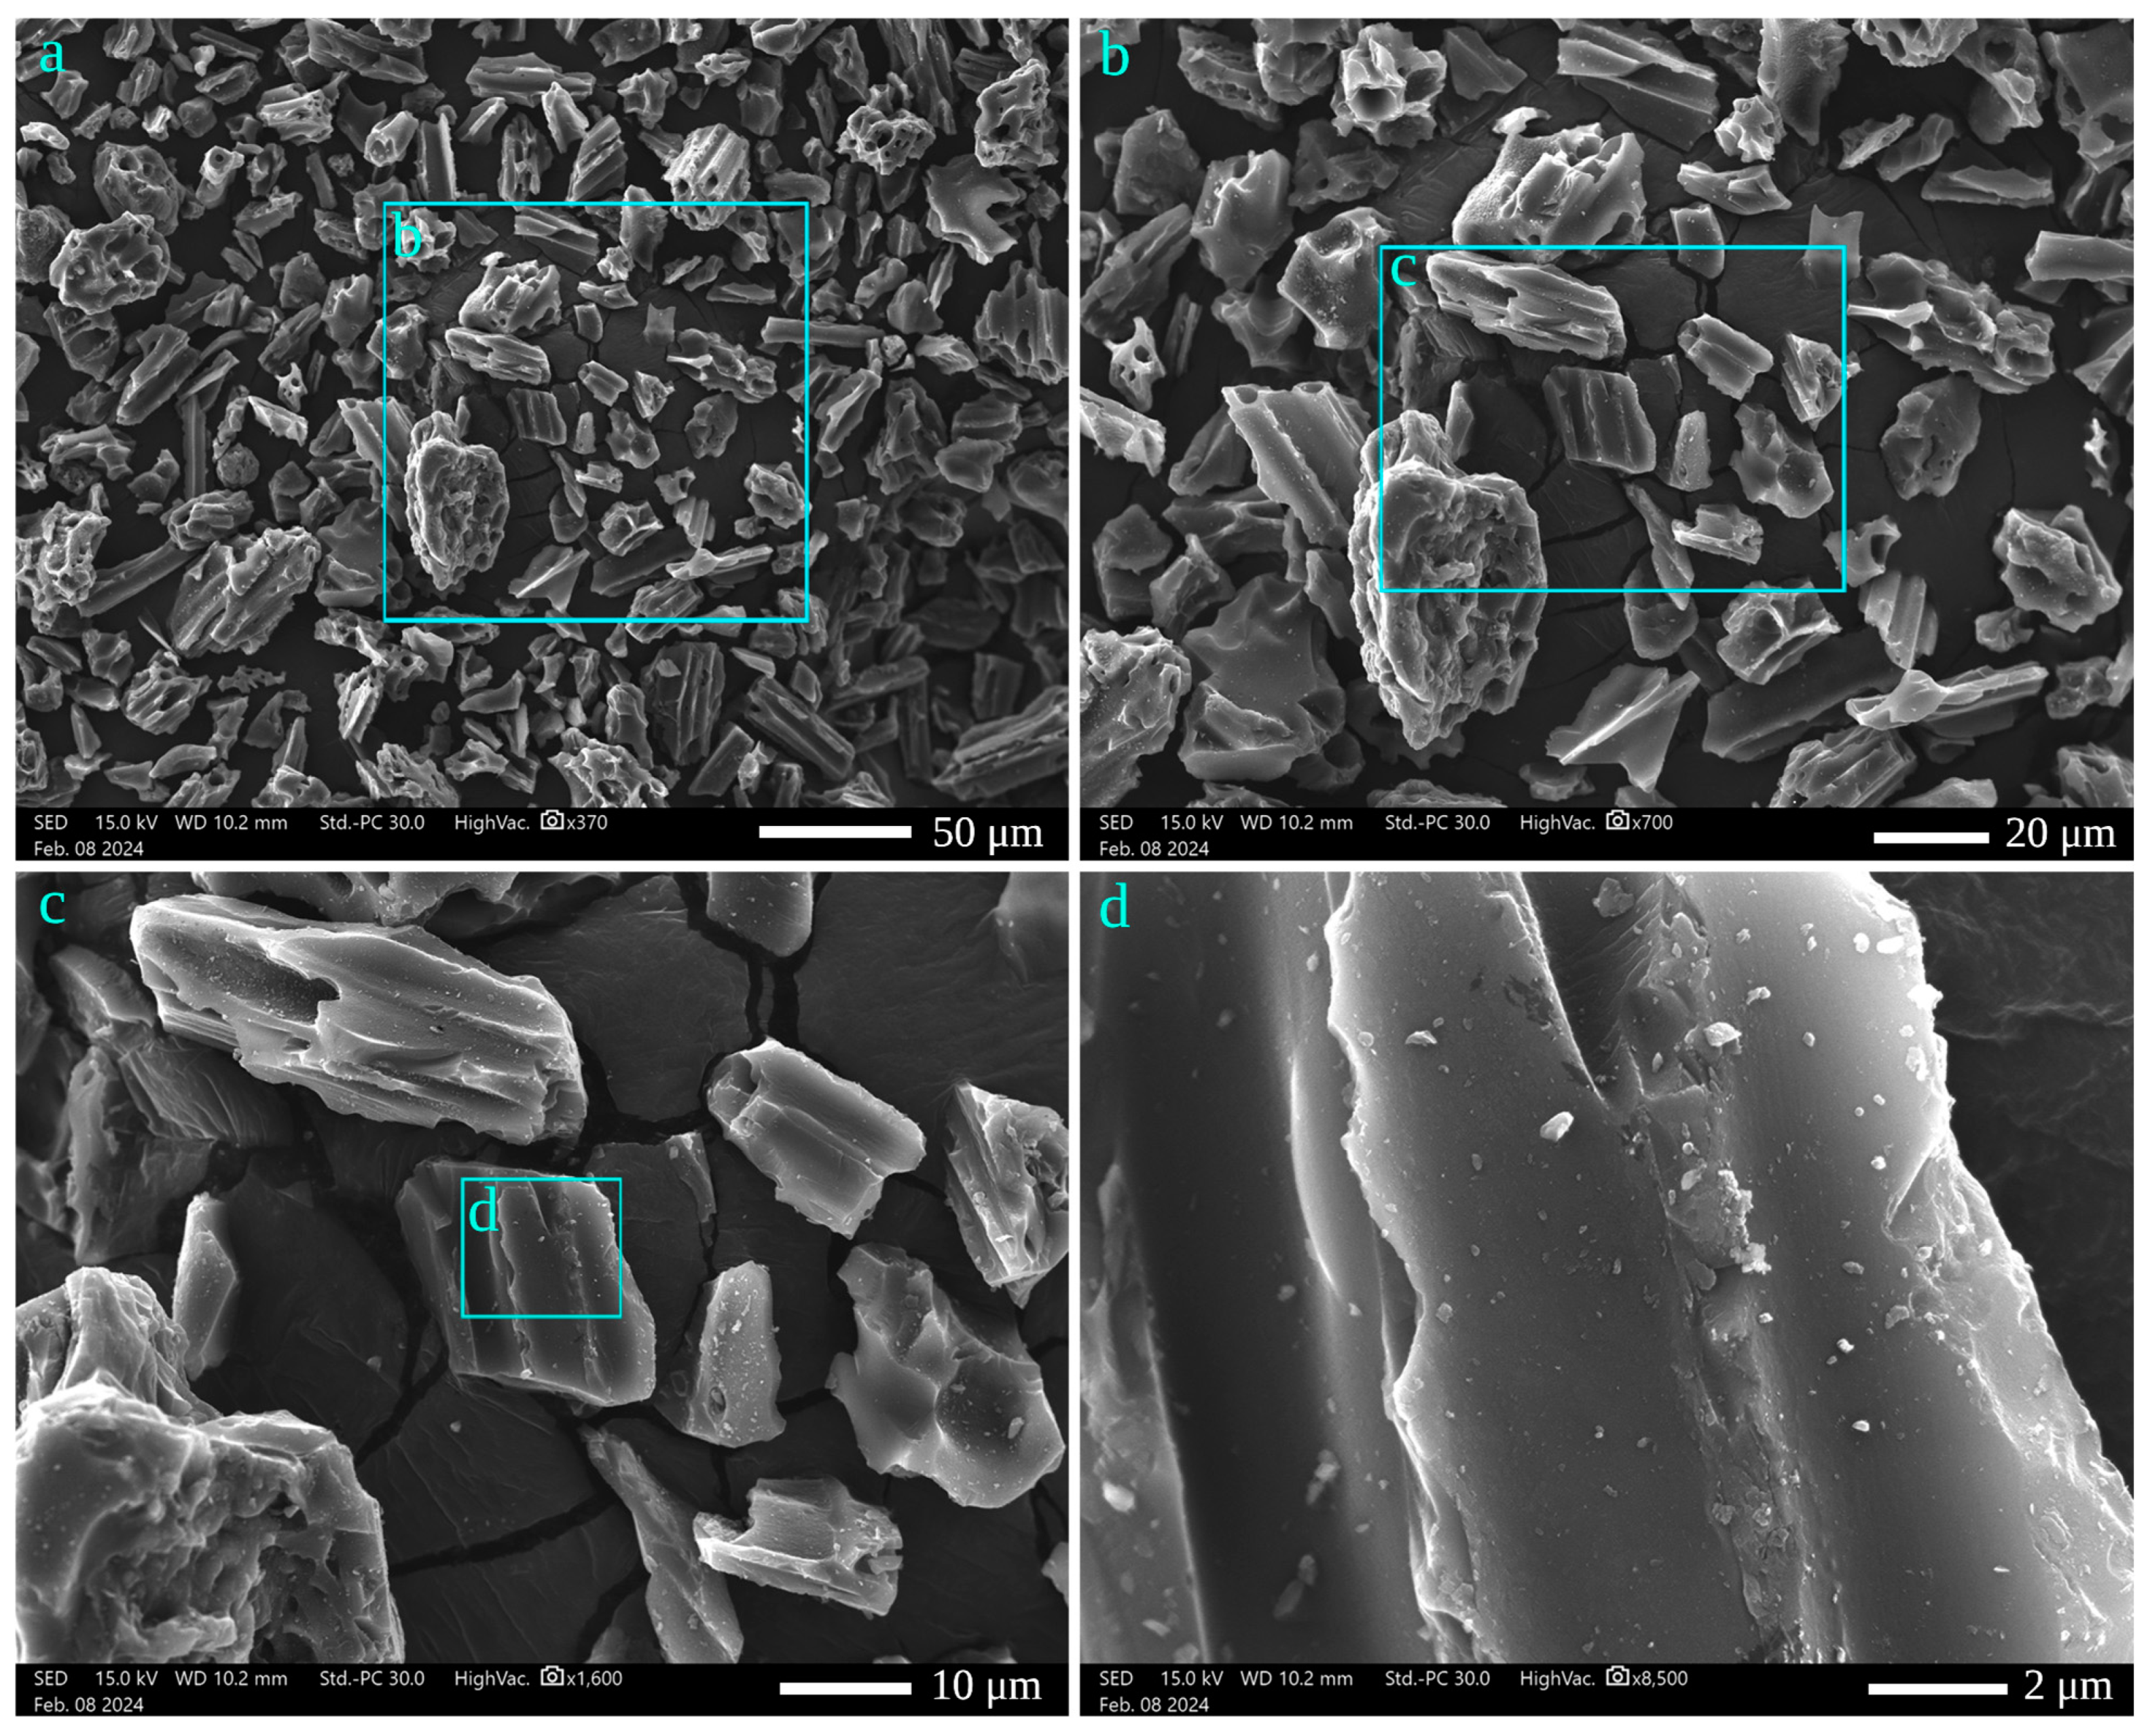
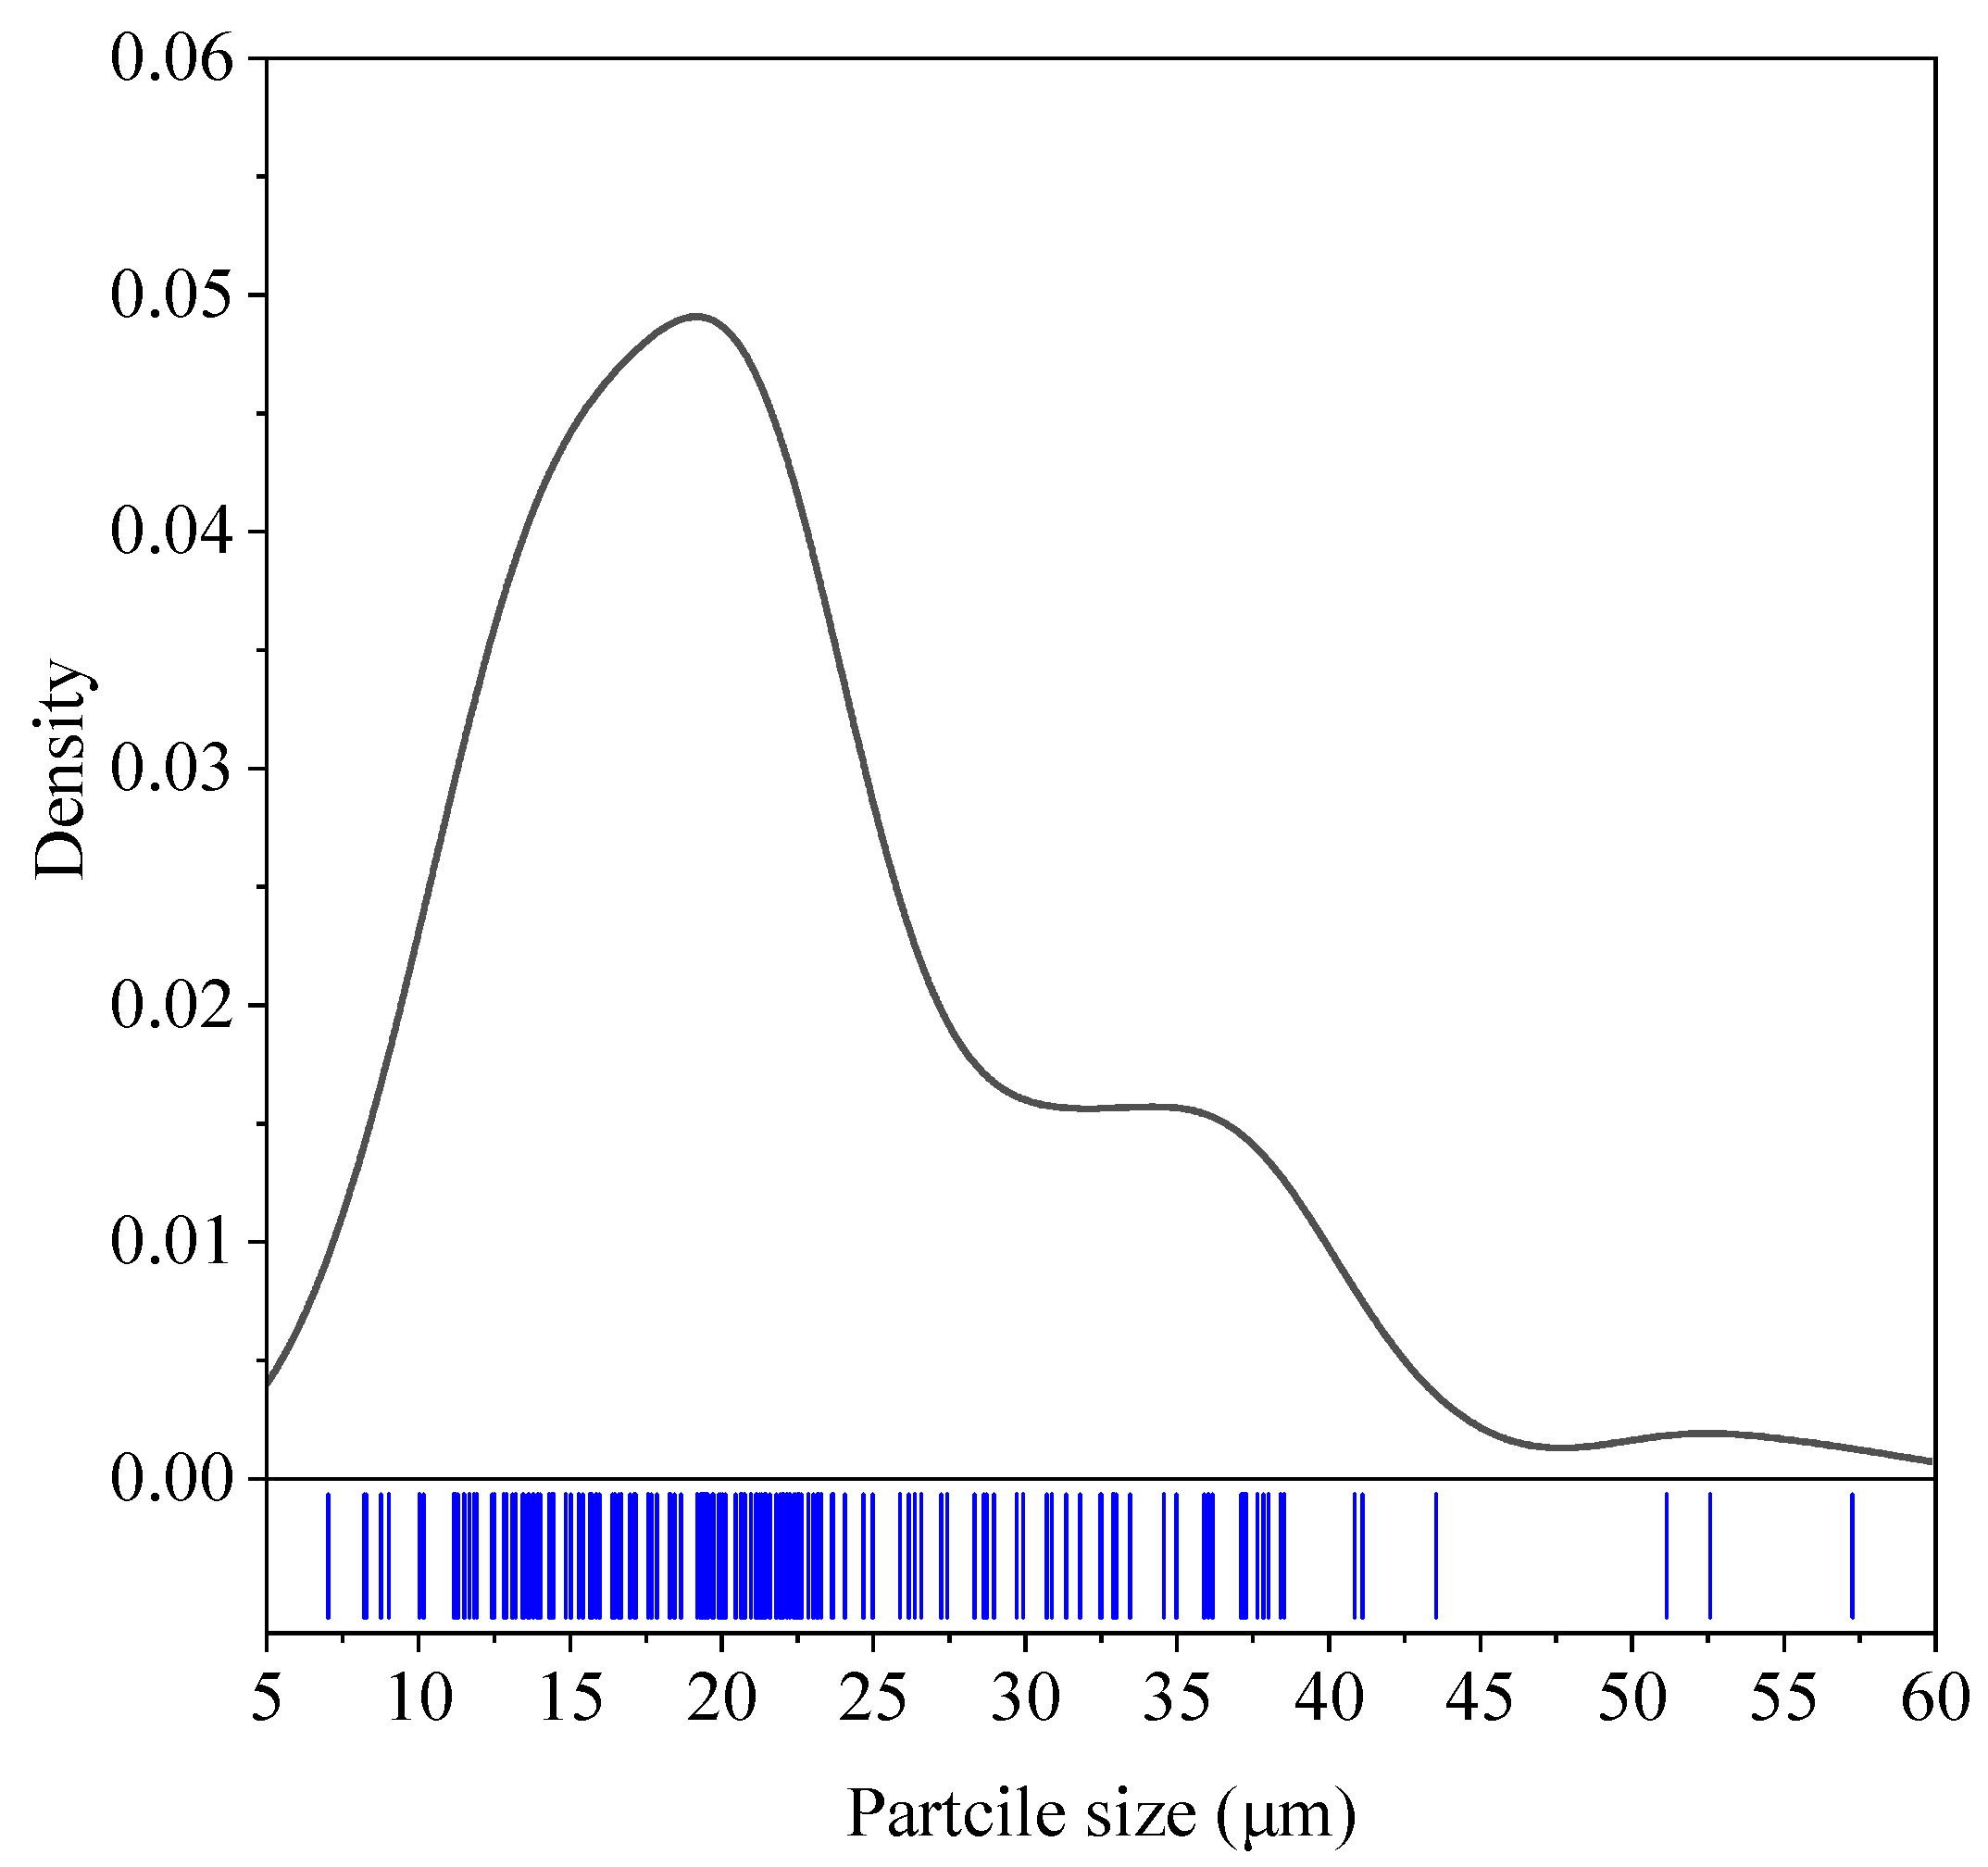
3.1. GNA Charectrization
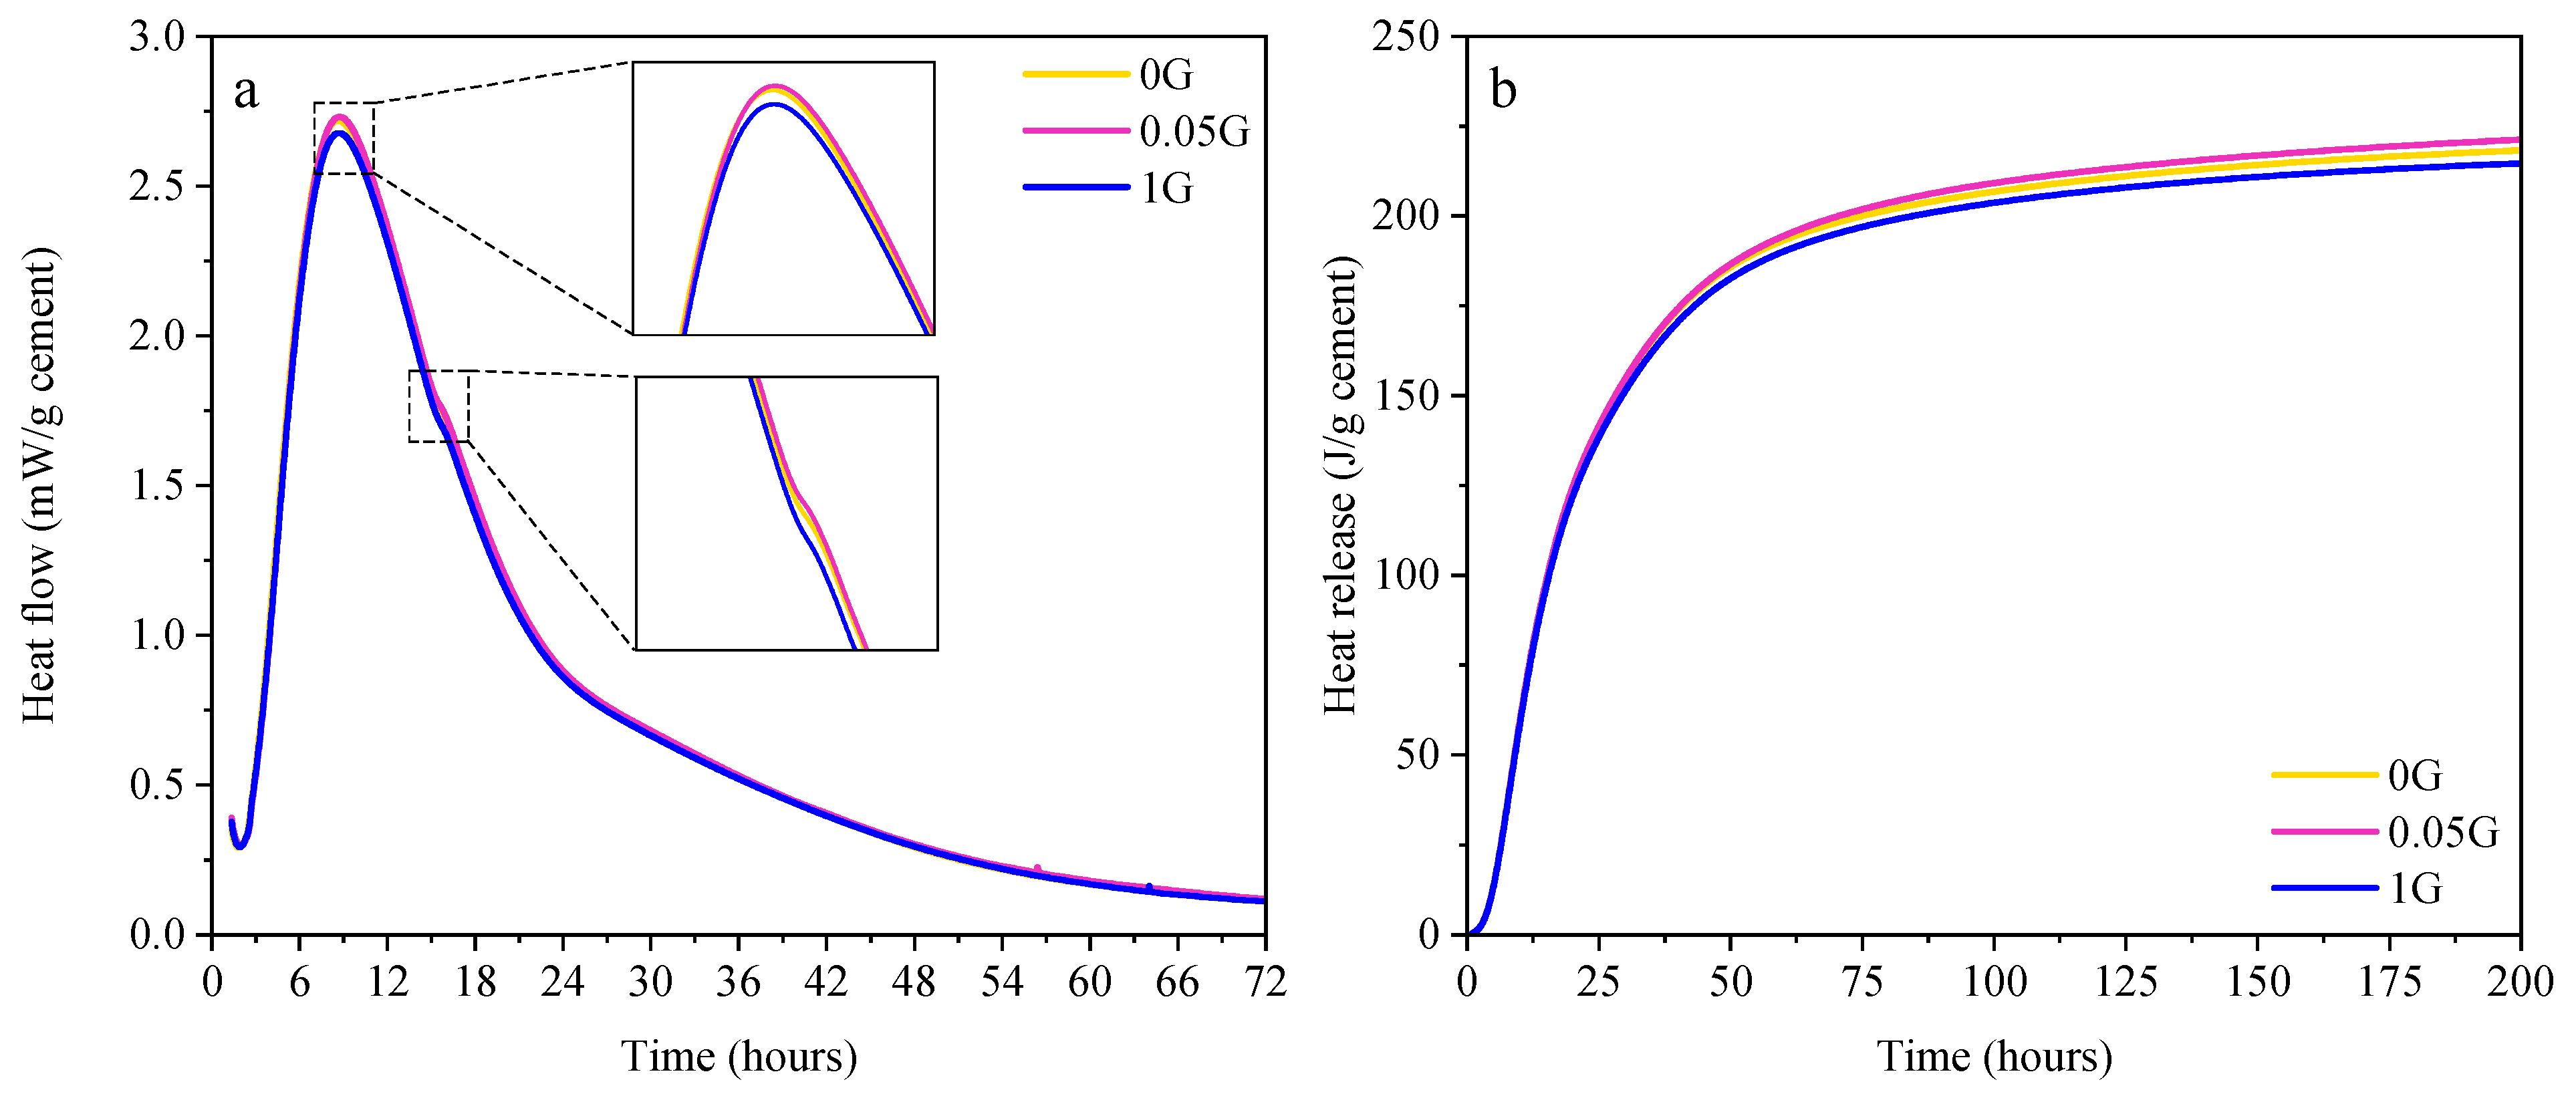
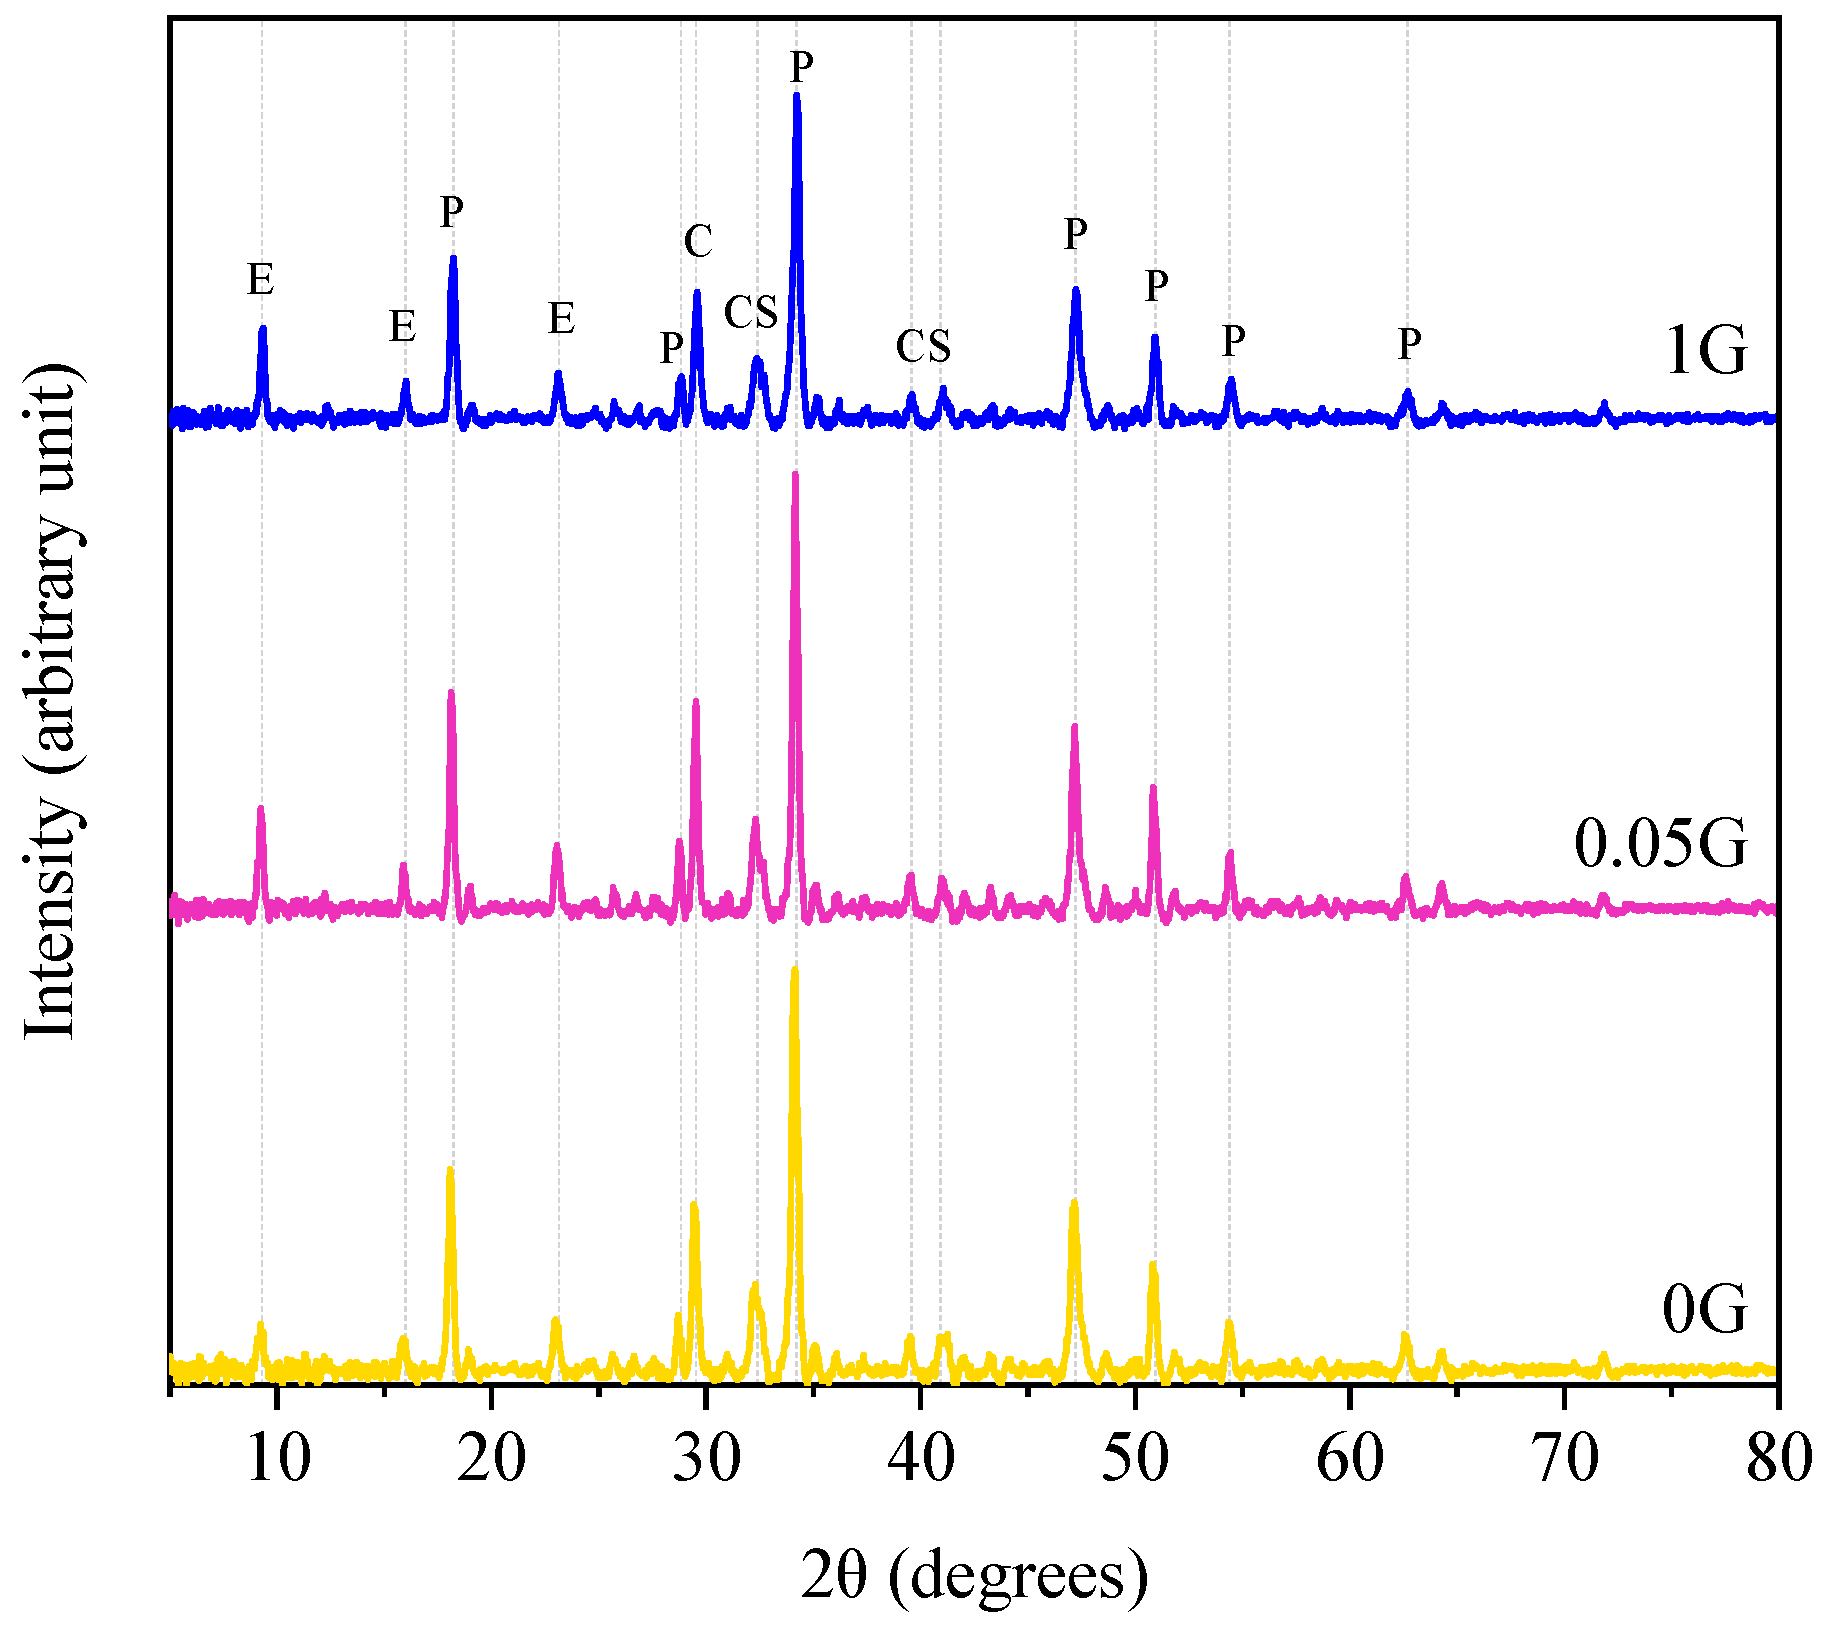
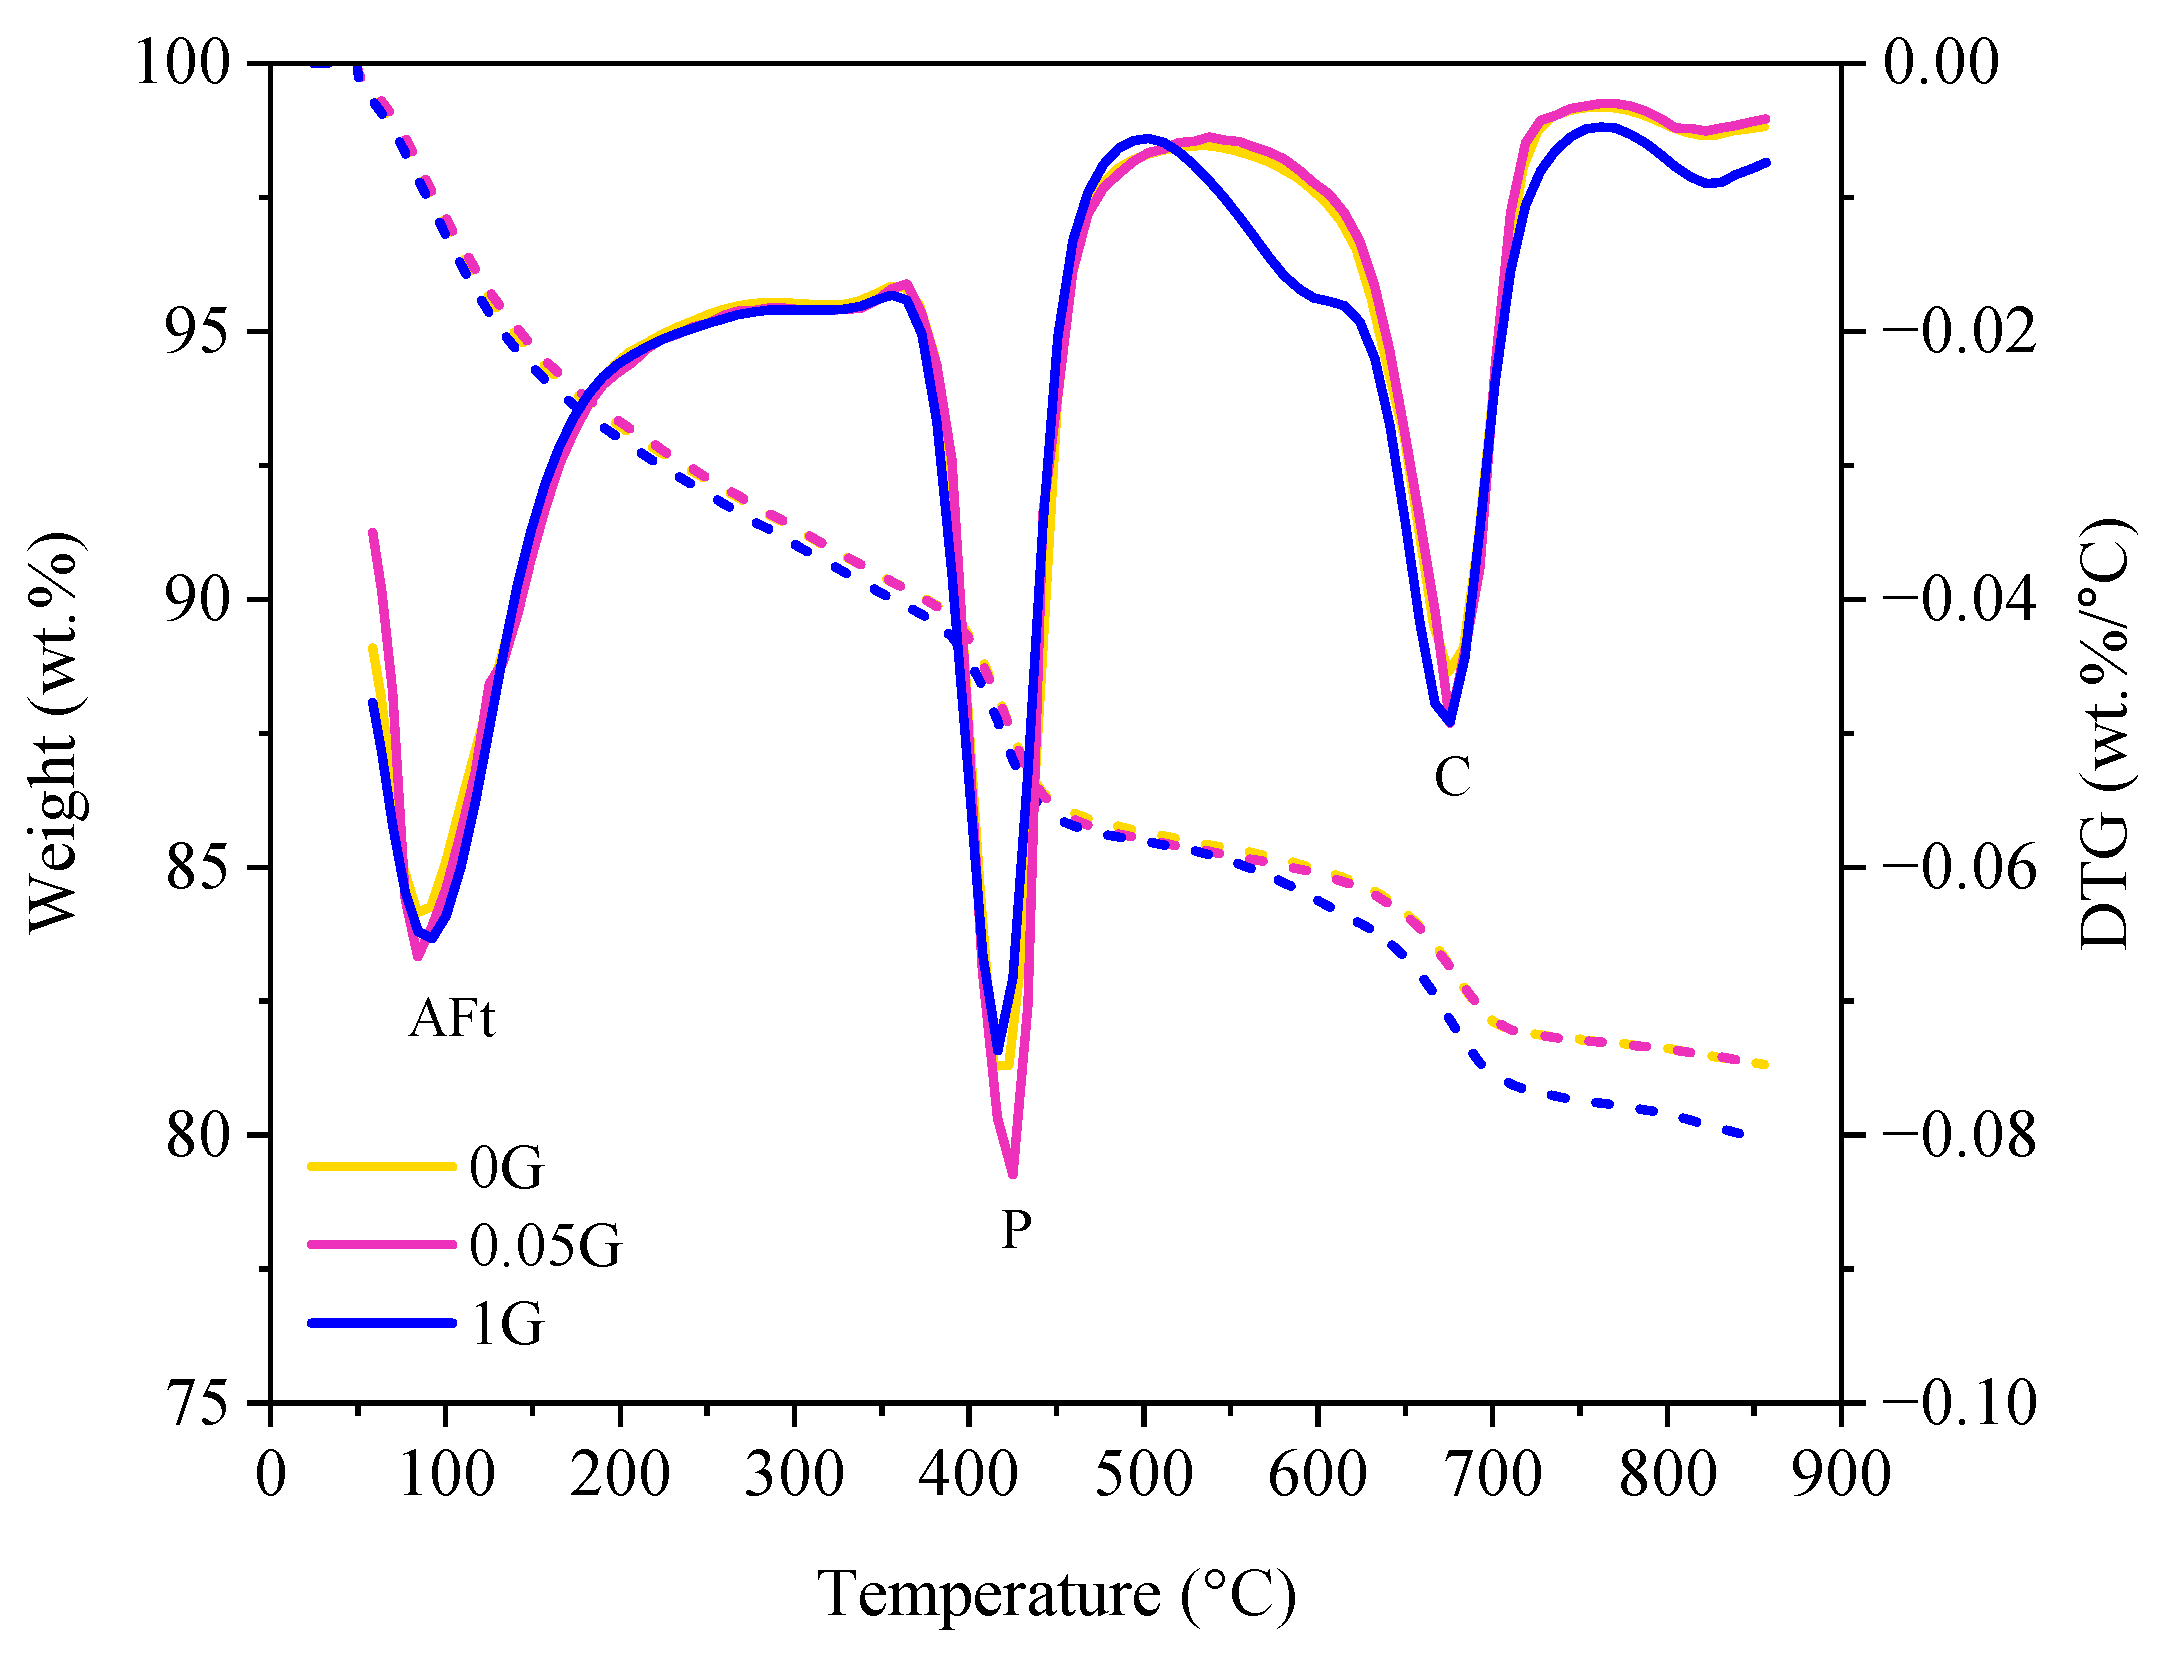
3.2. Effect of GNA on Cement Hydration
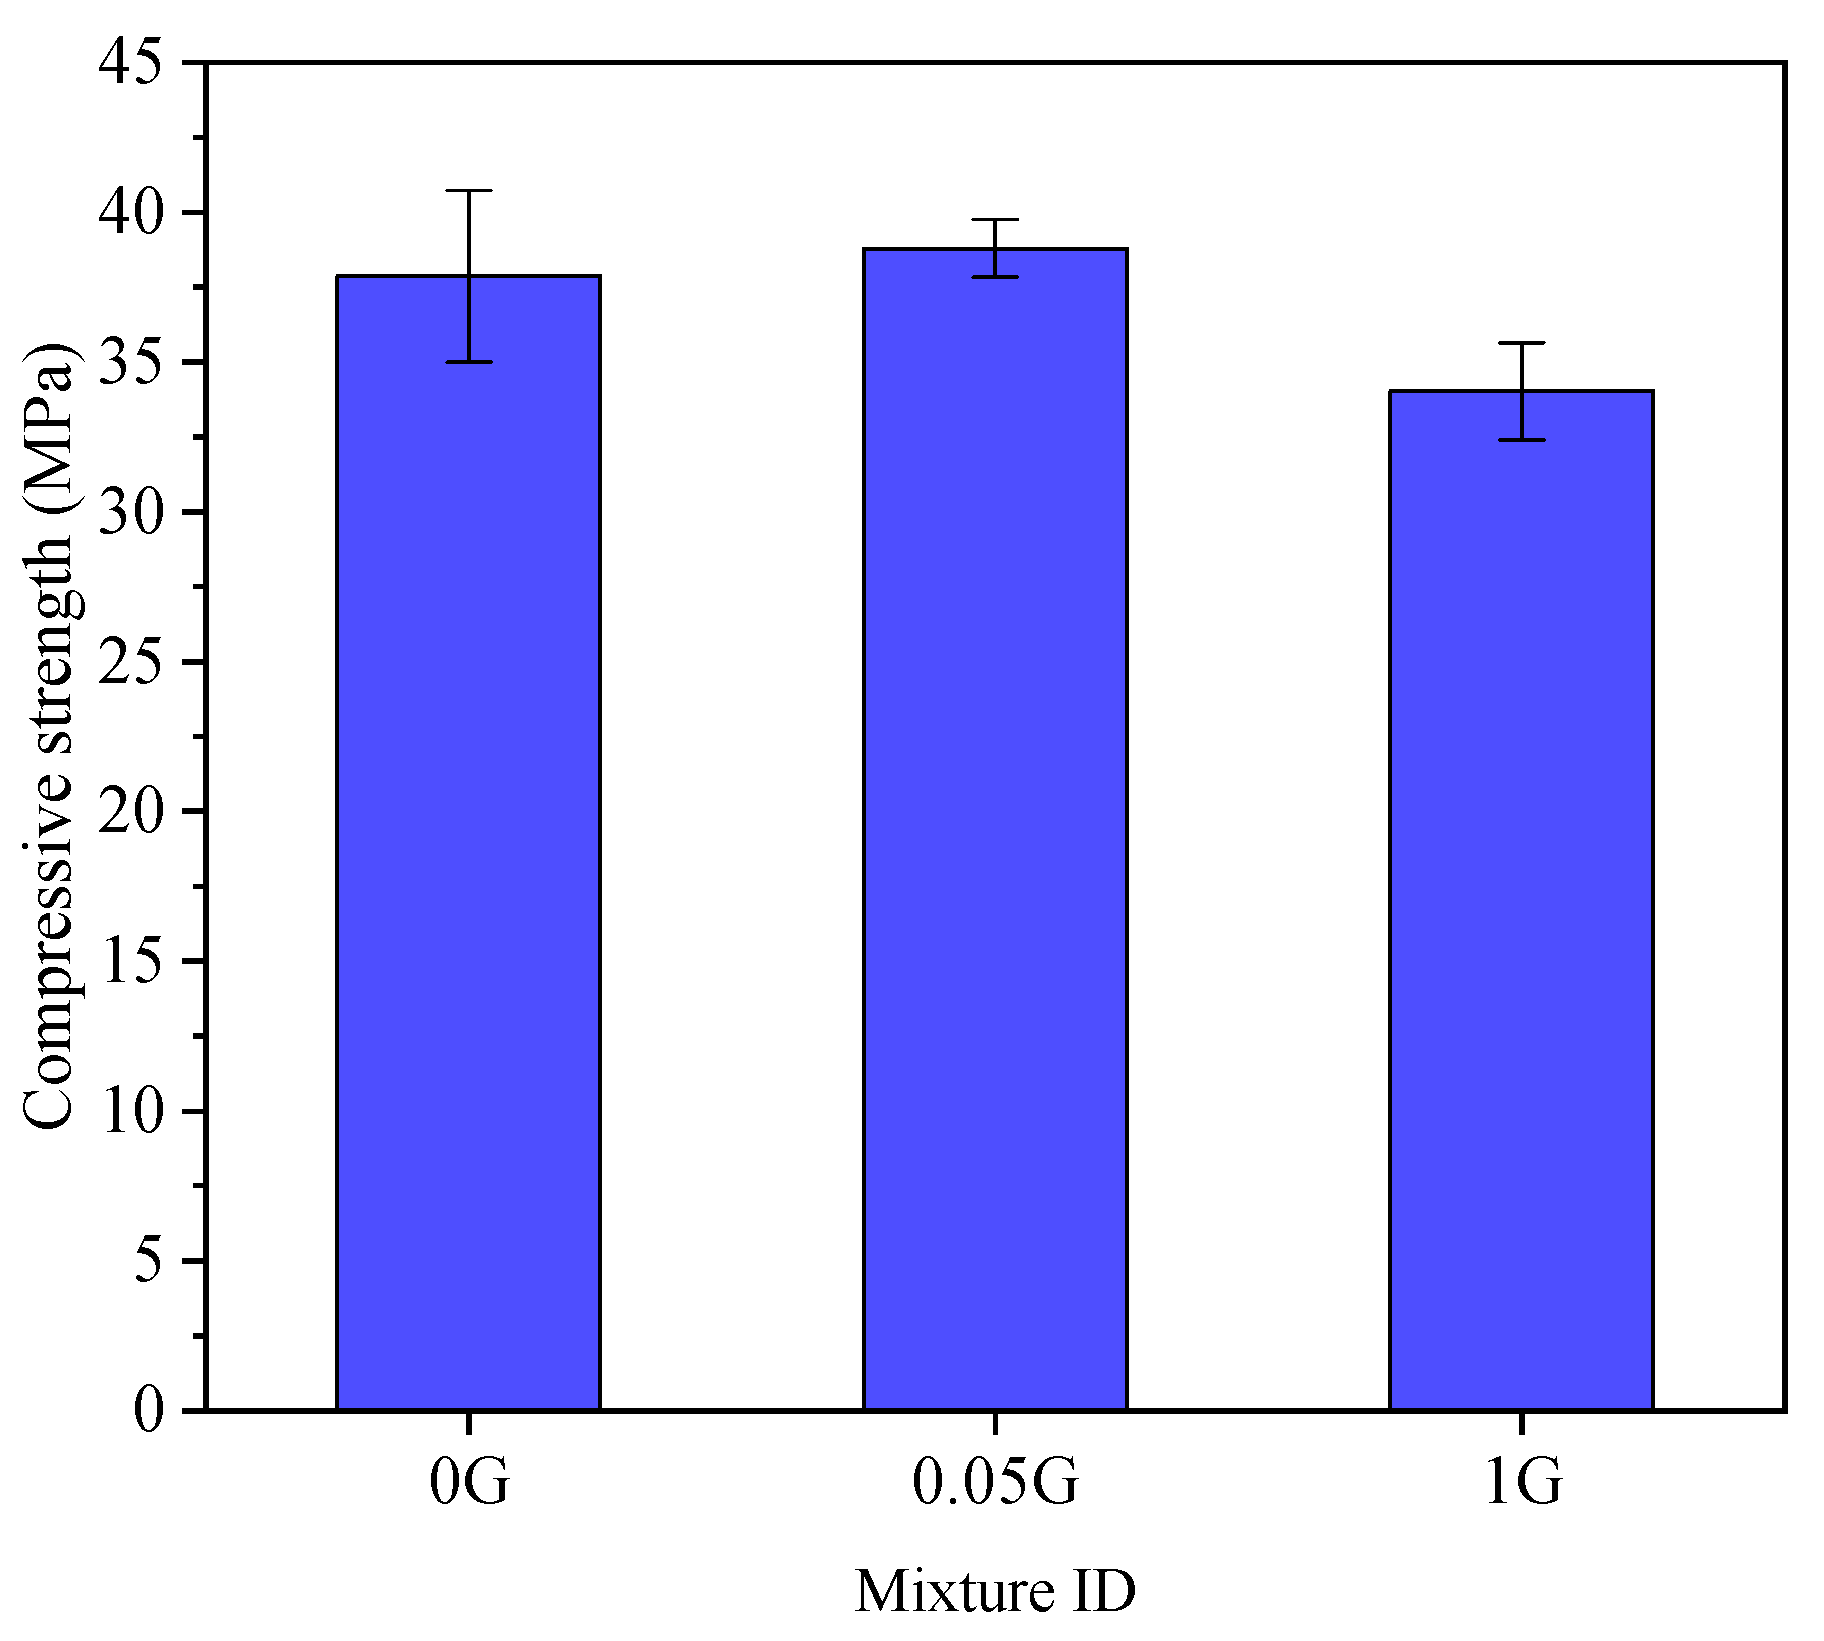
3.3. Effect of GNA on Flow and Compressive Strength
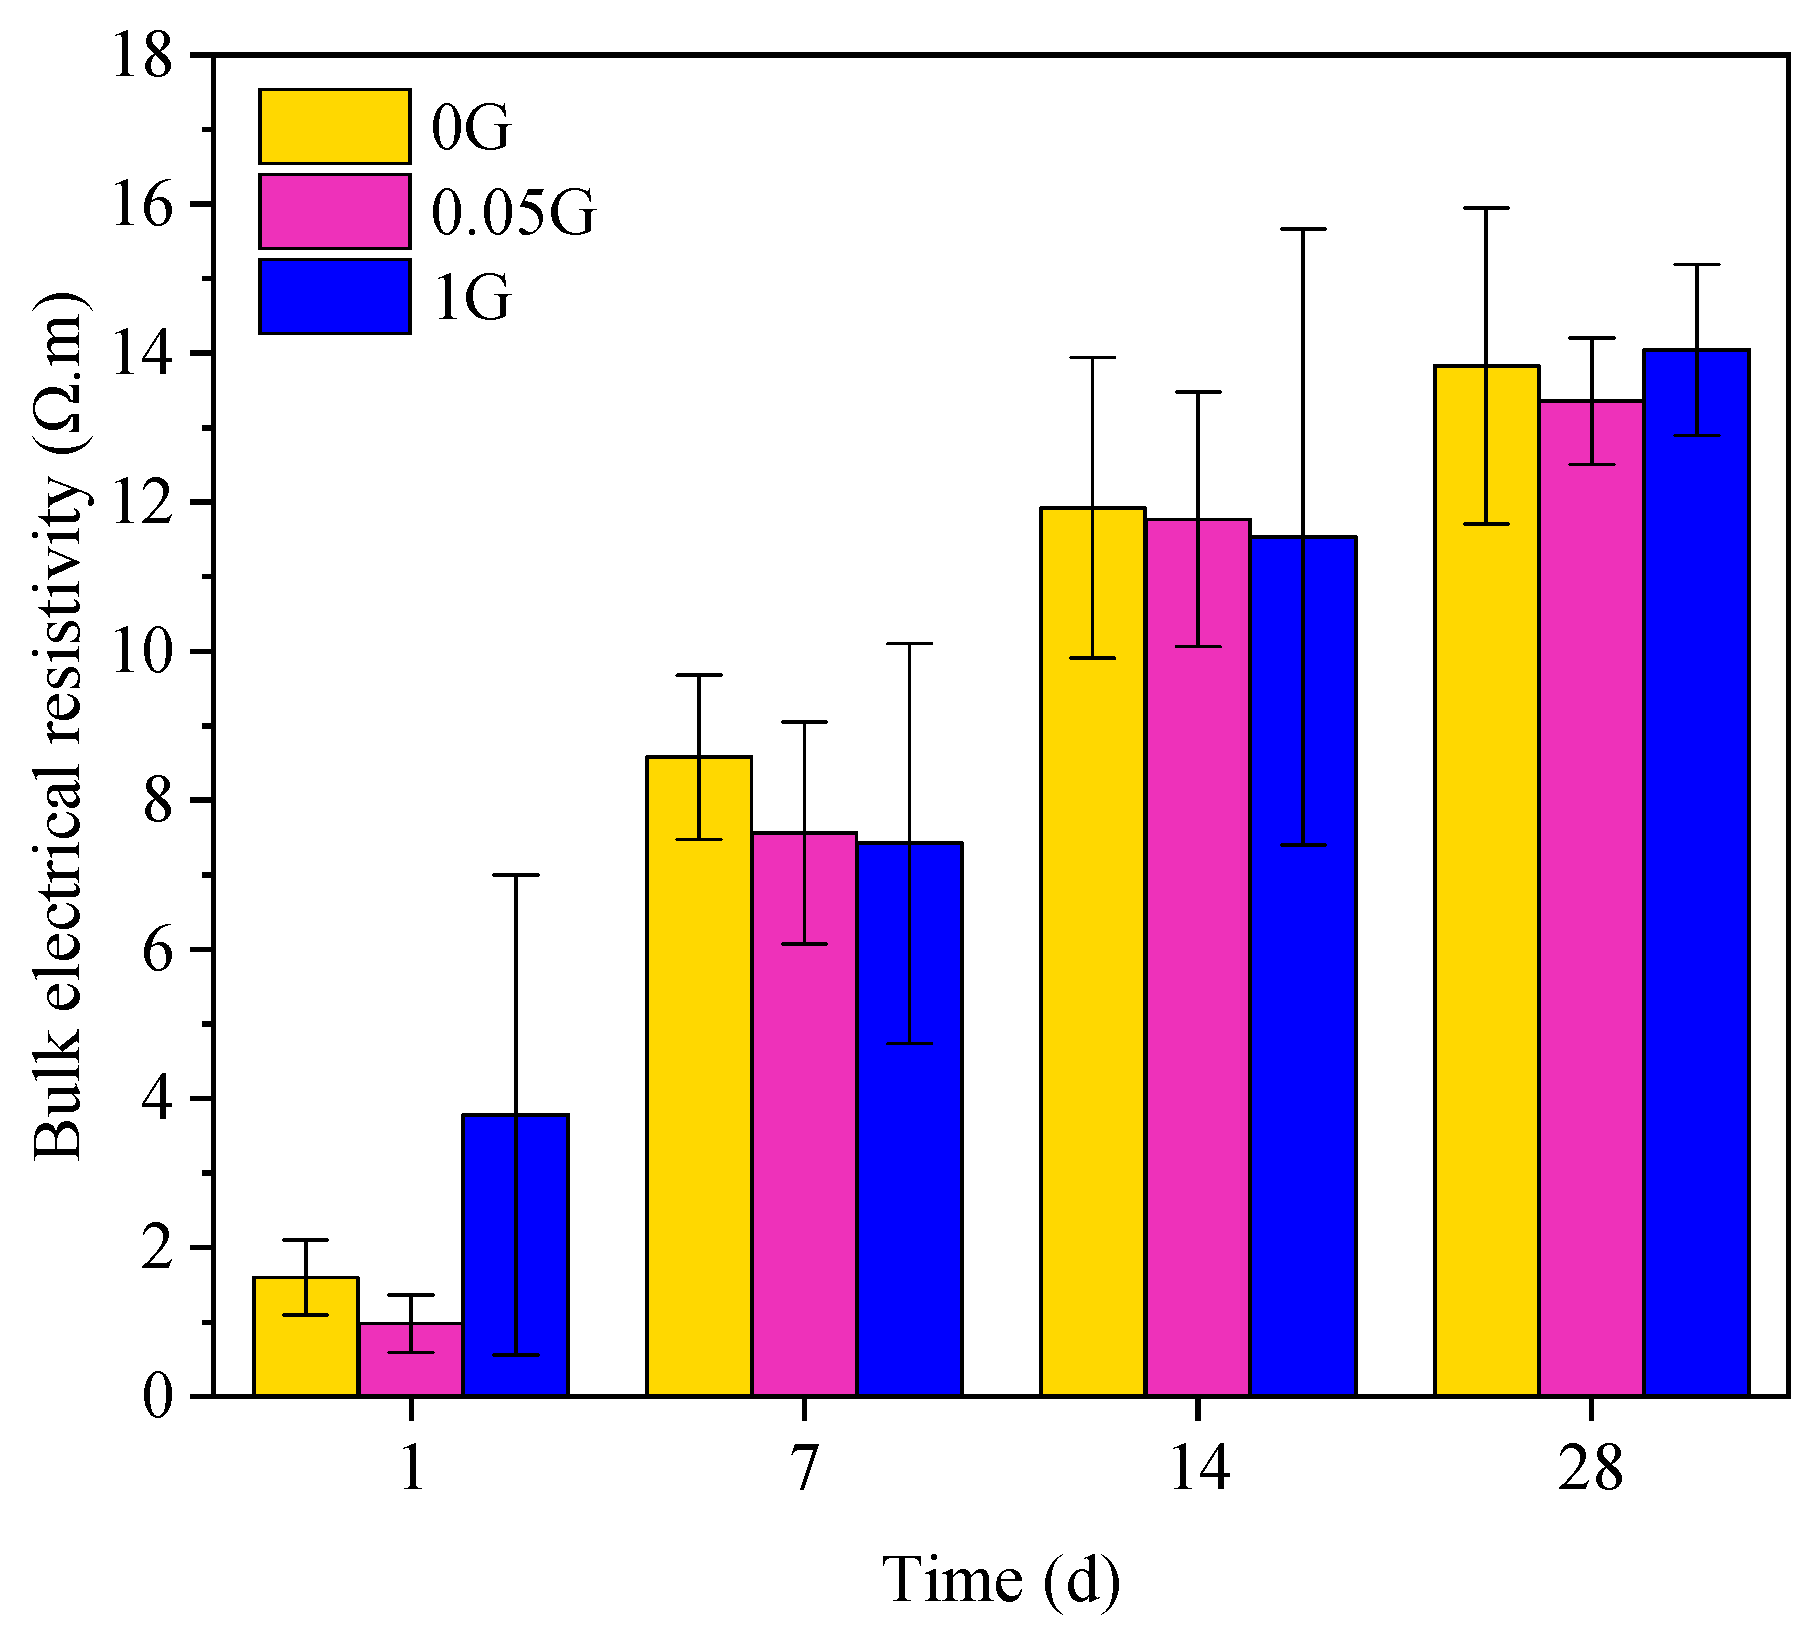
3.4. Effect of GNA on Bulk Electrical Resistivity
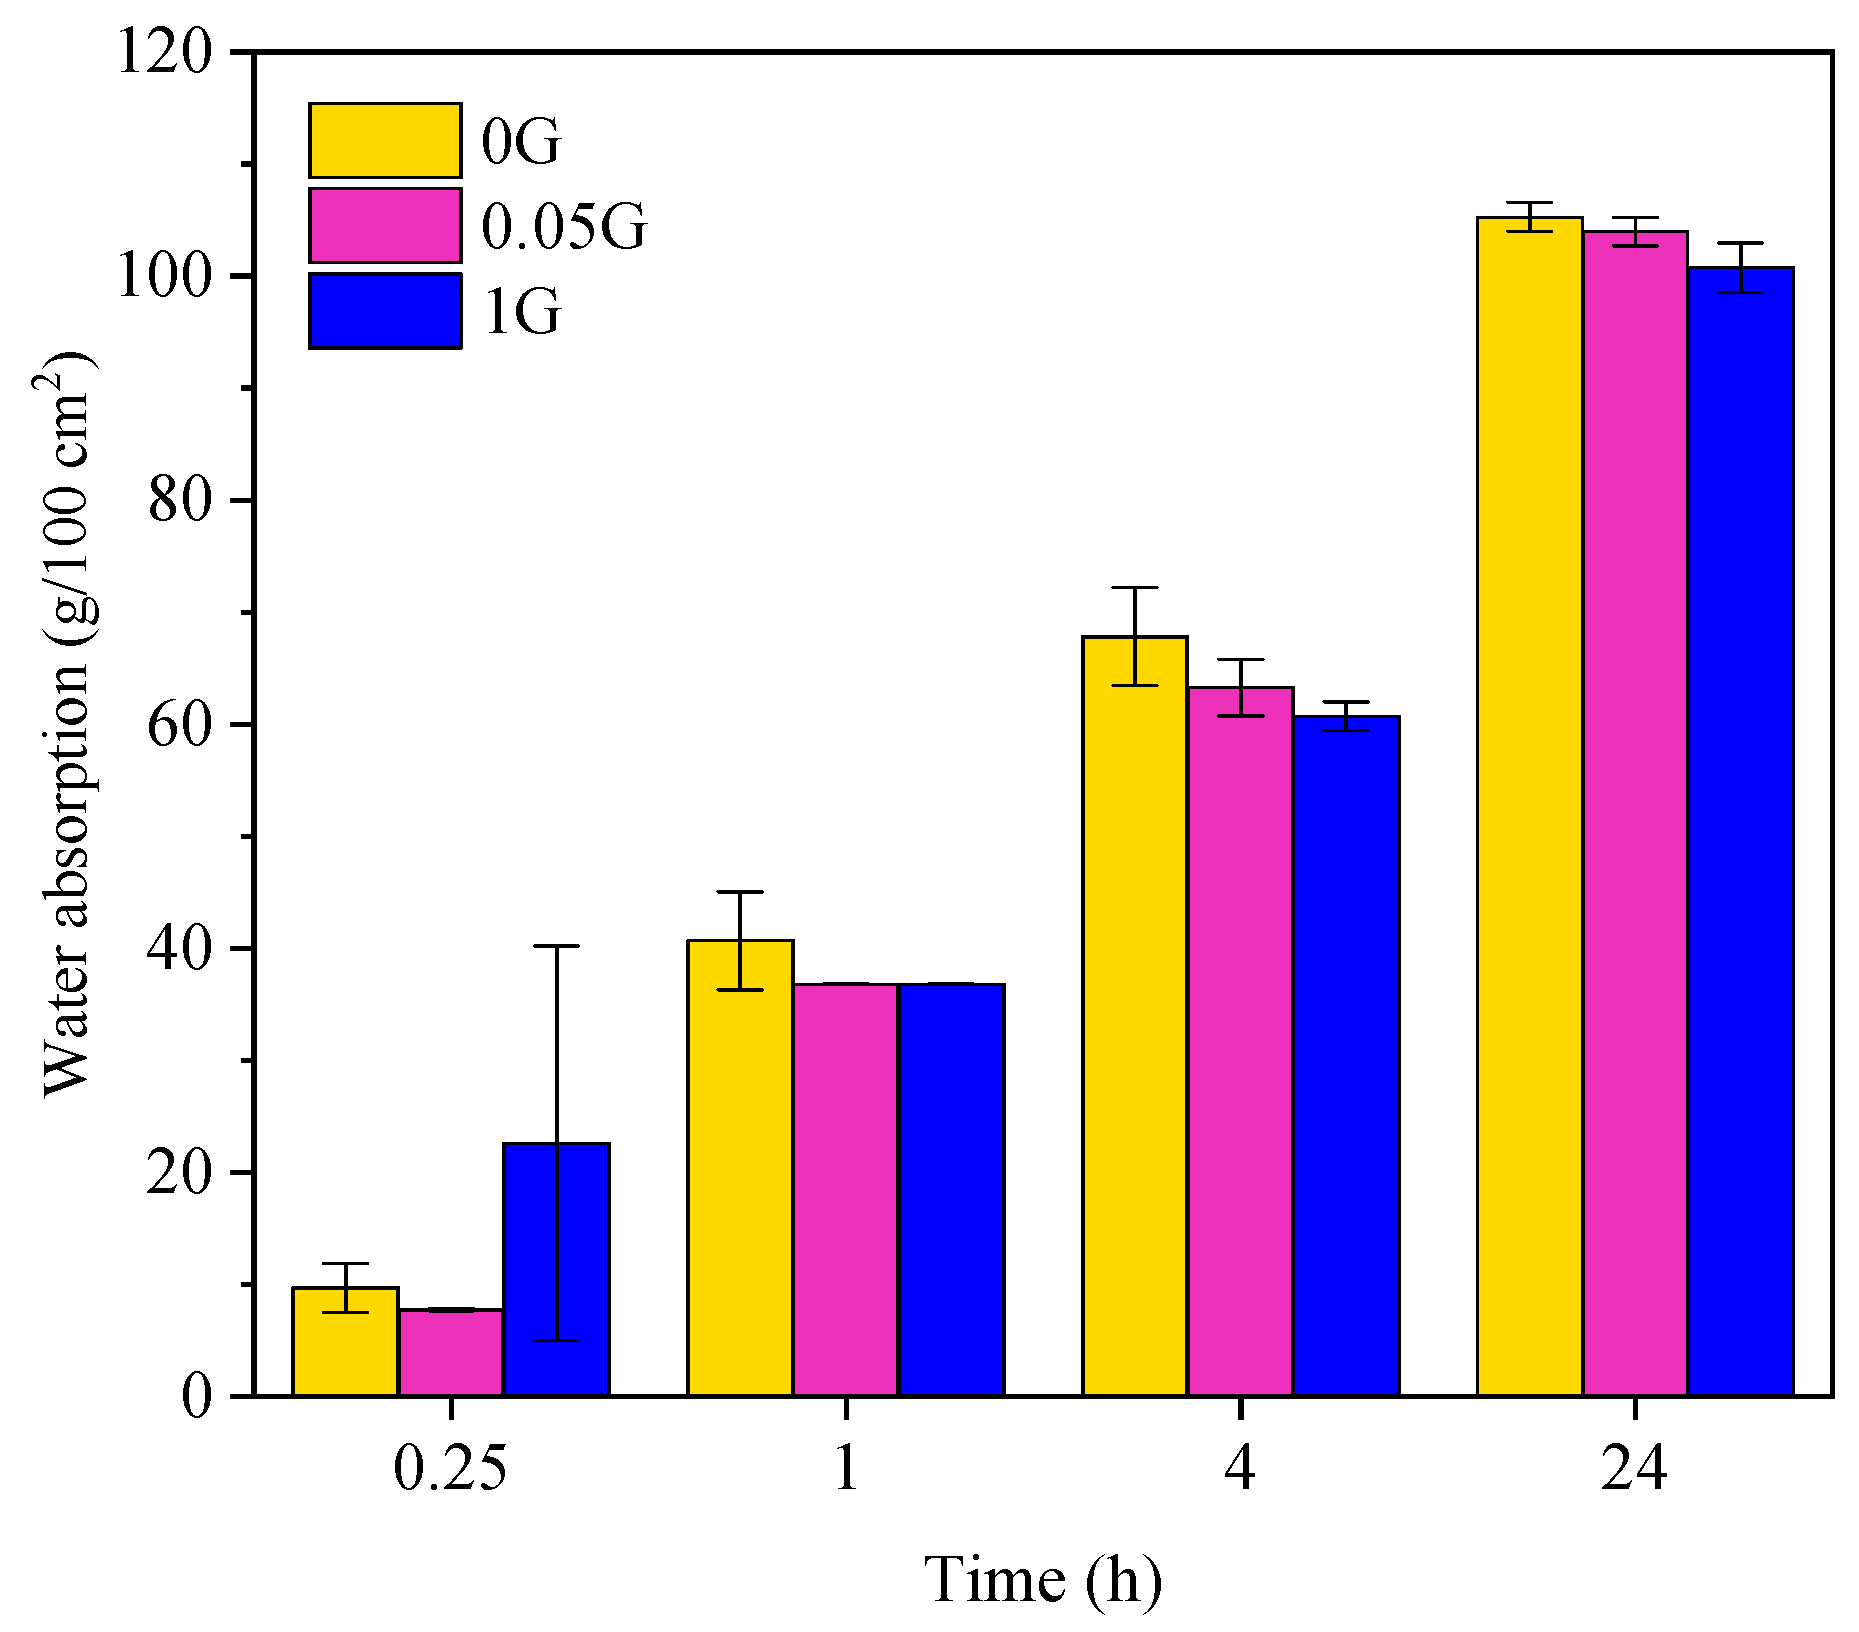
3.5. Effect of GNA on Water Absorption
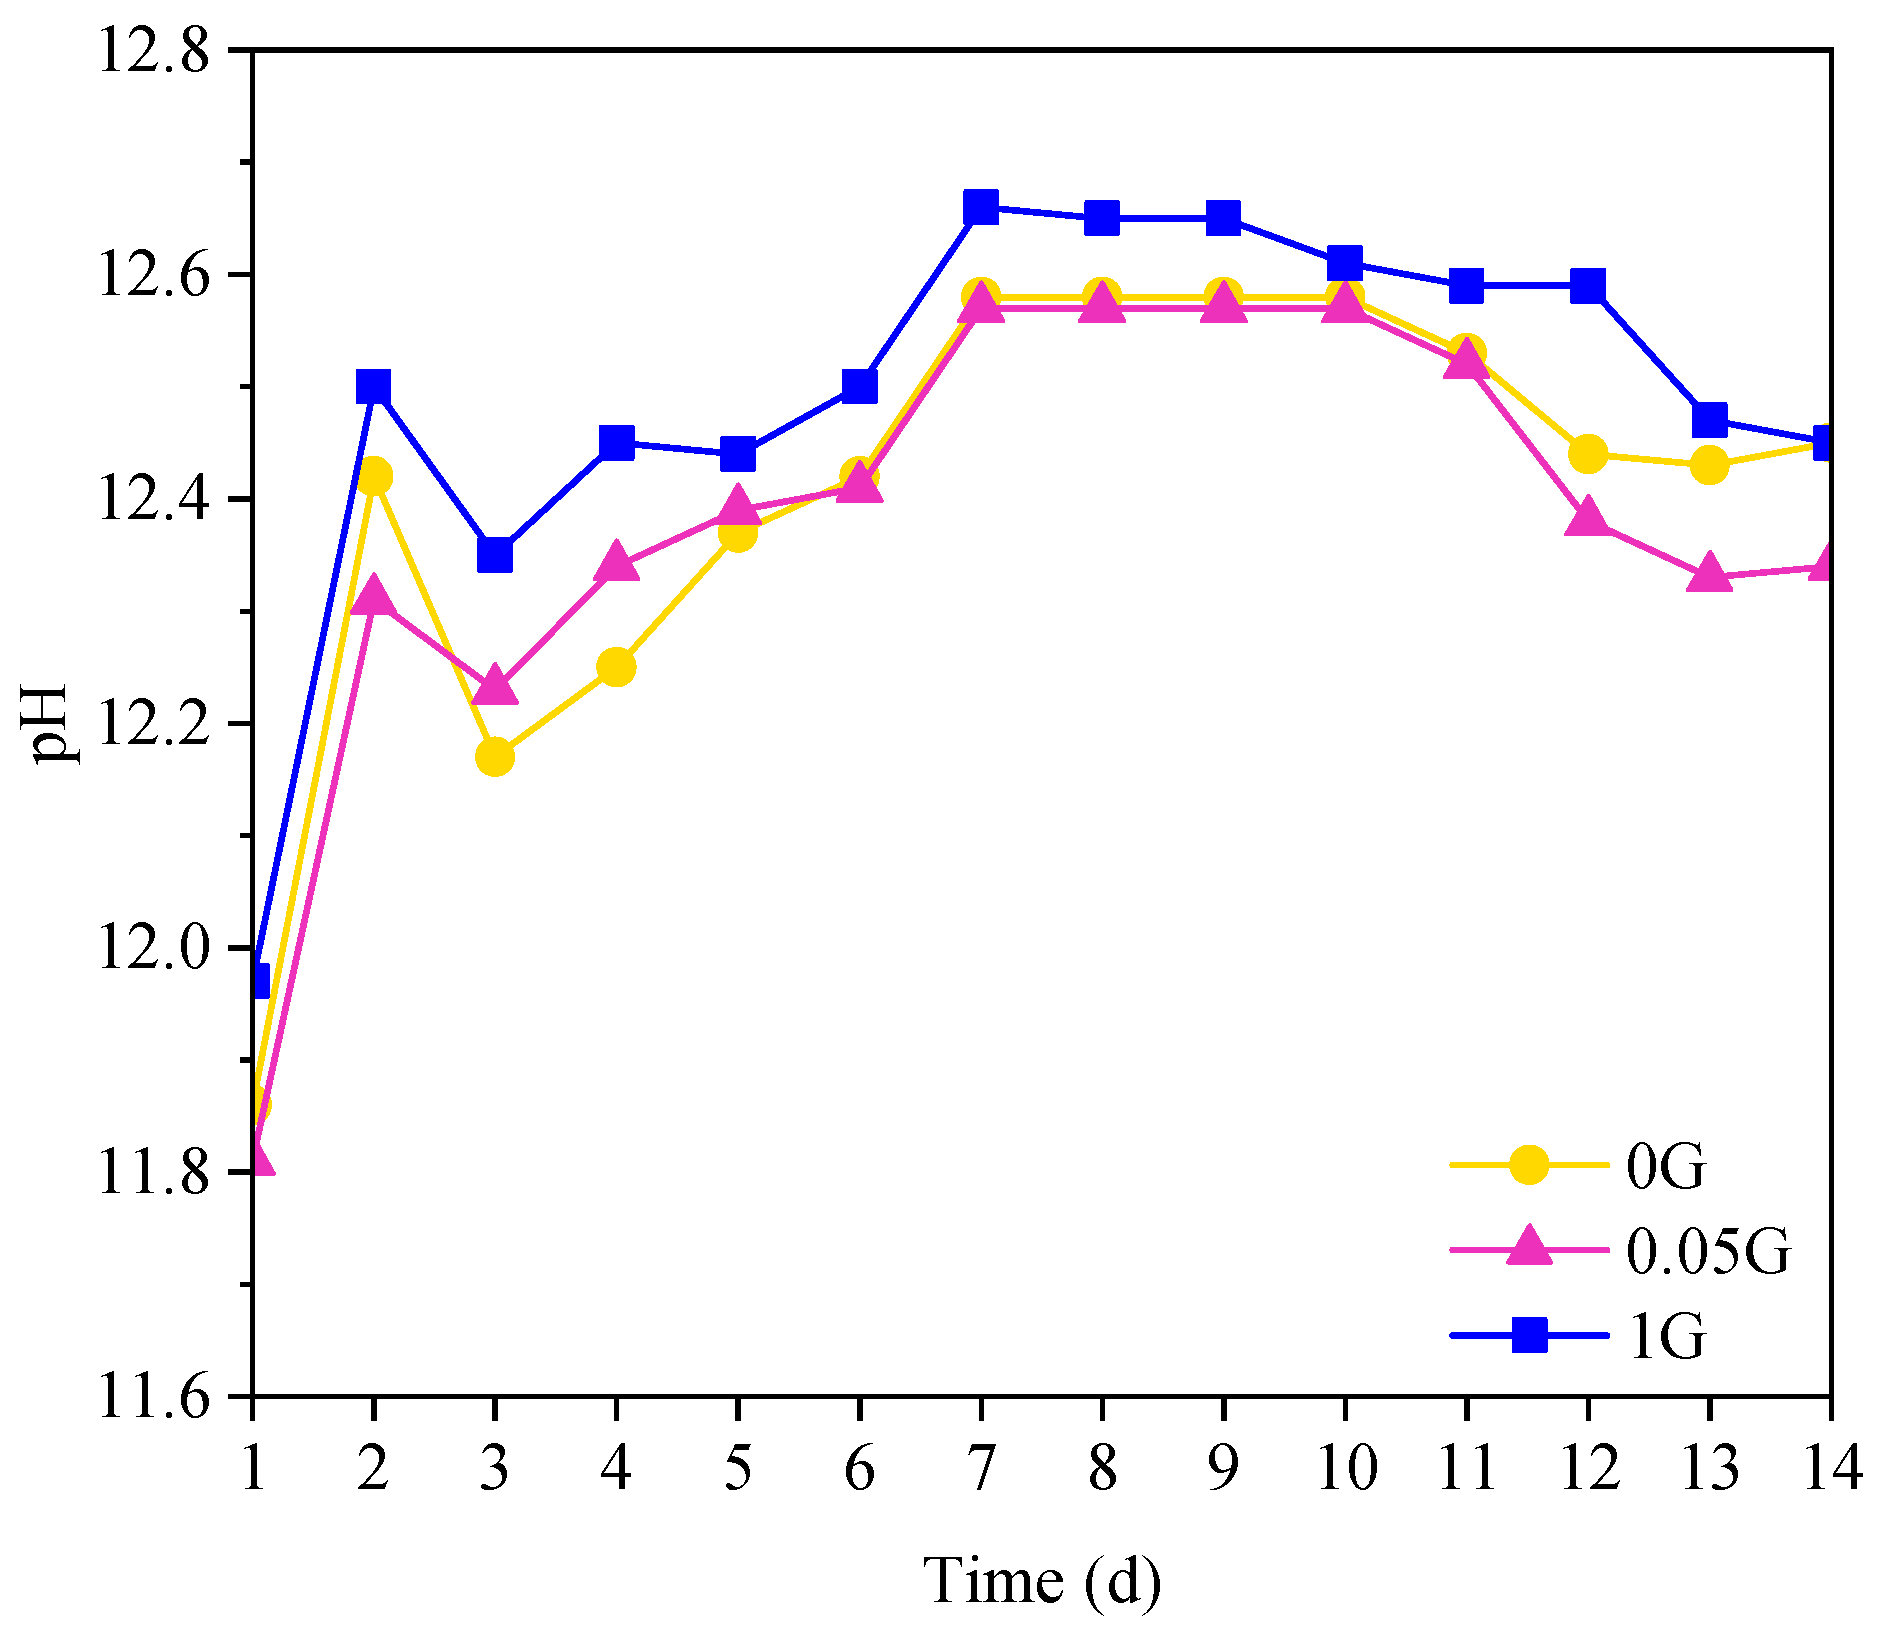
3.6. Effect of GNA on Cement Paste pH
4. Conclusions
- Hydration and Phase Analysis: GNAs had minimal impact on cement hydration and phase formation. While minor variations in heat flow and cumulative heat release were observed, these differences fell within experimental variability and were not statistically significant. XRD and TGA analyses confirmed that GNAs did not introduce new crystalline phases or significantly alter hydration products.
- Mechanical Properties: The incorporation of 0.05% GNAs slightly increased compressive strength compared to the control sample, but the difference was not statistically significant. At higher dosages (1%), compressive strength decreased significantly due to GNA agglomeration, which created weak zones in the matrix.
- Durability: GNAs reduced water absorption and improved pore structure, particularly at lower dosages. However, the differences in water absorption between the control and GNA-blended samples were not statistically significant by the end of the test. Similarly, electrical resistivity measurements showed no statistically significant changes over time, likely due to poor dispersion and the conductive nature of GNAs.
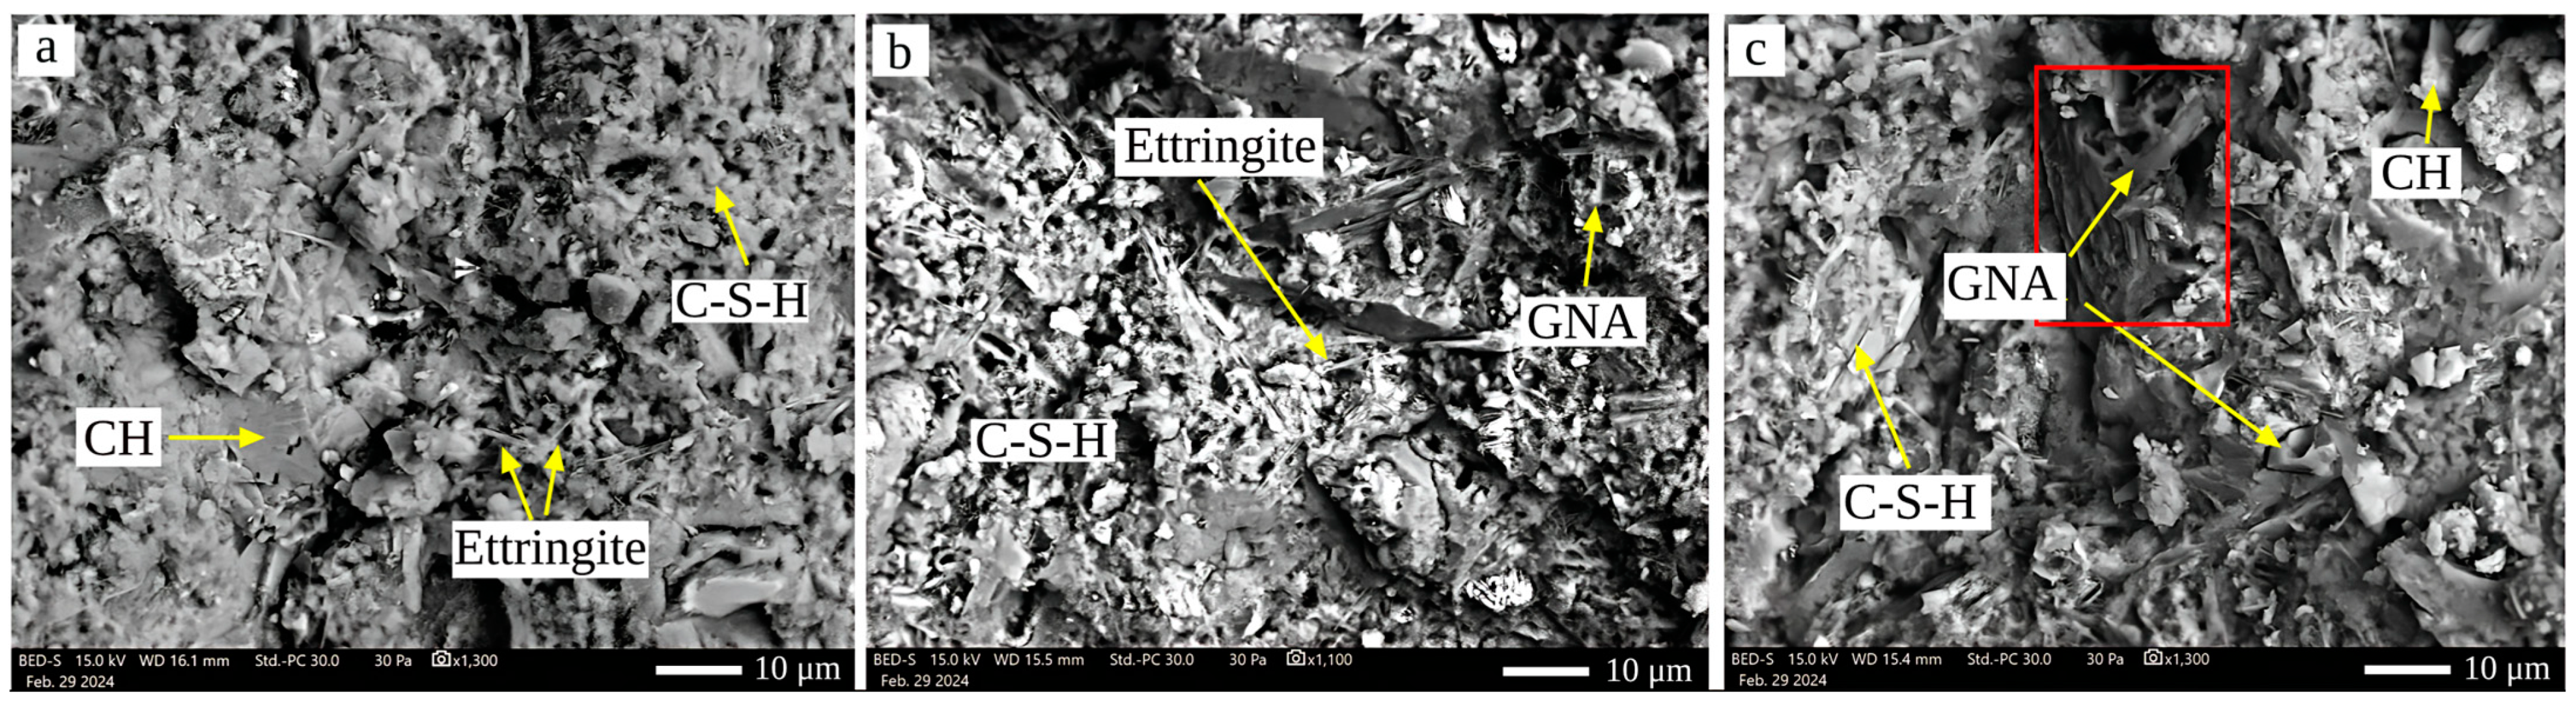
- pH and Microstructure: The inclusion of GNAs had minimal impact on pH, with only slight variations attributed to carbonation and portlandite leaching. SEM images confirmed that well-dispersed GNAs (at 0.05%) contributed to a denser microstructure, while agglomeration at 1% compromised the matrix’s integrity.
Author Contributions
Funding
Institutional Review Board Statement
Informed Consent Statement
Data Availability Statement
Conflicts of Interest
References
- Reches, Y. Nanoparticles as Concrete Additives: Review and Perspectives. Constr. Build. Mater. 2018, 175, 483–495. [Google Scholar] [CrossRef]
- Chen, J.; Kou, S.-C.; Poon, C.-S. Hydration and Properties of Nano-TiO2 Blended Cement Composites. Cem. Concr. Compos. 2012, 34, 642–649. [Google Scholar] [CrossRef]
- Du, H.; Dai Pang, S. Enhancement of Barrier Properties of Cement Mortar with Graphene Nanoplatelet. Cem. Concr. Res. 2015, 76, 10–19. [Google Scholar] [CrossRef]
- Du, H.; Gao, H.J.; Dai Pang, S. Improvement in Concrete Resistance Against Water and Chloride Ingress by Adding Graphene Nanoplatelet. Cem. Concr. Res. 2016, 83, 114–123. [Google Scholar] [CrossRef]
- Ranjbar, N.; Mehrali, M.; Mehrali, M.; Alengaram, U.J.; Jumaat, M.Z. Graphene Nanoplatelet-Fly Ash Based Geopolymer Composites. Cem. Concr. Res. 2015, 76, 222–231. [Google Scholar] [CrossRef]
- Li, J.; Zheng, Q. The First Experimental Evidence for Improved Nanomechanical Properties of Calcium Silicate Hydrate by Polycarboxylate Ether and Graphene Oxide. Cem. Concr. Res. 2022, 156, 106787. [Google Scholar] [CrossRef]
- Shi, T.; Li, Z.; Guo, J.; Gong, H.; Gu, C. Research Progress on CNTs/CNFs-Modified Cement-Based Composites—A Review. Constr. Build. Mater. 2019, 202, 290–307. [Google Scholar] [CrossRef]
- Ying, J.; Zhou, B.; Xiao, J. Pore structure and Chloride Diffusivity of Recycled Aggregate Concrete with Nano-SiO2 and Nano-TiO2. Constr. Build. Mater. 2017, 150, 49–55. [Google Scholar] [CrossRef]
- Fu, Q.; Zhang, Z.; Zhao, X.; Xu, W.; Niu, D. Effect of Nano Calcium Carbonate on Hydration Characteristics and Microstructure of Cement-Based Materials: A Review. J. Build. Eng. 2022, 50, 104220. [Google Scholar] [CrossRef]
- Saafi, M.; Tang, L.; Fung, J.; Rahman, M.; Liggat, J. Enhanced Properties of Graphene/Fly Ash Geopolymeric Composite Cement. Cem. Concr. Res. 2015, 67, 292–299. [Google Scholar] [CrossRef]
- Gong, K.; Pan, Z.; Korayem, A.H.; Qiu, L.; Li, D.; Collins, F.; Wang, C.M.; Duan, W.H. Reinforcing Effects of Graphene Oxide on Portland Cement Paste. J. Mater. Civ. Eng. 2015, 27, A4014010. [Google Scholar] [CrossRef]
- Mohammed, A.; Sanjayan, J.G.; Duan, W.; Nazari, A. Incorporating Graphene Oxide in Cement Composites: A Study of Transport Properties. Constr. Build. Mater. 2015, 84, 341–347. [Google Scholar] [CrossRef]
- Yu, L.; Wu, R. Using Graphene Oxide to Improve the Properties of Ultra-High-Performance Concrete with Fine Recycled Aggregate. Constr. Build. Mater. 2020, 259, 120657. [Google Scholar] [CrossRef]
- Bilisik, K.; Akter, M. Graphene Nanoplatelets/Epoxy Nanocomposites: A Review on Functionalization, Characterization Techniques, Properties, and Applications. J. Reinf. Plast. Compos. 2022, 41, 99–129. [Google Scholar] [CrossRef]
- Alvaredo-Atienza, A.; Fernández-Blázquez, J.P.; Castell, P.; de Villoria, R.G. Production of Graphene Nanoplate/Polyetheretherketone Composites by Semi-Industrial Melt-Compounding. Heliyon 2020, 6, e03740. [Google Scholar] [CrossRef]
- Lee, J.H.; Han, J.H.; Kim, J.H.; Kim, B.; Bello, D.; Kim, J.K.; Lee, G.H.; Sohn, E.K.; Lee, K.; Ahn, K. Exposure Monitoring of Graphene Nanoplatelets Manufacturing Workplaces. Inhal. Toxicol. 2016, 28, 281–291. [Google Scholar] [CrossRef]
- Chen, G.; Yang, M.; Xu, L.; Zhang, Y.; Wang, Y. Graphene Nanoplatelets Impact on Concrete in Improving Freeze-Thaw resistance. Appl. Sci. 2019, 9, 3582. [Google Scholar] [CrossRef]
- Jiang, Z.; Sevim, O.; Ozbulut, O.E. Mechanical Properties of Graphene Nanoplatelets-Reinforced Concrete Prepared with Different Dispersion Techniques. Constr. Build. Mater. 2021, 303, 124472. [Google Scholar] [CrossRef]
- Kilic, U.; Sherif, M.M.; Ozbulut, O.E. Tensile Properties of Graphene Nanoplatelets/Epoxy Composites Fabricated by Various Dispersion Techniques. Polym. Test. 2019, 76, 181–191. [Google Scholar] [CrossRef]
- Shen, M.-Y.; Chang, T.-Y.; Hsieh, T.-H.; Li, Y.-L.; Chiang, C.-L.; Yang, H.; Yip, M.-C. Mechanical Properties and Tensile Fatigue of Graphene Nanoplatelets Reinforced Polymer Nanocomposites. J. Nanomater. 2013, 2013, 565401. [Google Scholar] [CrossRef]
- Lu, D.; Wang, D.; Wang, Y.; Zhong, J. Nano-Engineering the Interfacial Transition Zone Between Recycled Concrete Aggregates and Fresh Paste with Graphene Oxide. Constr. Build. Mater. 2023, 384, 131244. [Google Scholar] [CrossRef]
- Lu, D.; Qu, F.; Punetha, P.; Zeng, X.; Luo, Z.; Li, W. Graphene Oxide Nano-Engineered Recycled Aggregate Concrete for Sustainable Construction: A Critical Review. Dev. Built Environ. 2024, 18, 100444. [Google Scholar] [CrossRef]
- Baomin, W.; Shuang, D. Effect and Mechanism of Graphene Nanoplatelets on Hydration Reaction, Mechanical Properties and Microstructure of Cement Composites. Constr. Build. Mater. 2019, 228, 116720. [Google Scholar] [CrossRef]
- Tong, T.; Fan, Z.; Liu, Q.; Wang, S.; Tan, S.; Yu, Q. Investigation of the Effects of Graphene and Graphene Oxide Nanoplatelets on the Micro-and Macro-Properties of Cementitious Materials. Constr. Build. Mater. 2016, 106, 102–114. [Google Scholar] [CrossRef]
- Bedard, C.; Mailvaganam, N.P. The Use of Chemical Admixtures in Concrete. Part I: Admixture-Cement Compatibility. J. Perform. Constr. Facil. 2005, 19, 263–266. [Google Scholar] [CrossRef]
- Bedard, C.; Mailvaganam, N.P. The Use of Chemical Admixtures in Concrete. Part II: Admixture-Admixture Compatibility and Practical Problems. J. Perform. Constr. Facil. 2006, 20, 2–5. [Google Scholar] [CrossRef]
- Jayasree, C.; Santhanam, M.; Gettu, R. Cement-Superplasticiser Compatibility—Issues and challenges. Indian Concr. J. 2011, 85, 48. [Google Scholar]
- Sagüés, A.; Moreno, E.I.; Andrade, C. Evolution of pH During In-Situ Leaching In Small Concrete Cavities. Cem. Concr. Res. 1997, 27, 1747–1759. [Google Scholar] [CrossRef]
- ASTM C150/150M-24; Standard Specification for Portland Cement. ASTM International: West Conshohocken, PA, USA, 2024.
- Patil, U.V.; Pawbake, A.S.; Machuno, L.G.; Gelamo, R.V.; Jadkar, S.R.; Rout, C.S.; Late, D.J. Effect of Plasma Treatment on Multilayer Graphene: X-Ray Photoelectron Spectroscopy, Surface Morphology Investigations and Work Function Measurements. RSC Adv. 2016, 6, 48843–48850. [Google Scholar] [CrossRef]
- ASTM C778-21; Standard Specification for Standard Sand. ASTM International: West Conshohocken, PA, USA, 2021.
- Ismail, F.I.; Shafiq, N.; Abbas, Y.M.; Bheel, N.; Benjeddou, O.; Ahmad, M.; Sabri, M.M.S. Behavioral Assessment of Graphene Nanoplatelets Reinforced Concrete Beams by Experimental, Statistical, and Analytical Methods. Case Stud. Constr. Mater. 2022, 17, e01676. [Google Scholar] [CrossRef]
- Sevim, O.; Jiang, Z.; Ozbulut, O.E. Effects of Graphene Nanoplatelets Type on Self-Sensing Properties of Cement Mortar Composites. Constr. Build. Mater. 2022, 359, 129488. [Google Scholar] [CrossRef]
- ASTM C305; Standard Practice for Mechanical Mixing of Hydraulic Cement Pastes and Mortars of Plastic Consistency. ASTM International: Philadelphia, PA, USA, 2020.
- Collins, T.J. ImageJ for Microscopy. Biotechniques 2007, 43, S25–S30. [Google Scholar] [CrossRef]
- Kim, T.; Olek, J. Effects of Sample Preparation and Interpretation of Thermogravimetric Curves on Calcium Hydroxide in Hydrated Pastes and Mortars. Transp. Res. Rec. 2012, 2290, 10–18. [Google Scholar] [CrossRef]
- Gražulis, S.; Chateigner, D.; Downs, R.T.; Yokochi, A.; Quirós, M.; Lutterotti, L.; Manakova, E.; Butkus, J.; Moeck, P.; Le Bail, A. Crystallography Open Database—An Open-Access Collection of Crystal Structures. J. Appl. Crystallogr. 2009, 42, 726–729. [Google Scholar] [CrossRef] [PubMed]
- Gražulis, S.; Merkys, A.; Vaitkus, A. Crystallography Open Database (COD). In Handbook of Materials Modeling: Methods: Theory and Modeling; Springer International Publishing: Cham, Switzerland, 2020; pp. 1863–1881. [Google Scholar]
- ASTM C1437-20; Standard Test Method for Flow of Hydraulic Cement Mortar. ASTM International: West Conshohocken, PA, USA, 2020.
- ASTM C109-20; Standard Test Method for Compressive Strength of Hydraulic Cement Mortars (Using 2-in. or [50-mm] Cube Specimens). ASTM International: West Conshohocken, PA, USA, 2020.
- Layssi, H.; Ghods, P.; Alizadeh, A.R.; Salehi, M. Electrical resistivity of concrete. Concr. Int. 2015, 37, 41–46. [Google Scholar]
- Azarsa, P.; Gupta, R. Electrical Resistivity of Concrete for Durability Evaluation: A Review. Adv. Mater. Sci. Eng. 2017, 2017, 8453095. [Google Scholar] [CrossRef]
- Lu, D.; Huo, Y.; Jiang, Z.; Zhong, J. Carbon Nanotube Polymer Nanocomposites Coated Aggregate Enabled Highly Conductive Concrete for Structural Health Monitoring. Carbon 2023, 206, 340–350. [Google Scholar] [CrossRef]
- Robles, K.P.V.; Gucunski, N.; Kee, S.-H. Evaluation of Steel Corrosion-Induced Concrete Damage Using Electrical Resistivity Measurements. Constr. Build. Mater. 2024, 411, 134512. [Google Scholar] [CrossRef]
- ASTM C1876-24; Standard Test Method for Bulk Electrical Resistivity or Bulk Conductivity of Concret. ASTM International: West Conshohocken, PA, USA, 2024.
- Moosa, A.A.; Kubba, F.; Raad, M.; Ramazani, A. Mechanical and Thermal Properties of Graphene Nanoplates and Functionalized Carbon-Nanotubes Hybrid Epoxy Nanocomposites. Am. J. Mater. Sci. 2016, 6, 125–134. [Google Scholar]
- ASTM C1403-22a; Standard Test Method for Rate of Water Absorption of Masonry Mortars. ASTM International: West Conshohocken, PA, USA, 2022.
- Sánchez-Salas, R.; Muñoz-Sandoval, E.; Endo, M.; Morelos-Gómez, A.; López-Urías, F. Nitrogen and Sulfur Incorporation into Graphene Oxide by Mechanical Process. Adv. Eng. Mater. 2021, 23, 2001444. [Google Scholar] [CrossRef]
- Cui, K.; Chang, J.; Sabri, M.M.S.; Huang, J. Study of Dispersion, Hydration, and Microstructure of Graphene Nanoplates-Modified Sulfoaluminate Cement Paste. Nanomaterials 2022, 12, 2708. [Google Scholar] [CrossRef] [PubMed]
- Li, X.; Liu, Y.M.; Li, W.G.; Li, C.Y.; Sanjayan, J.G.; Duan, W.H.; Li, Z. Effects of Graphene Oxide Agglomerates on Workability, Hydration, Microstructure and Compressive Strength of Cement Paste. Constr. Build. Mater. 2017, 145, 402–410. [Google Scholar] [CrossRef]
- Scrivener, K.L.; Juilland, P.; Monteiro, P.J. Advances in Understanding Hydration of Portland Cement. Cem. Concr. Res. 2015, 78, 38–56. [Google Scholar] [CrossRef]
- Gartner, E.; Young, J.; Damidot, D.; Jawed, I. Hydration of Portland Cement. Struct. Perform. Cem. 2002, 2, 57–113. [Google Scholar]
- Wang, B.; Jiang, R.; Wu, Z. Investigation of the Mechanical Properties and Microstructure of Graphene Nanoplatelet-Cement Composite. Nanomaterials 2016, 6, 200. [Google Scholar] [CrossRef]
- Guo, L.; Wu, J.; Wang, H. Mechanical and Perceptual Characterization of Ultra-High-Performance Cement-Based Composites with Silane-Treated Graphene Nano-Platelets. Constr. Build. Mater. 2020, 240, 117926. [Google Scholar] [CrossRef]
- Dong, W.; Li, W.; Guo, Y.; Wang, K.; Sheng, D. Mechanical Properties and Piezoresistive Performances of Intrinsic Graphene Nanoplate/Cement-Based Sensors Subjected to Impact Load. Constr. Build. Mater. 2022, 327, 126978. [Google Scholar] [CrossRef]
- Ismail, F.I.; Shafiq, N.; Abbas, Y.M.; Zahid, M.; Bheel, N.; Benjeddou, O.; Abdulkadir, I. The Behavior of Graphene-Nanoplatelets-Based High-Performance Concrete Under Ambient Curing. In Structures; Elsevier: Amsterdam, The Netherlands, 2023; pp. 694–708. [Google Scholar]
- Wang, B.; Shuang, D. Effect of Graphene Nanoplatelets on the Properties, Pore Structure and Microstructure of Cement Composites. Mater. Express 2018, 8, 407–416. [Google Scholar] [CrossRef]
- Zhang, Y.; Wang, Y.; Yang, M.; Wang, H.; Chen, G.; Zheng, S. Effect of Graphene Nanoplatelet on the Carbonation Depth of Concrete Under Changing Climate Conditions. Appl. Sci. 2021, 11, 9265. [Google Scholar] [CrossRef]
- Hewlett, P.; Liska, M. Lea’s Chemistry of Cement and Concrete; Butterworth-Heinemann: Oxford, UK, 2019. [Google Scholar]
- Ismail, F.I.; Abbas, Y.M.; Shafiq, N.; Fares, G.; Osman, M.; Hussain, L.A.; Khan, M.I. Investigation of the Impact of Graphene Nanoplatelets (GnP) on the Bond Stress of High-Performance Concrete Using Pullout Testing. Materials 2021, 14, 7054. [Google Scholar] [CrossRef]
- Jaramillo, L.J.; Kalfat, R. Fresh and Hardened Performance of Concrete Enhanced with Graphene Nanoplatelets (GNPs). J. Build. Eng. 2023, 75, 106945. [Google Scholar] [CrossRef]
- Sarsam, W.S.; Amiri, A.; Kazi, S.; Badarudin, A. Stability and Thermophysical Properties of Non-Covalently Functionalized Graphene Nanoplatelets Nanofluids. Energy Convers. Manag. 2016, 116, 101–111. [Google Scholar] [CrossRef]
- Lim, K.M.; Lee, J.H. Electrical Conductivity and Compressive Strength of Cement Paste with Multiwalled Carbon Nanotubes and Graphene Nanoplatelets. Appl. Sci. 2022, 12, 1160. [Google Scholar] [CrossRef]

| CaO | SO3 | Fe2O3 | MgO | K2O | Al2O3 | Na2O | SiO2 | LOI |
|---|---|---|---|---|---|---|---|---|
| 59.05 | 2.49 | 2.75 | 1.5 | 0.6 | 3.8 | 0.17 | 19.24 | 9.9 |
| Mixture | Cement | GNAs | Sand | Water | w/c |
|---|---|---|---|---|---|
| ID | (g) | (% wt. of Cement) | (g) | (g) | |
| 0G | 1424 | 0% | 1958 | 598 | 0.42 |
| 0.05G | 1424 | 0.05% | 1958 | 598 | 0.42 |
| 1G | 1424 | 1% | 1958 | 598 | 0.42 |
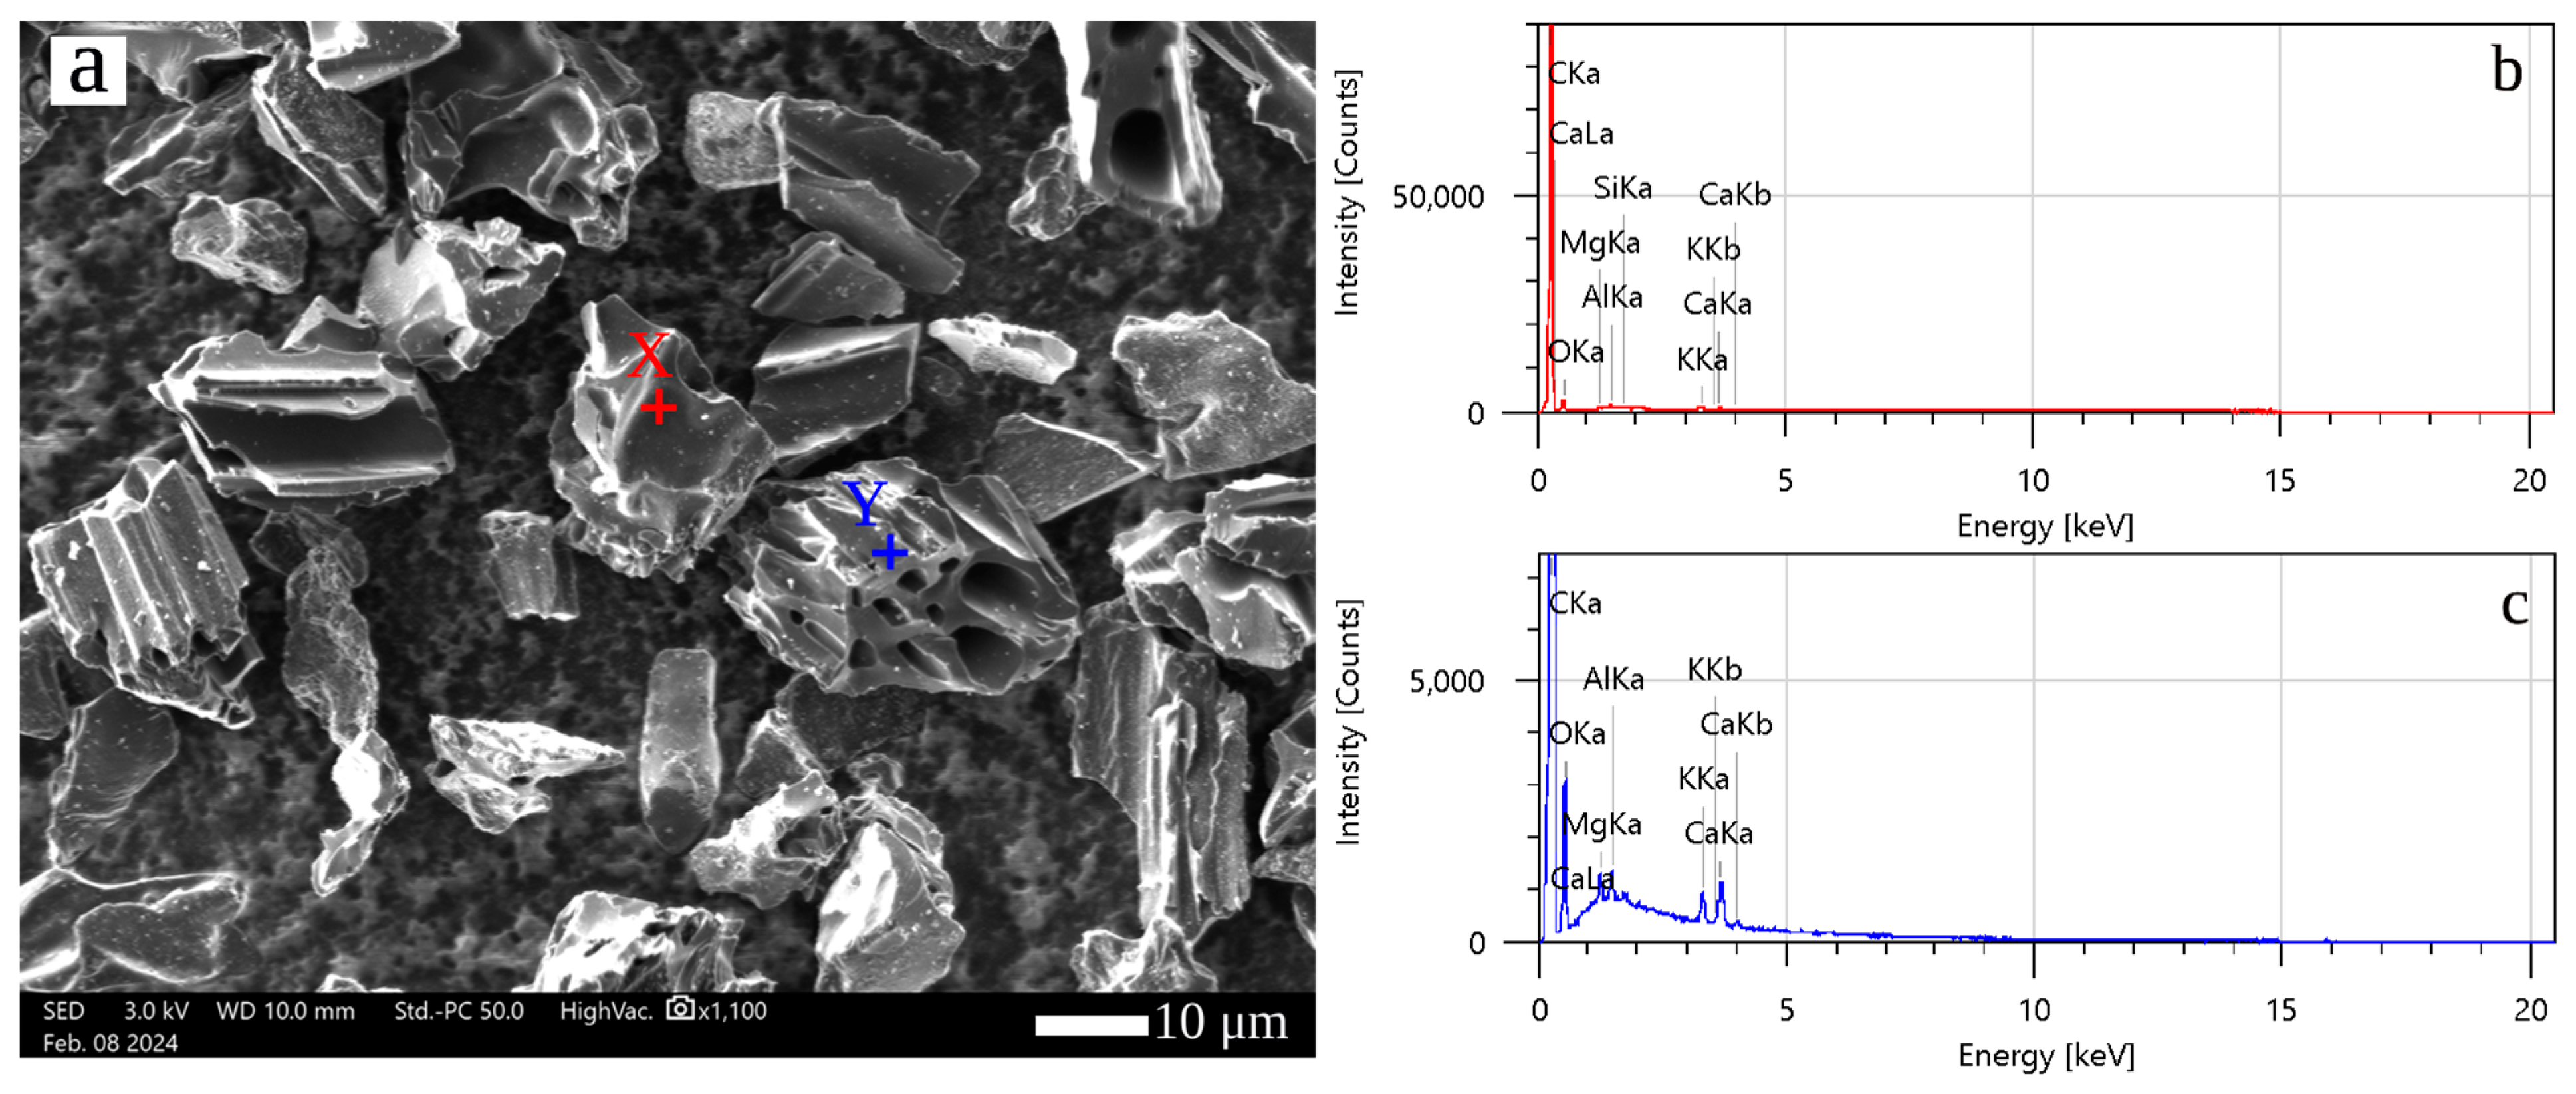
| Zone | C | O | Mg | Al | Si | K | Ca |
|---|---|---|---|---|---|---|---|
| X | 89.96 | 9.34 | 0.07 | 0.27 | 0.06 | 0.82 | 0.48 |
| Y | 90.78 | 7.60 | 0.19 | 0.18 | 0 | 0.49 | 0.76 |
| Mixture | Average Diameter (mm) | Flow (%) |
|---|---|---|
| 0G | 226 | 122 |
| 0.05G | 219 | 115 |
| 1G | 216 | 112 |
Disclaimer/Publisher’s Note: The statements, opinions and data contained in all publications are solely those of the individual author(s) and contributor(s) and not of MDPI and/or the editor(s). MDPI and/or the editor(s) disclaim responsibility for any injury to people or property resulting from any ideas, methods, instructions or products referred to in the content. |
© 2025 by the authors. Licensee MDPI, Basel, Switzerland. This article is an open access article distributed under the terms and conditions of the Creative Commons Attribution (CC BY) license (https://creativecommons.org/licenses/by/4.0/).
Share and Cite
Ahmed, A.A.; Shakouri, M.; Abraham, O.F. Assessing the Impact of Graphene Nanoplatelets Aggregates on the Performance Characteristics of Cement-Based Materials. Sustainability 2025, 17, 2349. https://doi.org/10.3390/su17062349
Ahmed AA, Shakouri M, Abraham OF. Assessing the Impact of Graphene Nanoplatelets Aggregates on the Performance Characteristics of Cement-Based Materials. Sustainability. 2025; 17(6):2349. https://doi.org/10.3390/su17062349
Chicago/Turabian StyleAhmed, Ahmed A., Mahmoud Shakouri, and Ojo Friday Abraham. 2025. "Assessing the Impact of Graphene Nanoplatelets Aggregates on the Performance Characteristics of Cement-Based Materials" Sustainability 17, no. 6: 2349. https://doi.org/10.3390/su17062349
APA StyleAhmed, A. A., Shakouri, M., & Abraham, O. F. (2025). Assessing the Impact of Graphene Nanoplatelets Aggregates on the Performance Characteristics of Cement-Based Materials. Sustainability, 17(6), 2349. https://doi.org/10.3390/su17062349