Abstract
Resilient water distribution system is crucial for sustainable urban water management. Evaluating the inherent resilience of the buried water infrastructure is key to ensuring reliable water distribution. The water distribution network maintains water quality and supplies sufficient water to users. Evaluating the system’s resilience under varying failure conditions is crucial to guarantee continued service delivery. This study investigates the resilience of the water distribution network for the University City, Sharjah, United Arab Emirates subjected to failure conditions caused by pipe failure, water contamination, and water excess demand. This research quantifies the corresponding performance under these stressors and develops an innovative resilience index by using the global resilience analysis (GRA) approach. The corresponding strain is in the form of node failure, chlorine decay, and pressure failures among all the pipes throughout the network. A survey was conducted with the water company to identify recovery time for the designated water distribution network. Another survey was conducted among the experts to evaluate the relative significance of all the strains in contribution towards resilience. Based on the resilience index, four levels (high, moderate, low, and very low) of resilience were defined. The study revealed Sharjah water distribution network has up to 40% of its stress categorized as low resilience and 60% of its stress categorized as very low resilience. The study also presented a management plan for the improvement of the designated water distribution network.
1. Introduction
Water is a crucial resource for life on Earth, and global challenges such as depletion, population growth, urbanization, and climate change require efficient and conservative management [1]. The United Arab Emirates may face a water shortage due to population growth, urbanization, and climate change, with limited water sources. The UAE’s climate is characterized by extremely high temperatures, humidity, and irregular rainfall. The Middle East is projected to have half less water available to each person by 2050 [2]. This necessitates efficient water management.
To provide dependable services, resilient infrastructures must be developed in smart cities. Restoring the resilience of current infrastructure or creating, constructing, and managing resilient water infrastructure are two ways to accomplish this newfound attention. Unexpected catastrophic occurrences, like earthquakes, can affect the water infrastructure system and cause pipe breaks, impacting the public’s health and safety [3].
A water distribution system is considered one of the critical infrastructures that are liable for providing sufficient and safe water to the users [4,5]. It is the most vulnerable part of the water supply system [6], involving hundreds of pipelines [7], reservoirs, tanks, pumps, and valves [8]. Buried pipelines are impacted by dead load and live load, and climate change can also impact buried pipelines [9,10]. Understanding the resilience of the water distribution system (WDS) is crucial for ensuring sufficient water with good quality for users. Researchers have indicated the importance of water quality monitoring to ensure safe water supply through the use of advanced modeling [11,12].
Researchers identified two types of resilience measure approaches: qualitative and quantitative assessments [13,14]. In the first group, resilience was viewed as an approach to measure the properties of the network, such as the reliability [1,15,16], and robustness [17] of the system, while in the second group, resilience was viewed as a method to measure other properties, such as the adaptability [17,18], absorbability, and recovery capacity [6] of the system [6].
Figure 1 illustrates qualitative assessment consists of a conceptual framework, while quantitative assessment consists of a structural-based model and general methods. To start with, the conceptual framework is defined as a theoretical approach to measuring resilience [13].
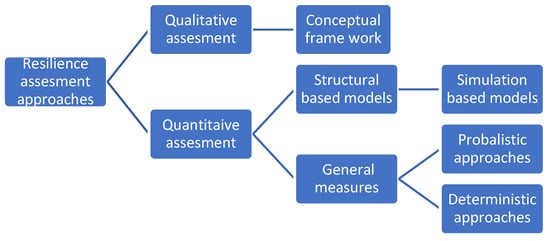
Figure 1.
The flow chart clarifies resilience assessment approaches.
Quantitative assessment is the second type of resilience measurement approach, focusing on general methods and structural-based models. The general method consists of probabilistic [13] and deterministic approaches [19,20], with probabilistic methods measuring reliability and deterministic methods assessing robustness. This study focuses on investigating the resilience of a water distribution network (WDN) during seismic failure.
Resilient critical infrastructure is also an important step in the direction of sustainable growth [21,22]. Murray [23] asserts that resilient infrastructure, which is less susceptible to disruption and can endure shocks, is essential for sustainable development and directly benefits the environment, society, and economy. Additionally, by lowering the number of infrastructure rebuilds, resilient infrastructure helps to safeguard the environment and save money for governments by limiting the consumption of natural resources and significant shocks and disruptions to the industry. Furthermore, resilient infrastructure contributes to the satisfaction of society by upholding the services that are offered to users. To enhance the resilience of any infrastructure, it is essential to assess the inherent system [24] through the simulation of failure scenarios to a hydraulic model [25]. This involves identifying the system’s vulnerability, points of failure, supply shortage magnitude, and potential challenges that may arise under extreme failure conditions. The development of a resiliency index for the WDS serves as a decision-support tool for utility managers, ensuring service life and ensuring effective and efficient operation of the system.
To date, there are two approaches used to measure system resilience based on data availability. Global resilience analysis (GRA) [26] and graph theory [27] methods are well-known techniques for measuring resilience, and they assist in understanding the possible effects of system failure. Graph theory focuses on the topological features of WDS, like how robust, redundant, and connected they are. The GRA method provides information on the system’s response, such as supply failure magnitude and duration, while the graph theory method provides information on the degree of interconnectedness and detects the system’s critical elements.
Previous studies utilized GRA to assess the WDS’s performance in hydraulic analysis, including supply failure, and to pinpoint system vulnerabilities and critical nodes [24,28]. The approach is based on applying failure modes to a hydraulic model and investigating the system’s performance. Additionally, researchers have used GRA as a method to identify the vulnerability of networked infrastructure [29,30]. Another study used GRA to evaluate the system’s resiliency using an integrated approach of hydraulic and centrality analyses [22]. The researchers applied a failure mode, which was a water shortage scenario. In each case, the stress was on the percentage of additional water shortage. Using centrality analysis, the researchers found the network’s most vulnerable critical nodes [22].
There have been several previous research studies on the use of GRA on WDN [18,21,24]. However, there is a lack of unified resilience scores in those studies. Researchers have employed GRA as a method to assess the structural resilience of the drainage distribution network under scenarios of cumulative pipe failure [29,31]. Urban drainage systems use the GRA technique to assess their structural resilience against structural failures like pipe failure, quantifying the system’s performance loss (strain) under such failures. Previous studies considered pipe failure as a common scenario to evaluate the resilience of the system [24,26,29]. Generally, researchers subjected a hydraulic simulation to a pipe failure scenario with varying stresses, computing the corresponding strain, or the performance loss or service level of the system, for each scenario. For instance, in the pipe failure scenario with varying stress, the system experiences 0–100% of the number of pipe failures, and the corresponding strain represents the performance loss, including the magnitude and duration of the supply. In addition, this approach assisted in assessing the system’s structural connectivity. Researchers imposed a functional failure scenario on random junctions, evaluating the corresponding strain by calculating the average number of nodes experiencing a pressure deficit across all system junctions [24].
Generally, the most challenging factors that impact the resilience of the infrastructure are natural events and man-made attacks. Natural events (e.g., earthquakes or climate change) can interrupt the service of any water infrastructure. The researchers have divided the hazards that could affect the WDN into two types, which are natural disasters such as earthquakes and abnormal conditions [6]. Abnormal conditions consist of structural failure and functional failure. This occurs during the operational phase, specifically when key components of the system such as the pipe, pump, node, and substance intrusion fail. Urbanization leads to an increase in consumer demands, which ultimately can cause operational failure. Both structural and functional failures pose a significant risk to the system, with structural failures being attributed to pipe failures and functional failures to excess water demand [24]. Previous studies extensively considered and simulated the earthquake’s impacts as a natural disaster that could severely affect the infrastructure. Therefore, pipe failure was considered the main failure mode for many of the previous studies [24,26,29]. Water contamination, a consequence of an earthquake disaster, exposes the system to another failure scenario. Additionally, water loss due to pipe breaks or increased demand leads to a failure scenario such as excess water demand. The UAE’s geographical location is close to the Arabian Gulf, an area known for its high seismic activity in Iran [3,32]. Additionally, due to the UAE’s geographical location, the frequency of earthquakes has increased in the last decade [3]. From 1984 to 2012, Sharjah city recorded the second-highest number of earthquakes in the UAE, with 24 occurrences, according to a study investigating the spatial distribution of earthquakes in the UAE [33]. Furthermore, Al-dogom [34] categorizes Sharjah as a high-hazard zone because of its proximity to seismic hotspots. Most of the previous studies [5,24,26,29] considered the earthquake as a potential hazard to their systems. Another study examined the effects of earthquakes in the UAE, concluding that high seismic activity in the northern emirates, including Sharjah, can lead to long-term structural damage [32]. To date, most previous studies have focused on investigating the earthquake’s impact on the WDN by applying hypothetical failure scenarios to the system. The studies, however, failed to quantify overall resilience of WDN. However, none of the previous studies considered climate change as a hazard to the WDN. In the following decades, climate change could be problematic for the WDN. Climate change can have a long-term impact on the WDN. For example, water shortages due to rainfall reduction impact the water supply system, and since the WDN is a crucial component of the water supply system, climate change will influence the quantity and quality of water supplied to the WDN. According to Salam, climate change poses serious challenges and threats to human health and nature in the 21st century [35]. Previous studies have established a link between climate change fluctuations and diseases, where an increase in temperature leads to an increase in disease rates [35,36]. According to Duran [37], there are two key consequences of climate change: water availability and water quality. Climate change poses hazards to water and sanitation services, according to a study that identified all possible risks to the water infrastructure associated with climate change [36,38]. For example, the debilitation of water sources due to decreasing rainfall frequency results in an increase in demand, and flooding can cause damage to water infrastructure and impact the quality of drinking water [36]. Storm events that can impact the water and damage the power supplies are another threat [36,38]. Another threat is an increased concentration of contaminants due to a decrease in river flows [36,37,38,39]. Extreme temperature changes significantly impact people’s lives, leading to increased evaporation losses and challenges to the water supply [35]. Thus, climate change is also considered a potential risk to the water infrastructure. The UAE experiences a dry weather pattern with year-round sunny days and rare rainfall [35]. This weather pattern is characterized by hot and moist extreme temperatures and humidity in the summer, cool winters, and irregular rainfall for short periods annually, resulting in low rainfall rates. All in all, natural events such as earthquakes and climate change are all potential risks to the WDN.
Hence, the objectives of this study are to improve the resilience of the WDN and develop a management plan that ensures the system will maintain the continuity of its critical services. By measuring the infrastructure’s resilience effectively and developing a management plan based on the resiliency index, the infrastructure’s continued provision of services can be ensured. To accomplish the research objectives, University City, Sharjah, United Arab Emirates WDN was chosen. The WDN was first subjected to a simulation of various failure scenarios in the hydraulic model, followed by an evaluation of the system’s resilience. An innovative GRA-based resilience model was developed with the help of two sets of expert surveys.
2. Methodology
The first step to achieving the objectives is to evaluate the system and address its vulnerability. The study primarily focuses on assessing the network’s performance under extreme conditions, its response to failure modes, and its ability to withstand natural disaster scenarios. The study used the GRA method to evaluate hydraulic analytical performance. Previous studies that used GRA as an approach did not develop a resiliency index for the water infrastructure system or a management plan to improve it [8,13,19]. A previous work [20] illustrated the conceptual basis of developing the index. This study focused on developing this resilience index for a real WDN.
2.1. Study Area
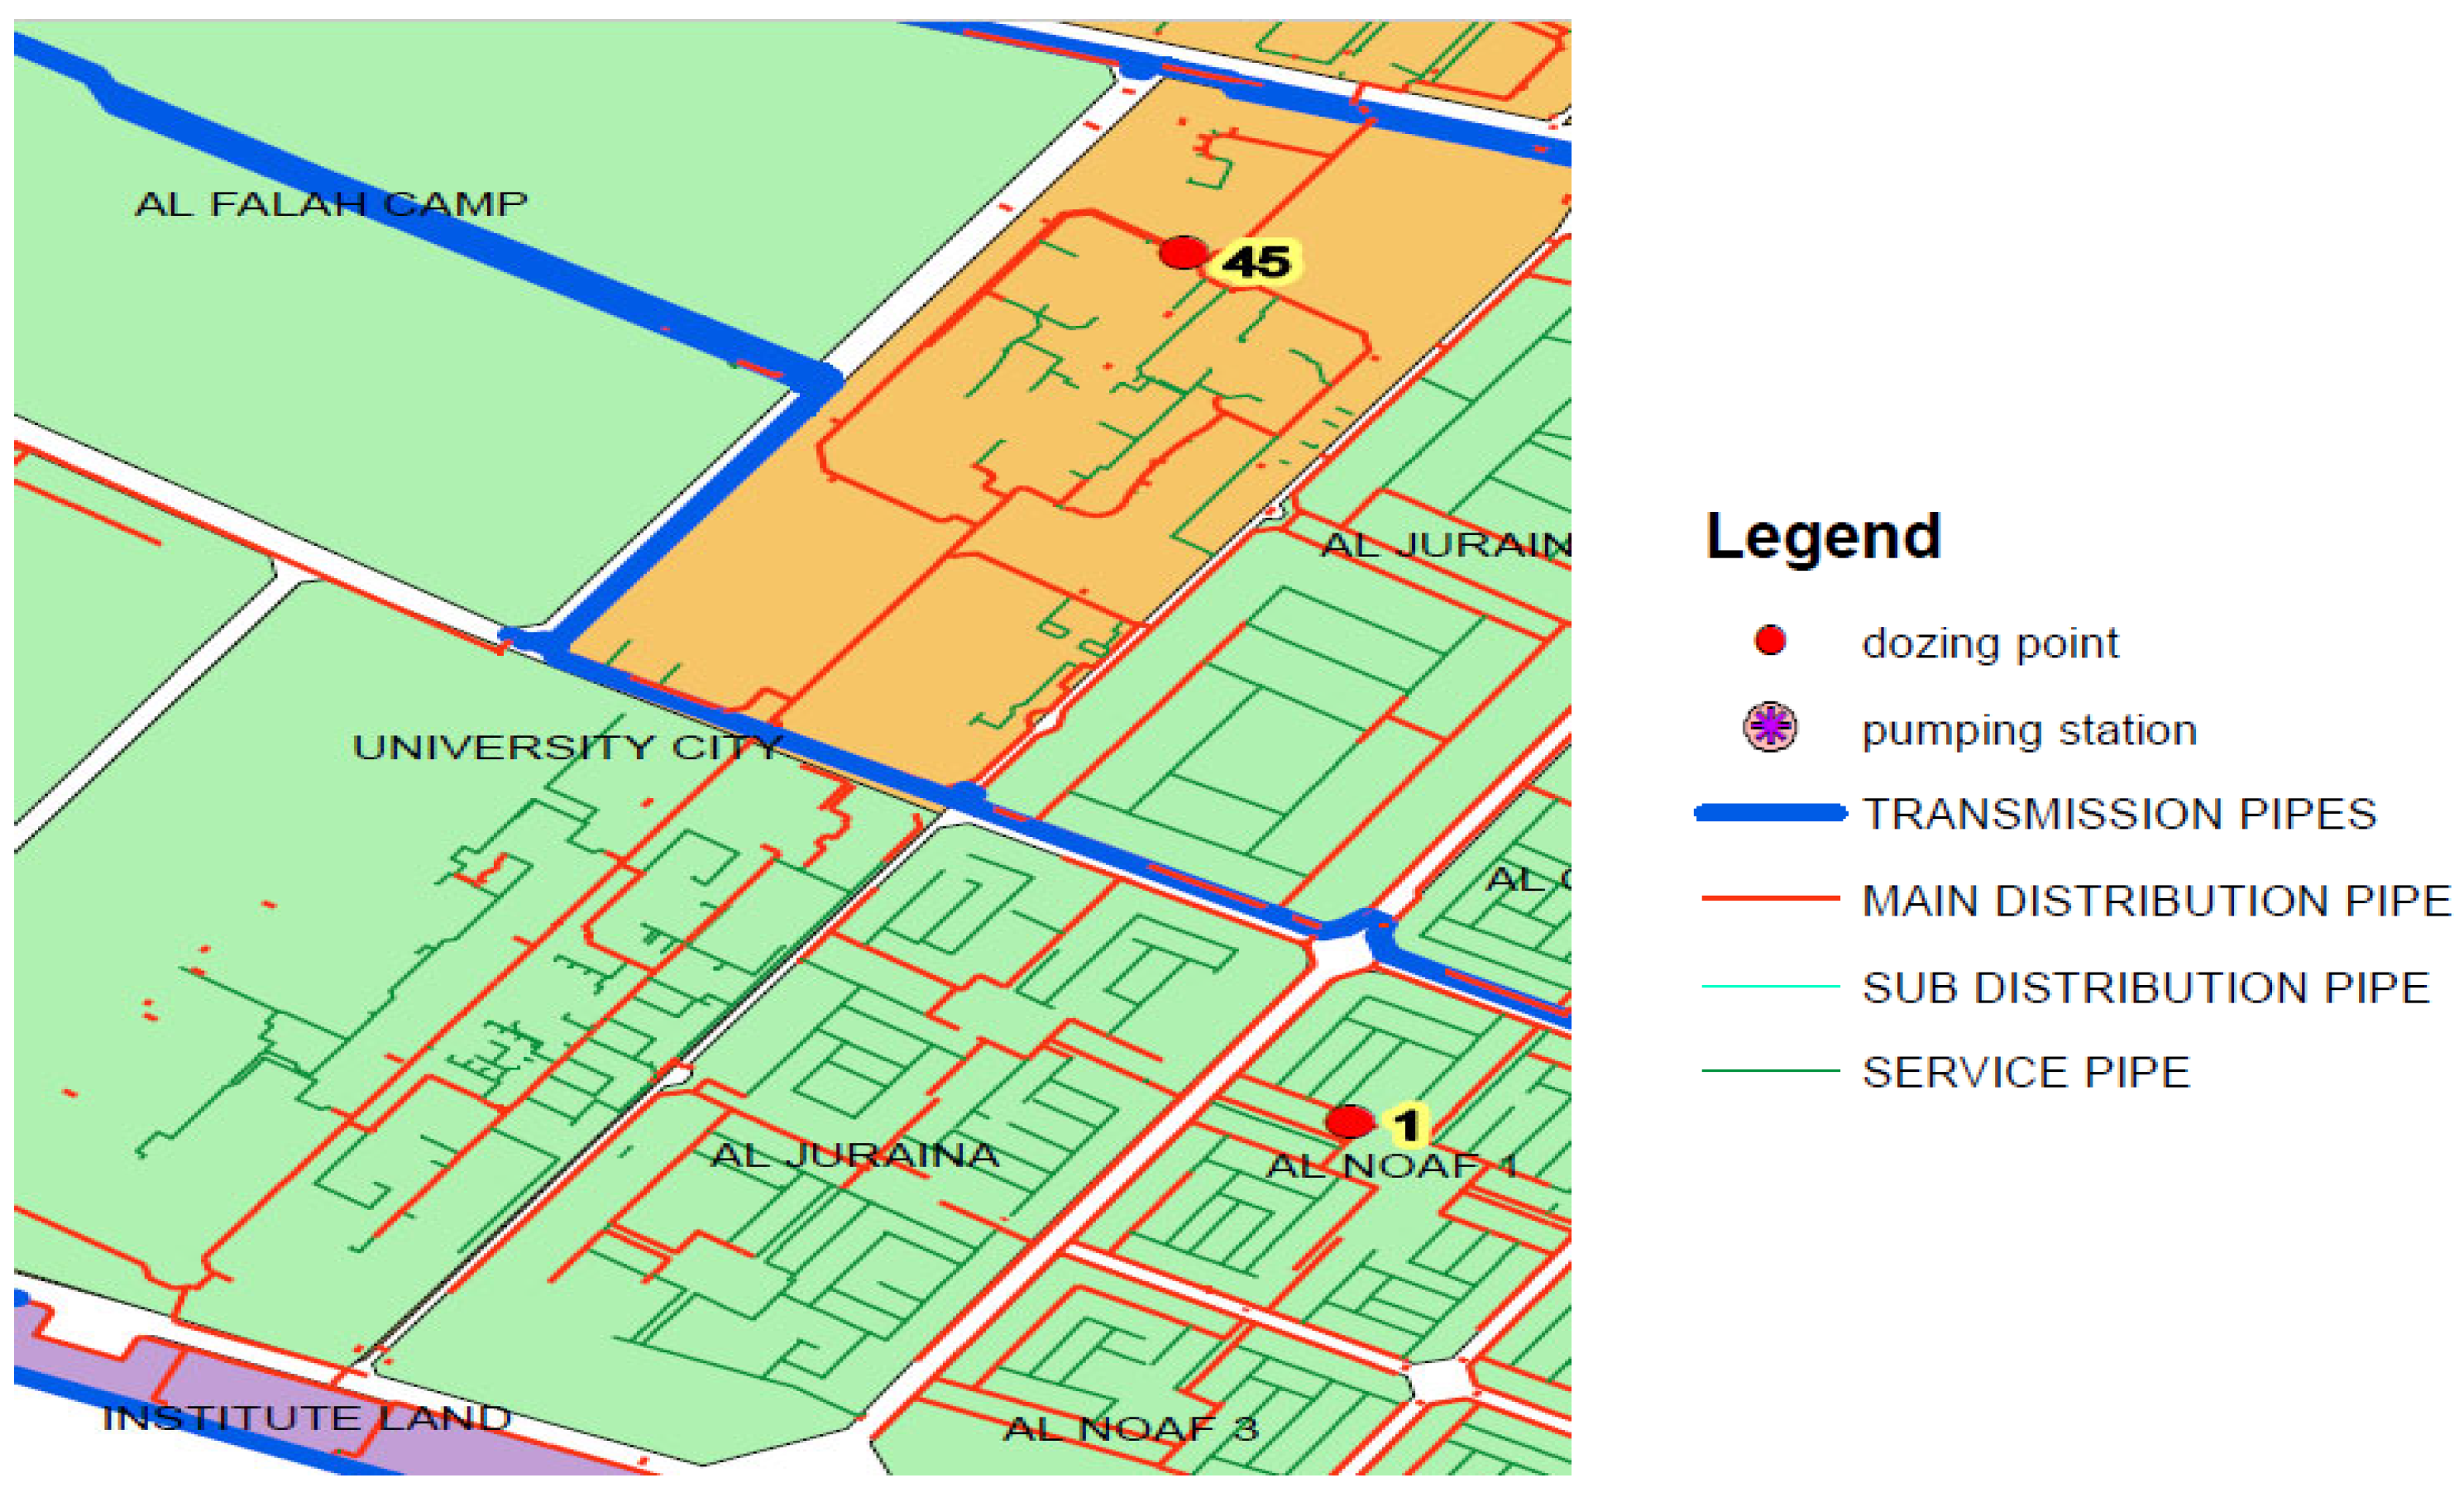
A hydraulic model is required to assess the performance of the WDN through simulations. Nonetheless, they are deemed excessively large for our study. A hydraulic model of the WDN in University City, Sharjah, is employed to implement the proposed methodology (Figure 2). The University City is situated in Sharjah, a prominent city in the United Arab Emirates. The WDN was chosen as it is an isolated district metering area and not excessively large to apply a resilience model. The WDN has 634 pipelines, 451 nodes, and two water sources. Additionally, the WDN utilizes asbestos cement as the pipe material, comprising a total length of 12 km. Hypothetical simulations will be conducted to assess the effects on the resilience of WDN. A range of failure scenarios were simulated, including water shortages caused by climate change, pipe failures resulting from earthquakes, and water quality failure under any disaster.
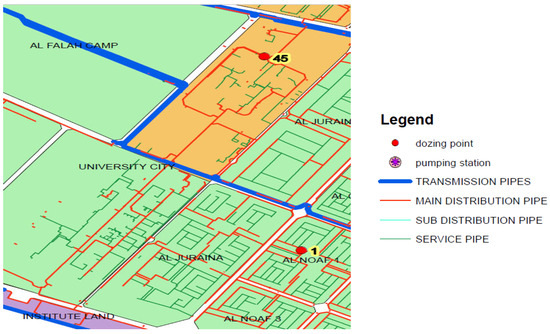
Figure 2.
A detailed layout of the study area.
2.2. Global Resilience Analysis
To apply GRA, there are several steps need to be identified:
- Since GRA is a performance-based approach that needs a hydraulic model (University City in this study);
- Identify the failure scenarios;
- Identify the stress magnitude of each failure scenario;
- Identify the software that will be utilized to simulate the failure scenarios of the hydraulic model.
A hydraulic model of the current WDN of the study area was utilized to theoretically implement failure scenarios and examine the system’s performance. WaterCAD software 10.3 was used to model failure scenarios. Subsequently, the categories of failure scenarios or stress (pipe failure, excess demand, and initial chlorine concentration) were selected based on the literature, and recognizing the network’s responses [28]. Once the models were run, the corresponding WDN responses were recorded based on failure on the nodes, pressure, and chlorine residual. The failure of the WDN to provide a minimal standard of services was defined in the literature. For this study, the minimum acceptable pressure and residual chlorine concentration were 20 psi (137,895 Pascal) for water quality and 0.5 mg/L for pipe failure. Node failure was defined as having no water supply in any node.
2.3. Development of Resilience Index
This study presents the implementation of a GRA-based novel resilience index for WDN. The resilience index is a quantitative measure scaled from 0 to 100, designed to assess the resilience of a WDN. The resilience index is categorized into four distinct classifications (Table 1). The initial category is high resilience, scoring between 70 and 100; the second category is moderate resilience, scoring between 60 and 69; the third category is poor resilience, scoring between 45 and 59; and the final category is extremely low resilience, scoring between 1 and 44. A 70% resilience against extreme disaster events can be considered as high resilience. For this reason, 70% and above was considered as high resilience. A minimum of 60% resilience was considered as passing or moderate. Anything below 60% was considered low and below 45% was considered very low. These resilience index score limits were taken from the approach in financial risks by FICO (Fair Isaac Corporation), which is designed to assess a client’s financial resilience during economic recessions. FICO’s resilience index reflects the client’s performance based on their score [40]. The classification of financial resilience is applied to this particular study. The adoption takes a non-uniform approach to develop four classes of resilience, with the top 30% being high resilience and the bottom 45% being very low resilience. This study calculates the resiliency index based on system performance on the ability to withstand pressure during a disaster, which comprises four indicators: pipe failure, excess water demand, and water quality and ability to recover (Equation (1)). The conceptual model of this resilience index was presented in a recent research study aimed at assessing the resilience of the WDN [7]. The resiliency index can function as a crucial decision-making tool for managing infrastructure, facilitating optimal choices for the operation and maintenance of service life.

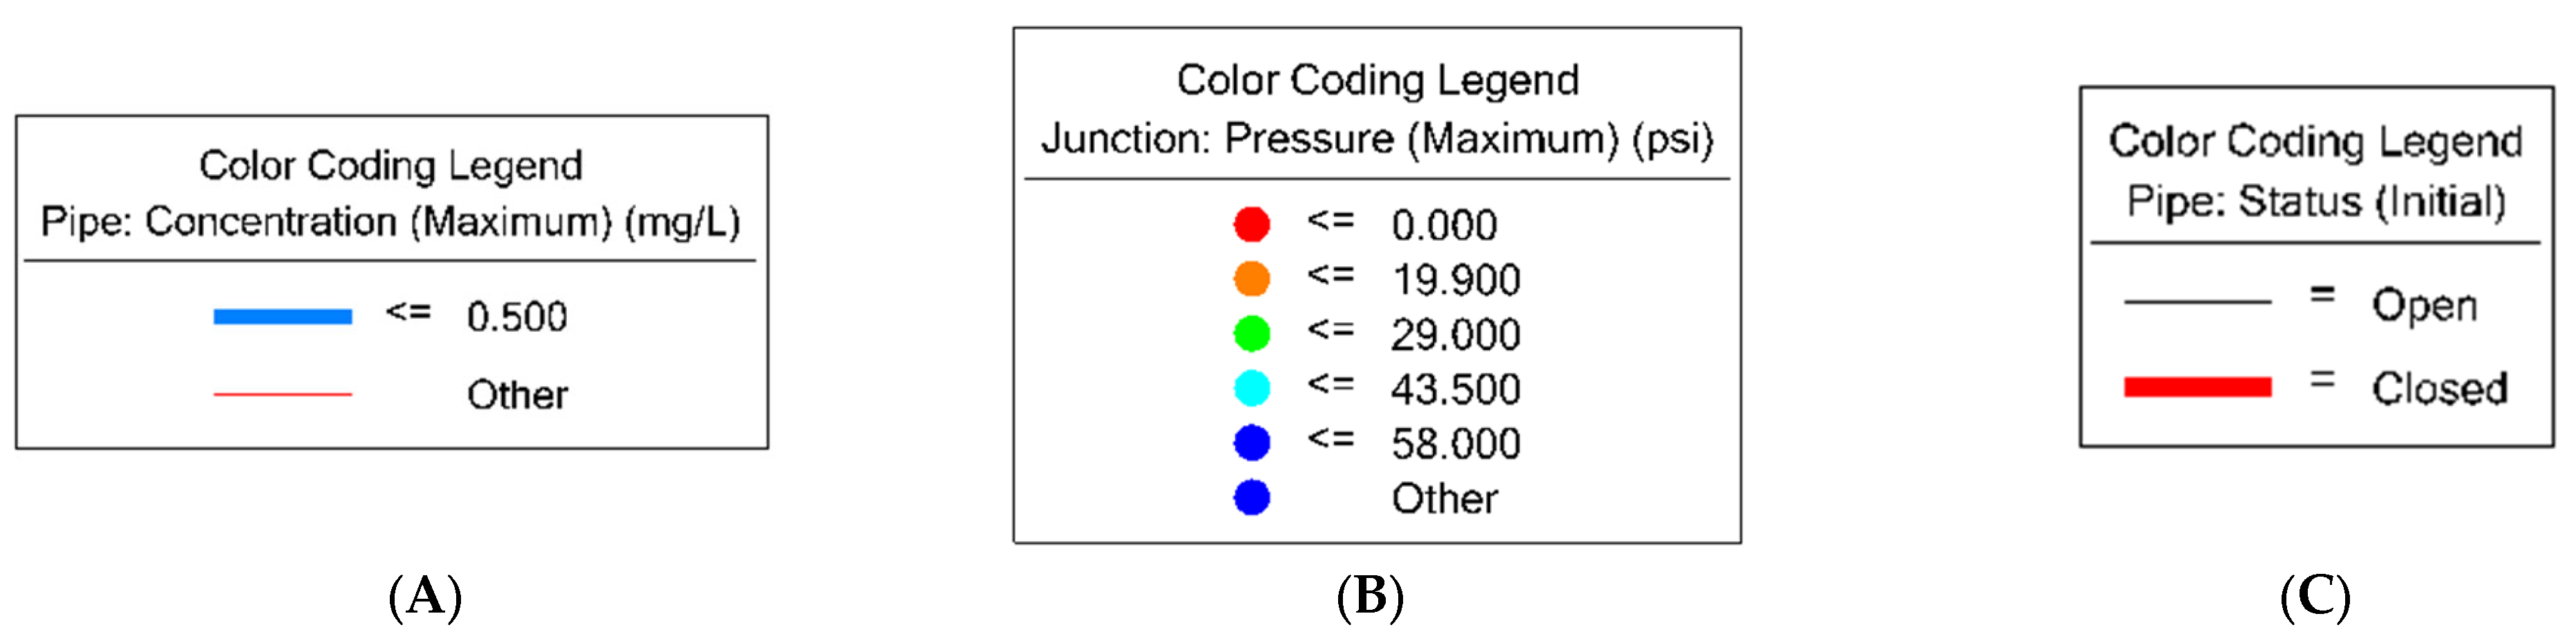
Table 1.
Color code of RI legend.
The resilience scores (0–100) (F1, F2, F3, and F4) for the first three criteria were measured through software analysis of different failure conditions and the last criteria (recovery time) were measured based on a survey conducted on the operators of the water company (Table 2). Relative weights of the resilience factors (βs) were determined based on an Analytical Hierarchy Process (AHP) survey.
where
RI = β1 F1 + β2 F2 + β3 F3 + β4 F4,
Table 2.
Recovery time score.
- β: coefficients weights representing the relative significance of the indicators;
- F1: pipe failure;
- F2: water contamination;
- F3: water excess demand;
- F4: recovery time.
2.4. Failure Scenarios
Table 3 presents a summary of all stresses and strains employed in this investigation for three distinct failure analyses. A proficient water distribution network (WDN) must consistently deliver a sufficient volume of water to users, even during maintenance, repairs, or emergencies involving any system component. Multiple scenarios were simulated to understand the impact of pipe failure on the network. An example is analyzing the impact of a principal pipe failure (singular failure) on the system’s operation. A different scenario entails analyzing the impact of numerous occurrences of partial pipe failure on system performance. In this failure scenario, the stress magnitude signifies the supply shortfall, whereas the strain magnitude indicates the proportion of nodes experiencing water loss exceeding 50% of their demand relative to the total number of nodes. Equations (2) and (3) illustrate the computation of supply deficiencies and node failures. F1 was derived from the percentage shortfall of node failures subtracted from 100 (i.e., F1 = 100–percentage of nodes failure).
Table 3.
Failure scenario summary.
To assess the effect of a single or partial failure on the system, it is essential to identify important water distribution pipelines. Typically, a water network has main distribution pipes, sub-distribution pipes, and service pipes that are interconnected. WDNs are intricate and interrelated networks. Prior research employed supply shortages as a method for identifying essential pipes within the WDN [41,42]. The supply shortfall is defined as the ratio of supply to demand at each junction during the assessment of specific pipe failures [42]. If the demand at a junction is not entirely satisfied due to an occurrence that halts the pipe’s supply to connected junctions, a supply deficit ensues; the greater the number of connected nodes, the more pronounced the supply shortage would be. Consequently, the identification of essential water distribution pipelines was conducted using a hybrid methodology that integrates hydraulic simulations with technical assessment. The architecture of the WDN in the University City of Sharjah results in the main pipeline network supplying four districts through many service pipes. Consequently, utilizing engineering judgment, several primary distribution pipes were chosen according to their location throughout the network, followed by a hydraulic simulation to assess their impact on the network in relation to the supply deficit. The key pipes were identified based on the extent of scarcity they induce in the network, their significance within the network, or their contribution to considerable supply deficits. This study assumed multiple scenarios in the program to examine the supply deficiency. The scenarios encompassed a combination of primary and connecting pipes to identify the supply deficiencies for each scenario. In subsequent phases, the scenarios chosen for constructing the resilience index focused on supply shortages and their effects on the nodes. The scenarios characterized by significant supply constraints and substantial impact on the nodes were chosen to formulate the resilience index.
A good WDN should not contaminate the water in the distribution network and should supply safe water to the users. The second influencing factor was the failure in water quality. A hypothetical failure scenario assumed that a number of pipes of the system are considered contaminated due to high chlorine decay and low residual chlorine concentration in the water. In order to test the quality of the water in the WDN, a certain amount of chlorine was added to the starting point and left there for a certain amount of time. To illustrate, chlorine was added at the starting point, which in this case was the water treatment plant where water entered the University City WDN. The stress magnitude is the amount of chlorine added at the starting point, and the strain magnitude is the number of contaminated pipes divided by the total number of pipes in the system. According to water quality regulations in the UAE [43], the ideal chlorine concentration should be between 0.5 mg/L and 5 mg/L. Thus, the scenarios applied were between 0.5 mg/L and 5 mg/L, and any pipe that has a chlorine concentration below this range is considered contaminated. Thus, the stress magnitude was the chlorine concentration, and the strain magnitude was the ratio of contaminant pipes with water to the total number of pipes. Pipe contamination was measured by Equation (4). The F2 score was calculated based on the deficiency of % contaminated from 100 (F2 = 100-percentage of pipe contamination).
The third failure scenario reflected the impact of overloading the nodes with excess demand on the performance of the system. To illustrate, due to events where the demand may exceed the supplied quantity, a simulation was conducted to understand the corresponding performance loss. For instance, an excess demand (stress) was selected to run the simulation on nodes, and the performance of the system when the nodes were subjected to additional demand was investigated. To illustrate, A hypothetical failure scenario was assumed where incremental water demand is increased to test the ability of the system to deliver an adequate amount of water with acceptable water pressure. In other words, the user’s demand for water exceeds the supplied water. According to water supply regulations in the UAE [44], the water pressure should not be less than 1.5 bar (20 psi) at the distribution supply pipes to the users. Thus, the demand was increased incrementally for all the nodes in the system, and the nodes that have pressure less than 20 psi are considered failing. Thus, the stress magnitude was the excess demand, and the strain magnitu was the ratio of nodes with pressure less than 20 psi to the total number of nodes. Node pressure failure/deficiency was calculated based on Equation (5). F3 score was calculated based on the deficiency of pressure failure from 100 (F3 = 100–percentage of nodes with pressure deficiency).
2.5. Survey
Two surveys were conducted as part of developing the resilience index model. The first survey was designed to gather operators’ opinions on the recovery time required for the proposed hypothetical failure scenarios in the University City WDN and the significance of these events according to the Analytical Hierarchy Process (AHP) technique. Two operators were interviewed and an average of their responses were reported. The survey comprised multiple sections. The initial section of the survey sought to gather data regarding the respondents’ years of experience and their area of specialization in the field. Following a succinct overview of the implemented failure scenarios—pipe failure, water contamination, and excessive water demand—the participants were solicited for their perspectives on the anticipated recovery time for each scenario.
The second section aimed to collect experts’ opinions about the recovery time needed for the first failure scenario. The first type was testing the impact of a single pipe failure on the level of service of the system and the second type was testing the impact of more than one pipe (partial) on the level of service of the system. The participants were asked two questions in this section based on the analysis of the applied scenarios and the required data for this scenario is the time required to repair the pipe and return the system to its original status. The participants were given recovery time from 3 days to 6 months to choose from. (1) If the main distribution pipe has a diameter of 300 mm and an approximate length of 130 m that is made of asbestos cement is broken and causes a 98%supply shortage in the total distribution system. How long it will take to fix the pipe and return the system to its initial status? (2) If a group of 12 main distribution pipes that have 300 mm diameter each and more than 450 m in length that are made of asbestos cement are broken and caused approximately 45% supply shortage of the total distribution system. How long it will take to fix the pipe and return the system to its initial status?
The third portion sought to gather expert opinions regarding the recovery time required for the second failure scenario. The participants were presented with three inquiries in this section, derived from the study of the implemented situations. The necessary data for this scenario includes the duration needed to completely purify the water and decrease the number of contaminated pipes in the system, thereby restoring the system to its original condition. The participants were provided with a recuperation period ranging from 3 days to 6 months for selection. (1) If 10–30% of the total pipes are contaminated, what is the duration required to purify the water and provide safe water to consumers? (2) If 35–60% of the total number of pipes are contaminated, what is the duration required to purify the water and provide safe water to consumers? (3) If 65–90% of the total number of pipes are contaminated, what is the duration required to purify the water and provide safe water to consumers?
The fourth portion sought to gather expert opinions regarding the recovery time required for the third failure scenario. The participants were presented with three inquiries in this section, derived from the study of the implemented situations. The necessary data for this scenario is the duration needed to satisfy the new demand while maintaining appropriate water pressure for users. The participants were provided with a recuperation period ranging from 3 days to 6 months for selection. (1) If the water demand escalates by 10–30% of the initial requirement. What is the duration required to fulfill the new demand while maintaining appropriate water pressure for consumers? (2) If the water demand rises by 35–60% of the original demand. What is the duration required to satisfy the new demand while maintaining appropriate water pressure for consumers? (3) If the water demand rises by 65% to 90% of the initial demand. What is the estimated duration to fulfill the new demand while maintaining appropriate water pressure for consumers?
The second survey was conducted on eight different experts on the relative significance of four factors (pipe failure, water contamination, excess demand, and recovery) influencing the resilience of the WDN. Experts were chosen as either university professors or someone working on water utilities for more than five years. Then, pairwise comparisons were designed based on AHP about the importance of the four indicators. The participants were asked six questions in this section as pairwise comparisons. The required data for this section were to give a rating for each comparison from a scale of 1–9, as shown in Table 4 in order to use the data to obtain the significant weight of each indicator. To determine the significant weight of each indicator (failure scenario) in the resilience index, the AHP was used. This step was essential for developing the resilience index since each of the indicators had a weight. The AHP is a decision-making method that was developed by Saaty in 1980 [45]. The method has proven that it can be used in decision-making and developing good judgments when the decision-maker has more than one element or criteria to choose from or rank. The AHP method drives the priority scales based on pairwise comparisons that depend on professionals’ judgments to rank the elements [45]. Studies have used AHP as an approach to help them rank the choices by giving weight to each of them [46]. For instance, in a previous study that was conducted to decide on the technology to rehabilitate the pipes in the WDN, the AHP method was used to rank the available technologies based on their weight and then decide on the best technology that has the highest weight [46]. Then, the participants were required to give a rate based on their judgments on which indicator was more important than the other.
Table 4.
AHP scales (adapted from Guide to Water Supply Regulations).
3. Results
3.1. Pipe Failure
Thirteen selected scenarios were simulated to detect stress and strain correlation. These were selected based on the most significant in the study area. The outcomes from all scenarios were compiled and reported in Table 5 for subsequent analysis and ranking of the scenarios utilized in the development of the resilience index. Single pipe failure indicates one pipe failure and partial failure indicates multiple pipe failures.
Table 5.
Pipe failure summary of 13 simulated scenarios.
For the pipe failure scenario, stress is the supply shortage percentage and the strain is the node failure percentage. To illustrate, the ranking is based on a high supply shortage with high node failure. For example, in scenario 2, which is a single pipe failure, the stress is 12.53% supply shortage and 27.9% node failure. In scenario 3 which is a single pipe failure, the stress is 1.89% supply shortage and 5.8% node failure. Scenario 2 is more significant than scenario 3 because it causes a high supply shortage with high node failure. Table 6 delineates the essential pipe failure scenarios predicated on significant supply deficits and elevated failure nodes: (ranking: 1 denotes minimal criticality, while 5 signifies high criticality). The F1 score demonstrates significant resilience in the top four ranked scenarios.
Table 6.
Critical pipe failure scenarios.
3.2. Water Contaminant
To assess the resilience of the WDN, one crucial factor evaluated was the quality of the water. This failure type assumed that the water globe was the sole site for chlorine application. Consequently, several initial chlorine concentrations were introduced at the main reservoir in the software model to evaluate the contamination percentage within the pipes at different concentrations. The contamination of water was assessed through the simulation of ten scenarios. The outcome of this analysis is presented in Table 7. The findings align with the prevailing understanding that diminished chlorine levels elevate the likelihood of water contamination, hence decreasing the resistance score F2.
Table 7.
Water contamination summary.
3.3. Water Excess Demand
In order to investigate the resilience of the WDN, the pressure under excess water demand was examined. The pressure is significant to ensure that the water is delivered to the end-users with an adequate amount of water. Table 8 summarizes all the pressure deficiencies for each applied water excess scenario. In this type of failure, it is assumed that the system’s nodes are experiencing excess demand. To test the pressure of these nodes, several simulations with incremental initial demand were generated using water CAD software. The simulations created different results for all these steady-state conditions. The results are consistent with the notion that increased demand increases the pressure level beyond 20 psi and decreases the pressure failure. This eventually led to high F3 scores, indicating increased resilience. The nodes with pressure less than 20 psi were considered failing.
Table 8.
Water excess demand scenarios summary.
3.4. Recovery Time Survey Results
3.4.1. Pipe Failure Recovery Time
The survey results from the operators indicated that for the first scenario, which was the single pipe failure, the recovery time was 3 days (Table 9). For the second scenario which was the partial pipe failure, the required time was between 3 days and 2 weeks. The average was considered to be one week. Since the minimum and maximum time of recovery during the survey were 3 days and 6 months, they were given a F4 score of 100 and 0. All other scores were linearly interpolated.
Table 9.
Summary of the recovery time survey.
3.4.2. Water Contamination Recovery Time
The time required to fully clean the water, reduce the number of contaminated pipes in the system, and return the system to its original status for the water contaminant scenario was the focus of this survey. The participants were given three scenarios, and the participants answered the question based on the best of their knowledge. For the first scenario, which was 10–30% of the total number of pipes contaminated, the recovery time was between 3 days and 2 weeks. So, in this case, the average recovery time could be 1 week (Table 9). For the second scenario, which was 35–60%, the required time was between 3 days and 2 weeks, so in this case the average recovery time could be 1 week. For the third scenario, which is 65–90%, the required time was between 3 days and 2 weeks. So, in this case, the average recovery time could be 1 week. The F4 scores were consistent with the notion that low recovery time indicated high resilience.
3.4.3. Water Excess Demand Recovery Time
The time required to meet the new demand with acceptable water pressure for the consumers to return the system to its original status for the water excess demand scenario. The participants were given three scenarios, and the participants answered the question based on the best of their knowledge. For the first scenario, which was the 10–30% increase in the initial demand, the recovery time was between 3 days and 3 months. So, in this case, the average recovery time could be 1 month. For the second scenario, which was 35–60%, the required time was between 2 weeks and 3 months. So, in this case, the average recovery time could be 2 months. For the third scenario, which was 65–90%, the required time was between 2 weeks and 3 months. So, in this case, the average recovery time could be 2 months. F4 scores were consistent, similar to the other failure scenarios.
3.4.4. AHP Analysis for Relative Weightage Estimation
To determine the pipe failure weight in the resilience, an index of the rating of the water experts was gathered and used for calculating the pipe failure weight. A total of 8 collected surveys were used to calculate the coefficient weights for the four indicators. For the first pairwise comparison, approximately 50% of the respondents rated that pipe failure and pipe contamination have equal importance with rating 1. For the second pairwise comparison, approximately 50% of the respondents rated that pipe failure was very strongly important over the water excess demand with a 7 out of 9 rating. For the third pair-wise comparison, approximately 37.5% of the respondents rated that the recovery time was extremely important over the pipe failure with a 9 out of 9 rating. For the fourth pairwise comparison, approximately 37.5% of the respondents rated that pipe contamination was extremely important over the water excess demand with a 9 out of 9 rating. For the fifth pair-wise comparison, approximately 37.5% of the respondents rated that pipe contamination was strongly important over the recovery time, with 5 out of 9.
Table 10 depicts the relative significance weight of each indicator that was eventually used for developing the resilience index. The highest weightage was the water contamination indicator with 0.357. The second highest weightage was the recovery time indicator with 0.245. The third highest weightage was pipe failure with 0.235. Lastly, the least weightage was the water excess demand with 0.163. However, it should be noted that the AHP approach possesses certain drawbacks. The technique cannot ensure the accuracy of the decisions. As the number of levels in the hierarchy escalated, the quantity of pairwise comparisons also rose, necessitating greater time and effort to perform the analysis [47].
Table 10.
Coefficients weights for each indicator.
3.5. Resilience Index
After computing the coefficient weights for each indicator and estimating the recovery time for the applied scenarios, the resilience index Equation (1) can be rewritten as Equation (6). Equation (6) can be used to estimate the resilience index under any disaster scenarios for the WDN in the University City. This model can be used to examine any hypothetical disaster (stress) scenarios to examine the resilience of this particular WDN.
RI = 0.235 F1 + 0.357 F2 + 0.163 F3 + 0.245 F4
3.5.1. Hypothetical Scenario
In order to investigate and demonstrate the application of the resilience index model in Equation (6), five hypothetical stress levels (20%, 40%, 60%, 80%, and 99%) were applied to the University City WDN. These stress levels were chosen based on five increments (each 20%) in addition to network stress. It demonstrates up to operation at 200% capacity. The models were run in WaterCAD to estimate the failure rates and the eventual F1, F2, and F3 scores (Table 11). From the operator survey, F4 scores were taken. Then, Equation (6) was used to estimate the resilience index (RI) for the model. The resilience classification as defined in Table 1 was used to characterize the resilience level. Based on the results in Table 11, the RI revealed that the WDN under 20% stress is categorized as low resilience with a 58.0 resilience score. Also, the WDN under 40% stress was categorized as low resilience with a 51.0 resilience score. Lastly, the WDN under 60%, 80%, and 100% are categorized as very low resilience with 44, 33.52, and 22.46 resilience scores, respectively.
Table 11.
Resilience index.
3.5.2. Development of a Management Plan
After understanding the critical components of the WDN and its impacts on the distribution system, a management plan is formed to improve the resilience of the system based on the analysis of the hydraulic model under the failure scenarios, which helped in developing the resilience index. A management plan provides solutions for the existing distribution network construction. Five plans with different levels of RI are given below.
- (i)
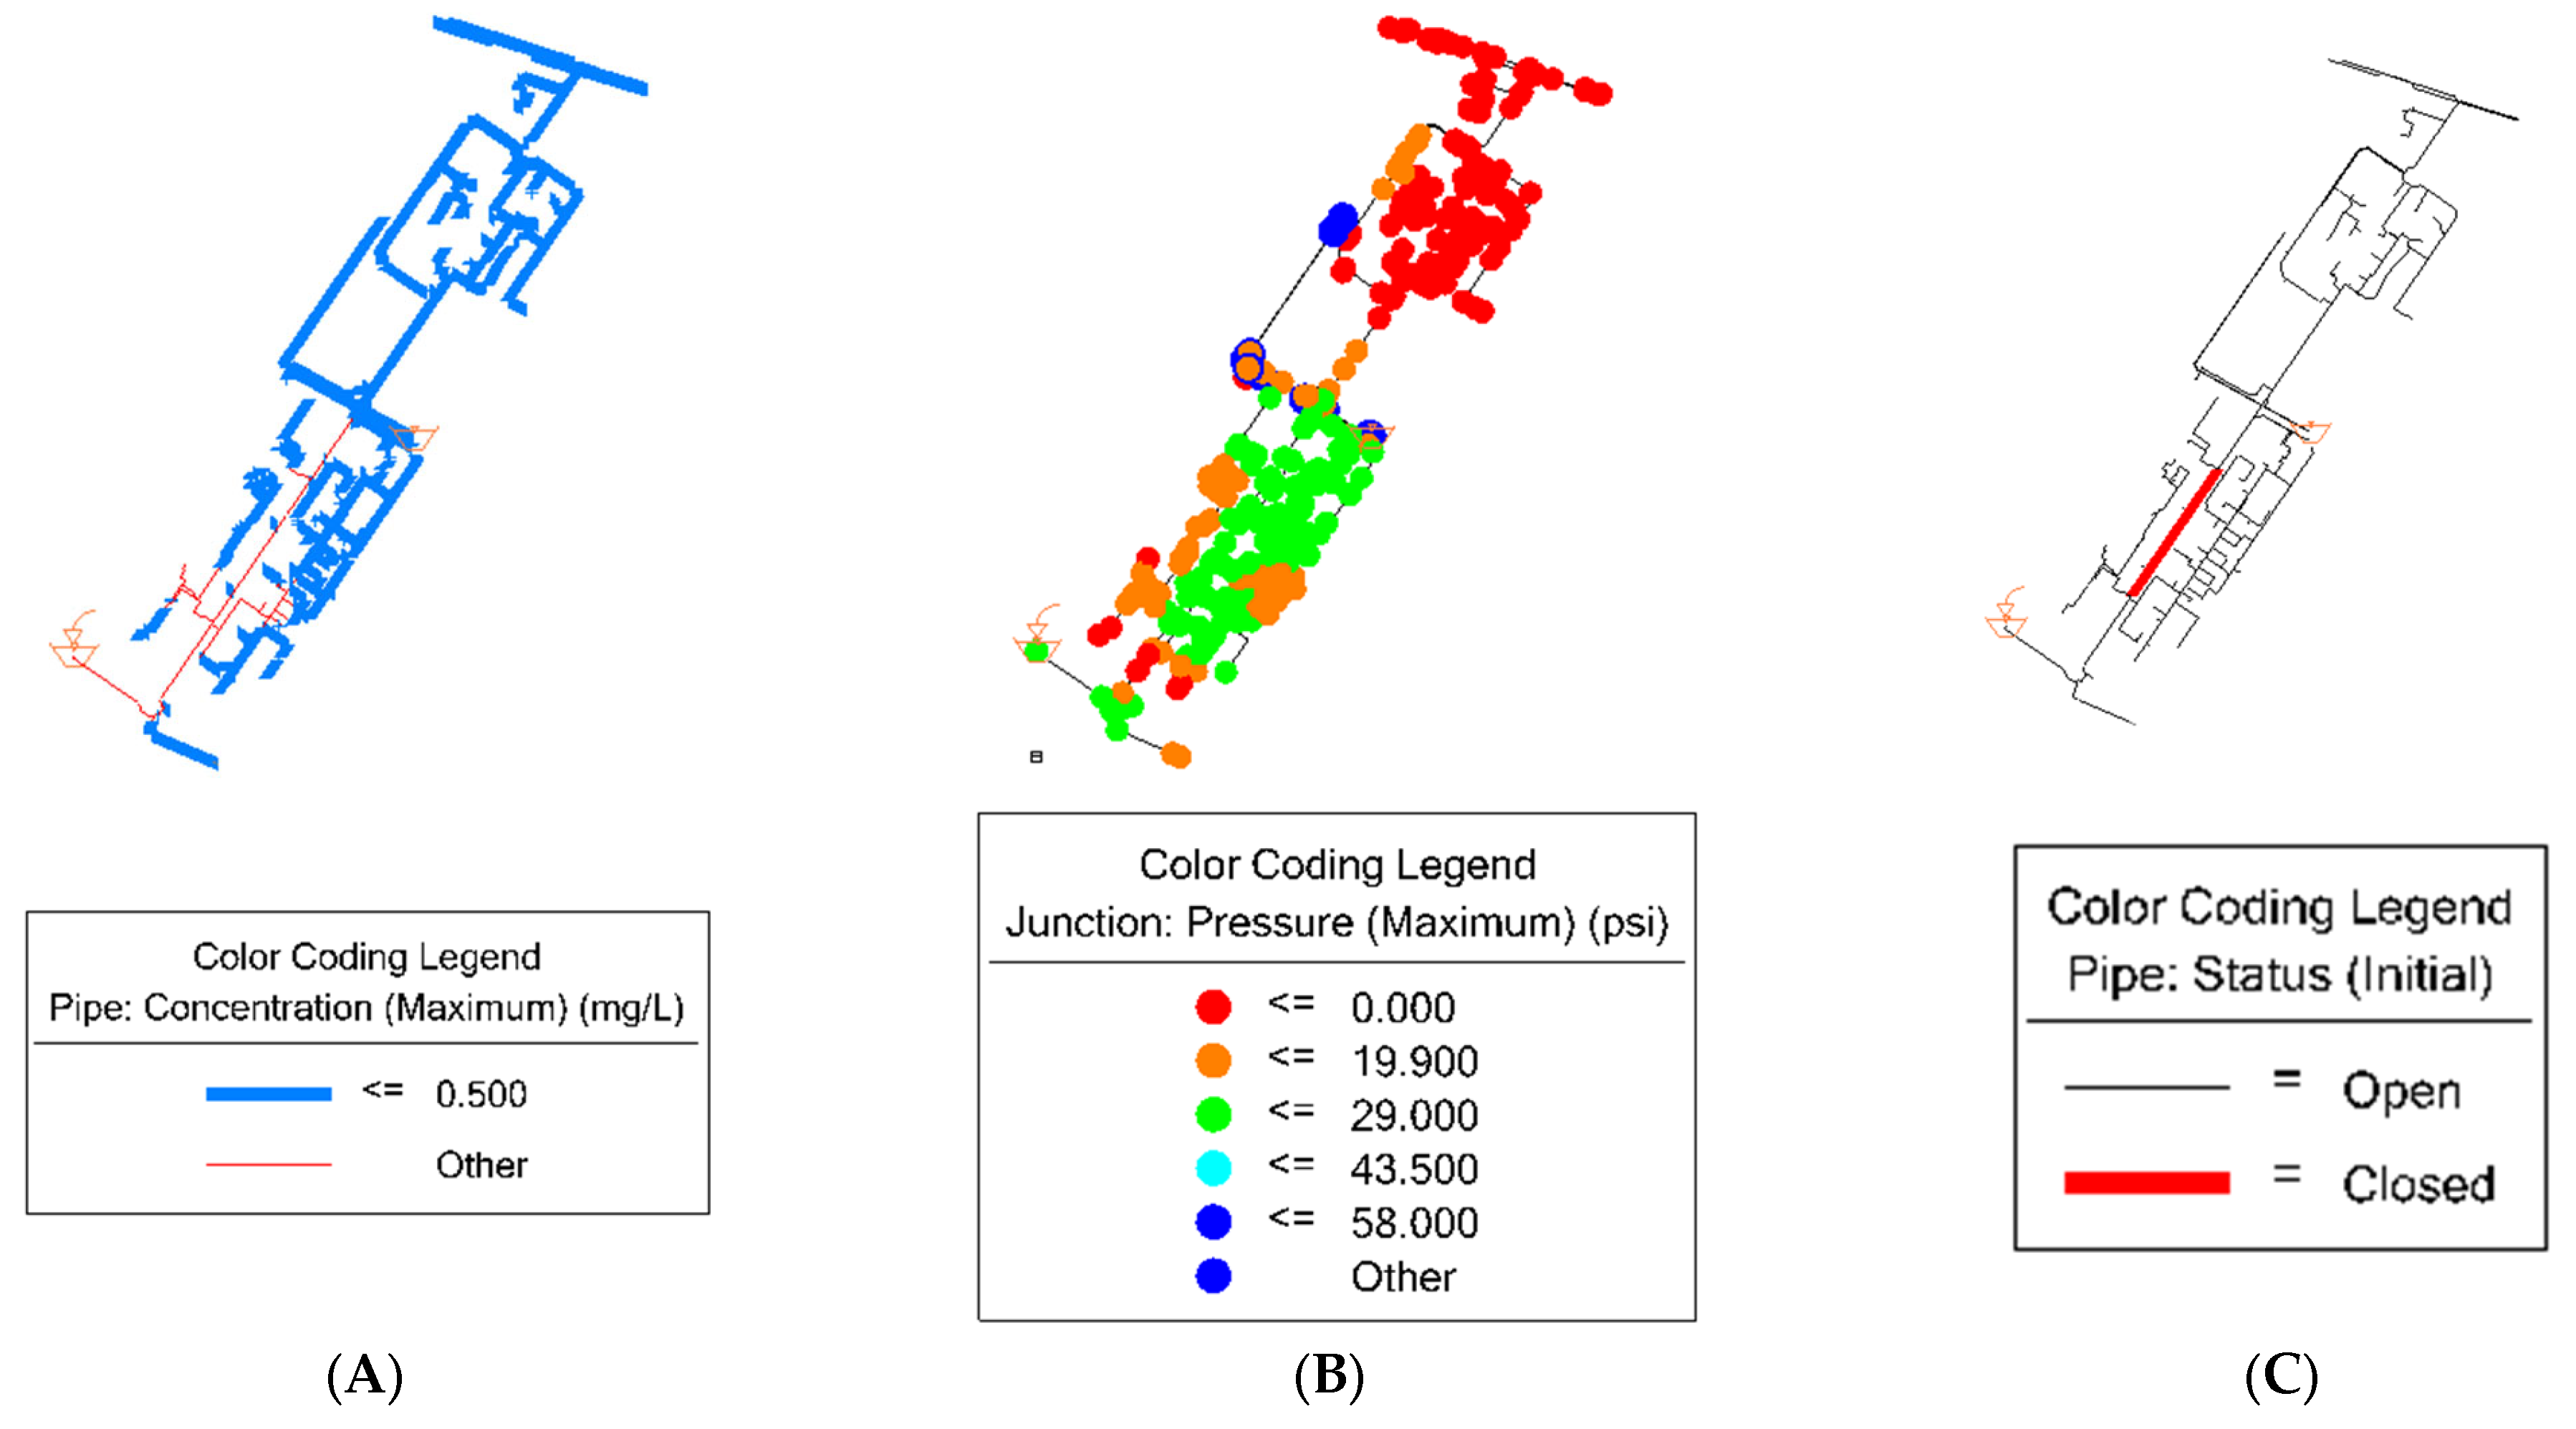
- For RI 20%: the lowest score was for the water contamination with 34; thus, it is recommended to ensure that the chlorine concentration in the pipes colored in blue, as shown in Figure 3A, meets the water quality regulations in the UAE and it is between 0.5 mg/L and 5 mg/L. Also, for the water excess demand with a 50 score, it is recommended to ensure that the junctions with the color red and orange, as shown in Figure 3B, are maintaining the acceptable water pressure, which is between 20 psi and 60 psi. Lastly, for the pipe failure, it is recommended to ensure that one pipe colored in red, as shown in Figure 3C, does not fail, and if, in case of failing, a prompt recovery response is needed;
 Figure 3. Management plan for RI 20%: (A) contamination; (B) pressure level; and (C) pipe failure.
 - (ii)
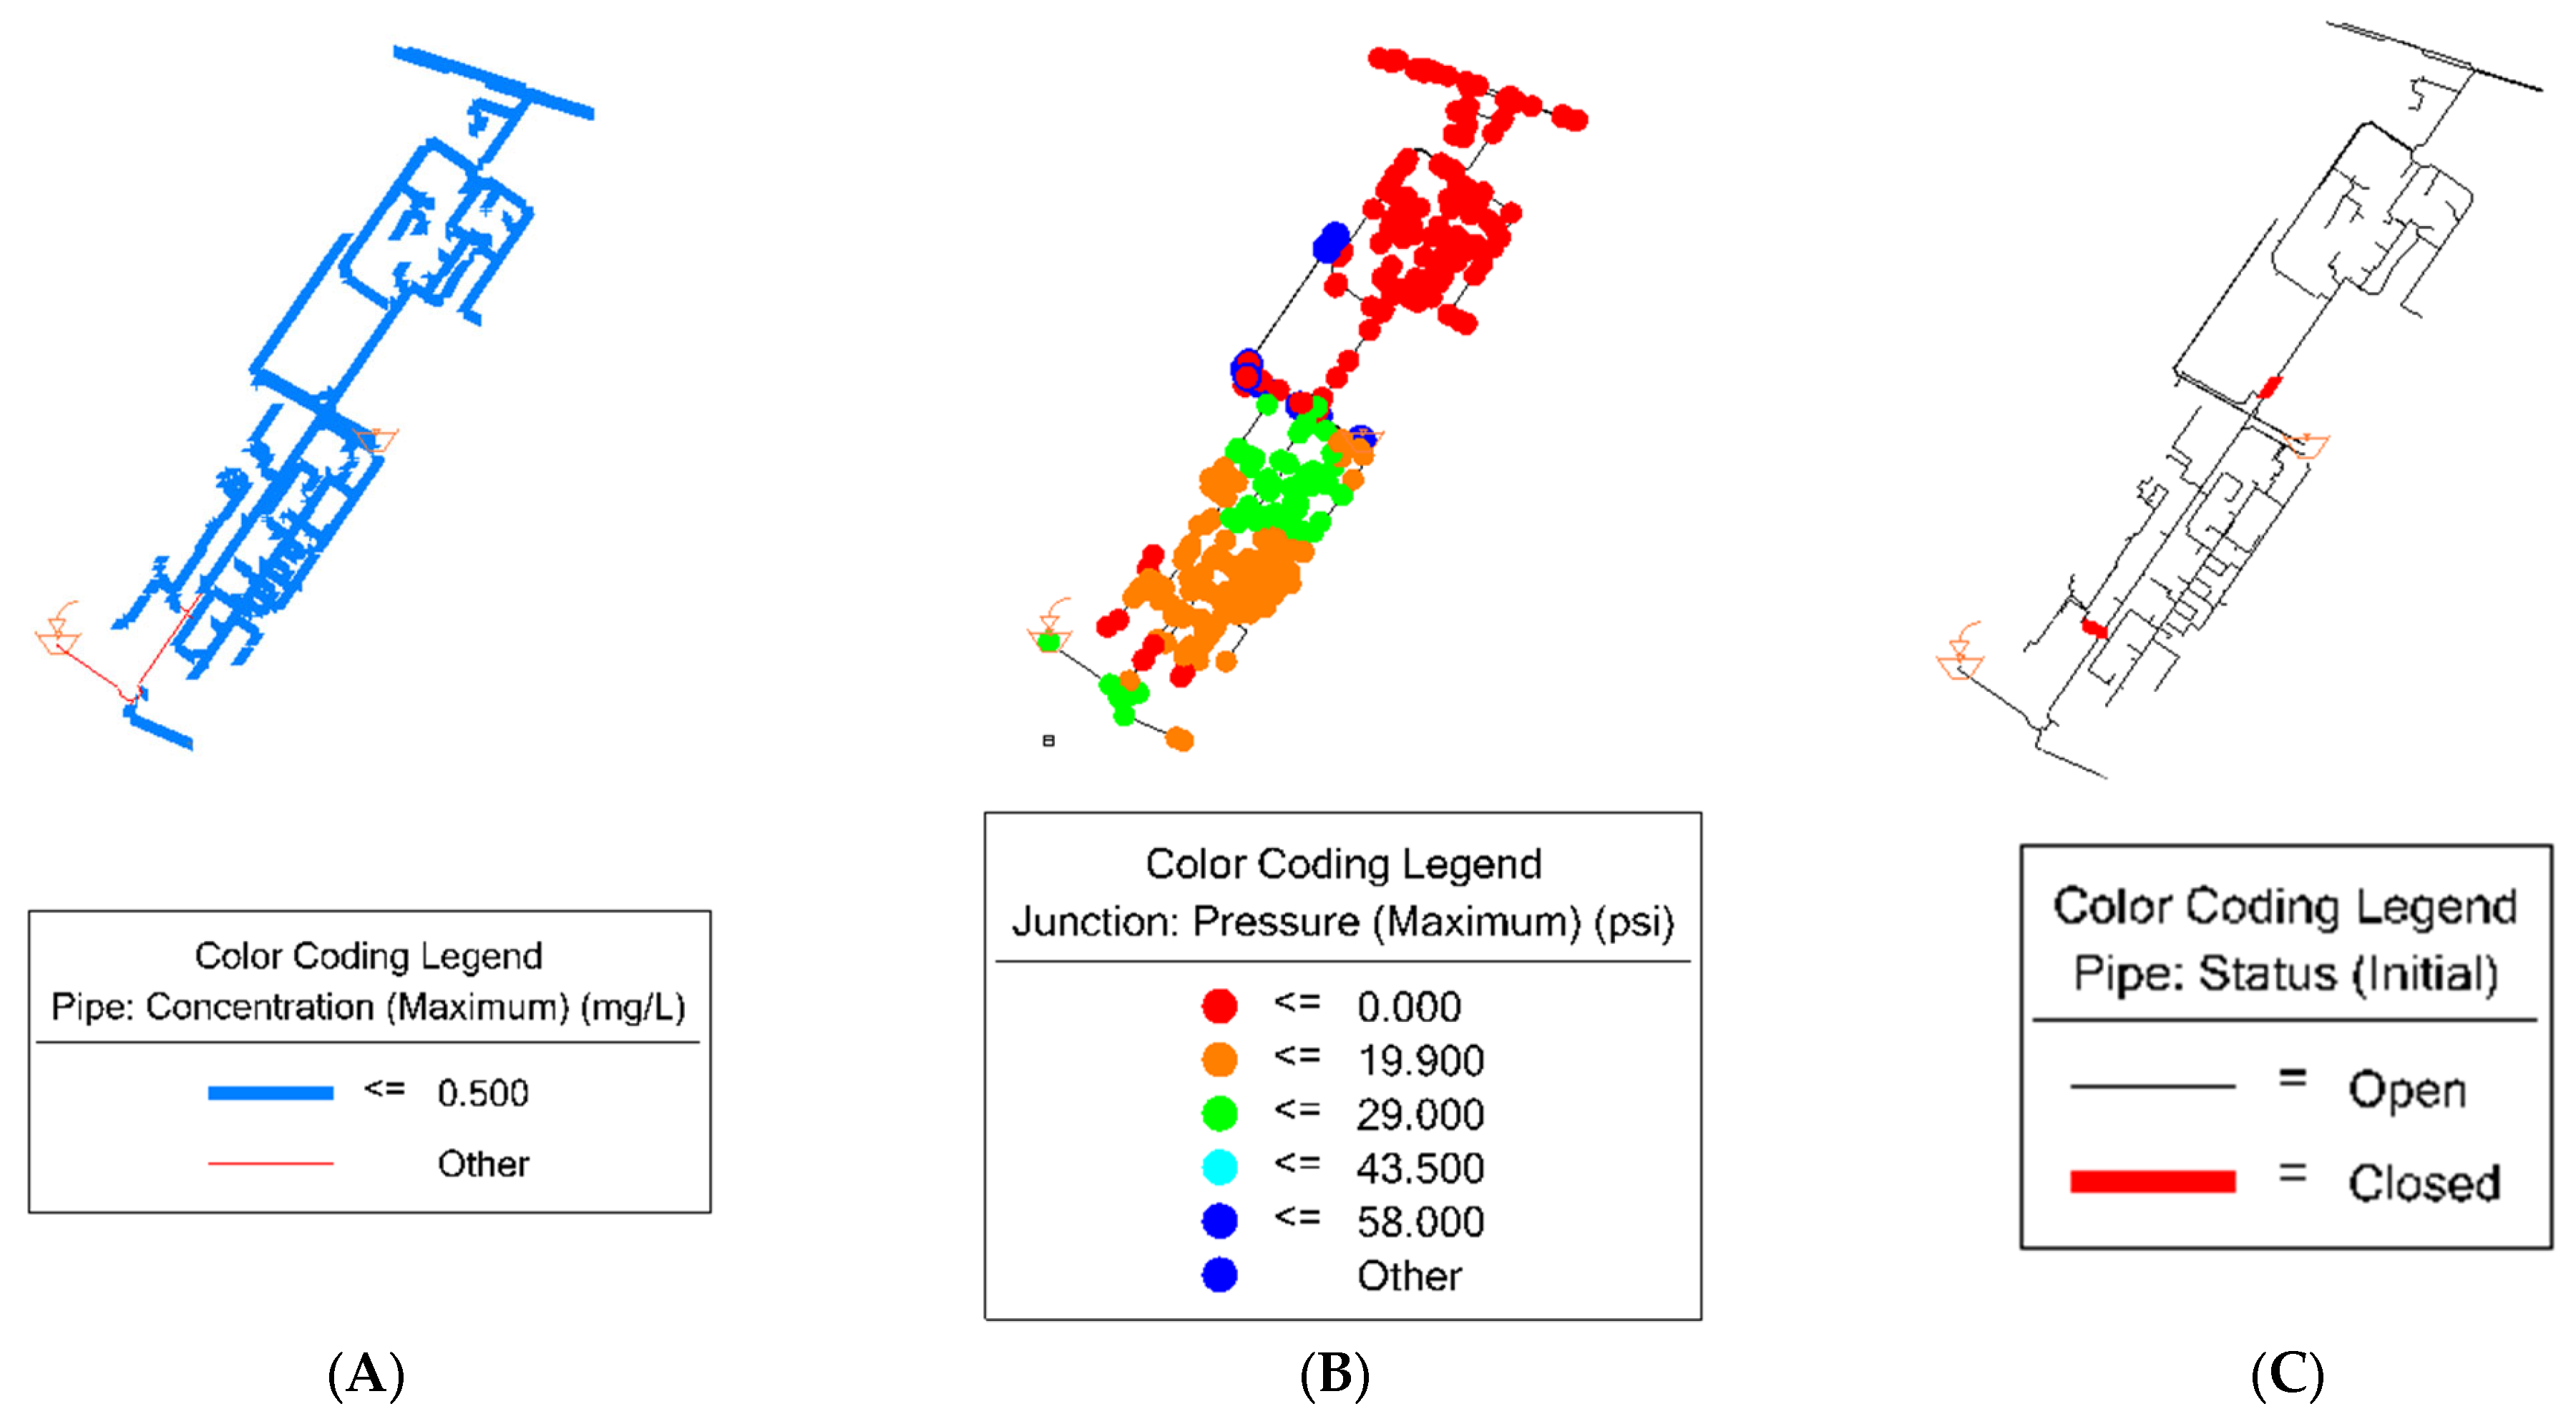
- For RI 40%: the lowest score was for the water contamination with 30; thus, it is recommended to ensure that the chlorine concentration in the pipes colored in blue, as shown in Figure 4A, meets the water quality regulations in the UAE and it is between 0.5 mg/L and 5 mg/L. Additionally, for the water excess demand with a 49 score, it is recommended to ensure that the junctions with the color red and orange, as shown in Figure 4B, are maintaining the acceptable water pressure, which is between 20 psi and 60 psi. Lastly, for the pipe failure, it is recommended to ensure that three pipes colored in red as shown in Figure 4C do not fail, and if, in case of failing, a prompt recovery response is needed to reduce the number of impacted nodes;
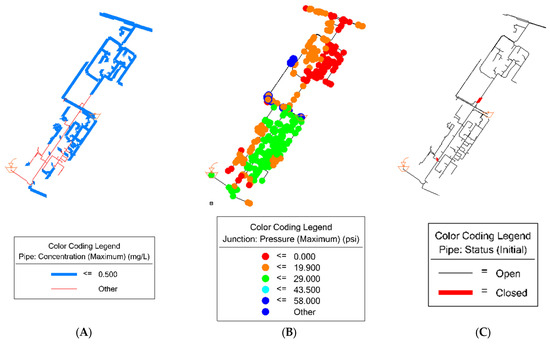 Figure 4. Management plan for RI 40%: (A) contamination; (B) pressure level; and (C) pipe failure.
- (iii)
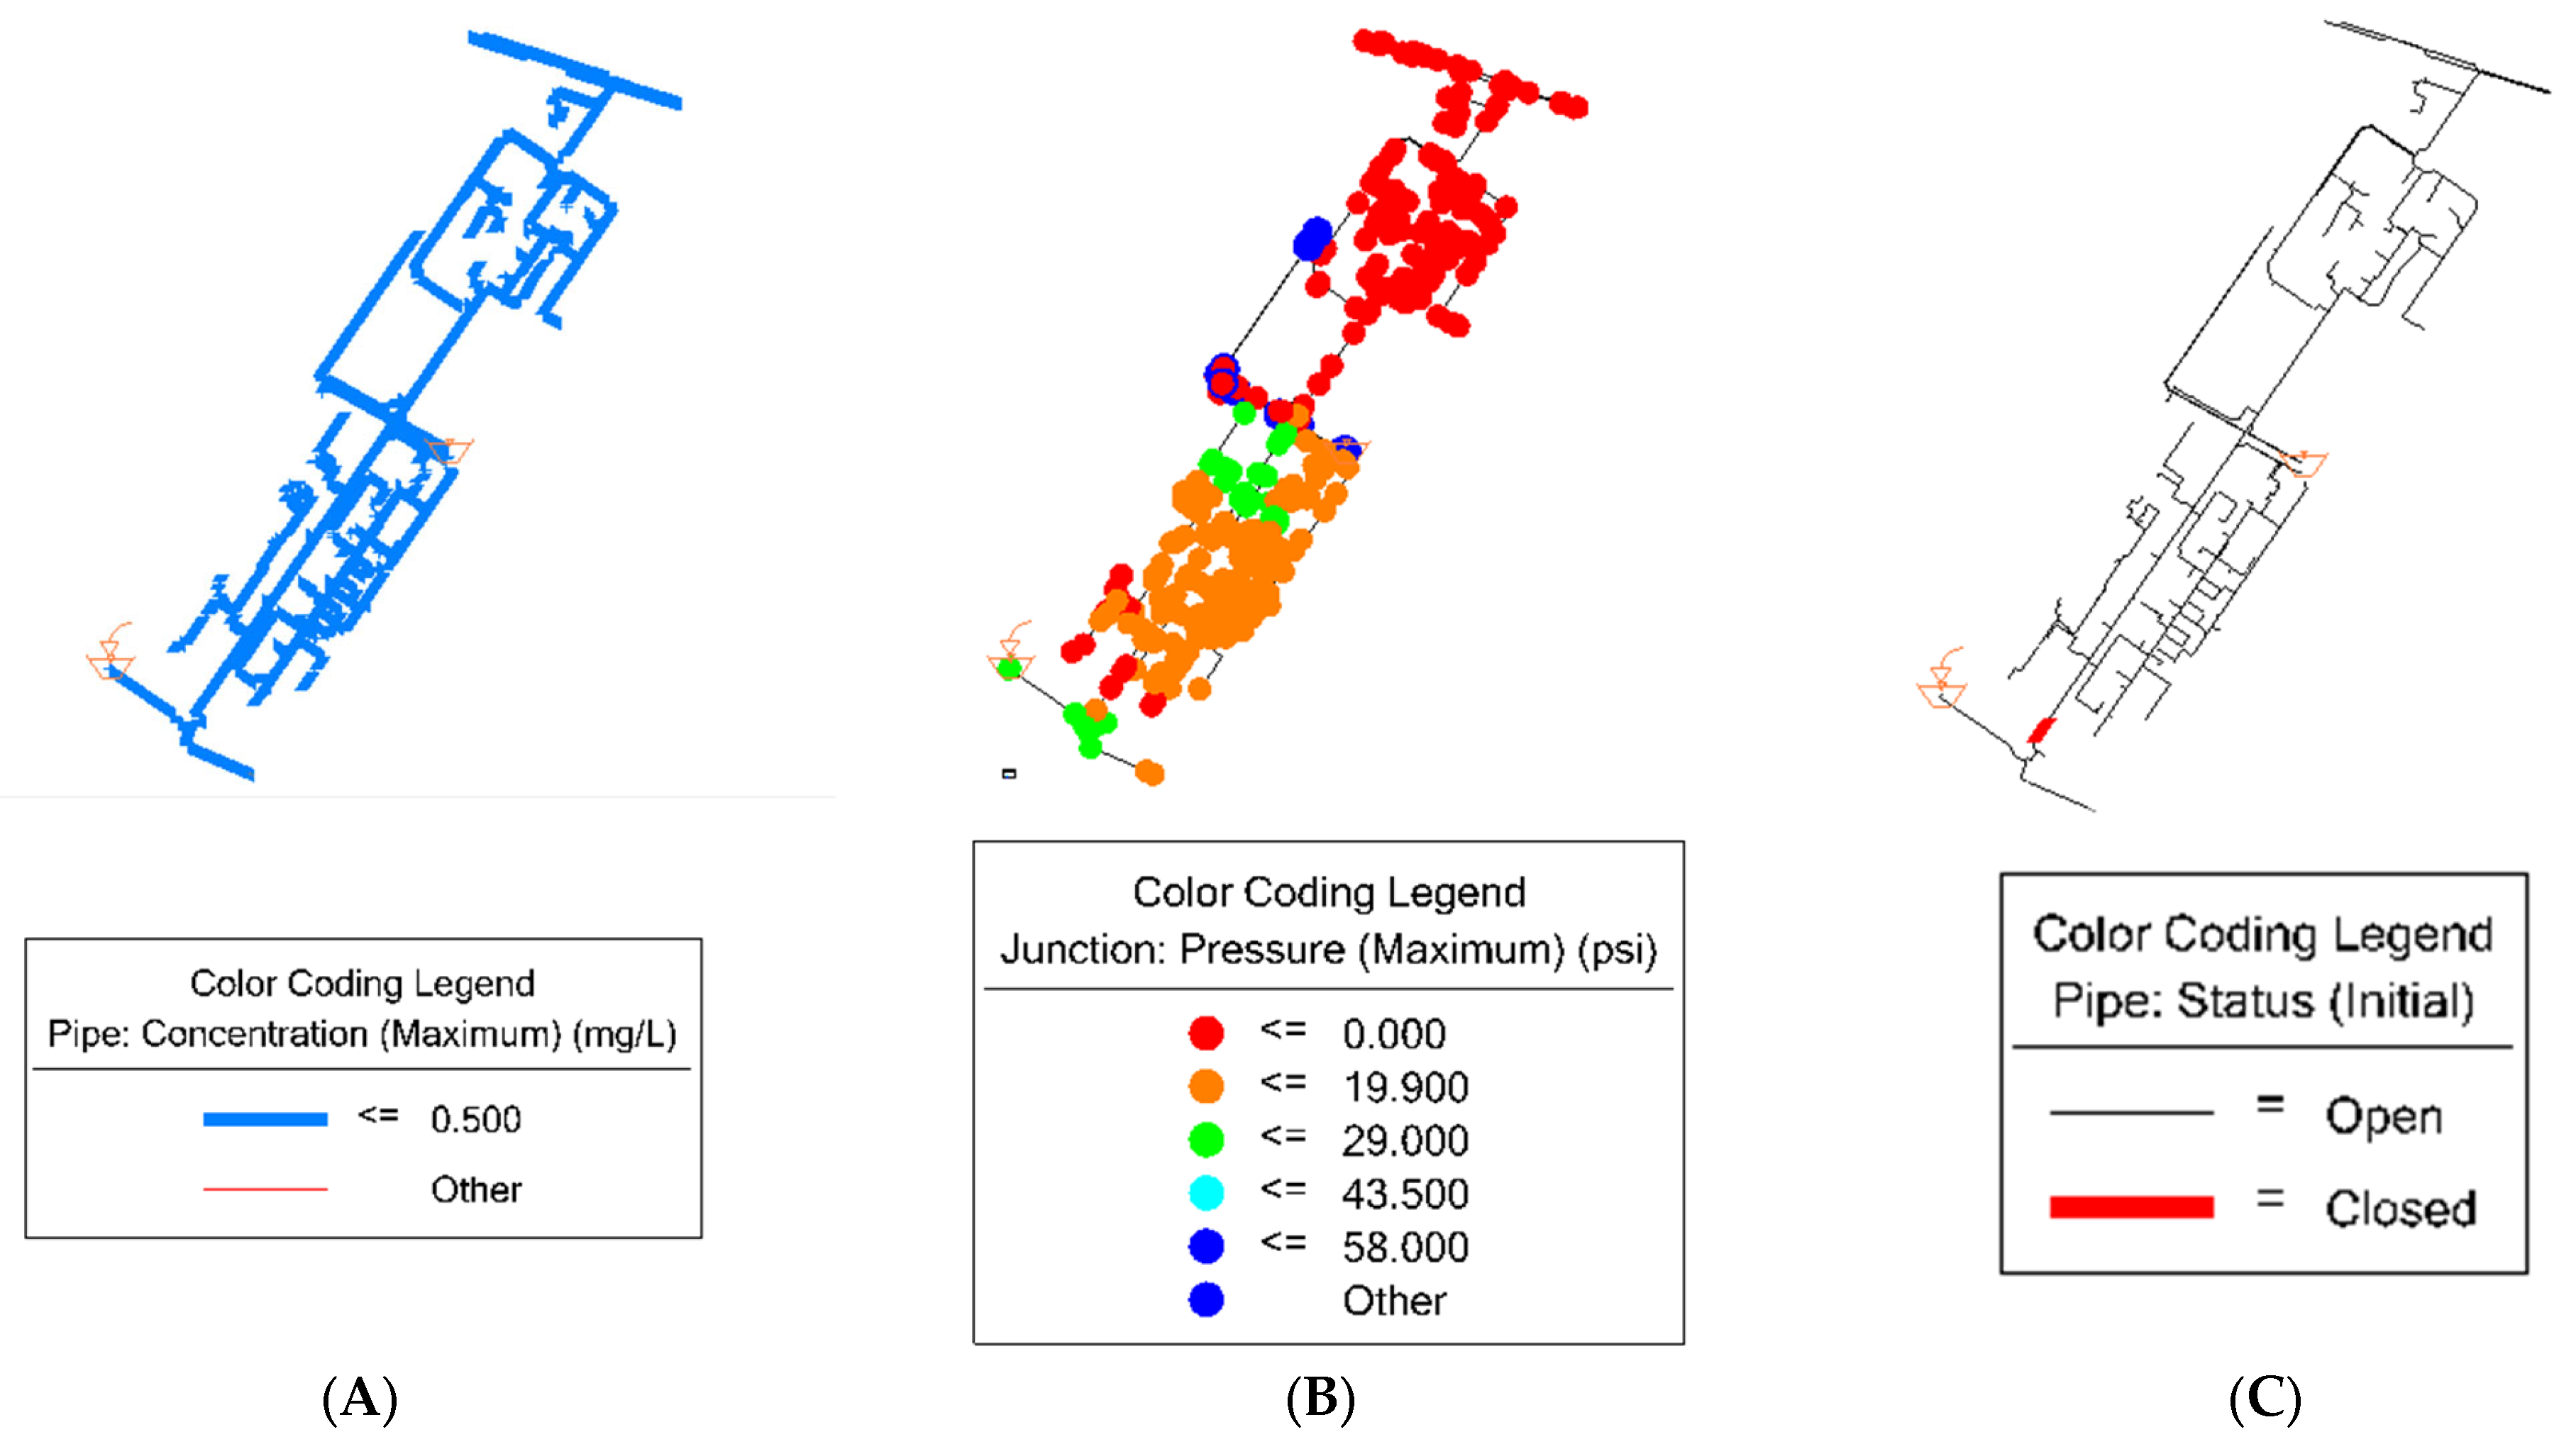
- For RI 60%: the lowest score was for water contamination with 18; hence, it is recommended to ensure that the chlorine concentration in the pipes colored in blue color, as shown in Figure 5A, meets the water quality regulations in the UAE and it is between 0.5 mg/L and 5 mg/L. Additionally, for the water excess demand with a 43 score, it is recommended to ensure that the junctions with the color red and orange, as shown in Figure 5B, are maintaining the acceptable water pressure, which is between 20 psi and 60 psi. Lastly, for the pipe failure, it is recommended to ensure that twelve pipes colored in red, as shown in Figure 5C, do not fail, and if, in case of failing, a prompt recovery response is needed to reduce the number of impacted nodes;
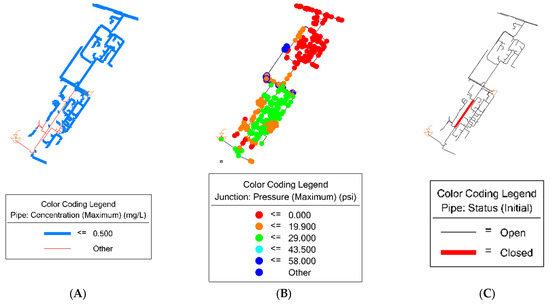 Figure 5. Management plan for RI 60%: (A) contamination; (B) Pressure level; and (C) pipe failure.
 - (iv)
- For RI 80%: the lowest score was for water contamination with 4; hence, it is recommended to ensure that the chlorine concentration in the pipes colored in blue, as shown in Figure 6A, meets the water quality regulations in the UAE, and it is between 0.5 mg/L and 5 mg/L. Additionally, for the water excess demand with a 4 score, it is recommended to ensure that the junctions with the color red and orange, as shown in Figure 6B, are maintaining the acceptable water pressure, which is between 20 psi and 60 psi. Lastly, for the pipe failure, it is recommended to ensure that two pipes, which are colored in red as shown in Figure 6C, do not fail, and if, in case of failing, a prompt recovery response is needed to reduce the number of impacted nodes;
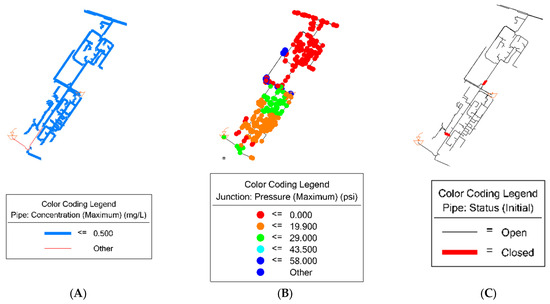 Figure 6. Management plan for RI 80%: (A) contamination; (B) pressure level; and (C) pipe failure.
- (v)
- For RI 99%: the lowest score was for the water contamination with 0; hence, it is recommended to ensure that the chlorine concentration in the pipes colored in blue, as shown in Figure 7A, meets the water quality regulations in the UAE and it is between 0.5 mg/L and 5 mg/L. Additionally, for the water excess demand with a 4 score, it is recommended to ensure that the junctions with the color red and orange, as shown in Figure 7B, are maintaining the acceptable water pressure, which is between 20 psi and 60 psi. Lastly, for the pipe failure, it is recommended to ensure that one pipe colored in red as shown in Figure 7C does not fail, and, if in case of failing, a prompt recovery response is needed to reduce the number of impacted nodes.
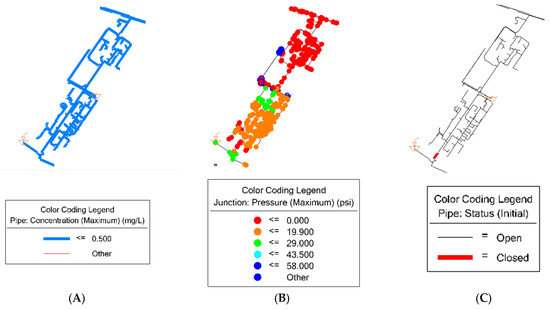 Figure 7. Management plan for RI 99%: (A) contamination; (B) pressure level; and (C) pipe failure.
3.6. Solution
A proposed solution for the excess demand failure is to augment network capacity by expanding overhead storage tanks or enhancing the pumping station to address water shortages in certain locations, hence alleviating water pressure issues and ensuring that pressure remains below acceptable limits. Another recommendation is to replace the old pipes and install new ones or to execute network expansion to enhance resilience by decreasing the number of affected nodes during pipe failures. To ensure water quality, it is advised to uphold a minimum positive pressure of 20 psi, maintain a chlorine content of at least 0.5 mg/L to ensure pipe cleanliness and conduct frequent water quality tests by sample collection.
This proposed approach will enhance the resilience of the water distribution system. Establishing a robust network may necessitate considerable expenditure without a commensurate return on investment. Embracing a resilient strategy presents a significant opportunity to minimize both capital and total lifecycle expenses. Achieving a high resilience index not only mitigates losses during disasters but also diminishes the likelihood of environmental damage or contamination. The objective of these investigations is to obtain a comprehensive understanding of all possible hazards, impacts, and repercussions.
4. Conclusions
This study aims to evaluate the resilience of the Waterborne Network (WDN) using the GRA methodology and formulate a resilience index. The goal is to provide utility managers with a decision-support tool for assessing infrastructure performance and enhancing management efficiency, by using a hydraulic model of the current WDN.
A hydraulic model is utilized to implement the proposed methodology, which is the Global Resilience analysis. The strategy employed to evaluate the system’s resilience is the quantitative evaluation method. It is a performance-oriented analysis that implements failure scenarios on a hydraulic model and denotes the resultant performance degradation in the system. For illustration, multiple failure scenarios are simulated within hydraulic software, which assesses the system’s performance under extreme failure conditions. A computer simulation of hydraulic analysis (water CAD) is employed to enable the simulation of failure scenarios for the system’s crucial components. The failure scenarios encompass pipe rupture, excessive water consumption, and water contamination. Consequently, the data are utilized to develop the resilience index. The resilience index was developed based on two factors: the system’s performance loss score and a survey study. A survey-based study is performed to ascertain the coefficient weights that signify the relative importance of each indicator and the recovery time necessary to restore the system from the implemented failure scenarios, rated on a scale from 0 to 100. The established resilience index yields a score ranging from 0 to 100, reflecting the system’s performance under failure scenarios: a score of 0 indicates a lack of resilience, while a score of 100 signifies that the system is resilient and able to endure disasters. The resilience index results for the current system demonstrate that a WDN experiencing up to 40% stress is classified as low resilience, while a system under 60% stress is classified as extremely low resilience. Upon the establishment of the resilience index across five stress categories—1–20%, 21–40%, 41–60%, 61–80%, and 81–100%—the findings reveal that the system is classified as exhibiting low resilience for the initial two stress levels and very low resilience for the subsequent three, with scores of 58.0, 51.0, 44.0, 33.52, and 22.46, respectively.
This established resilience indicator has certain drawbacks. Initially, the hydraulic model data, including demands and pressure, must be current. The hydraulic model’s low water pressure must be current, as it significantly influences the three indications in the resilience score. Owing to software constraints, the hydraulic model encountered pipe testing limits during pipe failure scenarios, complicating the analysis of certain pipe combinations’ effects on the system. Consequently, it is advisable to utilize alternative software, such as EPANET, in addition to WaterCAD for result validation. Subsequent to the formulation of the RI and the management plan, future research should focus on enhancing the resilience of the WDN by examining innovative rehabilitation methods that take into account cost, time, and quality. In the event of a system interruption, the quality of the materials utilized might be further investigated with regard to time and cost considerations.
A future study may be conducted that integrates social and economic variables into the resilience index. The social indicator evaluates the community’s preparedness to handle catastrophic events and the interruption of water services. Heightened preparedness is associated with improved resilience. The economic indicator signifies the economy’s ability to handle catastrophic occurrences and to recuperate and reorganize the system. It evaluates the ability of utility management to acquire the requisite resources and skills to recover from the incident and restore the system to its initial condition.
Author Contributions
Conceptualization, A.I., M.H.R., M.M., S.A. and T.A.; methodology, A.I. and M.M.; software, A.I.; validation, A.I., M.H.R. and M.M.; formal analysis, A.I. and M.M.; investigation, A.I. and M.M.; resources, A.I., M.M. and T.A.; data curation, A.I., M.H.R. and S.A.; writing—original draft preparation, A.I., M.H.R., M.M. and S.A.; writing—review and editing, M.H.R. and S.A.; visualization, M.H.R., S.A. and T.A.; supervision, M.M. All authors have read and agreed to the published version of the manuscript.
Funding
This research was funded by the American University of Sharjah, FRG22-C-E15 and FRG24-C-E59.
Institutional Review Board Statement
The surveys in this study were conducted in accordance with the Declaration of Helsinki, and approved by the Institutional Review Board (or Ethics Committee) of the American University of Sharjah (protocol code 23-019 and 3 October 2022).
Informed Consent Statement
Informed consent was obtained from all subjects involved in the study.
Data Availability Statement
The data presented in this study are available on request from the corresponding author due to the restricted use of University City WDN.
Acknowledgments
The authors acknowledge the help and support of the Sharjah Electricity and Water Authority (SEWA) for providing the WDN of the University City. The authors also acknowledge all the participants of the survey.
Conflicts of Interest
The authors declare no conflicts of interest.
Correction Statement
This article has been republished with a minor correction to the existing affiliation information. This change does not affect the scientific content of the article.
References
- Butler, D.; Ward, S.; Sweetapple, C.; Astaraie-Imani, M.; Diao, K.; Farmani, R.; Fu, G. Reliable, Resilient and Sustainable Water Management: The Safe & SuRe Approach. Glob. Chall. 2017, 1, 63–77. [Google Scholar] [CrossRef] [PubMed]
- Szabo, S. The Water Challenge in the UAE. 2011. Available online: https://eprints.soton.ac.uk/376548/1/DSG%2520Policy%2520Brief%252029%2520English.pdf (accessed on 3 October 2024).
- Benhammam, K.; AlHosani, K.A. Geological Hazards and Their Effect on Infrastructure. In Proceedings of the Sixth International Conference on Engineering Geophysics, Virtual, 25–28 October 2021; SEG Global Meeting Abstracts; Society of Exploration Geophysicists: Houston, TX, USA, 2021; pp. 328–331. [Google Scholar]
- Farahmandfar, Z.; Piratla, K.R.; Andrus, R.D. Resilience Evaluation of Water Supply Networks against Seismic Hazards. J. Pipeline Syst. Eng. Pract. 2017, 8, 04016014. [Google Scholar] [CrossRef]
- Mazumder, R.K.; Salman, A.M.; Li, Y.; Yu, X. Seismic Functionality and Resilience Analysis of Water Distribution Systems. J. Pipeline Syst. Eng. Pract. 2020, 11, 04019045. [Google Scholar] [CrossRef]
- Liu, W.; Song, Z. Review of Studies on the Resilience of Urban Critical Infrastructure Networks. Reliab. Eng. Syst. Saf. 2020, 193, 106617. [Google Scholar] [CrossRef]
- Mortula, M.M.; Ahmad, I.U.; Sadiq, R.; Beheiry, S. A Conceptual Unified Model for Assessing Improvements in Sustainability and Resilience in Water Distribution Systems. In Handbook of Disaster Risk Reduction for Resilience; Eslamian, S., Eslamian, F., Eds.; Springer International Publishing: Cham, Germany, 2021; pp. 341–359. ISBN 978-3-030-61277-1. [Google Scholar]
- Perelman, L.; Ostfeld, A. Topological Clustering for Water Distribution Systems Analysis. Environ. Model. Softw. 2011, 26, 969–972. [Google Scholar] [CrossRef]
- Mazumder, R.K.; Salman, A.M.; Li, Y.; Yu, X. Performance Evaluation of Water Distribution Systems and Asset Management. J. Infrastruct. Syst. 2018, 24, 03118001. [Google Scholar] [CrossRef]
- Mortula, M.M.; Ali, T.A.; Sadiq, R.; Idris, A.; Al Mulla, A. Impacts of Water Quality on the Spatiotemporal Susceptibility of Water Distribution Systems. CLEAN—Soil Air Water 2019, 47, 1800247. [Google Scholar] [CrossRef]
- Piazza, S.; Sambito, M.; Freni, G. Analysis of Optimal Sensor Placement in Looped Water Distribution Networks Using Different Water Quality Models. Water 2023, 15, 559. [Google Scholar] [CrossRef]
- Piazza, S.; Sambito, M.; Freni, G. A Novel EPANET Integration for the Diffusive–Dispersive Transport of Contaminants. Water 2022, 14, 2707. [Google Scholar] [CrossRef]
- Hosseini, S.; Barker, K.; Ramirez-Marquez, J.E. A Review of Definitions and Measures of System Resilience. Reliab. Eng. Syst. Saf. 2016, 145, 47–61. [Google Scholar] [CrossRef]
- Yu, H.; Zahidi, I. Tailings Pond Classification Based on Satellite Images and Machine Learning: An Exploration of Microsoft ML. Net. Mathematics 2023, 11, 517. [Google Scholar] [CrossRef]
- Zhang, C.; Xu, B.; Li, Y.; Fu, G. Exploring the Relationships among Reliability, Resilience, and Vulnerability of Water Supply Using Many-Objective Analysis. J. Water Resour. Plan. Manag. 2017, 143, 04017044. [Google Scholar] [CrossRef]
- Ostfeld, A. Reliability Analysis of Water Distribution Systems. J. Hydroinform. 2004, 6, 281–294. [Google Scholar] [CrossRef]
- Kahan, J.H.; Allen, A.C.; George, J.K. An Operational Framework for Resilience. J. Homel. Secur. Emerg. Manag. 2009, 6, 51. [Google Scholar] [CrossRef]
- Callo-Concha, D.; Ewert, F. Using the Concepts of Resilience, Vulnerability and Adaptability for the Assessment and Analysis of Agricultural Systems. Change Adapt. Socio-Ecol. Syst. Clim. Change Soc. Chang. Technol. Dev. 2014, 1, 1–11. [Google Scholar] [CrossRef]
- Yazdani, A.; Otoo, R.A.; Jeffrey, P. Resilience Enhancing Expansion Strategies for Water Distribution Systems: A Network Theory Approach. Environ. Model. Softw. 2011, 26, 1574–1582. [Google Scholar] [CrossRef]
- Yu, H.; Zahidi, I.; Fai, C.M.; Liang, D.; Madsen, D.Ø. Elevating Community Well-Being in Mining Areas: The Proposal of the Mining Area Sustainability Index (MASI). Environ. Sci. Eur. 2024, 36, 71. [Google Scholar] [CrossRef]
- Rokstad, E.G.; Makropoulos, C.; Rokstad, M.M. Resilience Assessment of Water Distribution Networks Exposed to Substance Intrusion. Urban Water J. 2023, 20, 1110–1122. [Google Scholar] [CrossRef]
- Mortula, M.M.; Ahmed, M.A.; Sadri, A.M.; Ali, T.; Ahmad, I.; Idris, A. Improving Resiliency of Water Supply System in Arid Regions: Integrating Centrality and Hydraulic Vulnerability. J. Manag. Eng. 2020, 36, 05020011. [Google Scholar] [CrossRef]
- Murray, S. The Critical Role of Infrastructure for the Sustainable Development Goals; The Economist Intelligence Unit: London, UK, 2019. [Google Scholar]
- Diao, K.; Sweetapple, C.; Farmani, R.; Fu, G.; Ward, S.; Butler, D. Global Resilience Analysis of Water Distribution Systems. Water Res. 2016, 106, 383–393. [Google Scholar] [CrossRef]
- Carneiro, J.; Loureiro, D.; Cabral, M.; Covas, D. Comprehensive Resilience Assessment Framework for Water Distribution Networks. Water 2024, 16, 2611. [Google Scholar] [CrossRef]
- Pagano, A.; Sweetapple, C.; Farmani, R.; Giordano, R.; Butler, D. Water Distribution Networks Resilience Analysis: A Comparison between Graph Theory-Based Approaches and Global Resilience Analysis. Water Resour. Manag. 2019, 33, 2925–2940. [Google Scholar] [CrossRef]
- Aydin, N.Y. Measuring Topological and Operational Resilience and Recovery of Water Networks for Planning and Management. In Proceedings of the World Environmental and Water Resources Congress 2018, Minneapolis, MN, USA, 3–7 June 2018; pp. 370–379. [Google Scholar] [CrossRef]
- Sweetapple, C.; Diao, K.; Farmani, R.; Fu, G.; Butler, D. A Tool for Global Resilience Analysis of Water Distribution Systems. In Proceedings of the 1st International WDSA/CCWI 2018 Joint Conference, Kingston, ON, Canada, 23–25 July 2018. [Google Scholar]
- Mugume, S.N.; Gomez, D.E.; Fu, G.; Farmani, R.; Butler, D. A Global Analysis Approach for Investigating Structural Resilience in Urban Drainage Systems. Water Res. 2015, 81, 15–26. [Google Scholar] [CrossRef]
- Meng, F.; Fu, G.; Farmani, R.; Sweetapple, C.; Butler, D. Topological Attributes of Network Resilience: A Study in Water Distribution Systems. Water Res. 2018, 143, 376–386. [Google Scholar] [CrossRef]
- Ismail, A.; Mortula, M.; Atabay, S. Improving Resilience in Water Distribution System. In Recent Advances in Environmental Science from the Euro-Mediterranean and Surrounding Regions, 4th ed.; Ksibi, M., Sousa, A., Hentati, O., Chenchouni, H., Lopes Velho, J., Negm, A., Rodrigo-Comino, J., Hadji, R., Chakraborty, S., Ghorbal, A., Eds.; Springer Nature: Cham, Switzerland, 2024; pp. 745–747. [Google Scholar]
- Abdalla, J.A.; Al-Homoud, A. Earthquake Hazard Zonation of Eastern Arabia. In Proceedings of the 13th World Congress on Earthquake Engineering, Vancouver, BC, Canada, 1–6 August 2004. [Google Scholar]
- Yagoub, M.M. Spatio-Temporal and Hazard Mapping of Earthquake in UAE (1984–2012): Remote Sensing and GIS Application. Geoenviron. Disasters 2015, 2, 13. [Google Scholar] [CrossRef]
- Al-Dogom, D.; Al-Ruzouq, R.; Kalantar, B.; Schuckman, K.; Al-Mansoori, S.; Mukherjee, S.; Al-Ahmad, H.; Ueda, N. Geospatial Multicriteria Analysis for Earthquake Risk Assessment: Case Study of Fujairah City in the UAE. J. Sens. 2021, 2021, 6638316. [Google Scholar] [CrossRef]
- Salam, A. Climate Change: The Challenges for Public Health and Environmental Effects in UAE. In WIT Transactions on Ecology and the Environment; WIT Press: Southampton, UK, 2015; Volume 193, pp. 457–466. [Google Scholar]
- Howard, G.; Calow, R.; Macdonald, A.; Bartram, J. Climate Change and Water and Sanitation: Likely Impacts and Emerging Trends for Action. Annu. Rev. Environ. Resour. 2016, 41, 253–276. [Google Scholar] [CrossRef]
- Duran-Encalada, J.A.; Paucar-Caceres, A.; Bandala, E.R.; Wright, G.H. The Impact of Global Climate Change on Water Quantity and Quality: A System Dynamics Approach to the US–Mexican Transborder Region. Eur. J. Oper. Res. 2017, 256, 567–581. [Google Scholar] [CrossRef]
- Field, C.B.; Barros, V.R. Climate Change 2014–Impacts, Adaptation and Vulnerability: Regional Aspects; Cambridge University Press: Cambridge, UK, 2014. [Google Scholar]
- Amarasinghe, P.; Liu, A.; Egodawatta, P.; Barnes, P.; McGree, J.; Goonetilleke, A. Quantitative Assessment of Resilience of a Water Supply System under Rainfall Reduction Due to Climate Change. J. Hydrol. 2016, 540, 1043–1052. [Google Scholar] [CrossRef]
- Tradeline Supply Company, LLC. FICO Resilience Index: Should You Be Worried? [Infographic]. Available online: https://tradelinesupply.com/fico-resilience-index-infographic/ (accessed on 14 September 2024).
- Ulusoy, A.-J.; Stoianov, I.; Chazerain, A. Hydraulically Informed Graph Theoretic Measure of Link Criticality for the Resilience Analysis of Water Distribution Networks. Appl. Netw. Sci. 2018, 3, 31. [Google Scholar] [CrossRef]
- Marlim, M.S.; Jeong, G.; Kang, D. Identification of Critical Pipes Using a Criticality Index in Water Distribution Networks. Appl. Sci. 2019, 9, 4052. [Google Scholar] [CrossRef]
- Water Quality Regulations, DEAW Authority. 2019. Available online: https://www.doe.gov.ae/-/media/Project/DOE/Department-Of-Energy/Media-Center-Publications/Regulations/English/Water-Quality-Regulations-2021-Edition-5.pdf (accessed on 3 October 2024).
- Government of Abu Dhabi. Guide to Water Supply Regulations Issue 3; Government of Abu Dhabi: Abu Dhabi, United Arab Emirates, 2017. [Google Scholar]
- Saaty, T.L. Decision Making with the Analytic Hierarchy Process. Int. J. Serv. Sci. 2008, 1, 83–98. [Google Scholar] [CrossRef]
- Aşchilean, I.; Badea, G.; Giurca, I.; Naghiu, G.S.; Iloaie, F.G. Choosing the Optimal Technology to Rehabilitate the Pipes in Water Distribution Systems Using the AHP Method. Energy Procedia 2017, 112, 19–26. [Google Scholar] [CrossRef]
- Arof, A. The Application of a Combined Delphi-AHP Method in Maritime Transport Research-A Review. Asian Soc. Sci. 2024, 11, 73. [Google Scholar] [CrossRef]


Disclaimer/Publisher’s Note: The statements, opinions and data contained in all publications are solely those of the individual author(s) and contributor(s) and not of MDPI and/or the editor(s). MDPI and/or the editor(s) disclaim responsibility for any injury to people or property resulting from any ideas, methods, instructions or products referred to in the content. |
© 2025 by the authors. Licensee MDPI, Basel, Switzerland. This article is an open access article distributed under the terms and conditions of the Creative Commons Attribution (CC BY) license (https://creativecommons.org/licenses/by/4.0/).