Abstract
The linear “take–make–dispose” model of plastic consumption has led to significant environmental challenges and unplanned waste legacies, emphasising the need for more sustainable recycling practices. This study explored the integration of post-consumer recycled polylactic acid (rPLA) into 3D printing filaments as a step towards sustainable manufacturing. Using 100% virgin PLA (vPLA) as the baseline, filaments were produced with rPLA-to-vPLA ratios of 0%, 25%, 50%, 75%, and 100% and evaluated for surface roughness, tensile strength, flexural properties, and hardness. The results revealed that increasing the rPLA content negatively affects the mechanical properties and surface quality. Surface roughness increased from 7.06 µm for pure vPLA to 10.50 µm for 100% rPLA, whilst the tensile and flexural strengths of 100% rPLA decreased by 48.4% and 49%, respectively, compared to vPLA. Hardness also declined, with 100% rPLA showing a 7.5% reduction relative to vPLA. Despite these reductions, the blends with up to 50% rPLA retained over 90% of the mechanical performance of pure vPLA, demonstrating a viable compromise between performance and sustainability. Morphological analysis highlighted poor interlayer adhesion and void formation as the primary causes of performance degradation in higher rPLA blends. Despite these challenges, this study demonstrated that rPLA-vPLA blends can extend the life cycle of PLA and promote sustainable manufacturing practices. By addressing polymer degradation challenges, this research supports the integration of recycled materials in 3D printing, contributing to the circular economy goals of recycling, resource efficiency, and sustainable manufacturing production outcomes.
1. Introduction
The global generation of solid waste, including materials such as plastics, food waste, tires, animal waste, and wood biomass, is increasing rapidly [1,2]. Among these, plastic waste poses a significant challenge due to its large-scale production, inadequate landfill disposal, and inefficient recycling systems, leading to a severe environmental burden and resulting consequences [2,3,4,5]. Over the past six decades, the majority of plastics produced have been non-biodegradable, persist in the environment for decades, and contribute to a growing waste crisis [6,7]. Alarmingly, around 79% of plastic waste accumulates in oceans, landfills, and natural habitats, contributing to microplastic pollution in marine ecosystems, which is subsequently ingested by both humans and animals [3,8,9,10,11].
To address these challenges, plastic waste reuse and recycling offer significant opportunities for waste valorisation—transforming discarded materials into valuable resources [10,12]. By integrating recycling technologies into manufacturing, the lifecycle of plastics can be extended, reducing their environmental footprint and fostering a circular economy [9,13]. These practices not only alleviate waste management challenges but also contribute to reducing global CO2 emissions, with the manufacturing sector accounting for 25% of the total emissions [14,15].
One innovative advancement in recycling polymers involves integrating additive manufacturing (AM), commonly known as 3D printing, into waste management systems [16]. By utilising AM, it is possible to shift from traditional linear economic models to more sustainable circular models by transforming plastic waste into functional materials [9,17,18]. Incorporating recycled plastics into 3D printing provides substantial environmental benefits, including waste reduction and lower energy consumption. Additionally, recycling and reprocessing plastics can significantly reduce carbon emissions by 30–80% compared to the production of virgin plastics [19]. Studies have suggested that waste plastics can be processed into flakes and then hot-extruded to create filaments suitable for 3D printing, often with qualities similar to those of new materials [20,21]. Despite growing public awareness of the importance of recycling polymers, knowledge of specific recycling methods, such as AM, remains limited [22,23].
AM, widely known as 3D printing, creates three-dimensional objects layer-by-layer, enabling the production of intricate geometries with high accuracy and adaptability [24,25,26,27,28]. One of the most compelling aspects of AM is its ability to repurpose waste plastics and biomass, which aligns with several sustainable development goals [3]. Furthermore, AM plays a pivotal role in advancing the circular economy by facilitating the direct reuse of waste materials as inputs, thereby promoting closed-loop material circulation [29,30]. Recycling within AM processes enhances its sustainable benefits by converting waste into functional feedstocks, such as filaments or pellets, which are used in material extrusion techniques, such as fused deposition modelling (FDM) [20,31,32]. FDM exemplifies the potential of AM using melted thermoplastics to fabricate objects with minimal material waste and energy consumption [23,33,34]. This synergy positions AM as a key enabler of resource efficiency and circular economic models [35].
Among the thermoplastics used in 3D printing, polylactic acid (PLA) has gained prominence because of its favourable properties including biodegradability, ease of processing, and mechanical strength [35,36,37]. PLA is derived from renewable resources, such as corn and sugarcane, making it an environmentally friendly option that supports sustainability objectives. It also offers advantages such as relatively low melting point and strong layer adhesion [26,38,39,40]. Key properties, including 1.24 g/cm3 density, 55 °C glass transition temperature (Tg), and 180 °C melting temperature (Tm), make it versatile for various applications [23]. Despite comprising only 0.5% of the global plastic production, the growing demand for PLA is expected to drive its market growth to 7.43 million tons by 2028 [41,42]. Common applications of PLA include rigid packaging, beverage cups, bottles, injection-molded products, and extrusion coatings [43].
While PLA is a leading material for sustainable 3D printing, the recycling potential of thermoplastics like PETG and ABS has also been explored [44,45,46,47]. Studies have shown that recycled PETG (rPETG) offers superior impact resistance and chemical durability, while recycled ABS (rABS) provides toughness and heat resistance [44,47]. However, the recycling of ABS is challenged by material degradation over multiple extrusion cycles, as well as the release of volatile organic compounds (VOCs) and ultrafine particles (UFPs), which present potential health risks [44,48]. Additionally, both rPETG and rABS exhibit lower mechanical properties compared to PLA. Despite these alternatives, PLA remains preferable due to its biodegradability, lower emissions, and reduced health risks during processing.
PLA is designed for end-of-life management through industrial composting; however, it degrades relatively slowly under ambient conditions, taking between 2 and 10 months in dry environments [49,50,51]. This slow degradation raises concerns about its potential to contribute to environmental pollution if not disposed of correctly [51,52,53]. An effective alternative for managing PLA waste is recycling it into 3D printing filaments, which offers significant environmental benefits by reducing reliance on landfills and lowering CO2 emissions from waste transportation [54,55].
Life cycle assessment (LCA) studies have revealed that the production of PLA in granule form, followed by grinding and drying, accounts for 63% of its total production of greenhouse gas emissions, which is higher than the emissions associated with the production of amorphous polyethylene terephthalate (PET) at 53% and polypropylene (PP) at 44% [56,57]. However, distributed recycling systems can substantially reduce these impacts by conserving over 80% of the embodied energy required for collection and transport [58,59]. Studies show that recycling of PLA can achieve greenhouse gas (GHG) savings of 0.3–1.2 times greater than incineration [52]. Localised recycling and manufacturing have been shown to reduce energy consumption compared to traditional production methods [60,61], whereas domestic production of rPLA filaments can reduce energy use by a factor of 40 relative to commercial filament production [55,61]. Furthermore, the economic viability of rPLA is evident from cost comparisons, which indicate a 46% reduction in price relative to vPLA [52,62].
Despite these advantages, the limited thermal stability of PLA and inefficient recycling processes remain significant challenges for its widespread adoption in sustainable manufacturing [40,63]. During processing, PLA is prone to thermomechanical degradation, with high temperatures triggering main-chain scission reactions that degrade molecular weight and alter the properties of 3D-printed objects [64,65,66]. Nevertheless, advancements in recycling technologies have significantly improved the performance of rPLA, enabling it to achieve mechanical properties comparable to, or even exceeding, those of vPLA. These developments highlight the potential of rPLA to help achieve greener and more circular production systems [40,63].
The recycling of PLA for 3D printing applications has been extensively studied, with various researchers examining its potential and the effects of multiple recycling cycles on the material’s properties. Initial research has focused on the reprocessing of PLA waste for various applications. For instance, Alexandre et al. [67] examined fused granular fabrication by shredding PLA waste into pellets, which resulted in significant dimensional errors in printed parts. Similarly, Kantaros et al. [68] assessed the feasibility of using rPLA to create tactile replicas of ancient artifacts, providing a sustainable solution for visitors with disabilities. Additionally, Aguero et al. [69] examined the repurposing of PLA waste into films for food packaging, presenting an alternative recycling application.
A key concern in PLA recycling for 3D printing is the degradation of its mechanical properties after multiple recycling cycles. Several studies have explored the recycling effect of PLA waste in 3D printing after multiple recycling stages and observed a decrease in tensile strength. For example, Anderson [70] noted an 11% decrease in the tensile yield strength and a 5% decrease in the tensile modulus after one cycle. This trend was further confirmed by Zhao et al. [71], who identified the viscosity reduction as a limiting factor for PLA reprocessing beyond two cycles. Lanzotti et al. [72] also reported a reduction in short-beam strength due to repeated heating cycles. Consequently, Ong et al. [73] recommended limiting PLA recycling to a single cycle in order to preserve its mechanical properties.
However, other studies have suggested that PLA can withstand more than one recycling cycle, with relatively minor degradation. Cruz Sanchez et al. [74] reported a slight reduction in tensile properties after five cycles, while Cruz Sanchez et al. [75] observed more significant degradation after the third cycle. Hidalgo-Carvajal et al. [76] found that PLA can withstand up to three re-extrusion cycles without significant mechanical degradation, offering a somewhat more optimistic view of PLA’s recyclability. In contrast, Romani et al. [35] observed a 16.4% decline in tensile properties after the fifth cycle, reinforcing concerns regarding the feasibility of extended recycling. These studies collectively indicate that repeated recycling may not be an ideal strategy because of the cumulative material degradation.
Despite advancements in recycling techniques, the mechanical properties of rPLA remain highly sensitive to processing conditions and waste quality, limiting its widespread adoption in FDM applications [76,77]. To improve the mechanical properties of rPLA, studies have explored the use of additives, plasticisers, and fibre reinforcements [78]. Carné Sánchez et al. [79] investigated chemical recycling using methanol or ethanol with zinc acetate as a catalyst, but this approach proved to be environmentally unfriendly and time-intensive [80]. An alternative method by Cisneros-López et al. [81] used Joncryl ADR4368 as a chain extender to reduce thermal degradation, stabilising melt flow index (MFI) and enhancing rheological properties. However, it negatively affected the tensile and flexural strengths. Plasticisers, such as glycerol, sorbitol, polyethylene glycol, citric acid, and tartaric acid, have been used to modify PLA, but their effectiveness in reprocessing is limited [82]. They contribute to molecular weight reduction and lower impact strength owing to poor dispersion and migration to the surface of the material [78,83,84]. Similarly, fibre reinforcement can alter PLA properties, with coir fibres reducing the flexural strength by over 50% while maintaining the flexural modulus [78,85]. Tanase et al. [86] observed that annealing slightly enhanced the tensile strength and stiffness but reduced the flexibility, as indicated by the lower elongation at break.
To address these challenges, Pakkanen et al. [87] advised that additives may hinder further recyclability and suggested blending virgin PLA (vPLA) with rPLA to balance mechanical performance and environmental benefits. In this case, Kantaros et al. [88] successfully printed blended PLA personal protective equipment (PPE) during the COVID-19 pandemic to address shortages. Additionally, Wei et al. [80] and Hasan et al. [16] demonstrated that blending rPLA and vPLA improved mechanical properties by 14–18%, underscoring the potential of strategic blending to optimise performance.
Recent studies have examined the potential of blending rPLA with vPLA to produce high-quality blended filaments. Babagowda et al. [89] found that increasing the rPLA content in a blend reduced the tensile strength by 11.64%. Similarly, Sasse et al. [90] reported a 17% decrease in tensile strength as the rPLA content increased, accompanied by a reduction in the mass of the tensile testing specimens. Tanney et al. [91] also observed similar trends, reinforcing concerns about reduced mechanical performance with higher rPLA content. However, Bergaliyeva et al. [62] and Aly et al. [92] presented a contrasting view, observing improved tensile strength with higher rPLA content in blends, challenging the prevailing narrative and highlighting the need for further investigation. These conflicting results highlight the need for further investigation into the blending characteristics of rPLA and vPLA, the influence of the FDM process parameters, and interlayer bonding in printed recycled parts. Exploring these areas is crucial to improve the application of rPLA in 3D printing.
In conclusion, the hybrid blending of vPLA and rPLA could potentially offer a promising solution for balancing material performance and sustainability. This strategy optimises the mechanical properties while reducing the environmental impact, thereby enabling the broader adoption of recycled materials in FDM applications. While previous studies have focused on industrial and 3D-printed PLA waste, this study is unique in its approach by utilising household post-consumer PLA waste as a feedstock for 3D printing filaments. The recycling of household PLA waste remains largely unexplored, yet it is critical for promoting localised circular economies and sustainable waste management. Given the increasing domestic use of PLA-based products, addressing household waste recycling is essential for the growing sustainability movement. The majority of PLA wastes in Australia end up in landfills, which emphasises the need for proper waste management and recycling infrastructure [93]. Upscaling post-consumer PLA to filaments for 3D printing can address this challenge, specifically for Australia. To date, there has been no study in Australia specifically dealing with the use of rPLA for manufacturing high-value mechanical parts. This study aimed to assess the feasibility of mechanical recycling of post-consumer PLA waste and to identify the optimal filament compositions for 3D printing. To achieve this, PLA filaments were produced with varying rPLA-to-vPLA ratios (25%, 50%, and 75%), and the mechanical and optical properties of the resulting components were evaluated. These properties were compared with those of the components made from 100% vPLA and 100% rPLA to determine the extent to which the required level of structural performance can be attained. These findings highlight the benefits of integrating rPLA into FDM processes, leading to resource conservation and waste minimisation benefits while demonstrating the viability of household waste recycling in 3D printing applications.
2. Materials and Methods
A comprehensive approach was employed to create sustainable 3D-printed components using vPLA, post-consumer recycled PLA (rPLA), and various rPLA-vPLA blend ratios (25%, 50%, and 75%), as illustrated in Figure 1. The process encompasses key steps such as preparing waste plastic, extruding filaments, optimising printing parameters, performing additive manufacturing, and assessing the mechanical properties of the printed components.
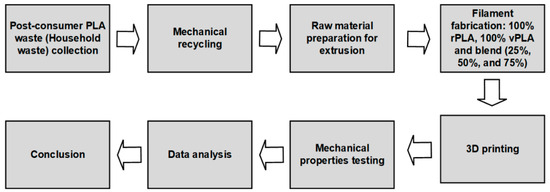
Figure 1.
Methodology flowchart of this study.
2.1. Research Materials
The aim of this study was to assess the impact of rPLA flakes on the material properties of 3D printing filaments extruded by the authors. Commercially available PLA pellets, purchased from AURARUM (Ringwood, VIC, Australia), with a density of 1.24 g/cm3 and a recommended printing temperature range of 200−230 °C, were used as the baseline material. These PLA pellets were blended with rPLA at varying content levels of 25%, 50%, and 75% recycled material. The rPLA was sourced from post-consumer household waste collected in Western Australia, which underwent a cleaning and shredding process before being mixed with the vPLA pellets, following the methodology outlined by Hasan et al. [16]. The mechanical recycling process followed is illustrated in Figure 2. This experimental approach allowed for a systematic evaluation of the effect of increasing the recycled content on the material properties of the filaments while maintaining a sufficient vPLA content to establish a performance baseline for comparison. The general properties of virgin and recycled PLA are summarised in Table 1.
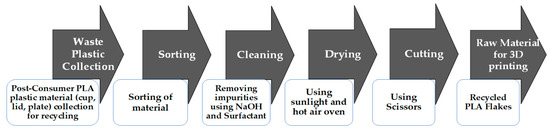
Figure 2.
Mechanical recycling of household PLA waste [16].

Table 1.
General properties of vPLA vs. rPLA [16,23,34,64,75,81,89,91,94,95,96].
2.2. Blend Filament Preparation
For filament extrusion, this research employed a Filabot EX6 single-screw extruder (Barre, VT, USA), which facilitates the fabrication of composite-filled materials by using PLA as the matrix material and incorporating other materials such as wood or copper powders [97]. The extruder features a screw diameter of 16 mm and a length-to-diameter (L/D) ratio of 24:1. It comprises three main units: an extruder for melting and mixing, an air path for cooling, and a spooler for filament winding. To prepare the materials for extrusion, vPLA and rPLA were dried in a Venticell Ecoline oven (Munich, Germany) at 60 °C for 3 h. This step aims to minimise the hydrolysing effects of moisture absorption, which can degrade the material properties during processing [62,75,76,90]. Once dried, the materials were melt-compounded in the extruder according to the specified formulations shown in Table 2.
Table 2.
Blend ratios of vPLA and rPLA by weight percentage.
The environmental conditions during the extrusion were carefully controlled to ensure consistency. A room temperature of 24 °C and relative humidity of 34% were maintained, with variations of ±2% [98]. To ensure optimal performance, the extruder was thoroughly cleaned prior to use. The cleaning process involved purging with cleaning pellets, disassembling the nozzle and screw, and cleaning the internal components with tools, such as a drill, wire brush, compressed air, and tube cleaner. After reassembly, the work area was cleared of dust and debris using compressed air to prevent contamination.
Recycled PLA (rPLA) has a lower melting temperature and viscosity compared to vPLA, which necessitates specific adjustments in processing parameters to prevent degradation and maintain consistent extrusion quality [99]. Consequently, temperature optimization plays a critical role in preserving the thermal stability and processability of rPLA [49,100]. To address this, the barrel temperatures of the individual heating zones of the extruder were optimised for each material composition based on several preliminary trials. For the V0:R100 and V25:R75 blends, the barrel temperatures were set to 40 °C, 170 °C, 175 °C, and 170 °C across the respective zones. For all other material compositions, the temperatures were adjusted to 40 °C, 175 °C, 180 °C, and 175 °C to ensure adequate heating and melting of the material prior to extrusion through a 1.75 mm nozzle.
During extrusion, the pellets were fed into the hopper to initiate filament production. The extruded filament was manually guided through the air path and into the spooler using pliers. The magnetic guides ensured proper alignment and digital callipers were used to monitor the filament diameter. The extrusion and spooling speeds were fine-tuned to achieve consistent filament diameters. Once a stable diameter was achieved, the filament was cut and fed through the starter hole of the spool for a continuous automatic winding. The filament diameter was monitored periodically to ensure dimensional consistency.
To maintain a target filament diameter between 1.65 mm and 1.75 mm, adjustments to the extruder motor speed and spooler settings were made throughout the process. Although the highest diameter variation was observed for the V0:R100 and V25:R75 blends, the fabricated filaments still demonstrated sufficient dimensional consistency for 3D printing applications. This variation in diameter was primarily attributed to the differences in material viscosities. Specifically, rPLA exhibited a lower viscosity at processing shear rates, which could be due to a lower average molecular weight or a broader molecular weight distribution [71,76]. Consequently, the rPLA flowed more easily, requiring less force to extrude. The filament production process is illustrated in Figure 3.

Figure 3.
Preparation of filaments from PLA waste and blends.
2.3. Three-Dimensional Printing
To evaluate the effects of incorporating rPLA into filament production and its impact on the mechanical properties of 3D-printed components, specimens for hardness, tensile, and flexural tests were meticulously designed using the SolidWorks 2022 (SP5.0) software. These designs were developed to comply with international testing standards, ensuring the reproducibility and comparability of the results.
For tensile testing, dogbone-shaped Type IV specimens with dimensions of 115 mm × 19 mm × 3.2 mm were designed in accordance with the ASTM-D638-22 [101] standard, as shown in Figure 4a. Flexural testing specimens for the three-point bending configuration were created with dimensions of 127 mm × 12.7 mm × 3.2 mm, following the guidelines specified in the ASTM D790-17 [102] standard (Figure 4b). Hardness test samples, measuring 40 mm × 40 mm × 8 mm, were prepared in compliance with the ASTM-D2240-15 [103] standard (Figure 4c). All specimen designs were exported as standard tessellation language (STL) files to ensure compatibility with slicing software used in the 3D printing process.

Figure 4.
Schematic of (a) tensile, (b) flexural and (c) hardness test specimens [16].
The slicing of the STL files was performed using ideaMaker Slicer (version 4.3.3) software, applying optimised printing parameters derived from prior studies by Hasan et al. [16,34]. These parameters, summarised in Table 3, included 0.3 mm layer thickness, 100% infill density, and 215 °C of nozzle temperature. These settings, determined through a design of experiments (DoE) approach, have been shown to produce high-strength PLA specimens [16,34]. The sliced files were saved as computer numerical control (G-code) files and were subsequently used to guide the 3D printing process.
Table 3.
Optimised 3D printing parameters for manufacturing test specimens [16,34].
Before initiating the printing process, the Raise3D E2 printer (Stafford, TX, USA), equipped with a 0.4 mm nozzle, was calibrated to ensure optimal performance and printing accuracy. Calibration included levelling the print bed and homing the printer’s axes to maintain precise alignment.
PLA filaments, including those incorporating rPLA, were fed into the 3D printer to ensure consistent extrusion. The test specimens were printed in a horizontal orientation to minimise the geometric variability and maintain uniform mechanical properties. This orientation facilitated consistent layer bonding and reduced potential anisotropy, ensuring the reliability of the subsequent mechanical testing.
2.4. Experimental Work
This section outlines the methodologies used to evaluate the surface quality and mechanical properties of 3D-printed samples. The primary objective was to assess the influence of the rPLA content on the surface roughness, hardness, tensile, and flexural properties while keeping the printing parameters constant. Standardised testing procedures were performed to ensure reliability and comparability with the results.
2.4.1. Surface Roughness Evaluation
Surface roughness is a critical parameter that influences the performance and mechanical behaviour of 3D-printed components. In this study, the surface roughness of the tensile specimens was evaluated using a Mitutoyo SJ-210 (Mitutoyo Corporation, Kanagawa, Japan) surface roughness tester in accordance with the ASTM-D7127-17 [104] standard. Measurements were conducted at five distinct locations on the largest surface of each tensile specimen (Figure 5), and the arithmetic mean roughness (Ra) was calculated as the mean value on the micrometre scale [16].

Figure 5.
Five-point selections on the top surface for surface roughness measurements [34].
2.4.2. Mechanical Properties Testing
The mechanical properties of the 3D-printed samples were evaluated through tensile, flexural (three-point bending), and hardness testing in accordance with ASTM standards [101,102,103]. For each mechanical test (tensile and flexural), a total of 25 specimens were printed, with 5 samples corresponding to each material composition (Table 2). In addition, 15 specimens were printed for the hardness tests, with 3 specimens for each material composition.
Hardness Testing
Hardness measurements were performed using a Sauter HBD 100-0 Shore D hardness tester in compliance with the ASTM-D2240-15 [103] standard. To ensure consistent results, the indenter was applied perpendicularly to the sample surface with a standardised test force of 50 N, as specified for the Sauter HBD 100-0 Shore D hardness tester. The reading was recorded within 1 ± 0.1 s, following the ASTM D2240 guidelines. Test samples, illustrated in Figure 4c, were evaluated by taking nine hardness measurements at equidistant points spaced 5 mm apart to ensure uniform surface coverage and account for potential material heterogeneity. For each material composition, a minimum of three samples were tested to ensure statistical reliability. The average hardness values and corresponding standard deviations were calculated to provide a robust representation of the hardness of the material.
Tensile Testing
Tensile tests were carried out using a Shimadzu Autograph AGS-X universal testing system equipped with a 50 kN load cell to evaluate the mechanical properties of the materials under uniaxial tensile loading. Dogbone-shaped specimens were prepared in accordance with the ASTM-D638-22 [101] standard, as depicted in Figure 4a. The specimens were subjected to tensile loading at a constant crosshead velocity of 5 mm/min until failure occurred, ensuring uniform strain application throughout the test.
The force and displacement data were continuously recorded using the system’s dedicated software, and corresponding force–displacement curves were generated using OriginPro 2024b (version 10.1.5.132). The ultimate tensile strength (UTS) was determined as the maximum stress attained during the tests.
The elastic modulus (E) was calculated from the initial slope of the stress–strain curve within the strain range of 0.0005 < ε < 0.0025 using the Trend Line function in OriginPro. This approach ensured a high accuracy in characterising the toughness of the material in the elastic region.
In addition to the UTS and elastic modulus, a comprehensive set of mechanical properties was evaluated, including the yield strength, strain at the UTS, work at the UTS, fracture strength, strain at fracture, and work at fracture. All the calculated values were averaged over multiple tests (with a minimum of five replicates) to ensure statistical reliability. The results, including mean values and corresponding standard deviations, were summarised in tabulated form to facilitate comparison and analysis.
Flexural Testing
Flexural properties of the specimens were evaluated using a three-point bending configuration in accordance with the ASTM D790-17 standard [102]. All tests were conducted on a Shimadzu Autograph AGS-X universal testing machine equipped with a 10 kN load cell, ensuring high precision in load application and displacement measurement. Rectangular specimens, as shown in Figure 4b, were prepared and tested to investigate their mechanical performances under flexural loading. The crosshead speed was maintained at a constant rate of 3 mm/min to ensure uniform strain across the specimens. The support span was fixed at 51.2 mm, following the prescribed guidelines of the ASTM D790-17 standard to ensure accurate and reproducible results.
The flexural strength () of the specimens was determined by calculating the nominal stress at the maximum load (P) applied during the test. This was achieved using Equation (1):
where L represents the support span, b signifies the sample width, and d indicates the sample thickness.
The flexural modulus (E) was calculated using Equation (2). This calculation involved linear regression analysis of the initial linear portion of the load–displacement curve, ensuring a correlation coefficient () of greater than 95%:
where m corresponds to the slope of the linear segment of the load–deflection curve, L is the support span, and b and d are the specimen width and thickness, respectively. Each experiment was repeated five times under identical test conditions to ensure statistical reliability. The results were reported as mean values and their corresponding standard deviations (SDs) to account for experimental variability and accurately represent the performance of the material.
2.4.3. Morphology
A detailed fractographic analysis of the fractured specimen cross-sections was conducted using a Pro-MicroScan optical microscope equipped with an eyepiece camera from Oplenic Corporation (Hangzhou, China) to investigate the fracture mechanisms. This setup enabled high-resolution imaging of the fracture surfaces to gain insight into the failure behaviour of the material.
The fractured specimens were embedded in cylindrical molds with dimensions of 2 cm in diameter and 3 cm in height. A self-curing polyacrylic mixture consisting of acrylic resin and powder was used to create a durable matrix around the cross-sections. This embedding process provided a flat observation window measuring 4 × 6 mm, facilitating precise and detailed microstructural examination [34].
To prepare the embedded samples for analysis, the cross-sectional surfaces were sequentially polished using abrasive papers with grit sizes of P400, P800, P1000, P1200, and P4000 to ensure a progressively smoother finish. Final polishing was performed using diamond suspensions of decreasing particle sizes, beginning with 6 μm, followed by 3 μm, and finally 1 μm suspensions. This meticulous polishing procedure ensured a high-quality surface that was free of artifacts and suitable for accurate morphological and microstructural observations. Following the tests, all specimens were carefully stored in sealed plastic bags to prevent contamination and to preserve their post-fracture conditions for subsequent analyses.
3. Results
3.1. Surface Roughness
Surface quality is crucial in additive manufacturing (AM) because it directly affects the performance of the printed components. Lower surface roughness (SR) enhances dimensional accuracy, reduces friction, and improves aesthetics, making it significant for both structural and aesthetic applications [16,34,105]. However, AM parts cannot perfectly replicate 3D CAD models due to inherent SR and process limitations [106]. Improving the surface quality during AM remains a key challenge. Among the factors influencing SR, layer thickness plays a crucial role, with a higher layer thickness leading to an increased SR [107]. The need to minimise roughness depends on the specific requirements of the application [108]. While post-processing treatments, such as polishing or chemical smoothing, can improve the surface finish, they may adversely affect the material properties [109]. However, the present study aimed to assess the influence of rPLA content on surface roughness under consistent printing parameters. Therefore, all samples were tested under the as-printed condition without any additional post-processing.
The surface roughness values for various material compositions of vPLA and rPLA were analysed, and the results are summarised in Figure 6. It is evident that as the proportion of rPLA increased, the surface roughness also increased significantly.
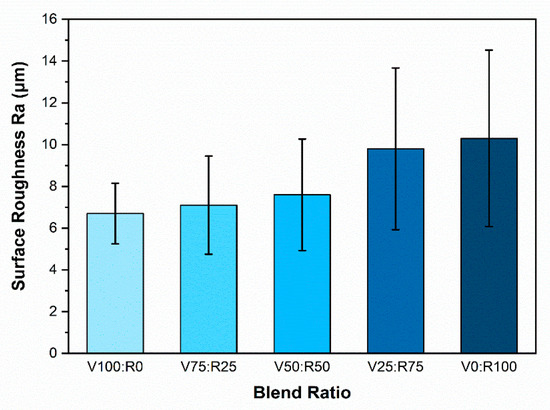
Figure 6.
Surface roughness of PLA blends with varying rPLA content.
For pure vPLA (V100:R0), the SR value was 6.7 µm, indicating the smoothest surface finish among the tested compositions. This is consistent with previous studies, where vPLA often demonstrated better surface quality owing to its homogeneity and lack of impurities [10,80,108,110,111]. As the proportion of rPLA increased to 25% (V75:R25), the roughness increased moderately to 7.1 µm, showing a slight degradation (5.9%) in the surface finish owing to the incorporation of the recycled material.
When the proportion of rPLA was increased to 50% (V50:R50), the roughness rose further to 7.6 µm, resulting in a 7.1% increase in SR compared to the V75:R25 blend. This further increase can be attributed to the higher percentage of rPLA, which likely leads to a less smooth surface during extrusion due to degradation. This trend aligns with the findings in the literature, where a higher recycled content tends to contribute to increased surface irregularities, likely resulting from inconsistencies in the recycled material properties, such as thermal degradation and filler content [90].
Notably, at V25:R75, the roughness jumps significantly to 9.8 µm, representing a 46.3% rise compared to V100:R0. For the V0:R100 (100% rPLA) blend, surface roughness peaked at 10.3 µm, a 53.73% increase compared to V100:R0. This significant rise in roughness correlates with the morphological defects identified in Section 3.5, including void formation (Figure 11e) and inadequate interlayer adhesion, which compromise material homogeneity during extrusion. The increased roughness can be attributed to the diminished flowability and mechanical integrity of rPLA during the printing process, as reported in previous studies [80,90]. In addition, the structural irregularities and lower melt strength of rPLA are often exacerbated at higher recycled fractions, leading to poorer surface quality [112].
Overall, the results demonstrate a clear correlation between the increased rPLA content and surface roughness, emphasising the need for improved processing methods to reduce roughness and enhance surface finish when using rPLA in additive manufacturing. However, the relatively small increase in surface roughness between the V75:R25 and V50:R50 blends suggests that moderate incorporation of rPLA (up to 50%) may maintain an acceptable surface quality while offering environmental and sustainability benefits.
3.2. Hardness
Hardness is a widely utilised mechanical property for evaluating polymer materials and is defined as the surface’s resistance to penetration by a harder material [113]. For thermoplastic polymers, hardness reflects the abrasion resistance and surface strength [114]. Lower hardness values can result in an increased susceptibility to scratches, surface damage, and potential dimensional instability [114,115]. The detailed hardness results for all prepared PLA blends are presented in Figure 7. A progressive reduction in Shore D hardness was observed with increasing rPLA content, highlighting the detrimental effects of polymer degradation on mechanical integrity. Notably, this decrease in hardness correlates with an increase in the surface roughness, where a higher rPLA content leads to more surface irregularities, further decreasing the overall hardness, as shown in Figure 6 and Figure 7. This inverse relationship between surface roughness and hardness indicates that as the rPLA content increases, the structure of the material becomes less smooth and inconsistent.

Figure 7.
Hardness of PLA blends with varying rPLA content.
Pure vPLA (V100:R0) exhibited the highest Shore D hardness value of 82.1, which can be attributed to its uniform molecular structure and superior homogeneity. Incorporating 25% rPLA (V75:R25) led to a slight decrease in the hardness to 81.7. This marginal reduction suggests that the inclusion of a small proportion of rPLA does not substantially compromise the overall structural integrity of the blend, as the vPLA matrix continues to provide reinforcement.
At a 50:50 blend ratio (V50:R50), the hardness value further declined to 80.88, representing a 1.46% decrease compared to pure vPLA and a 0.98% reduction relative to the V75:R25 blend. This moderate drop indicates a cumulative effect of the increased rPLA content, likely due to the reduced molecular weight and thermal degradation during the recycling process [96]. Additionally, the larger standard deviation at this ratio indicates increased heterogeneity within the material, which may result from processing inconsistencies or molecular chain scission [34].
The V25:R75 blend containing 75% rPLA exhibited a notable reduction in the hardness of 79.7. This decline aligns with previous studies that reported the decreased thermal stability of PLA after mechanical recycling. The degradation process generates shorter polymer chains during aging, washing, and reprocessing, which decompose more readily at lower temperatures [95]. The lowest Shore D hardness value of 79.1, a 3.66% decrease, was recorded for the fully rPLA sample (V0:R100) with respect to V100:R0. This significant reduction can be linked to various degradation mechanisms, including the thermal, hydrolytic, and mechanical breakdown of polymer chains during recycling. Additionally, factors such as extrusion defects, limited interlayer adhesion, and interruptions during 3D printing may further exacerbate the decline in the material performance [70].
In summary, the observed decrease in hardness with increasing rPLA content underscores the cumulative effect of polymer degradation on structural integrity. However, blends, such as V75:R25 and V50:R50, demonstrate a balance between mechanical performance and sustainability. These findings align with prior research indicating that combining vPLA with rPLA can partially offset the adverse effects of recycling, while maintaining acceptable material properties [16,80,116].
3.3. Tensile Properties
The tensile properties of blended PLA filaments with varying proportions of vPLA and rPLA are summarised in Table 4, and the stress–strain behaviour is illustrated in Figure 8. Each experiment involved the testing of five specimens, and the results demonstrated consistent reproducibility; thus, a single representative stress–strain curve for each blend ratio is shown. The data revealed a clear reduction in tensile properties with increasing rPLA content, which was particularly evident in the ultimate tensile strength (UTS). Higher proportions of rPLA progressively degraded material performance, with the tensile strength decreasing in direct proportion to the amount of rPLA incorporated. This trend is consistent with the findings of the hardness test, further confirming that rPLA significantly compromises the mechanical properties of the PLA matrix. Overall, the results highlight the impact of rPLA on the strength of the material, illustrating a balance between recycling content and mechanical performance.
Table 4.
Tensile properties of the blended filament 3D-printed specimens.
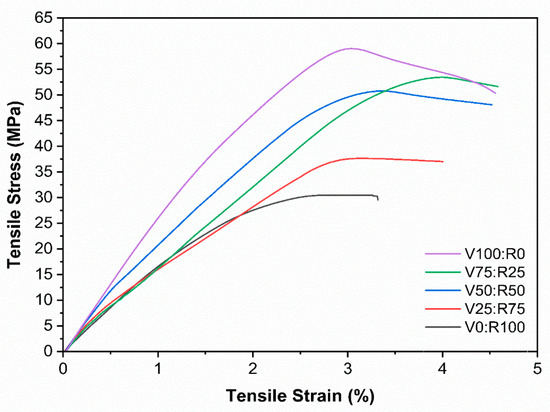
Figure 8.
Representative tensile stress vs. tensile strain curves.
Pure vPLA (V100:R0) exhibited the highest ultimate tensile strength (UTS) at 60.05 MPa. The UTS decreased as rPLA content increased, with V75:R25 and V50:R50 achieving UTS values of 53.45 MPa and 50.78 MPa, representing reductions of 10.9% and 15.3%, respectively, compared to V100:R0. Notably, V75:R25 exhibited a 5.2% higher UTS than V50:R50, underscoring the adverse impact of increasing the rPLA content on the material’s ability to resist stress before failure. The reduction in the UTS is attributed to chain scission and decreased molecular weight in the rPLA component, which weakens the polymer structure under tensile loading [45]. Similarly, the yield strength decreased from 37.69 MPa in V100:R0 to 30.06 MPa in V50:R50 and further to 27.09 MPa in V75:R25, indicating a progressive decline in the material’s resistance to initial plastic deformation.
Despite this reduction in strength, V75:R25 exhibited superior ductility and energy absorption. It achieved the highest strain at fracture of 4.56%, which was 4.03% higher than that of the pure vPLA. Its fracture strength of 51.68 MPa was only 0.77% lower than pure vPLA, closely approximating the mechanical properties of the virgin material. Furthermore, V75:R25 exhibited the highest work until UTS at 80.36 kJ/m2, 20.9% higher than V100:R0 (66.51 kJ/m2) and 24.0% higher than V50:R50 (64.79 kJ/m2). This balance between strength and ductility makes V75:R25 a favourable blend for applications that require both toughness and reliability.
In the V25:R75 blend, where 75% rPLA was incorporated, the deterioration in the tensile properties became more pronounced, and this decline further intensified as the rPLA content increased. The UTS dropped to 37.64 MPa, representing a significant 36.3% reduction compared to that of vPLA. Similarly, the fracture strength decreased to 36.96 Mpa, whereas the strain at fracture decreased to 4.01%, indicating a notable loss in ductility and increased material brittleness. This behaviour aligns with previous findings by Ong et al. [73], who highlighted that thermal and hydrolytic degradation during recycling leads to lower molecular weight and inferior mechanical performance.
The most pronounced decline in performance was observed for 100% rPLA (V0:R100). The UTS decreased significantly to 30.49 Mpa, a 49.2% reduction compared to V100:R0. The elastic modulus also dropped by 42.7%, from 3.14 Gpa to 1.80 Gpa. These trends are depicted in Figure 9, which illustrates the performance metrics for different blends. Similarly, the fracture strength and strain at fracture dropped by 29.57 Mpa and 3.30%, respectively. The yield strength decreased by 38.3%, from 37.69 Mpa (V100:R0) to 23.25 Mpa (V0:R100). Toughness, as measured by work until UTS and work until fracture, exhibited the most significant reduction of 56.6% and 56.3%, respectively. This decline can be attributed to polymer degradation mechanisms, such as chain scission, inconsistent filament diameter, and higher melt flow rate, which weaken interlayer bonding and reduce mechanical performance [66,75,91,109]. The morphology analysis further supports this observation, showing poor layer adhesion and fibre pull-out in the V0:R100 samples, as shown in Figure 11e (Section 3.5). Even with pre-drying, residual moisture in rPLA may exacerbate hydrolytic degradation during extrusion, compounding the deterioration [73,91].

Figure 9.
Ultimate tensile strength and elastic modulus of PLA blends with varying rPLA content.
Among the blends, V75:R25 demonstrated the most balanced performance, offering enhanced ductility and energy absorption, while maintaining reasonable strength. Improved interlayer bonding, facilitated by the increased melt flow index in rPLA, likely contributed to this enhanced performance [62,66]. These results align with those of Babagowda et al. [89] and Sasse et al. [90], who emphasise that higher vPLA proportions enhance ductility, fracture strength, and energy absorption while preserving sustainability benefits. These findings also align with the work of Badia et al. [116], who reported that incorporating rPLA decreases chain entanglements, leading to reduced stiffness and tensile strength. This observation is further supported by Wei et al. [80], who highlighted that blending virgin and recycled polymers can significantly compromise the mechanical properties owing to the degradation of the molecular structure of the recycled materials.
Overall, blending vPLA with rPLA significantly mitigated the adverse effects of degradation, particularly at the V50:R50 and V75:R25 ratios. These blends provide a viable route for producing recycled materials with high mechanical performance, presenting opportunities for structural and engineering applications, while reducing reliance on virgin materials and advancing sustainability goals.
3.4. Flexural Properties
The flexural behaviour of the 3D-printed specimens incorporating varying ratios of vPLA and rPLA is presented in Figure 10, where each curve represents the average response of the five tested specimens, demonstrating consistent repeatability of the results. A clear trend of deterioration in the flexural properties was observed as the proportion of rPLA increased, highlighting the adverse effect of rPLA on the mechanical performance of the blends.

Figure 10.
Representative flexural stress vs. flexural strain curves.
The 100% vPLA (V100:R0) exhibited the highest flexural properties, with a flexural strength of 103.45 MPa, elastic modulus of 2.84 GPa, and strain at a flexural strength of 8.40%. These results highlight the superior structural integrity and mechanical performance of vPLA, attributed to its minimal thermal degradation and homogenous microstructure, which allows it to withstand high stresses and deformations under flexural loading [117].
However, the addition of rPLA results in a progressive reduction in the flexural properties (Table 5). For the V75:R25 blend, containing 25% rPLA, the flexural strength decreased to 95.53 MPa (a 7.7% reduction compared to V100:R0), and the elastic modulus dropped to 2.54 GPa. Despite this, the blend demonstrated an acceptable mechanical performance. However, a slight reduction in strength and stiffness indicated the onset of molecular degradation caused by the inclusion of rPLA [100]. This degradation is primarily attributed to the thermal instability of rPLA, which arises from factors such as moisture, lactic acid residues, and metal catalysts. These factors accelerate thermal degradation, resulting in a decrease in molecular weight [49].
Table 5.
Flexural properties of the blended filament 3D-printed specimens.
A more pronounced decline in the flexural properties was observed in the V50:R50 blend, which contained equal proportions of virgin and rPLA. The flexural strength dropped to 92.84 MPa, a 10.2% reduction compared to the V100:R0 blend, while the elastic modulus decreased to 2.70 GPa. The morphology analysis (Section 3.5) further supports this reduction, revealing poor print bed adhesion and fibre pull-out, both of which contribute to diminished mechanical performance. This decline is attributed to the cumulative effects of chain scission as the proportion of rPLA increases, leading to a lower molecular weight in rPLA and subsequently compromising the load-bearing capacity of the blends [62].
The deterioration became more pronounced in the V25:R75 blend, where 75% rPLA content resulted in a flexural strength of 73.56 MPa, representing a 29% reduction compared to pure vPLA. Additionally, the elastic modulus decreased to 2.26 GPa, with a strain at a flexural strength of 6.79%. The most substantial performance reduction was observed for the V0:R100 specimen, which consisted entirely of rPLA. The flexural strength dropped to 52.79 MPa, representing a 49% decline relative to V100:R0, while the elastic modulus reduced to 1.73 GPa, and the strain at flexural strength decreased to 6.4%. The progressive reduction in mechanical performance with increasing rPLA content is primarily attributed to polymer chain scission, molecular weight degradation, and inconsistencies in the filament diameter, which likely affect the PLA melt pool during extrusion [89,90,91]. Additionally, contaminants, such as dust and residual moisture, despite pre-drying, contribute to hydrolytic degradation during processing [100]. Lower crystallinity in higher rPLA blends may also play a role in exacerbating mechanical performance losses [62,118].
This trend highlights the detrimental effects of an increased rPLA content on the flexural properties of PLA blends [90,91]. Although blends with lower rPLA contents, such as V75:R25 and V50:R50, exhibited moderate reductions in flexural strength and stiffness, higher proportions of rPLA resulted in significant performance sacrifices.
3.5. Fractography Analysis
Optical analyses were conducted to investigate the mechanical performance of the samples manufactured from the blended filament. The fracture surfaces of the V100:R0, V75:R25, V50:R50, V25:R75, and V0:R100 PLA blend specimens were examined under post-tensile test conditions using optical microscopy to characterise their fracture behaviour. The microscopic images are presented in Figure 11a–e.
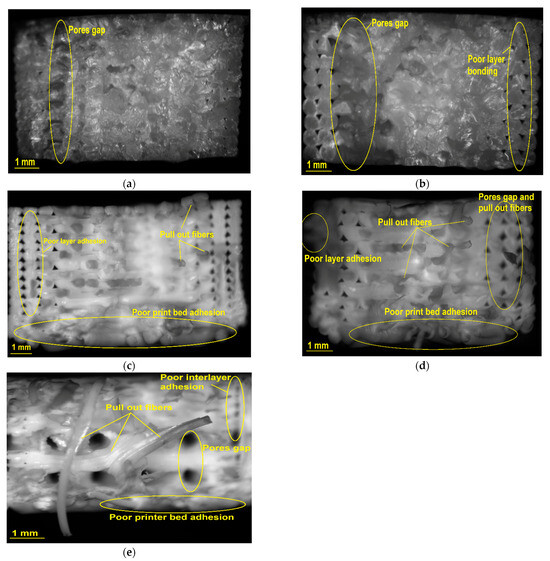
Figure 11.
Optical microscopy images of (a) V100:R0, (b) V75:R25, (c) V50:R50, (d) V25:R75, and (e) V0:R100.
The fracture surfaces of the pure PLA samples revealed a well-bonded and compact layered structure with relatively homogeneous material distribution (Figure 11a). The layers were tightly adhered, which is desirable because it contributes to superior mechanical and physical properties. These characteristics explain the higher mechanical performance of the pure PLA specimens compared with those containing recycled content. As the recycled content increased to 25% (V75:R25), noticeable changes were observed (Figure 11b). Although the layers were relatively compact, the presence of pores and poor interlayer bonding were evident, particularly at the specimen edges. These defects can likely be attributed to the processing conditions and addition of rPLA, which may have disrupted the uniformity of the material distribution [90]. Despite these imperfections, the structural integrity remained robust, and the overall pattern of the layers was comparable to that of the pure PLA. The mechanical performance of the V75:R25 specimens closely matched that of pure PLA, indicating that the incorporation of 25% rPLA minimally affected the material properties.
For the samples containing 50% rPLA (V50:R50), the fracture surface exhibited more pronounced defects, including fibre pull-out and poor interlayer adhesion. Figure 11c shows an interfacial region with a distinct lack of adhesion between elements.
While some minor defects, including fibre pull-out and small voids, were observed, the interfacial bonding remained sufficient to maintain reasonable mechanical performance. The mechanical behaviour of the V50:R50 specimens demonstrated an optimal compromise, retaining acceptable strength and stability, which positions this blend as a practical middle ground between material sustainability and technical performance. At 75% rPLA content (V25:R75), the poor interlayer adhesion became even more significant (Figure 11d). Voids and small gaps were observed throughout the fracture surfaces, likely because of incomplete wettability or bonding. This weak interfacial bonding resulted in poor mechanical performance because the adjacent layers were unable to adhere properly [16]. The significant increase in surface roughness, coupled with the significant decline in mechanical properties, can be attributed to these structural deficiencies, which highlight the challenges associated with a high rPLA content. For the samples made entirely of rPLA (V0:R100), the fracture surface displayed extensive fibre pull-out, void formation, and poor adhesion to the 3D printing bed (Figure 11e). The numerous cylindrical voids within the PLA layers further contributed to fibre pull-out. Additionally, the weak adhesion between the matrix and fibres impaired the mechanical properties. This phenomenon may have rendered the material more hydrophilic, making it more susceptible to moisture, and compromising the dimensional stability of the printed samples [62]. The tensile and flexural stress–strain curves further corroborate these findings, as the 100% rPLA specimens demonstrated low strength and limited strain, reflecting the reduced mechanical performance of the material.
Overall, optical analyses demonstrated that increasing the rPLA content progressively degraded layer bonding, introduced voids, and led to fibre pull-out, all of which contributed to reduced mechanical performance. Pure PLA exhibited superior interlayer bonding and material homogeneity and delivered the highest mechanical properties. Blends with 25% and 50% rPLA (V75:R25 and V50:R50, respectively) demonstrated reasonable structural integrity and maintained acceptable mechanical performance despite minor defects. However, a higher rPLA content (V25:R75 and V0:R100) disrupted the structural cohesion of the material and significantly compromised its mechanical properties.
4. Conclusions
This study investigates the feasibility trade-offs in mechanical property versus material sustainability when incorporating post-consumer recycled PLA (rPLA) into 3D printing filaments, using 100% vPLA as the baseline material for comparison. The experimental results reveal that increasing the rPLA content in blends significantly impacts the surface quality and mechanical properties, highlighting some of the challenges of using re-processed materials. Key findings include the following:
- Pure vPLA (V100:R0) exhibited the best surface quality with a roughness of 7.06 µm, whereas 100% rPLA (V0:R100) showed a significant increase to 10.5 µm, marking a 53.73% increase in surface roughness.
- Tensile strength dropped from 60.05 MPa for pure vPLA to 53.45 MPa for the V75:R25 blend (10.9% reduction) and further to 30.49 MPa for 100% rPLA (48.4% reduction).
- Flexural strength declined from 103.45 MPa for pure vPLA to 52.79 MPa for 100% rPLA, reflecting a 49% reduction, though blends with up to 50% rPLA retained more than 90% of the flexural performance of virgin material.
- Hardness of 100% vPLA (82.1 Shore D) decreased by only 0.5% in the 25% rPLA (V75:R25) blend but dropped by 3.66% for 100% rPLA.
The findings revealed that increasing the rPLA content led to degradation of the mechanical properties. However, blends with up to 50% rPLA, particularly V75:R25 and V50:R50, demonstrated a favourable mechanical performance. These blends retained sufficient structural integrity for use in structural applications (such as 3D printing filament) while promoting environmental benefits, such as waste reduction, sustainable material recycling and reprocessing, and the resulting resource efficiency. Morphological analysis further identified void formation and poor interlayer adhesion as primary contributors to performance degradation in blends with higher rPLA content. These structural inconsistencies became more pronounced with increased rPLA content, which aligns with findings from previous studies on the challenges of achieving strong interlayer bonding in recycled materials. However, these results provide new insights into the specific challenges of using rPLA (from household waste) in 3D printing, which could inform future optimisation strategies.
This study contributes to the understanding of how to strategically integrate rPLA into additive manufacturing to support circular economy goals without significantly compromising material or technical performance. Future work should focus on optimising recycling processing conditions to mitigate polymer degradation and improve interlayer bonding. A comprehensive evaluation of printing parameters is crucial for achieving an optimal balance between ecological performance and print quality. Furthermore, the use of less toxic alternatives, such as carbon-based conductive fillers, may enhance material efficiency [119]. Additionally, a life cycle sustainability assessment (LCSA) can provide valuable insights into the environmental impacts and long-term benefits of using different proportions of recycled PLA in 3D-printed parts.
Author Contributions
Conceptualisation, M.R.H., I.J.D., A.P., M.J. and W.K.B.; methodology, M.R.H., I.J.D., A.P., M.J. and W.K.B.; validation, M.R.H., I.J.D., A.P., M.J. and W.K.B.; formal analysis, M.R.H.; investigation, M.R.H.; data curation, M.R.H.; writing—original draft preparation, M.R.H.; writing—review and editing, M.R.H., I.J.D., A.P., M.J. and W.K.B.; and supervision, I.J.D., A.P., M.J. and W.K.B. All authors have read and agreed to the published version of the manuscript.
Funding
This research received no external funding.
Institutional Review Board Statement
Not applicable.
Informed Consent Statement
Not applicable.
Data Availability Statement
The research data will be made available at Curtin Research Data Collection.
Acknowledgments
The authors are grateful for the support provided by the technical staff of Curtin University, Australia.
Conflicts of Interest
The authors declare no conflicts of interest.
Abbreviations
The following abbreviations are used in this manuscript:
| AM | Additive manufacturing |
| FDM | Fused deposition modelling |
| PLA | Polylactic acid |
| rPLA | Recycled PLA |
| vPLA | Virgin PLA |
| STL | Standard tessellation language |
| ASTM | American Society for Testing and Materials |
| SR | Surface roughness |
References
- Leal Filho, W.; Salvia, A.L.; Minhas, A.; Paco, A.; Dias-Ferreira, C. The COVID-19 pandemic and single-use plastic waste in households: A preliminary study. Sci. Total Environ. 2021, 793, 148571. [Google Scholar] [CrossRef] [PubMed]
- Choi, H.-J.; Hwang, D.; Yoon, Y.-S.; Jeon, T.-W.; Rhee, S.-W. Applying Material Flow Analysis for Sustainable Waste Management of Single-Use Plastics and Packaging Materials in the Republic of Korea. Sustainability 2024, 16, 6926. [Google Scholar] [CrossRef]
- Hassan, M.; Mohanty, A.K.; Misra, M. 3D printing in upcycling plastic and biomass waste to sustainable polymer blends and composites: A review. Mater. Des. 2024, 237, 112558. [Google Scholar] [CrossRef]
- Kumar, R.; Verma, A.; Shome, A.; Sinha, R.; Sinha, S.; Jha, P.K.; Kumar, R.; Kumar, P.; Shubham; Das, S.; et al. Impacts of Plastic Pollution on Ecosystem Services, Sustainable Development Goals, and Need to Focus on Circular Economy and Policy Interventions. Sustainability 2021, 13, 9963. [Google Scholar] [CrossRef]
- Cheniti, H.; Kerboua, K.; Sekiou, O.; Aouissi, H.A.; Benselhoub, A.; Mansouri, R.; Zeriri, I.; Barbari, K.; Gilev, J.B.; Bouslama, Z. Life Cycle Assessment of Municipal Solid Waste Management within Open Dumping and Landfilling Contexts: A Strategic Analysis and Planning Responses Applicable to Algeria. Sustainability 2024, 16, 6930. [Google Scholar] [CrossRef]
- Hopewell, J.; Dvorak, R.; Kosior, E. Plastics recycling: Challenges and opportunities. Philos. Trans. R. Soc. B Biol. Sci. 2009, 364, 2115–2126. [Google Scholar] [CrossRef]
- Khalid, M.Y.; Arif, Z.U.; Ahmed, W.; Arshad, H. Recent trends in recycling and reusing techniques of different plastic polymers and their composite materials. Sustain. Mater. Technol. 2022, 31, e00382. [Google Scholar] [CrossRef]
- Milbrandt, A.; Coney, K.; Badgett, A.; Beckham, G.T. Quantification and evaluation of plastic waste in the United States. Resour. Conserv. Recycl. 2022, 183, 106363. [Google Scholar] [CrossRef]
- Kassab, A.; Al Nabhani, D.; Mohanty, P.; Pannier, C.; Ayoub, G.Y. Advancing Plastic Recycling: Challenges and Opportunities in the Integration of 3D Printing and Distributed Recycling for a Circular Economy. Polymers 2023, 15, 3881. [Google Scholar] [CrossRef]
- Mishra, V.; Negi, S.; Kar, S. FDM-based additive manufacturing of recycled thermoplastics and associated composites. J. Mater. Cycles Waste Manag. 2023, 25, 758–784. [Google Scholar] [CrossRef]
- Barnes, D.K.; Galgani, F.; Thompson, R.C.; Barlaz, M. Accumulation and fragmentation of plastic debris in global environments. Philos. Trans. R. Soc. Lond. B Biol. Sci. 2009, 364, 1985–1998. [Google Scholar] [CrossRef] [PubMed]
- Giurco, D.; Littleboy, A.; Boyle, T.; Fyfe, J.; White, S. Circular Economy: Questions for Responsible Minerals, Additive Manufacturing and Recycling of Metals. Resources 2014, 3, 432–453. [Google Scholar] [CrossRef]
- Romani, A.; Levi, M. Large-Format Material Extrusion Additive Manufacturing for Circular Economy Practices: A Focus on Product Applications with Materials from Recycled Plastics and Biomass Waste. Sustainability 2024, 16, 7966. [Google Scholar] [CrossRef]
- Wu, H.; Mehrabi, H.; Karagiannidis, P.; Naveed, N. Additive manufacturing of recycled plastics: Strategies towards a more sustainable future. J. Clean. Prod. 2022, 335, 130236. [Google Scholar] [CrossRef]
- Yousaf, A.; Al Rashid, A.; Polat, R.; Koç, M. Potential and challenges of recycled polymer plastics and natural waste materials for additive manufacturing. Sustain. Mater. Technol. 2024, 41, e01103. [Google Scholar] [CrossRef]
- Hasan, M.R.; Davies, I.J.; Pramanik, A.; John, M.; Biswas, W.K. Fabrication and Characterisation of Sustainable 3D-Printed Parts Using Post-Consumer PLA Plastic and Virgin PLA Blends. Processes 2024, 12, 760. [Google Scholar] [CrossRef]
- Ikram, H.; Al Rashid, A.; Koç, M. Additive manufacturing of smart polymeric composites: Literature review and future perspectives. Polym. Compos. 2022, 43, 6355–6380. [Google Scholar] [CrossRef]
- Cruz Sanchez, F.A.; Boudaoud, H.; Camargo, M.; Pearce, J.M. Plastic recycling in additive manufacturing: A systematic literature review and opportunities for the circular economy. J. Clean. Prod. 2020, 264, 121602. [Google Scholar] [CrossRef]
- Voulvoulis, N.; Kirkman, R.; Giakoumis, T.; Metivier, P.; Kyle, P.; Midgley, C. Examining Material Evidence: The Carbon Fingerprint; Imperial College London: London, UK, 2020; Volume 7, pp. 1–15. [Google Scholar]
- Mikula, K.; Skrzypczak, D.; Izydorczyk, G.; Warchol, J.; Moustakas, K.; Chojnacka, K.; Witek-Krowiak, A. 3D printing filament as a second life of waste plastics-a review. Environ. Sci. Pollut. Res. Int. 2021, 28, 12321–12333. [Google Scholar] [CrossRef]
- Hunt, E.J.; Zhang, C.; Anzalone, N.; Pearce, J.M. Polymer recycling codes for distributed manufacturing with 3-D printers. Resour. Conserv. Recycl. 2015, 97, 24–30. [Google Scholar] [CrossRef]
- Chong, S.; Pan, G.-T.; Khalid, M.; Yang, T.C.-K.; Hung, S.-T.; Huang, C.-M. Physical Characterization and Pre-assessment of Recycled High-Density Polyethylene as 3D Printing Material. J. Polym. Environ. 2017, 25, 136–145. [Google Scholar] [CrossRef]
- Hasan, M.R.; Davies, I.J.; Pramanik, A.; John, M.; Biswas, W.K. Potential of recycled PLA in 3D printing: A review. Sustain. Manuf. Serv. Econ. 2024, 3, 100020. [Google Scholar] [CrossRef]
- Gao, W.; Zhang, Y.; Ramanujan, D.; Ramani, K.; Chen, Y.; Williams, C.B.; Wang, C.C.L.; Shin, Y.C.; Zhang, S.; Zavattieri, P.D. The status, challenges, and future of additive manufacturing in engineering. Comput. Aided Des. 2015, 69, 65–89. [Google Scholar] [CrossRef]
- Prasad, G.; Arunav, H.; Dwight, S.; Ghosh, M.B.; Jayadev, A.; Nair, D.I. Advancing Sustainable Practices in Additive Manufacturing: A Comprehensive Review on Material Waste Recyclability. Sustainability 2024, 16, 10246. [Google Scholar] [CrossRef]
- Benamira, M.; Benhassine, N.; Ayad, A.; Dekhane, A. Investigation of printing parameters effects on mechanical and failure properties of 3D printed PLA. Eng. Fail. Anal. 2023, 148, 107218. [Google Scholar] [CrossRef]
- Dong, C.; Petrovic, M.; Davies, I.J. Applications of 3D printing in medicine: A review. Ann. 3D Print. Med. 2024, 14, 100149. [Google Scholar] [CrossRef]
- Rooney, K.; Dong, Y.; Pramanik, A.; Basak, A.K. Additive Manufacturing in Australian Small to Medium Enterprises: Vat Polymerisation Techniques, Case Study and Pathways to Industry 4.0 Competitiveness. J. Manuf. Mater. Process. 2023, 7, 168. [Google Scholar] [CrossRef]
- Despeisse, M.; Baumers, M.; Brown, P.; Charnley, F.; Ford, S.J.; Garmulewicz, A.; Knowles, S.; Minshall, T.H.W.; Mortara, L.; Reed-Tsochas, F.P.; et al. Unlocking value for a circular economy through 3D printing: A research agenda. Technol. Forecast. Social. Change 2017, 115, 75–84. [Google Scholar] [CrossRef]
- Maraveas, C.; Kyrtopoulos, I.V.; Arvanitis, K.G. Evaluation of the Viability of 3D Printing in Recycling Polymers. Polymers 2024, 16, 1104. [Google Scholar] [CrossRef]
- Jayawardane, H.; Davies, I.J.; Gamage, J.R.; John, M.; Biswas, W.K. Additive manufacturing of recycled plastics: A ‘techno-eco-efficiency’ assessment. Int. J. Adv. Manuf. Technol. 2023, 126, 1471–1496. [Google Scholar] [CrossRef]
- Pulok, M.K.H.; Rahman, M.S.; Chakravarty, U.K. Crack Propagation and Fracture Toughness of Additively Manufactured Polymers. In Proceedings of the ASME 2021 International Mechanical Engineering Congress and Exposition, Online, 1–5 November 2021. [Google Scholar]
- Ligon, S.C.; Liska, R.; Stampfl, J.; Gurr, M.; Mulhaupt, R. Polymers for 3D Printing and Customized Additive Manufacturing. Chem. Rev. 2017, 117, 10212–10290. [Google Scholar] [CrossRef] [PubMed]
- Hasan, M.R.; Davies, I.J.; Pramanik, A.; John, M.; Biswas, W.K. Impact of process parameters on improving the performance of 3D printed recycled polylactic acid (rPLA) components. Int. J. Adv. Manuf. Technol. 2024, 131, 3751–3779. [Google Scholar] [CrossRef]
- Romani, A.; Perusin, L.; Ciurnelli, M.; Levi, M. Characterization of PLA feedstock after multiple recycling processes for large-format material extrusion additive manufacturing. Mater. Today Sustain. 2024, 25, 100636. [Google Scholar] [CrossRef]
- Gil Muñoz, V.; Muneta, L.M.; Carrasco-Gallego, R.; De Juanes Marquez, J.; Hidalgo-Carvajal, D. Evaluation of the Circularity of Recycled PLA Filaments for 3D Printers. Appl. Sci. 2020, 10, 8967. [Google Scholar] [CrossRef]
- Ngo, T.D.; Kashani, A.; Imbalzano, G.; Nguyen, K.T.Q.; Hui, D. Additive manufacturing (3D printing): A review of materials, methods, applications and challenges. Compos. Part. B Eng. 2018, 143, 172–196. [Google Scholar] [CrossRef]
- Nasser, M.; Rezg, M.B.; Fellah, M.; Montagne, A. Impact of infill strategy and process parameters on selectivity and performance of PLA structures obtained by 3D printing. Int. J. Adv. Manuf. Technol. 2024, 135, 5499–5514. [Google Scholar] [CrossRef]
- Khosravani, M.R.; Berto, F.; Ayatollahi, M.R.; Reinicke, T. Characterization of 3D-printed PLA parts with different raster orientations and printing speeds. Sci. Rep. 2022, 12, 1016. [Google Scholar] [CrossRef]
- Yaman, P.; Ekşi, O.; Karabeyoğlu, S.S.; Feratoğlu, K. Effect of build orientation on tribological and flexural properties of FDM-printed composite PLA parts. J. Reinf. Plast. Compos. 2023, 43, 97–110. [Google Scholar] [CrossRef]
- European Bioplastics. Bioplastics Facts and Figures; European Bioplastics e.V: Berlin, Germany, 2023. [Google Scholar]
- European Bioplastics. Bioplastics Market Development Update 2023; European Bioplastics e.V: Berlin, Germany, 2024. [Google Scholar]
- Cosate De Andrade, M.F.; Souza, P.M.S.; Cavalett, O.; Morales, A.R. Life Cycle Assessment of Poly(Lactic Acid) (PLA): Comparison Between Chemical Recycling, Mechanical Recycling and Composting. J. Polym. Environ. 2016, 24, 372–384. [Google Scholar] [CrossRef]
- Oussai, A.; Bártfai, Z.; Kátai, L. Development of 3D Printing Raw Materials from Plastic Waste. A Case Study on Recycled Polyethylene Terephthalate. Appl. Sci. 2021, 11, 7338. [Google Scholar] [CrossRef]
- Pernica, J.; Vodák, M.; Šarocký, R.; Šustr, M.; Dostál, P.; Černý, M.; Dobrocký, D. Mechanical Properties of Recycled Polymer Materials in Additive Manufacturing. Manuf. Technol. 2022, 22, 200–203. [Google Scholar] [CrossRef]
- Suhaimi, N.A.S.; Muhamad, F.; Abd Razak, N.A.; Zeimaran, E. Recycling of polyethylene terephthalate wastes: A review of technologies, routes, and applications. Polym. Eng. Sci. 2022, 62, 2355–2375. [Google Scholar] [CrossRef]
- Chawla, K.; Singh, R.; Singh, J. On recyclability of thermoplastic ABS polymer as fused filament for FDM technique of additive manufacturing. World J. Eng. 2022, 19, 352–360. [Google Scholar] [CrossRef]
- Stephens, B.; Azimi, P.; El Orch, Z.; Ramos, T. Ultrafine particle emissions from desktop 3D printers. Atmos. Environ. 2013, 79, 334–339. [Google Scholar] [CrossRef]
- Pillin, I.; Montrelay, N.; Bourmaud, A.; Grohens, Y. Effect of thermo-mechanical cycles on the physico-chemical properties of poly(lactic acid). Polym. Degrad. Stab. 2008, 93, 321–328. [Google Scholar] [CrossRef]
- Fahim, I.S.; Chbib, H.; Mahmoud, H.M. The synthesis, production & economic feasibility of manufacturing PLA from agricultural waste. Sustain. Chem. Pharm. 2019, 12, 100142. [Google Scholar]
- Hermann, B.G.; Debeer, L.; De Wilde, B.; Blok, K.; Patel, M.K. To compost or not to compost: Carbon and energy footprints of biodegradable materials’ waste treatment. Polym. Degrad. Stab. 2011, 96, 1159–1171. [Google Scholar] [CrossRef]
- Maga, D.; Hiebel, M.; Thonemann, N. Life cycle assessment of recycling options for polylactic acid. Resour. Conserv. Recycl. 2019, 149, 86–96. [Google Scholar] [CrossRef]
- Molina-Besch, K. Use phase and end-of-life modeling of biobased biodegradable plastics in life cycle assessment: A review. Clean. Technol. Environ. Policy 2022, 24, 3253–3272. [Google Scholar] [CrossRef]
- Zhao, X.G.; Hwang, K.-J.; Lee, D.; Kim, T.; Kim, N. Enhanced mechanical properties of self-polymerized polydopamine-coated recycled PLA filament used in 3D printing. Appl. Surf. Sci. 2018, 441, 381–387. [Google Scholar] [CrossRef]
- Hottle, T.A.; Bilec, M.M.; Landis, A.E. Biopolymer production and end of life comparisons using life cycle assessment. Resour. Conserv. Recycl. 2017, 122, 295–306. [Google Scholar] [CrossRef]
- Maga, D.; Hiebel, M.; Aryan, V. A Comparative Life Cycle Assessment of Meat Trays Made of Various Packaging Materials. Sustainability 2019, 11, 5324. [Google Scholar] [CrossRef]
- Fico, D.; Rizzo, D.; De Carolis, V.; Montagna, F.; Palumbo, E.; Corcione, C.E. Development and characterization of sustainable PLA/Olive wood waste composites for rehabilitation applications using Fused Filament Fabrication (FFF). J. Build. Eng. 2022, 56, 104673. [Google Scholar] [CrossRef]
- Kreiger, M.A.; Mulder, M.L.; Glover, A.G.; Pearce, J.M. Life cycle analysis of distributed recycling of post-consumer high density polyethylene for 3-D printing filament. J. Clean. Prod. 2014, 70, 90–96. [Google Scholar] [CrossRef]
- Rezvani Ghomi, E.R.; Khosravi, F.; Saedi Ardahaei, A.S.; Dai, Y.; Neisiany, R.E.; Foroughi, F.; Wu, M.; Das, O.; Ramakrishna, S. The Life Cycle Assessment for Polylactic Acid (PLA) to Make It a Low-Carbon Material. Polymers 2021, 13, 1854. [Google Scholar] [CrossRef]
- Zhong, S.; Pearce, J.M. Tightening the loop on the circular economy: Coupled distributed recycling and manufacturing with recyclebot and RepRap 3-D printing. Resour. Conserv. Recycl. 2018, 128, 48–58. [Google Scholar] [CrossRef]
- Baechler, C.; Devuono, M.; Pearce, J.M. Distributed recycling of waste polymer into RepRap feedstock. Rapid Prototyp. J. 2013, 19, 118–125. [Google Scholar] [CrossRef]
- Bergaliyeva, S.; Sales, D.L.; Delgado, F.J.; Bolegenova, S.; Molina, S.I. Manufacture and Characterization of Polylactic Acid Filaments Recycled from Real Waste for 3D Printing. Polymers 2023, 15, 2165. [Google Scholar] [CrossRef]
- Stefaniak, A.B.; Bowers, L.N.; Cottrell, G.; Erdem, E.; Knepp, A.K.; Martin, S.B.; Pretty, J.; Duling, M.G.; Arnold, E.D.; Wilson, Z.; et al. Towards sustainable additive manufacturing: The need for awareness of particle and vapor releases during polymer recycling, making filament, and fused filament fabrication 3-D printing. Resour. Conserv. Recycl. 2022, 176, 105911. [Google Scholar] [CrossRef]
- Beltran, F.R.; Lorenzo, V.; Acosta, J.; de la Orden, M.U.; Martinez Urreaga, J. Effect of simulated mechanical recycling processes on the structure and properties of poly(lactic acid). J. Environ. Manag. 2018, 216, 25–31. [Google Scholar] [CrossRef]
- Hsueh, M.H.; Lai, C.J.; Liu, K.Y.; Chung, C.F.; Wang, S.H.; Pan, C.Y.; Huang, W.C.; Hsieh, C.H.; Zeng, Y.S. Effects of Printing Temperature and Filling Percentage on the Mechanical Behavior of Fused Deposition Molding Technology Components for 3D Printing. Polymers 2021, 13, 2910. [Google Scholar] [CrossRef] [PubMed]
- Żenkiewicz, M.; Richert, J.; Rytlewski, P.; Moraczewski, K.; Stepczyńska, M.; Karasiewicz, T. Characterisation of multi-extruded poly(lactic acid). Polym. Test. 2009, 28, 412–418. [Google Scholar] [CrossRef]
- Alexandre, A.; Cruz Sanchez, F.A.; Boudaoud, H.; Camargo, M.; Pearce, J.M. Mechanical Properties of Direct Waste Printing of Polylactic Acid with Universal Pellets Extruder: Comparison to Fused Filament Fabrication on Open-Source Desktop Three-Dimensional Printers. 3D Print. Addit. Manuf. 2020, 7, 237–247. [Google Scholar] [CrossRef]
- Kantaros, A.; Soulis, E.; Alysandratou, E. Digitization of Ancient Artefacts and Fabrication of Sustainable 3D-Printed Replicas for Intended Use by Visitors with Disabilities: The Case of Piraeus Archaeological Museum. Sustainability 2023, 15, 12689. [Google Scholar] [CrossRef]
- Aguero, A.; Corral Perianes, E.; Abarca de Las Muelas, S.S.; Lascano, D.; de la Fuente Garcia-Soto, M.D.M.; Peltzer, M.A.; Balart, R.; Arrieta, M.P. Plasticized Mechanical Recycled PLA Films Reinforced with Microbial Cellulose Particles Obtained from Kombucha Fermented in Yerba Mate Waste. Polymers 2023, 15, 285. [Google Scholar] [CrossRef]
- Anderson, I. Mechanical Properties of Specimens 3D Printed with Virgin and Recycled Polylactic Acid. 3D Print. Addit. Manuf. 2017, 4, 110–115. [Google Scholar] [CrossRef]
- Zhao, P.; Rao, C.; Gu, F.; Sharmin, N.; Fu, J. Close-looped recycling of polylactic acid used in 3D printing: An experimental investigation and life cycle assessment. J. Clean. Prod. 2018, 197, 1046–1055. [Google Scholar] [CrossRef]
- Lanzotti, A.; Martorelli, M.; Maietta, S.; Gerbino, S.; Penta, F.; Gloria, A. A comparison between mechanical properties of specimens 3D printed with virgin and recycled PLA. Procedia CIRP 2019, 79, 143–146. [Google Scholar] [CrossRef]
- Ong, T.K.; Choo, H.L.; Choo, W.J.; Koay, S.C.; Pang, M.M. Recycling of Polylactic Acid (PLA) Wastes from 3D Printing Laboratory. In Lecture Notes in Mechanical Engineering; Springer: Singapore, 2020; pp. 725–732. [Google Scholar]
- Cruz Sanchez, F.; Lanza, S.; Boudaoud, H.; Hoppe, S.; Camargo, M. Polymer Recycling and Additive Manufacturing in an Open Source context: Optimization of processes and methods. In Proceedings of the Conference: 2015 Annual International Solid Freeform Fabrication Symposium-An Additive Manufacturing Conference, Austin, TX, USA, 10–12 August 2015. [Google Scholar]
- Cruz Sanchez, F.A.; Boudaoud, H.; Hoppe, S.; Camargo, M. Polymer recycling in an open-source additive manufacturing context: Mechanical issues. Addit. Manuf. 2017, 17, 87–105. [Google Scholar] [CrossRef]
- Hidalgo-Carvajal, D.; Munoz, A.H.; Garrido-Gonzalez, J.J.; Carrasco-Gallego, R.; Alcazar Montero, V. Recycled PLA for 3D Printing: A Comparison of Recycled PLA Filaments from Waste of Different Origins after Repeated Cycles of Extrusion. Polymers 2023, 15, 3651. [Google Scholar] [CrossRef]
- Nguyen, K.Q.; Vuillaume, P.Y.; Hu, L.; López-Beceiro, J.; Cousin, P.; Elkoun, S.; Robert, M. Recycled, Bio-Based, and Blended Composite Materials for 3D Printing Filament: Pros and Cons—A Review. Mater. Sci. Appl. 2023, 14, 148–185. [Google Scholar] [CrossRef]
- Pérez-Fonseca, A.A.; González-López, M.E.; Robledo-Ortíz, J.R. Reprocessing and Recycling of Poly(Lactic Acid): A Review. J. Polym. Environ. 2023, 31, 4143–4159. [Google Scholar] [CrossRef]
- Carné Sánchez, A.; Collinson, S.R. The selective recycling of mixed plastic waste of polylactic acid and polyethylene terephthalate by control of process conditions. Eur. Polym. J. 2011, 47, 1970–1976. [Google Scholar] [CrossRef]
- Wei, X.; Bähr, R. A comparative study of 3D printing with virgin and recycled polylactic acid filaments. CIRP J. Manuf. Sci. Technol. 2024, 54, 75–84. [Google Scholar] [CrossRef]
- Cisneros-López, E.O.; Pal, A.K.; Rodriguez, A.U.; Wu, F.; Misra, M.; Mielewski, D.F.; Kiziltas, A.; Mohanty, A.K. Recycled poly(lactic acid)–based 3D printed sustainable biocomposites: A comparative study with injection molding. Mater. Today Sustain. 2020, 7–8, 100027. [Google Scholar] [CrossRef]
- Koh, J.J.; Zhang, X.; He, C. Fully biodegradable Poly(lactic acid)/Starch blends: A review of toughening strategies. Int. J. Biol. Macromol. 2018, 109, 99–113. [Google Scholar] [CrossRef]
- Scaffaro, R.; Morreale, M.; Mirabella, F.; La Mantia, F.P. Preparation and Recycling of Plasticized PLA. Macromol. Mater. Eng. 2011, 296, 141–150. [Google Scholar] [CrossRef]
- Brüster, B.; Addiego, F.; Hassouna, F.; Ruch, D.; Raquez, J.M.; Dubois, P. Thermo-mechanical degradation of plasticized poly(lactide) after multiple reprocessing to simulate recycling: Multi-scale analysis and underlying mechanisms. Polym. Degrad. Stab. 2016, 131, 132–144. [Google Scholar] [CrossRef]
- Dong, Y.; Ghataura, A.; Takagi, H.; Haroosh, H.J.; Nakagaito, A.N.; Lau, K.-T. Polylactic acid (PLA) biocomposites reinforced with coir fibres: Evaluation of mechanical performance and multifunctional properties. Compos. Part. A Appl. Sci. Manuf. 2014, 63, 76–84. [Google Scholar] [CrossRef]
- Tanase, M.; Portoaca, A.I.; Dinita, A.; Branoiu, G.; Zamfir, F.; Sirbu, E.E.; Calin, C. Optimizing Mechanical Properties of Recycled 3D-Printed PLA Parts for Sustainable Packaging Solutions Using Experimental Analysis and Machine Learning. Polymers 2024, 16, 3268. [Google Scholar] [CrossRef]
- Pakkanen, J.; Manfredi, D.; Minetola, P.; Iuliano, L. About the Use of Recycled or Biodegradable Filaments for Sustainability of 3D Printing. In Sustainable Design and Manufacturing 2017; Springer International Publishing: Berlin/Heidelberg, Germany, 2017; pp. 776–785. [Google Scholar]
- Kantaros, A.; Laskaris, N.; Piromalis, D.; Ganetsos, T. Manufacturing Zero-Waste COVID-19 Personal Protection Equipment: A Case Study of Utilizing 3D Printing While Employing Waste Material Recycling. Circ. Econ. Sustain. 2021, 1, 851–869. [Google Scholar] [CrossRef] [PubMed]
- Babagowda; Math, R.S.K.; Goutham, R.; Prasad, K.R.S. Study of Effects on Mechanical Properties of PLA Filament which is blended with Recycled PLA Materials. IOP Conf. Ser. Mater. Sci. Eng. 2018, 310, 012103. [Google Scholar] [CrossRef]
- Sasse, J.; Pelzer, L.; Schön, M.; Ghaddar, T.; Hopmann, C. Investigation of Recycled and Coextruded PLA Filament for Additive Manufacturing. Polymers 2022, 14, 2407. [Google Scholar] [CrossRef] [PubMed]
- Tanney, D.; Meisel, N.A.; Moore, J.D. Investigating material degradation through the recycling of PLA in additively manufactured parts. In Proceedings of the 2017 Annual International Solid Freeform Fabrication Symposium, Proceedings of the 28th Annual International Solid Freeform Fabrication Symposium-An Additive Manufacturing Conference, Austin, TX, USA, 7–9 August 2017; David, L., Bourell, Richard, H., Crawford, Eds.; University of Texas: Austin, TX, USA, 2017. [Google Scholar]
- Aly, R.; Olalere, O.; Ryder, A.; Alyammahi, M.; Samad, W.A. Mechanical Property Characterization of Virgin and Recycled PLA Blends in Single-Screw Filament Extrusion for 3D Printing. Polymers 2024, 16, 3569. [Google Scholar] [CrossRef]
- CSIRO. The State of Bioplastics in Australia Report Aims to Increase Understanding of Bioplastics and Their Credentials for Sustainable Waste Management; Commonwealth Scientific and Industrial Research Organisation (CSIRO): Canberra, Australia, 2024. [Google Scholar]
- Chariyachotilert, C.; Joshi, S.; Selke, S.E.; Auras, R. Assessment of the properties of poly(L-lactic acid) sheets produced with differing amounts of postconsumer recycled poly(L-lactic acid). J. Plast. Film. Sheeting 2012, 28, 314–335. [Google Scholar] [CrossRef]
- Beltrán, F.R.; Infante, C.; de la Orden, M.U.; Martínez Urreaga, J. Mechanical recycling of poly(lactic acid): Evaluation of a chain extender and a peroxide as additives for upgrading the recycled plastic. J. Clean. Prod. 2019, 219, 46–56. [Google Scholar] [CrossRef]
- Beltrán, F.R.; Climent-Pascual, E.; De La Orden, M.U.; Martínez Urreaga, J. Effect of solid-state polymerization on the structure and properties of mechanically recycled poly(lactic acid). Polym. Degrad. Stab. 2020, 171, 109045. [Google Scholar] [CrossRef]
- Kantaros, A.; Soulis, E.; Petrescu, F.I.T.; Ganetsos, T. Advanced Composite Materials Utilized in FDM/FFF 3D Printing Manufacturing Processes: The Case of Filled Filaments. Materials 2023, 16, 6210. [Google Scholar] [CrossRef]
- Spina, R.; Gurrado, N. Green Recycling for Polypropylene Components by Material Extrusion. Polymers 2024, 16, 3502. [Google Scholar] [CrossRef]
- Shabani, M.; Turner, C.J. Analysis of Mechanical Chemical and Thermal Properties of PLA Filaments After Mechanical Recycling. In Proceedings of the ASME 2023 International Design Engineering Technical Conferences and Computers and Information in Engineering Conference, Boston, MA, USA, 20–23 August 2023. [Google Scholar]
- Patti, A.; Acierno, S.; Cicala, G.; Zarrelli, M.; Acierno, D. Assessment of Recycled PLA-Based Filament for 3D Printing. Mater. Proc. 2021, 7, 16. [Google Scholar] [CrossRef]
- ASTM-D638-22; Standard Test Method for Tensile Properties of Plastics. ASTM International: West Conshohocken, PA, USA, 2022.
- ASTM D790-17; Standard Test Methods for Flexural Properties of Unreinforced and Reinforced Plastics and Electrical Insulating Materials. ASTM International: West Conshohocken, PA, USA, 2017.
- ASTM-D2240-15; Standard Test Method for Rubber Property-Durometer Hardness. ASTM International: West Conshohocken, PA, USA, 2021.
- ASTM-D7127-17; Standard Test Method for Measurement of Surface Roughness of Abrasive Blast Cleaned Metal Surfaces Using a Portable Stylus Instrument. ASTM International: West Conshohocken, PA, USA, 2017.
- Maier, R.; Bucaciuc, S.G.; Mandoc, A.C. Reducing Surface Roughness of 3D Printed Short-Carbon Fiber Reinforced Composites. Materials 2022, 15, 7398. [Google Scholar] [CrossRef]
- Golhin, A.P.; Tonello, R.; Frisvad, J.R.; Grammatikos, S.; Strandlie, A. Surface roughness of as-printed polymers: A comprehensive review. Int. J. Adv. Manuf. Technol. 2023, 127, 987–1043. [Google Scholar] [CrossRef]
- Udroiu, R. New Methodology for Evaluating Surface Quality of Experimental Aerodynamic Models Manufactured by Polymer Jetting Additive Manufacturing. Polymers 2022, 14, 371. [Google Scholar] [CrossRef] [PubMed]
- Mishra, P.; Sood, S.; Bharadwaj, V.; Aggarwal, A.; Khanna, P. Parametric Modeling and Optimization of Dimensional Error and Surface Roughness of Fused Deposition Modeling Printed Polyethylene Terephthalate Glycol Parts. Polymers 2023, 15, 546. [Google Scholar] [CrossRef] [PubMed]
- Pinho, A.C.; Amaro, A.M.; Piedade, A.P. 3D printing goes greener: Study of the properties of post-consumer recycled polymers for the manufacturing of engineering components. Waste Manag. 2020, 118, 426–434. [Google Scholar] [CrossRef]
- Maidin, S.; Fadani, I.; Hayati, N.M.N.; Albaluooshi, H. Application of Taguchi Method to Optimize Fused Deposition Modeling Process Parameters for Surface Roughness. Jurnal Teknologi 2022, 84, 29–37. [Google Scholar] [CrossRef]
- Mani, M.; Karthikeyan, A.G.; Kalaiselvan, K.; Muthusamy, P.; Muruganandhan, P. Optimization of FDM 3-D printer process parameters for surface roughness and mechanical properties using PLA material. Mater. Today Proc. 2022, 66, 1926–1931. [Google Scholar] [CrossRef]
- Singh, R.; Barwar, A.; Kumar, A. Investigations on Primary and Secondary Recycling of PLA and its Composite for Biomedical and Sensing Applications. J. Inst. Eng. India Ser. C 2022, 103, 821–836. [Google Scholar] [CrossRef]
- Sedlak, J.; Joska, Z.; Hrbackova, L.; Jurickova, E.; Hrusecka, D.; Horak, O. Determination of Mechanical Properties of Plastic Components Made by 3D Printing. Manuf. Technol. 2023, 22, 733–746. [Google Scholar] [CrossRef]
- Chuchulska, B.; Dimitrova, M.; Dochev, B. In Vitro Study of the Surface Roughness, Hardness, and Absorption of an Injection-Molded Denture Base Polymer, Manufactured under Insufficient Mold Solidification. Appl. Sci. 2024, 14, 2906. [Google Scholar] [CrossRef]
- Gogolewski, D.; Bartkowiak, T.; Kozior, T.; Zmarzly, P. Multiscale Analysis of Surface Texture Quality of Models Manufactured by Laser Powder-Bed Fusion Technology and Machining from 316L Steel. Materials 2021, 14, 2794. [Google Scholar] [CrossRef] [PubMed]
- Badia, J.D.; Ribes-Greus, A. Mechanical recycling of polylactide, upgrading trends and combination of valorization techniques. Eur. Polym. J. 2016, 84, 22–39. [Google Scholar] [CrossRef]
- Taib, N.-A.A.B.; Rahman, M.R.; Huda, D.; Kuok, K.K.; Hamdan, S.; Bakri, M.K.B.; Julaihi, M.R.M.B.; Khan, A. A review on poly lactic acid (PLA) as a biodegradable polymer. Polym. Bull. 2022, 80, 1179–1213. [Google Scholar] [CrossRef]
- Malmgren, T.; Mays, J.; Pyda, M. Characterization of poly(lactic acid) by size exclusion chromatography, differential refractometry, light scattering and thermal analysis. J. Therm. Anal. Calorim. 2006, 83, 35–40. [Google Scholar] [CrossRef]
- Kalinke, C.; Crapnell, R.D.; de Oliveira, P.R.; Janegitz, B.C.; Bonacin, J.A.; Banks, C.E. How to Improve Sustainability in Fused Filament Fabrication (3D Printing) Research? Glob. Chall. 2024, 8, 2300408. [Google Scholar] [CrossRef]
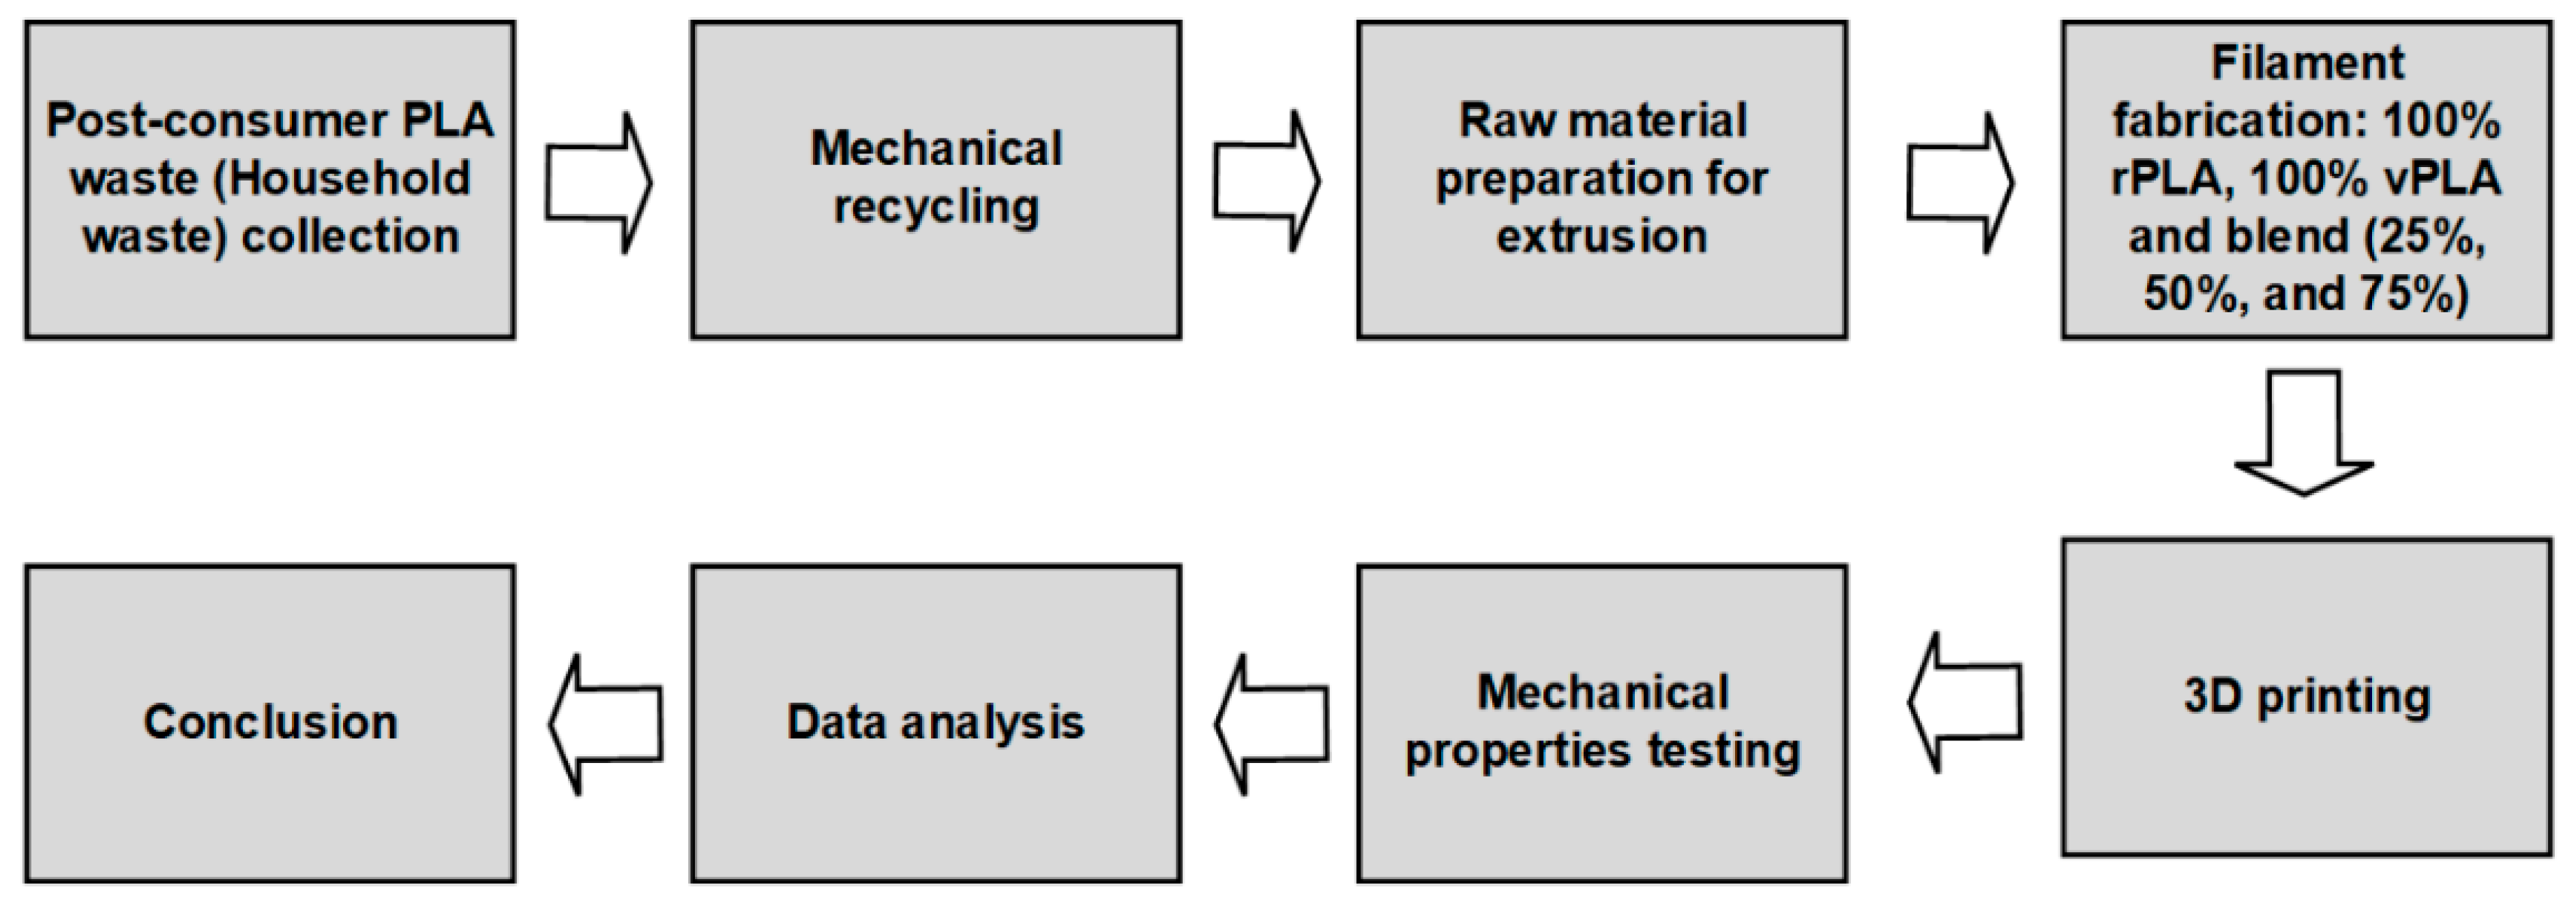
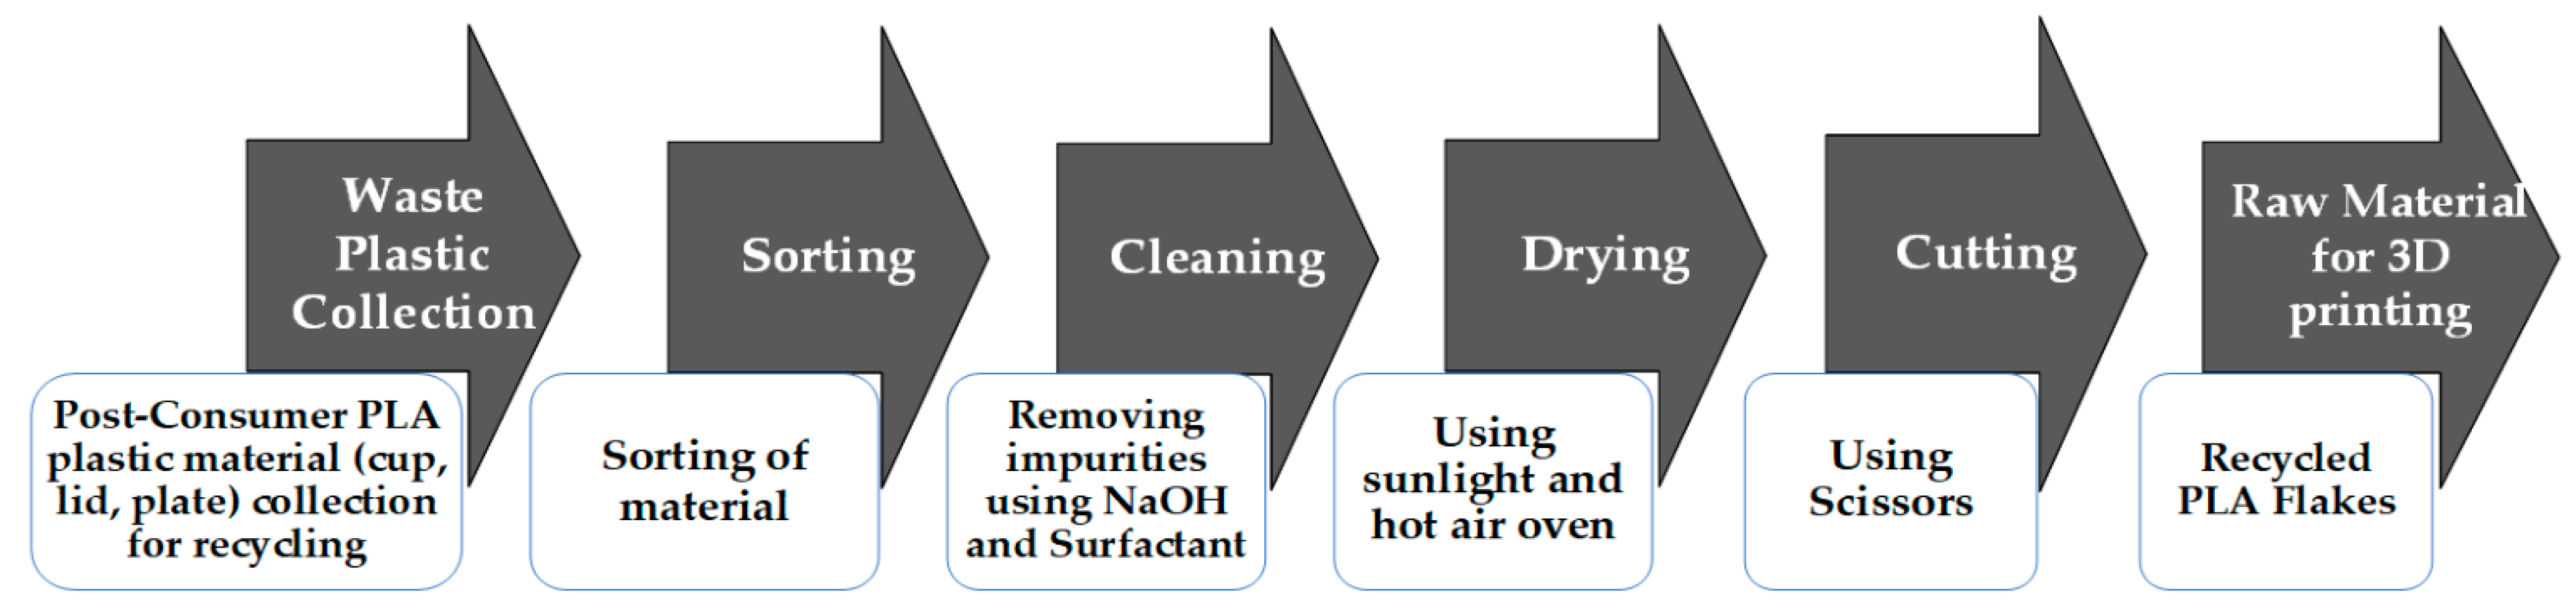
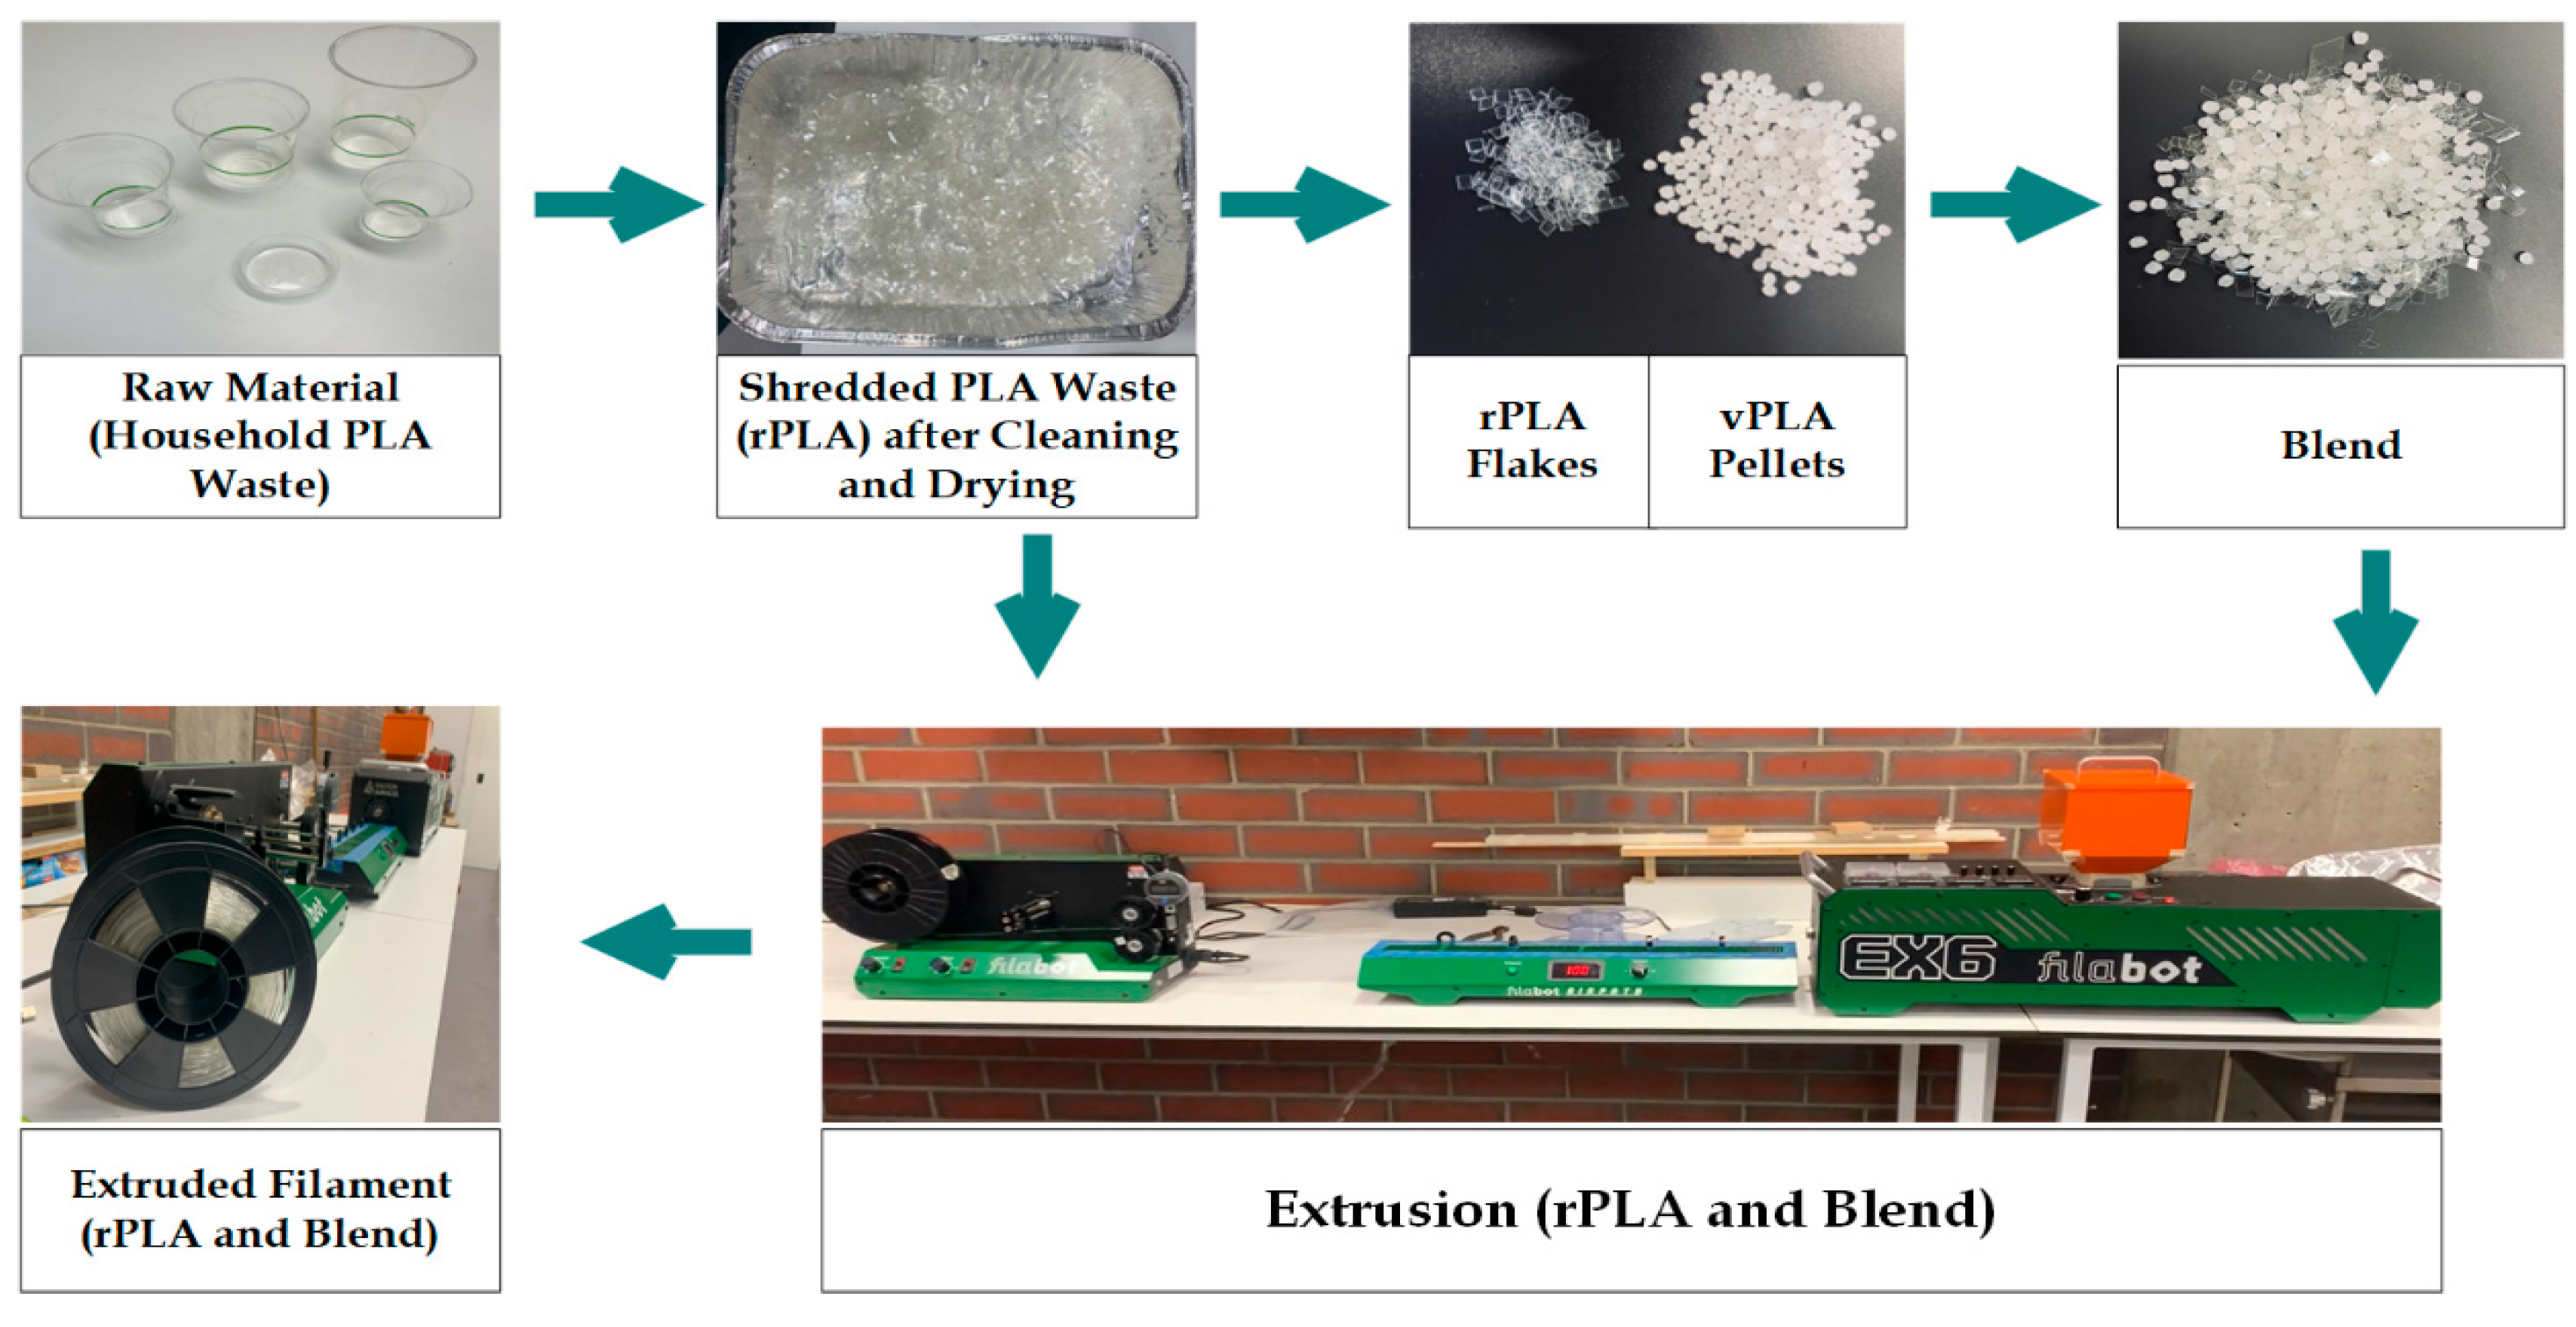
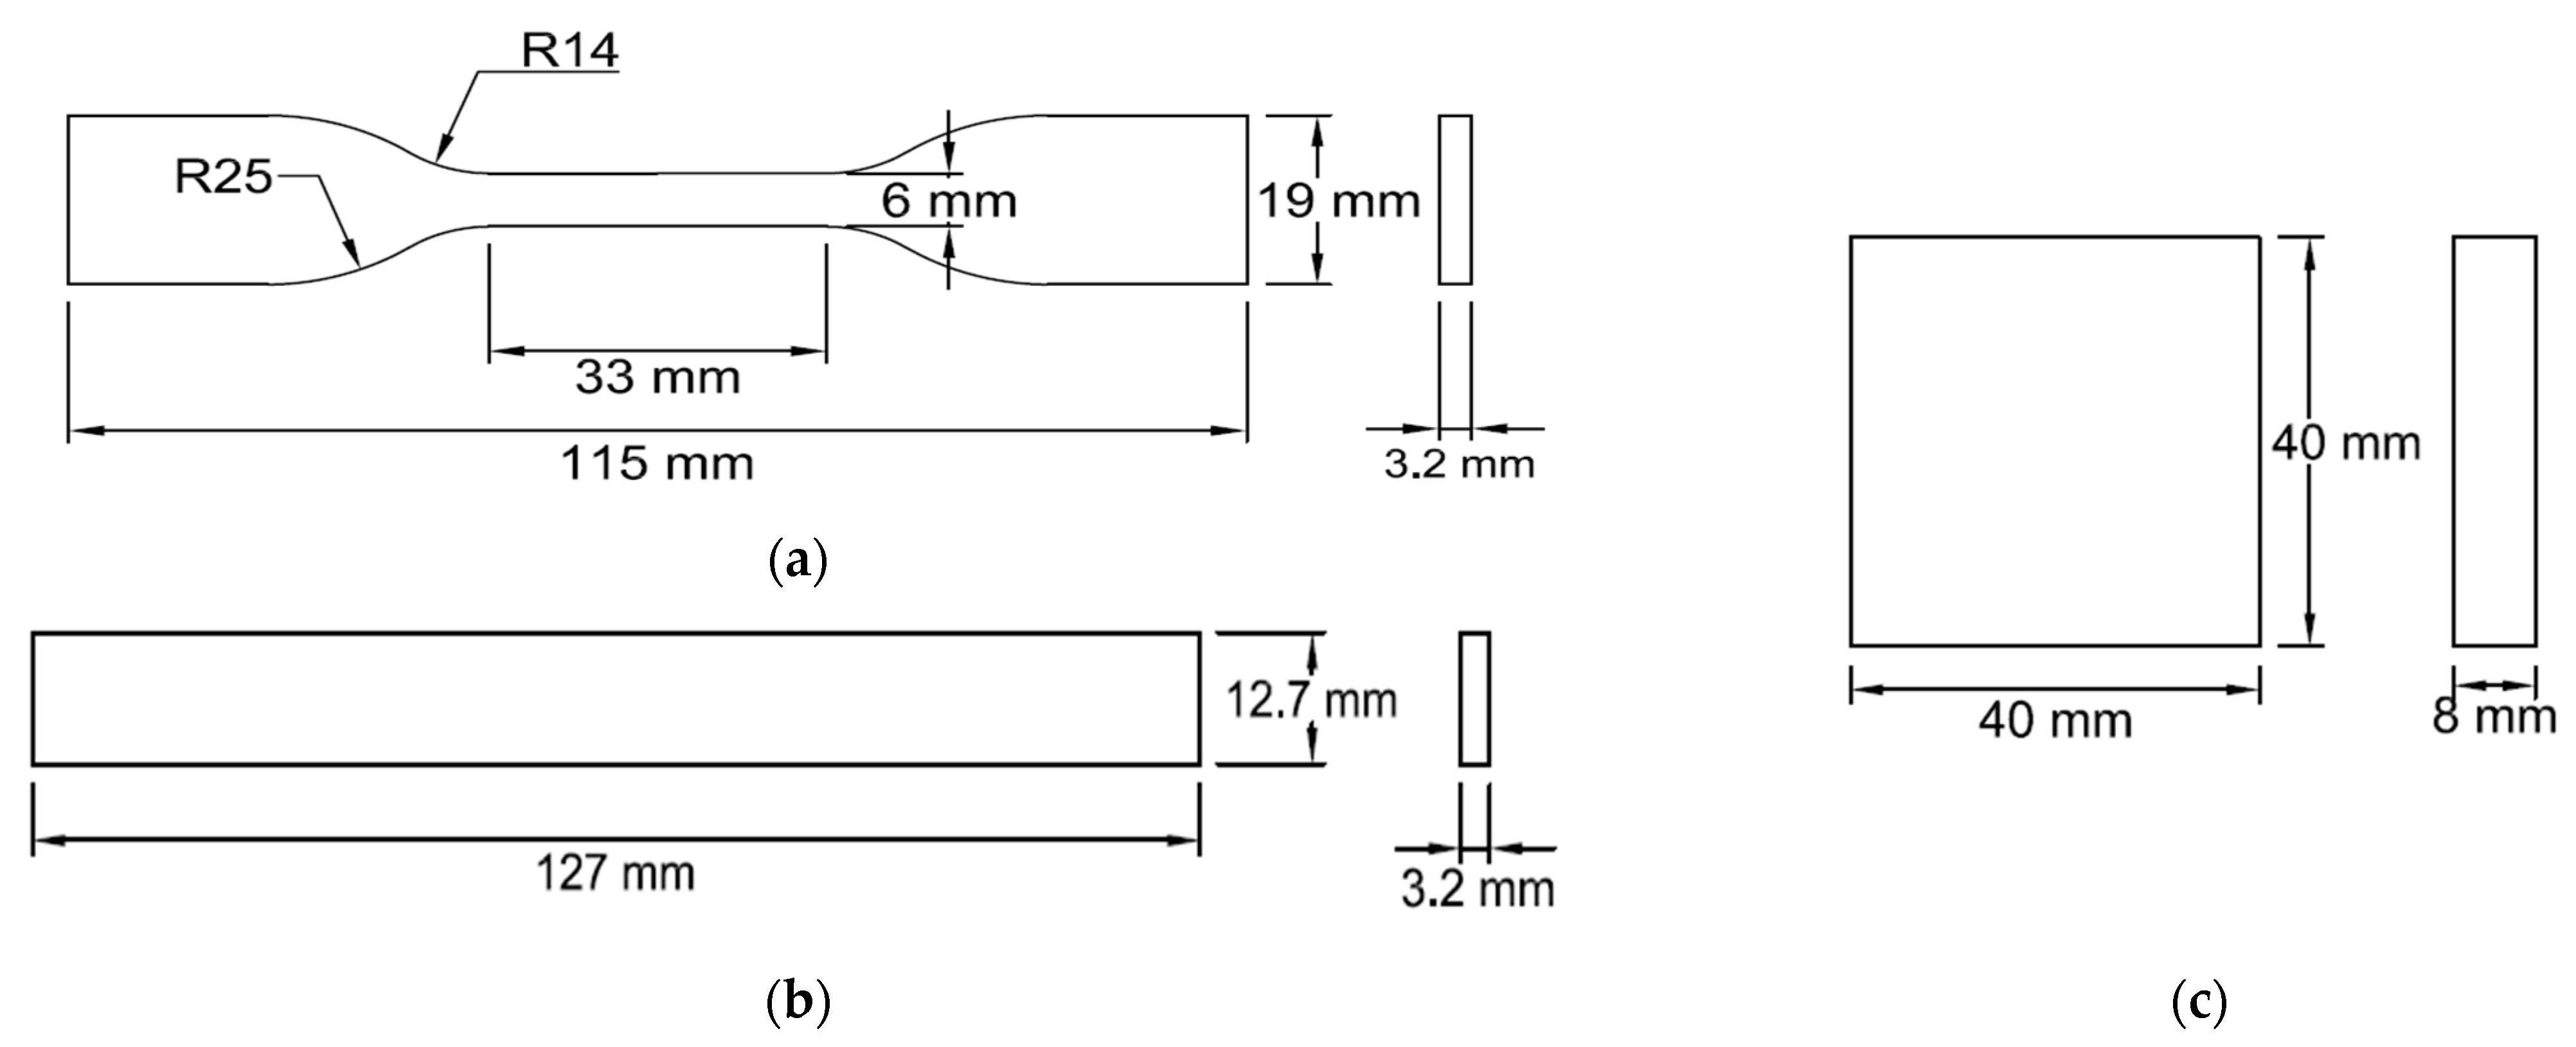

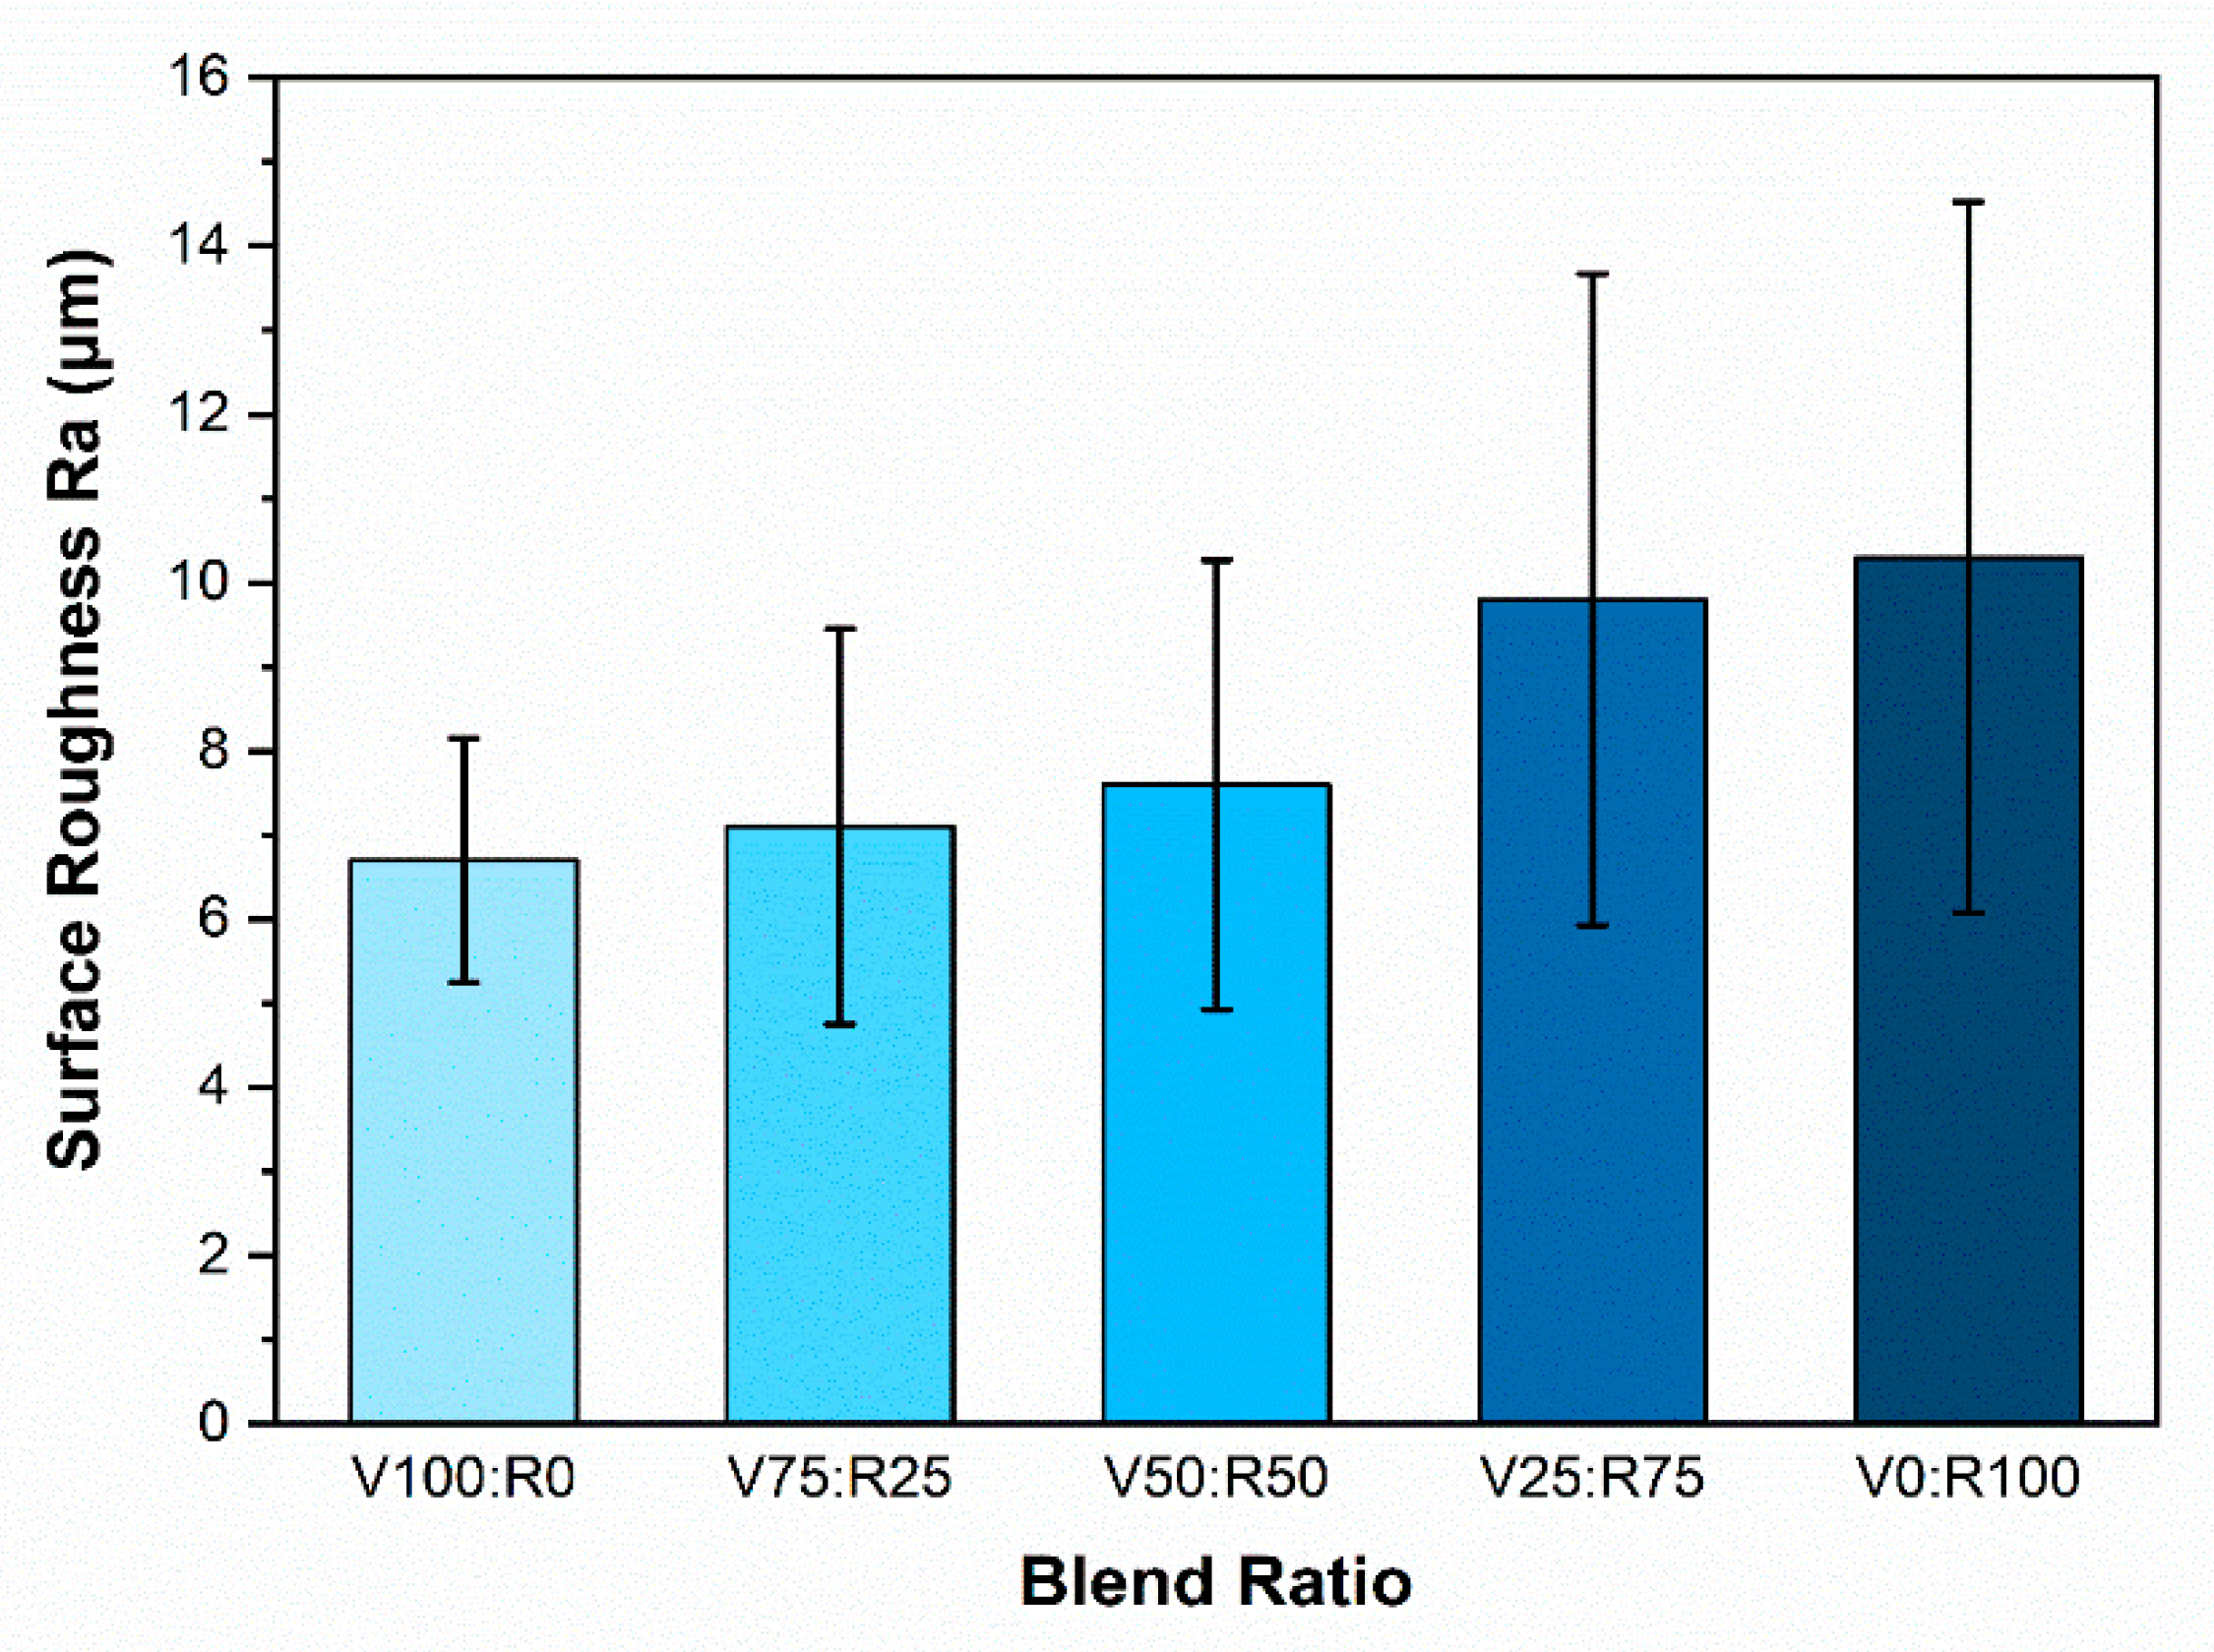
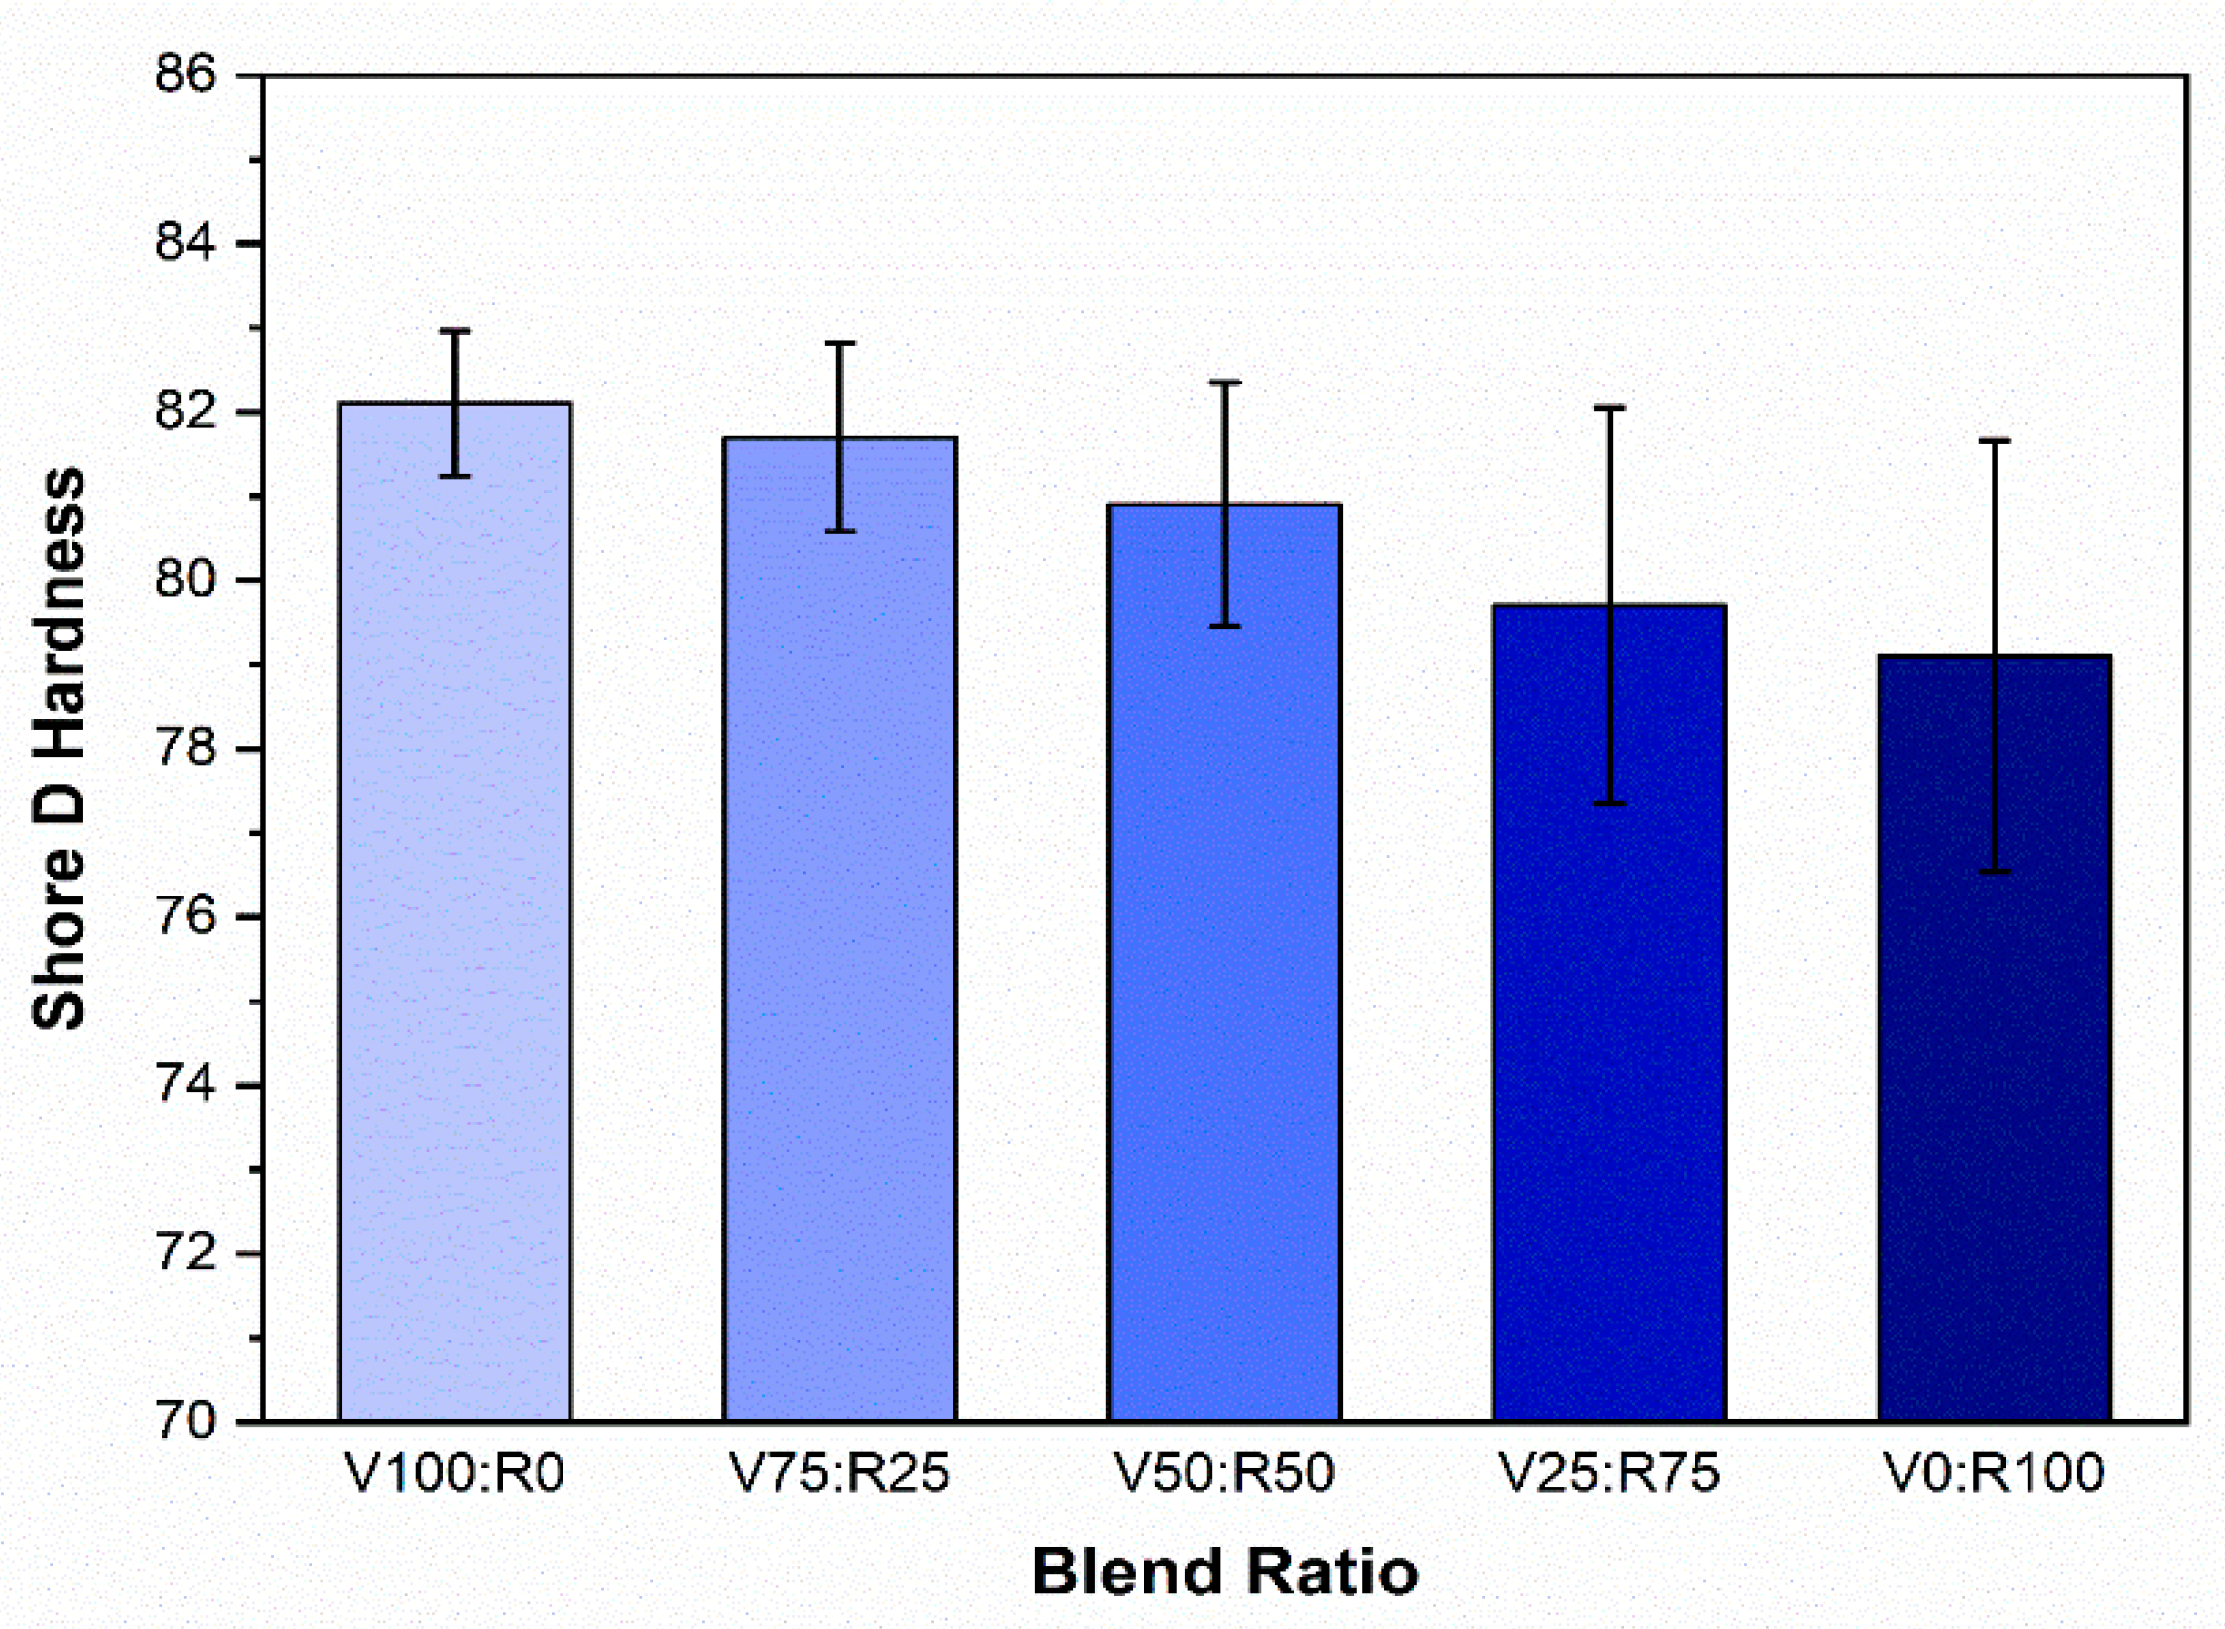
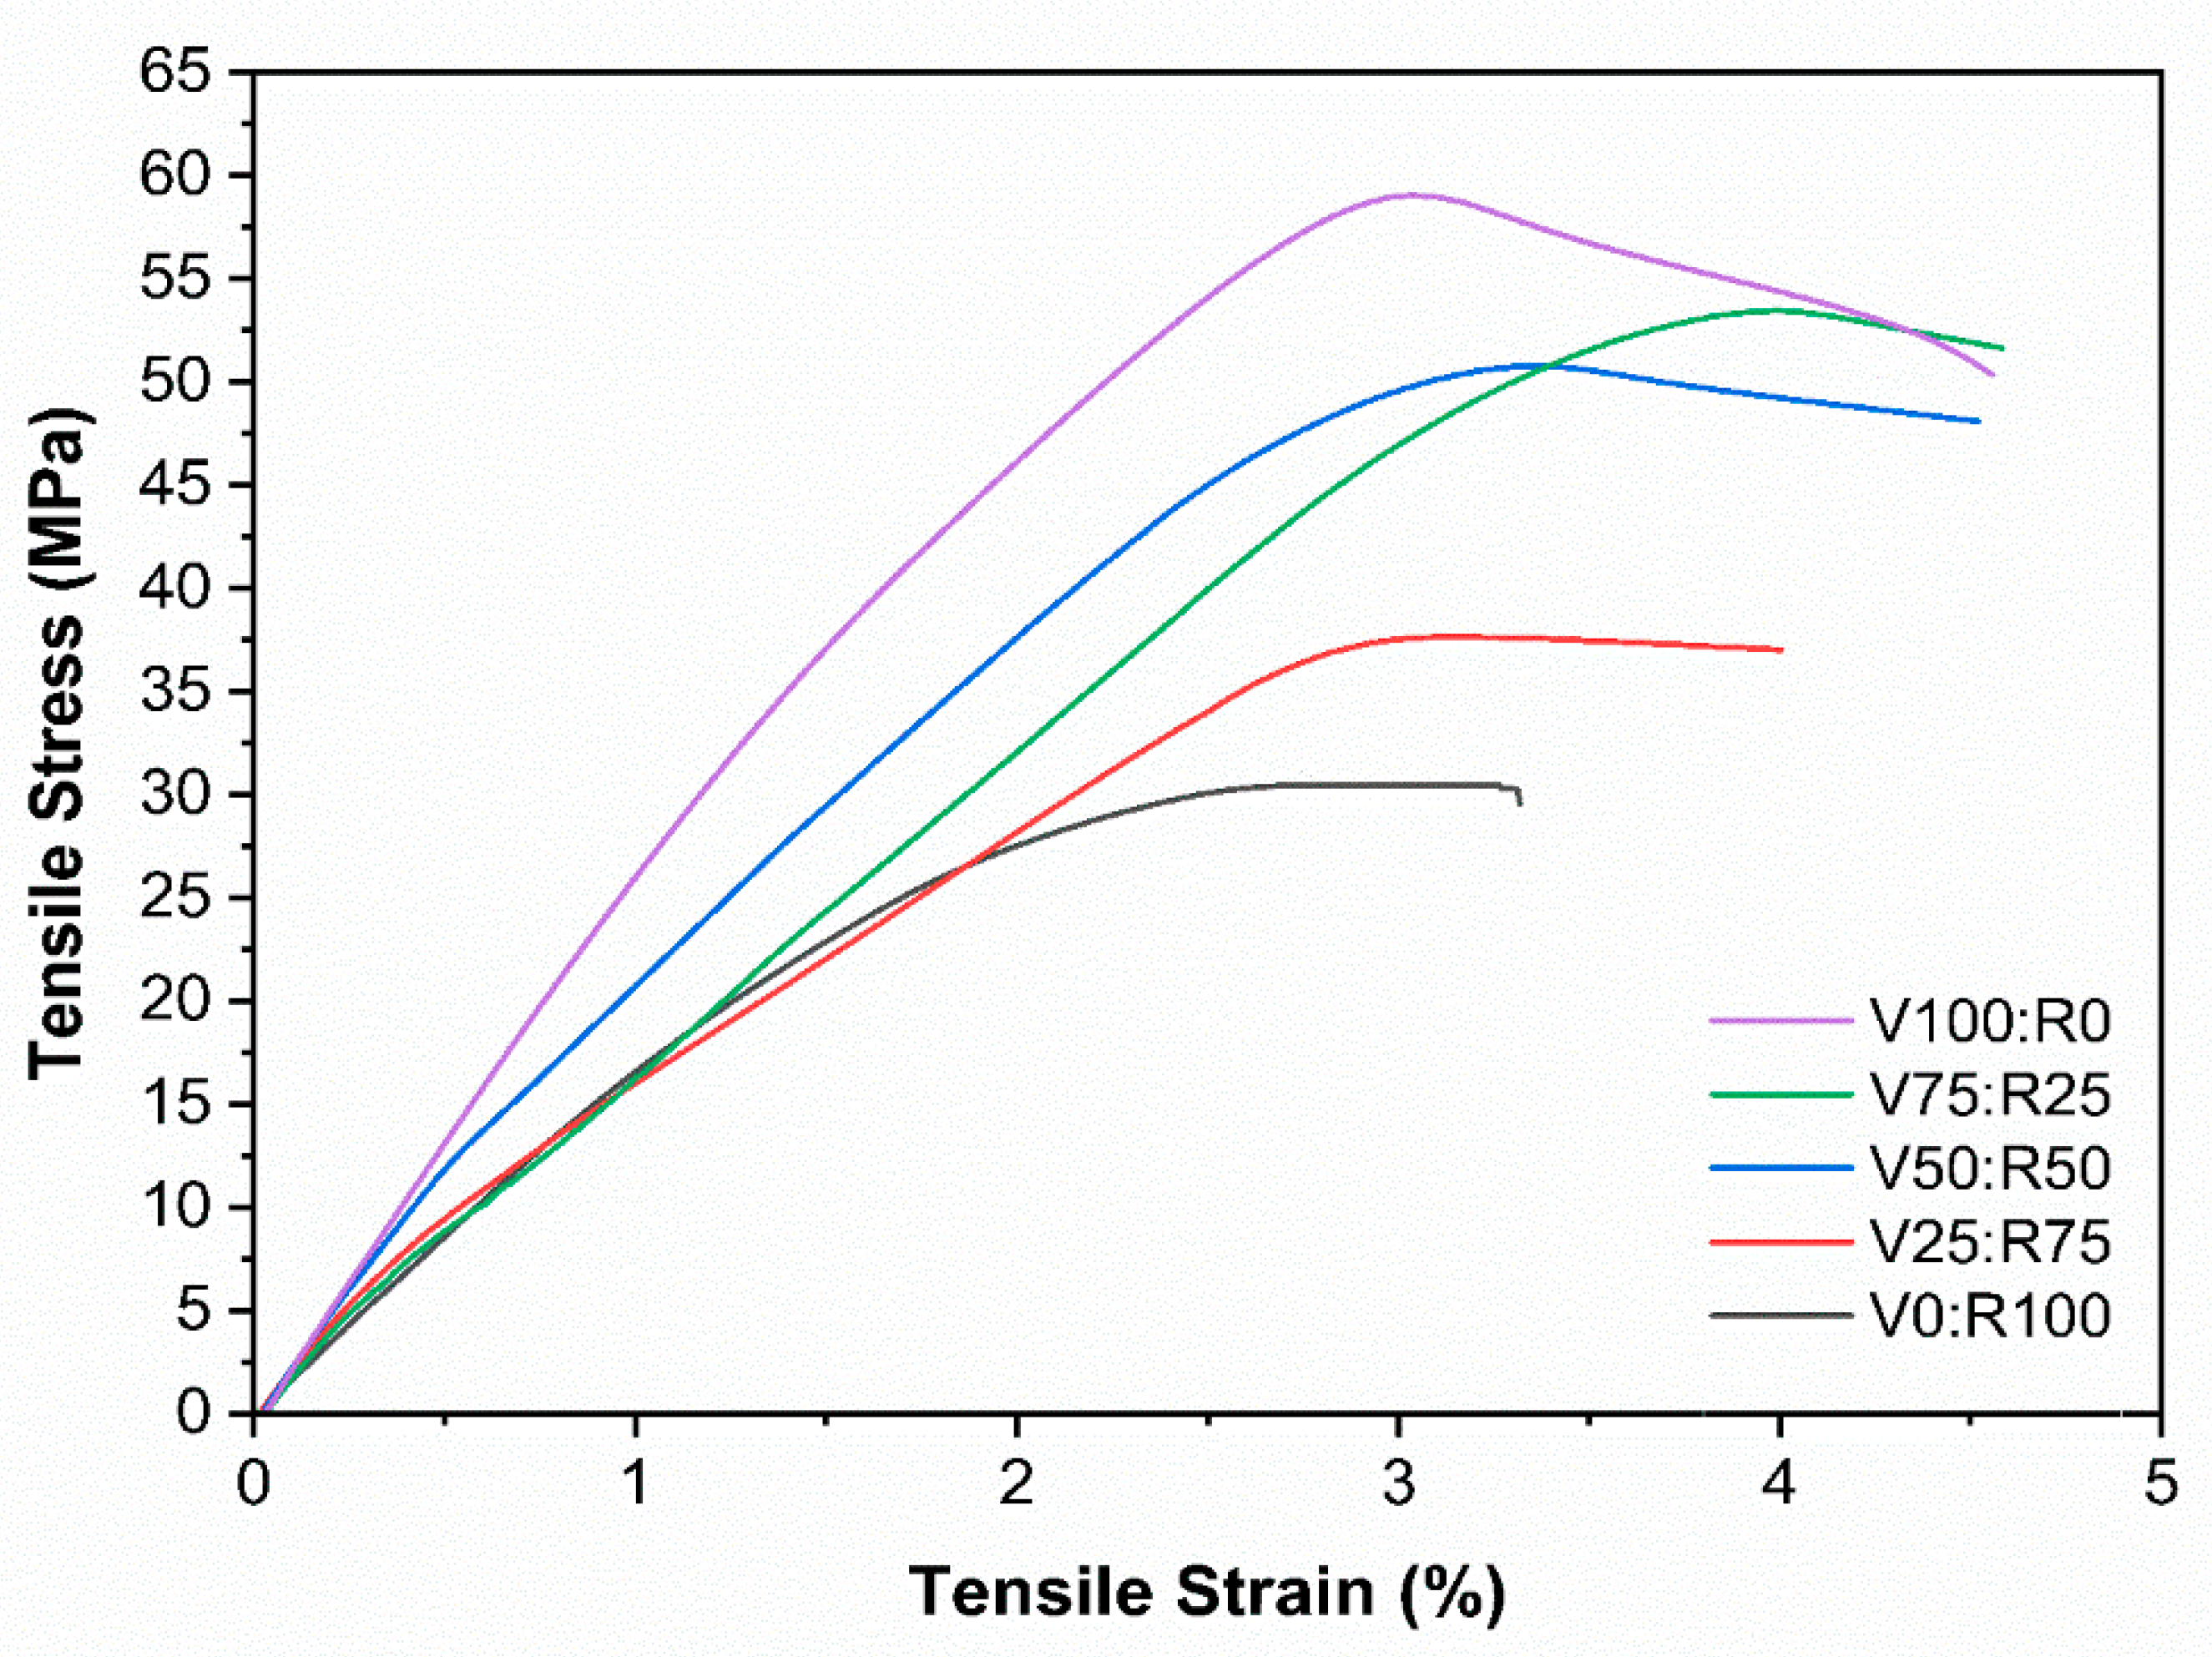
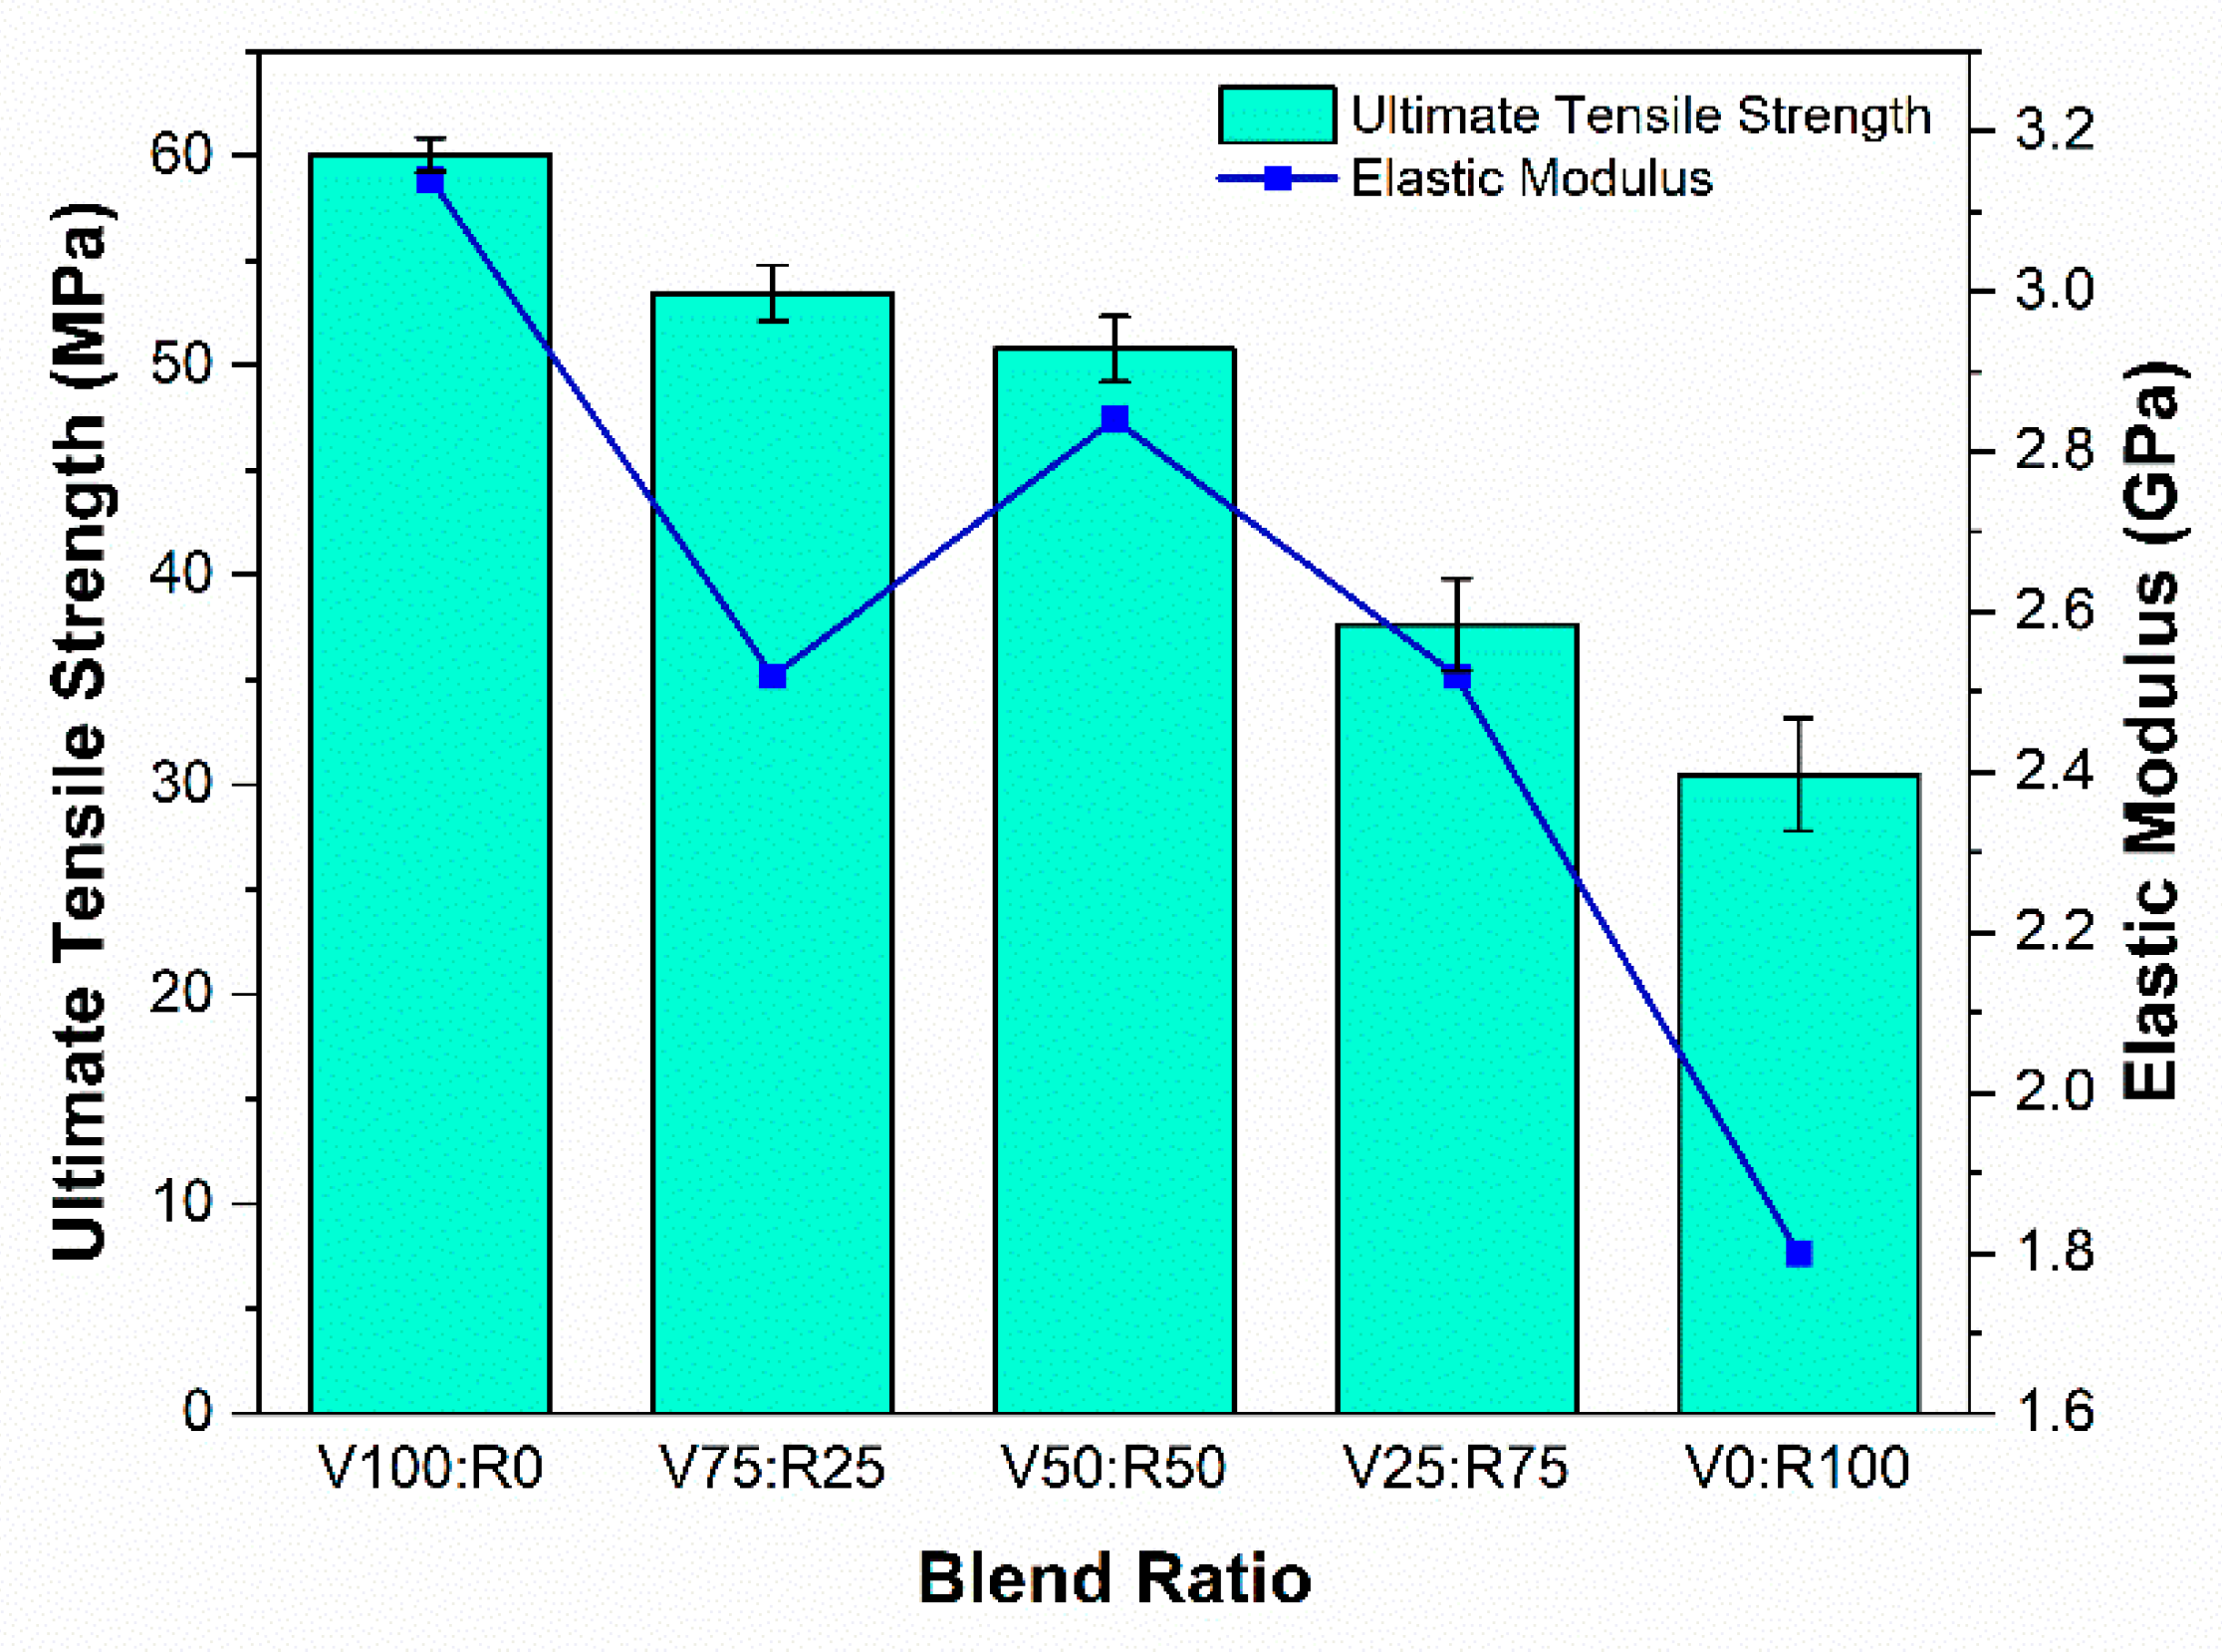
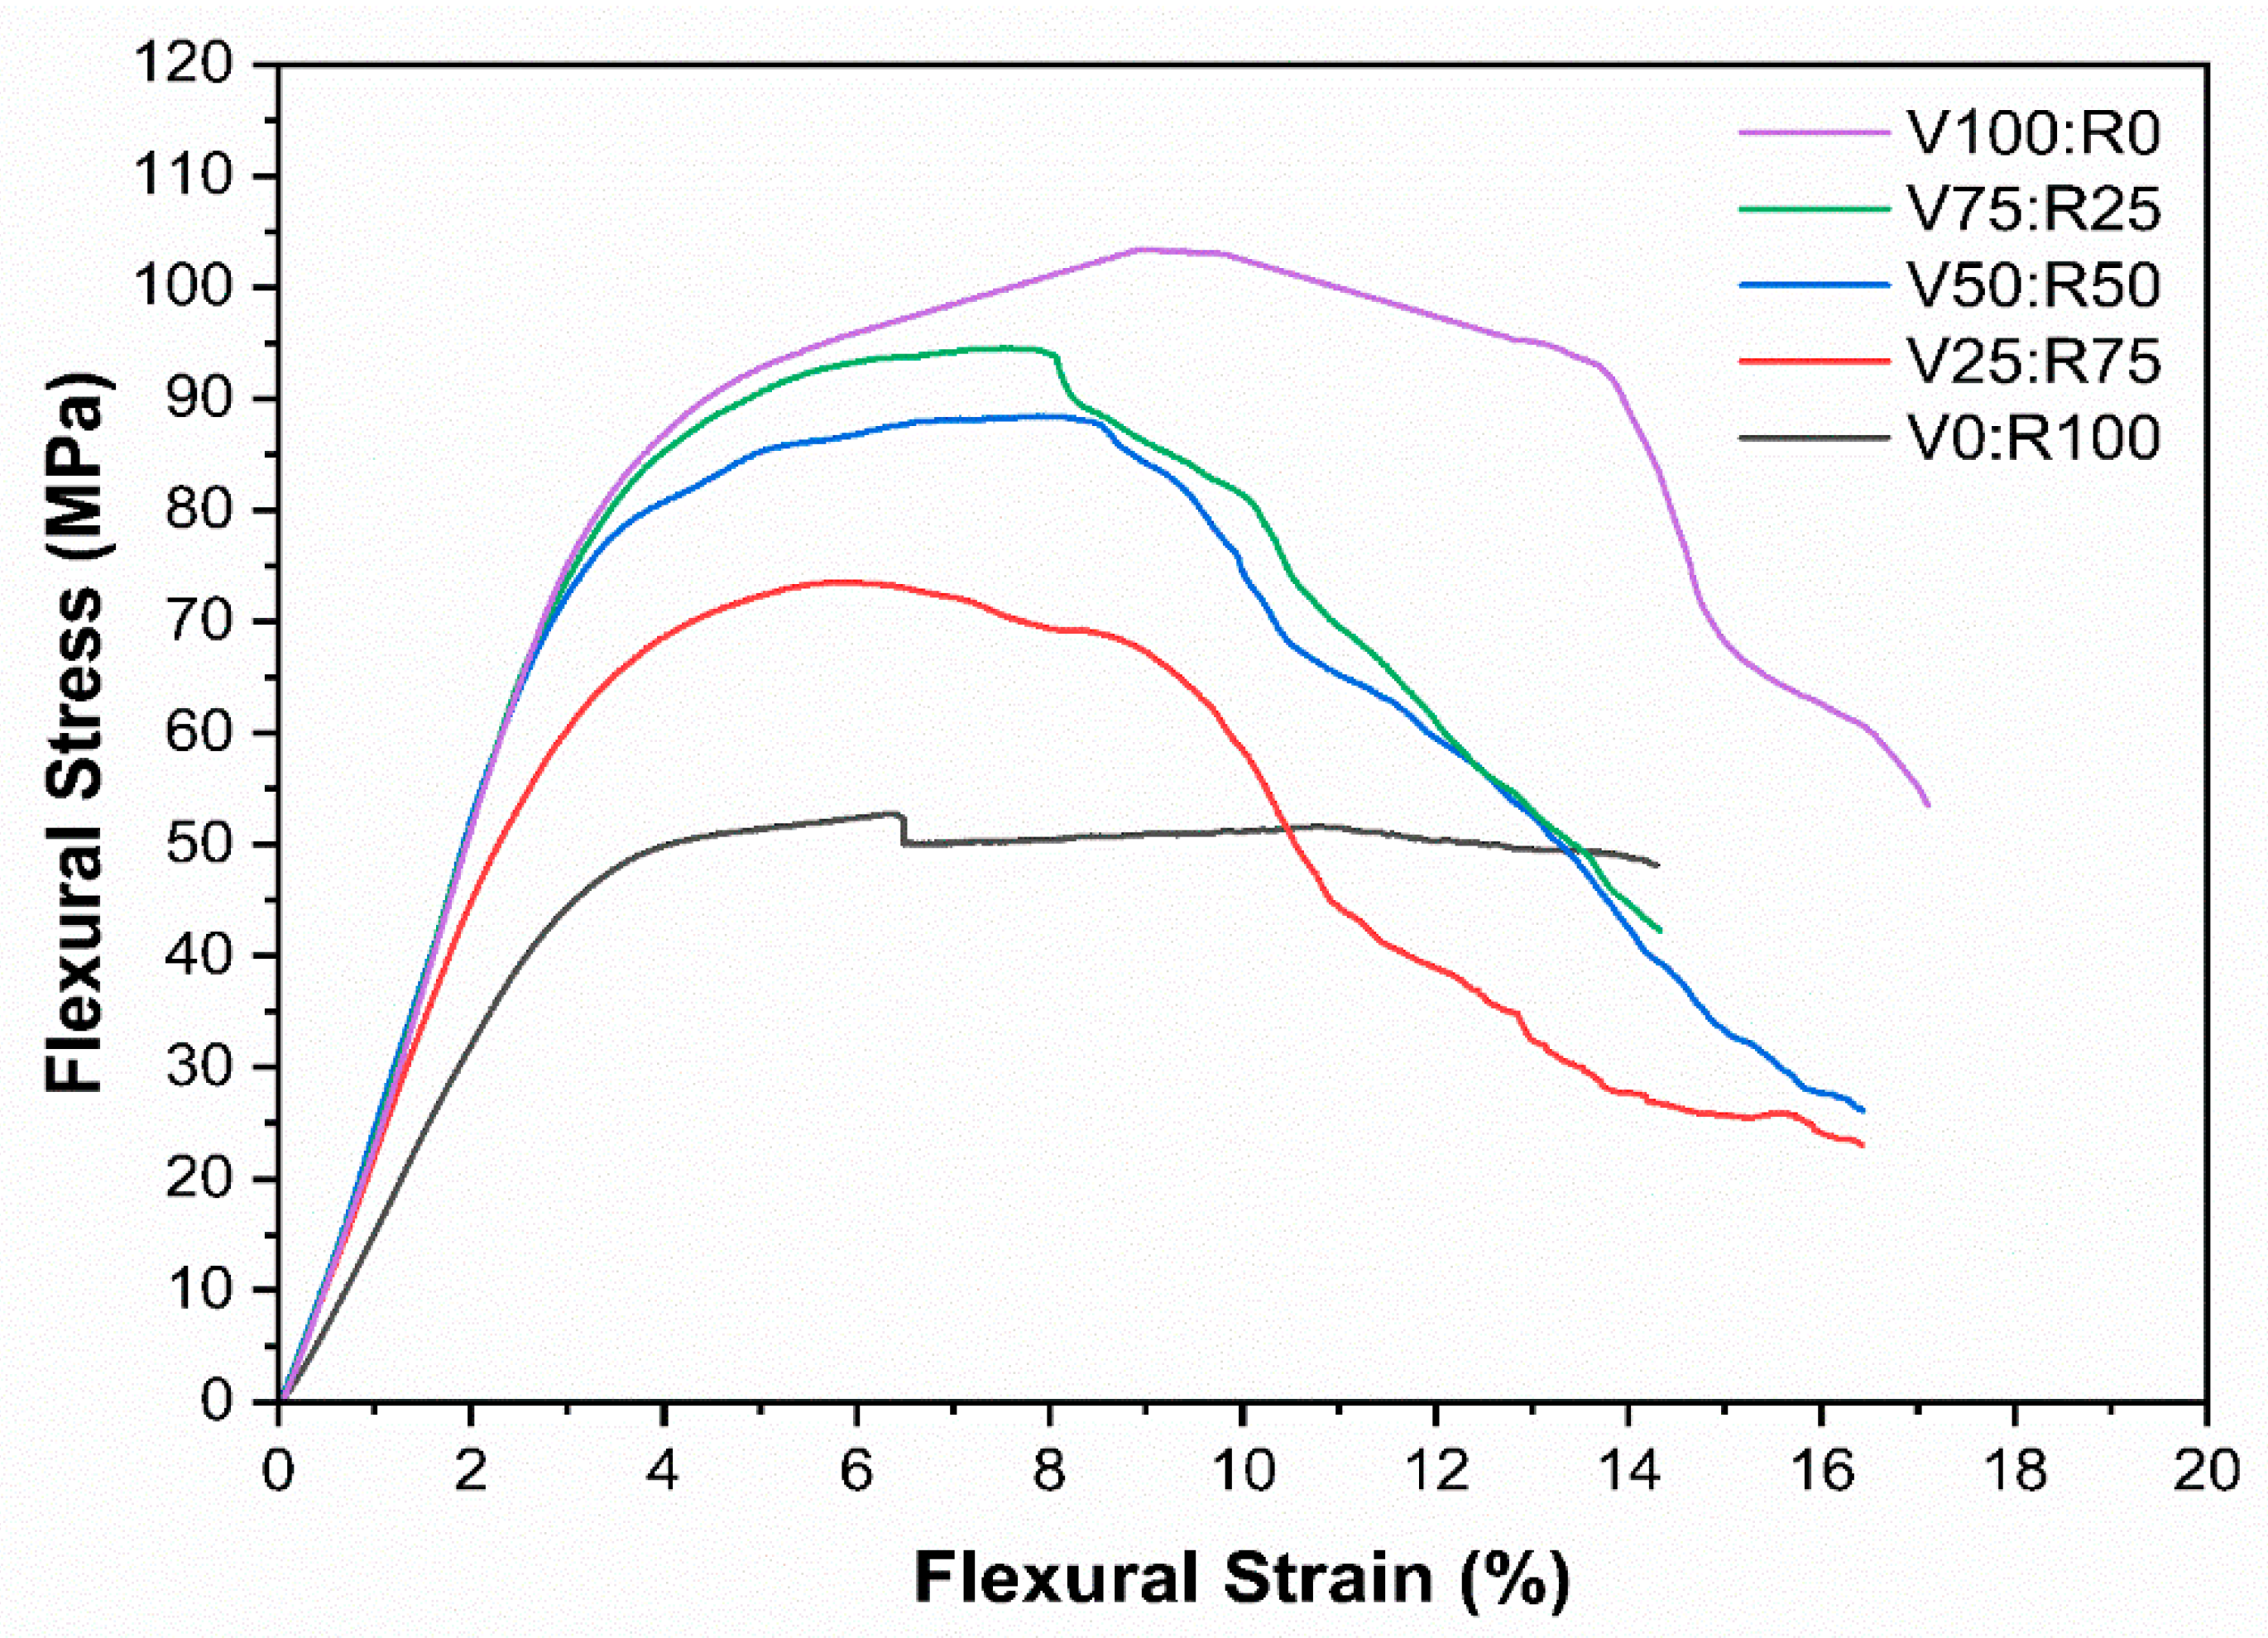
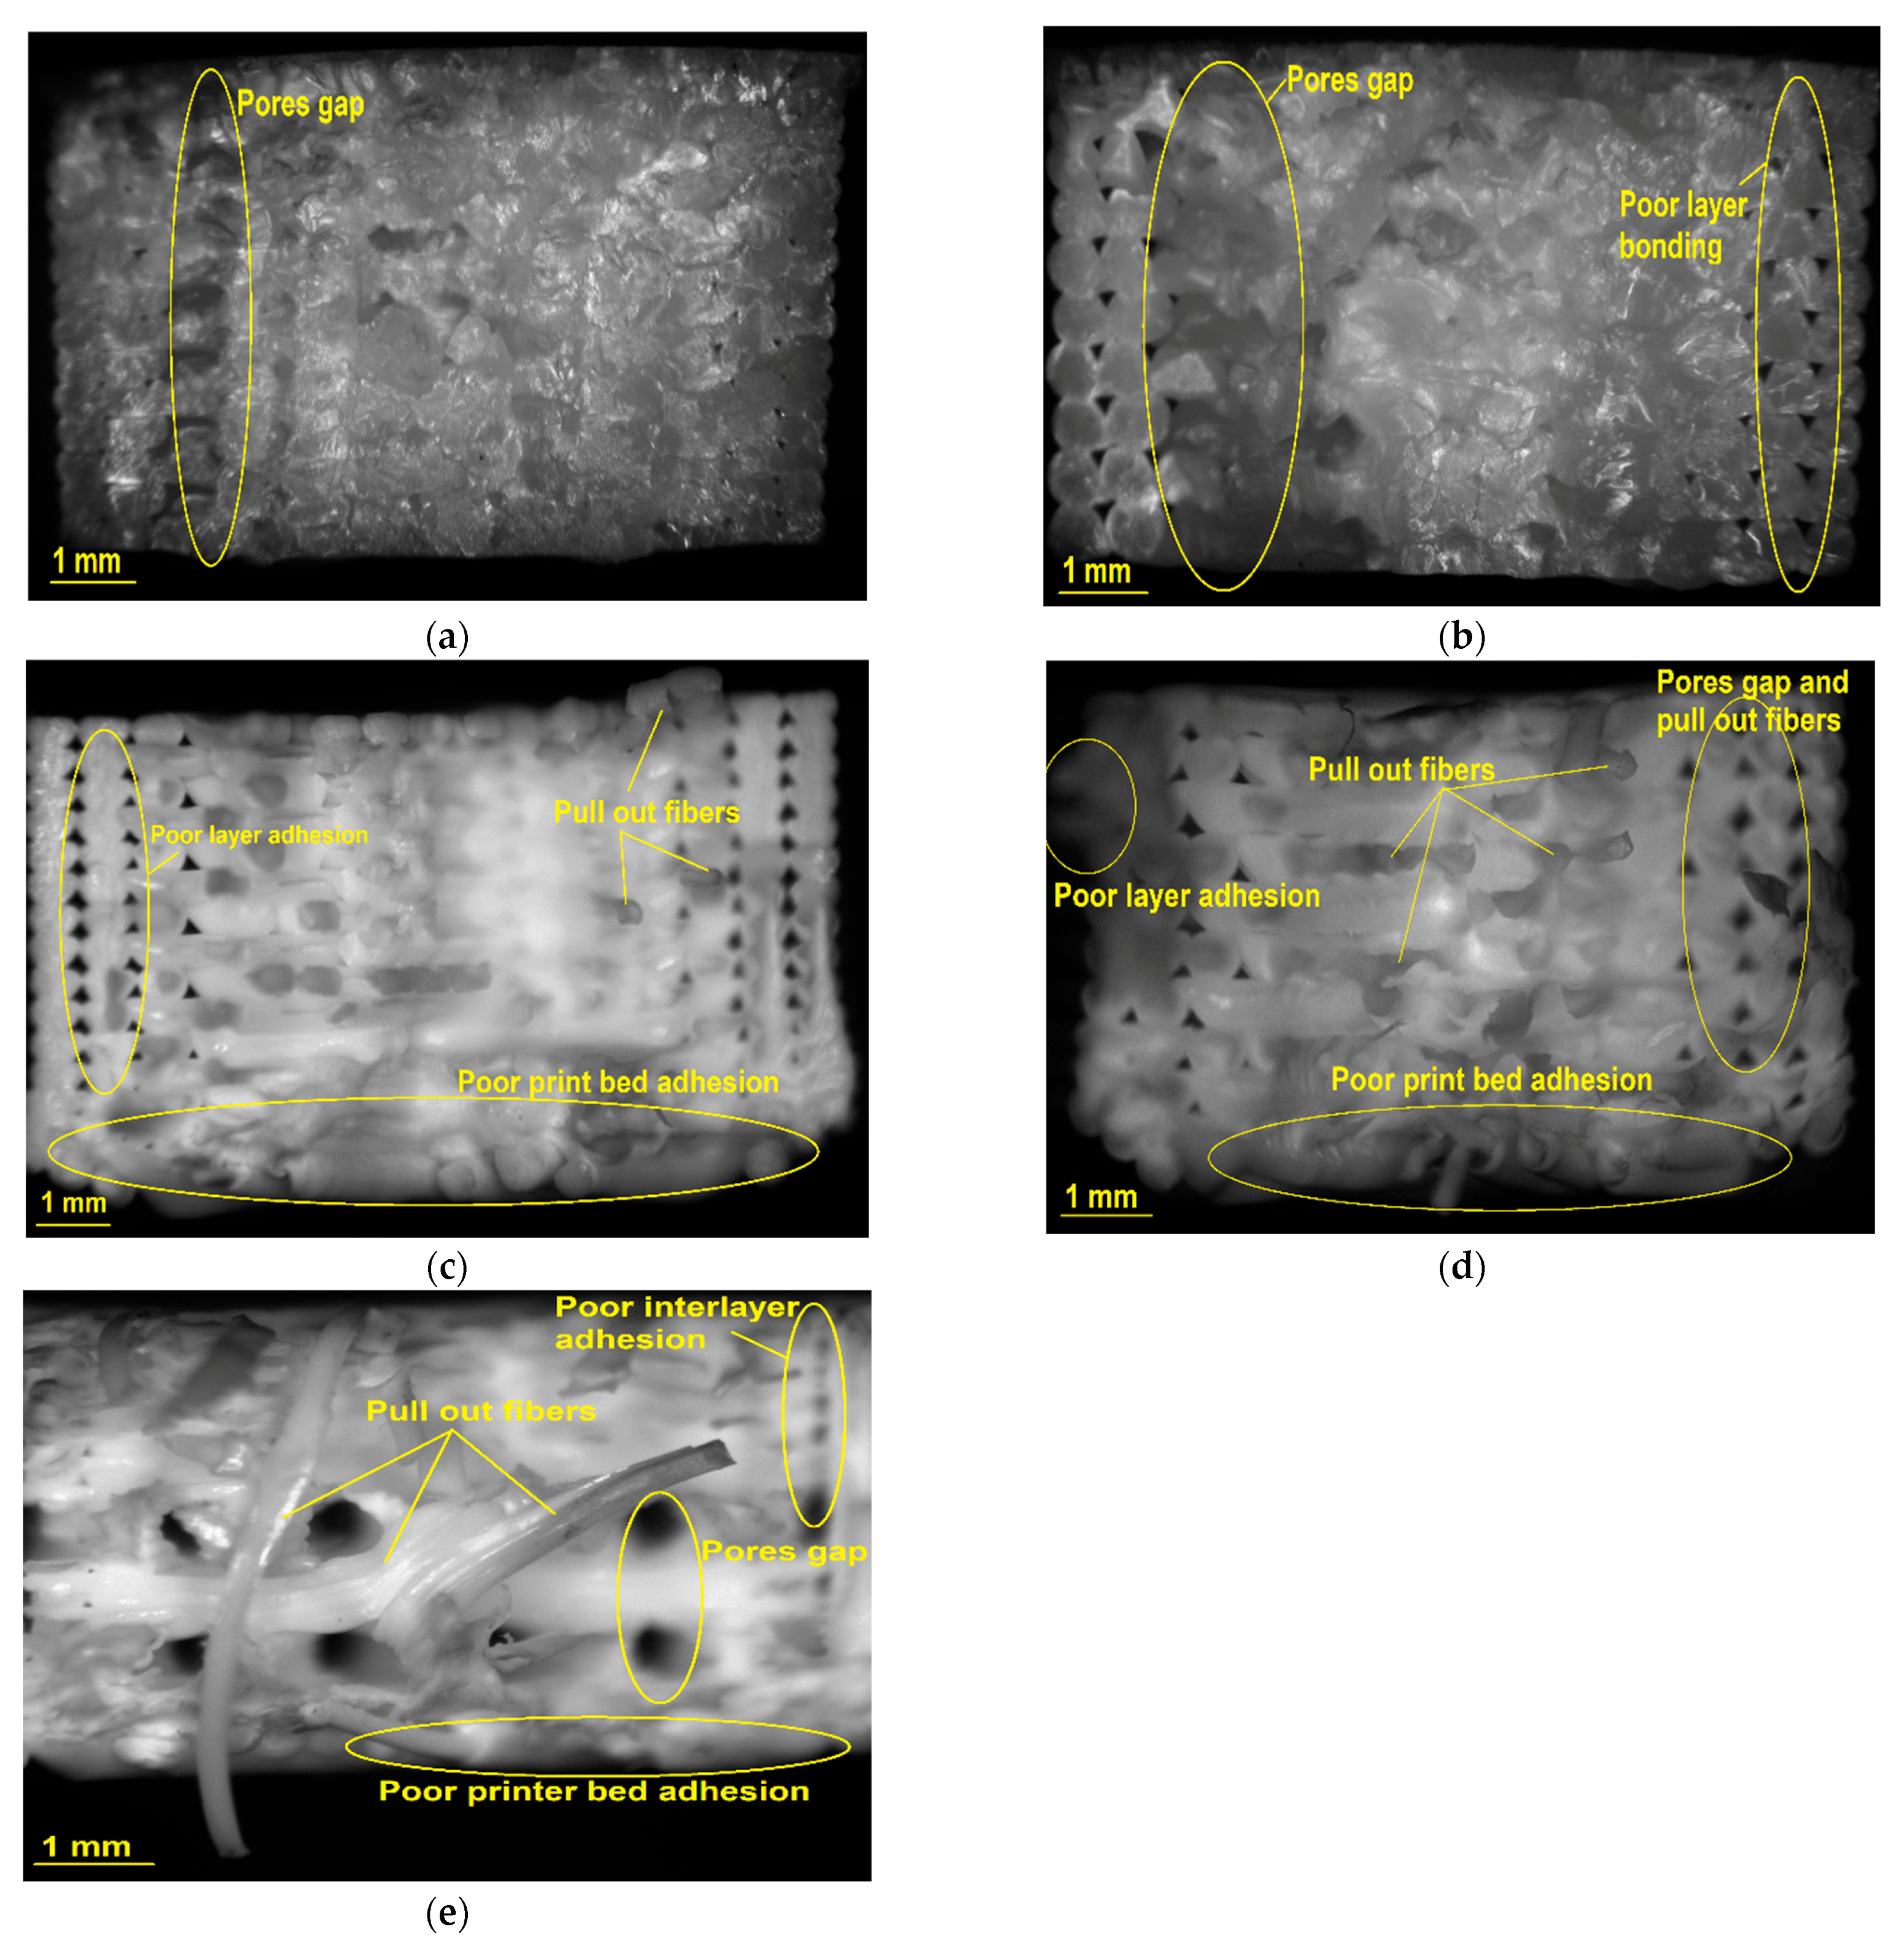
Disclaimer/Publisher’s Note: The statements, opinions and data contained in all publications are solely those of the individual author(s) and contributor(s) and not of MDPI and/or the editor(s). MDPI and/or the editor(s) disclaim responsibility for any injury to people or property resulting from any ideas, methods, instructions or products referred to in the content. |
© 2025 by the authors. Licensee MDPI, Basel, Switzerland. This article is an open access article distributed under the terms and conditions of the Creative Commons Attribution (CC BY) license (https://creativecommons.org/licenses/by/4.0/).