Article

Improving the Transport and Logistic Infrastructure of a City Using the Graph Theory Method: The Case of Astana, Kazakhstan

by
Bakyt Syzdykbayeva
1,*,
Zhanarys Raimbekov
1,*,
Ruslan Baiburiev
2 and
Zhanar Dulatbekova
1
1
Faculty of Economics, L.N. Gumilyov Eurasian National University, Astana 010000, Kazakhstan
2
Department of Recreational Geography and Tourism, Al-Farabi Kazakh National University, Almaty 050040, Kazakhstan
*
Authors to whom correspondence should be addressed.
Sustainability 2025, 17(6), 2486; https://doi.org/10.3390/su17062486
Submission received: 27 January 2025 / Revised: 6 March 2025 / Accepted: 7 March 2025 / Published: 12 March 2025
(This article belongs to the Section Economic and Business Aspects of Sustainability)

Abstract

:
The rapid growth of cities significantly impacts the development of transport and logistics infrastructure (TLI), creating substantial challenges for the transport network and quality of life. To enhance the efficiency and sustainability of TLI, various approaches, planning methods, and management strategies are employed at the city or agglomeration level. The objective of this study was to investigate, using graph theory and correlation analysis, the relationship between the polarity and logistic flow of the city’s meso-districts. Based on these findings, recommendations for the development of the city’s transport and logistics infrastructure were proposed. The logistic flow, influenced by social, economic, institutional, and environmental factors, plays a critical role in the planning and operation of transport and logistics infrastructure within each meso-district of the city. The determination of the polarity of meso-districts was conducted based on expert assessments by specialists, while the indicators of logistic flow were derived from the average values of statistical data for the period 2021–2023. The results demonstrated that a reduction in the polarity of meso-districts—characterized by multilateral connections between meso-districts and key indicators of logistic flows—can positively influence the quality and accessibility of the city’s transport and logistic infrastructure. This approach enables the identification of the most problematic meso-districts within the city, the mapping of logistic flow directions, and the determination of strategic development pathways for the city’s transport and logistics infrastructure (TLI). Furthermore, it was established that the polarity of the meso-district graph reflects the state of traffic congestion within the districts and its environmental impact. This correlation provides valuable insights into refining the planning and development of the city’s TLI, ensuring a more sustainable and efficient urban transport system. This study contributed to the development of the city’s transport and logistics infrastructure by proposing a comprehensive model that enhances the understanding and strengthens the interconnections between meso-districts and urban logistics. The findings hold significant implications for urban planning, as they highlight the necessity of a detailed consideration of the role of meso-districts, as well as targeted investments in transport and logistics infrastructure to ensure its sustainable development in the future.

1. Introduction

In the context of urbanization, the constant increase in the volume of freight and passenger flows within cities leads to significant challenges, including traffic congestion, environmental degradation, and a decline in the quality of life. In order to solve them, planning and rational placement of logistics and transport infrastructure in cities [1]; planning the movement of goods and passengers [2]; determining the location of urban areas, socio-cultural and logistic facilities [3]; and applying corporate management and social responsibility in the management of urban logistic facilities [4] all play significant roles.
One of the key challenges in urban planning is the inefficient placement of industrial, socio-cultural, and administrative facilities, which significantly impacts the transportation system and the quality of life of the population. The uneven and irrational distribution of these facilities across the city and its surrounding areas can influence the direction of development for transport and logistics infrastructure [5]. This is often due to the low density and underdevelopment of logistics infrastructure [6], which not only affects the movement of goods within the city but also impacts the urban environment [7] and last-mile logistics [8].
Transport and logistics infrastructure has a significant impact on the quality of service for freight and passenger flows in Kazakhstan, as well as on the increase in the number of attracted tourist flows to the country’s tourist sites [9]. Evaluation of the efficiency of the transport infrastructure in Kazakhstan shows a decline in its indicators. For example, in the IMD World Competitiveness Ranking by the “Infrastructure” criterion in 2023, there has been a deterioration in Kazakhstan’s indicators (a decrease from 46th to 47th place) among 67 countries in the world [10]. In the Logistics Performance Index (LPI) of the World Bank, Kazakhstan ranked 79th among 138 countries in 2023. Of these, according to the “Quality of Transport Infrastructure” criterion it was ranked in the 80th place (in 2018—81st place) [11]. In the latest version of the Travel and Tourism Development Index (TTDI) for 2021, Kazakhstan ranked 66th out of 117 countries [12] overall and for “Ground and port infrastructure”—air transport, roads, railway lines and stations—80th place, and “Air transport infrastructure”—capacity of airlines, number of destinations—73rd place.
The problems of transport and logistics infrastructure in large cities of Kazakhstan (Astana, Almaty and Shymkent) are insufficient integration of suburban areas, congestion of the transport network, insufficiency and uneven distribution of logistic, industrial, socio-cultural and trade facilities throughout the city. These problems can be solved by the presence of an intelligent transport system (ITS), smart traffic lights, logistic services for the distribution of small loads through self-service terminals [9], etc.
The city of Astana, located on the Ishim River, on an area of 797.33 square kilometers, was chosen as the object of this study. Currently, the city’s population is more than 1.50 million people, but the city is developing dynamically, and by 2035, the estimated population will be 2.5 million people [13]. Due to the active population growth, the need for housing, connection links and communications is growing. The growth of the population and the number of transportation, socio-cultural (restaurants, cafes, schools, shops, etc.), tourist and administrative facilities are proceeding at a high rate, outpacing the growth of the transport and logistics infrastructure.
Astana and its suburbs are a monocentric agglomeration. However, the new general plan for the development of Astana until 2035, adopted in 2023, provides recommendations for the development of a polycentric urban development concept [13].
The new concept provides for an increase in the length of streets and roads, the number of bus stations, railway stopping stations, and the completion of a light rail line. It is planned to increase from 2024 to 2035 the density of the street and road network (km/km2)—from 4.4 to 5.2; the number of cars (thousand units)—from 347.2 to 583.9; the level of motorization (cars/thousand residents)—from 235 to 260; and the number of automobile interchanges at different levels—from 24 to 41. Over the past three years (2021–2023), there has been an increase in freight turnover by an average of 12.3%, passenger turnover—3.5%, tourist flows—40.6%, the number of personal cars—16.1%, retail trade—by 23.6% per year.
As can be seen from these data, the multiple increases in transport, logistic, retail and freight turnover indicators in the coming years cannot be achieved without significant development of the existing and the creation of new transport, logistic and trade capacities. This will require new approaches to the research and development of a strategy for the development of transport and logistics infrastructure in large cities.
Despite numerous scientific developments on the choice of location of transport and logistics facilities in cities, their planning and design, as well as the assessment of the effectiveness of their activities, it can be stated that the existing solutions to the scientific problem around organizational and methodological support for the formation of logistics infrastructure in cities requires more detailed study [14].
The localized approach to addressing problematic areas of logistics infrastructure within individual cities or districts fails to optimize material and human flows across the logistics infrastructure as a whole. This approach disrupts the efficiency of supply chains, limits the overall effectiveness of urban logistics, and creates issues such as an uneven intensity of transport flows and imbalanced development of the city’s logistics infrastructure (CLI) [6,7,14,15].
From our point of view, this is due, firstly, to the specifics of the functioning of logistic infrastructures in cities related to servicing cargo and passengers and their impact on the environment. Secondly, a significant limitation lies in the methodological toolkit, which lacks scientifically grounded criteria for evaluating the rational placement of logistic facilities. This deficiency has shaped the choice of research objectives and tasks. In the context of limited urban space, high population density, and the complex structure of transport and logistics infrastructure, this issue demands a scientifically justified approach that takes into account multiple factors influencing the selection of locations and the efficiency of the logistic system [14,16].
Currently, large cities are facing a significant shortage of high-quality transport and logistics infrastructure, necessitating the development of smart city infrastructure and intelligent systems for urban logistics [17]. This issue continues to worsen annually, with increasing costs for accessibility, further deteriorating the quality of life [18].
To solve the problem, the issue of proper planning of the development of TLI is becoming acute, based on the capacity and sources of logistic flows, their location and functioning. At the same time, the location of most buildings in meso-districts without internal streets indicates insufficient transport accessibility inside [10]. Because of this, the entire load falls on the main streets along the perimeter, without the possibility of distributing vehicles along smaller streets.
Modern theoretical and empirical research on the development of a city’s transport and logistics infrastructure (TLI) using graph theory or other methods primarily focuses on macroeconomic and fragmented analyses of large cities, often insufficiently accounting for intra-urban logistic flows. These studies frequently overlook the actual configuration and location of social, industrial, institutional, and environmental infrastructure facilities within the city. Empirical research requires consideration of the configuration, density, and other factors specific to the urban territory, as well as their interrelation with TLI accessibility. Existing studies employing graph theory methods do not incorporate all factors characterizing urban logistic flows, nor do they explore the relationships between meso-districts and the accessibility of social, industrial, institutional, and environmental infrastructure facilities and their impact on TLI development. These gaps lead to distortions in planning processes and reduce the sustainability of TLI development.
The purpose of this study was to use graph theory to improve methodological tools for the formation and development of urban logistics infrastructure using the example of Astana (Kazakhstan). This study focuses on determining the relationship between the location of city logistics infrastructure facilities in the city’s meso-districts, their impact on the availability of TLI, and, based on this, identifying the direction of its development.
The originality of our research lies in the integrated consideration of transport, socio-economic, institutional, and environmental factors for the development of transport and logistics infrastructure (TLI) at the level of individual meso-districts, rather than solely at the city-wide level. This approach takes into account the transport, urban planning, and functional characteristics of each specific territory (meso-district).
This study focuses on the objects of the transport and logistics infrastructure that ensure the full functioning of the process of transportation of goods and passengers: economic (transport, logistics, industry, trade, information and communication); social (social-cultural objects); institutional (government bodies, financial and insurance institutions, marketing organizations, etc.); and environmental (land resources, the presence of municipal waste and emissions of pollutants into the atmosphere, environmental costs) related to the group of system-forming factors influencing the development of the transport and logistics infrastructure.

2. Literature Review

2.1. Theoretical Approaches to the Formation of a City’s

Transport and logistics infrastructures play a vital role in the functioning of a city, influencing the efficiency and availability of cargo and passenger transportation and the city’s attractiveness for tourists. Most publications on freight or passenger transportation in urban areas consider the activities of shippers or carriers, planning and routing of delivery vehicles, planning freight distribution, and optimizing passenger flow [19,20]. Transportation is carried out throughout the entire city, but due to the differences in the density of land use in each part of the city, organizational and technological solutions for TLI also differ.
In studies [20,21,22], two- and three-tier hub planning systems are presented, where the first tier is located on the outskirts of the city, the second tier in the city center, and the third tier in consumer districts. The authors argue that such a multi-tier hub system enhances the motivation for competitors to collaborate and reduces the transport burden on the urban environment.
Applications in cities of intermodal logistic platforms [22], innovative technologies (information and communication technologies) [23], and intelligent transport systems [24,25] contribute to the implementation of effective measures for the placement and management of transport and in urban logistics. Among the studies that reveal to one degree or another the problems of forming a logistics infrastructure, the works of D.J. Bowersox, D.J. Kloss [26], M. Christopher [27], J. Mangan [28] and others should be consulted. One of the modern approaches to building a logistics infrastructure in a limited area was proposed by the American economist E. Hoover [29] and generalized by Russian scientist V.I. Sergeev [30]. The issues of designing effective logistic distribution and warehouse networks are considered in the works [31,32].
During the practice of creating logistics infrastructures in the city, the joint functioning of elements of the logistics infrastructure in individual administrative–territorial entities of the city often remain uncoordinated, which leads to disproportion in the development of the CLI [33]. In the formation of the logistic system and its infrastructure, a certain role is played by the integral paradigm, in which, at present, the concept of supply chain management (SCM) is becoming relevant. SCM in the framework of this study is applied in the management of flows through functional objects of social, economic and institutional infrastructure.
Transport infrastructure plays a pivotal role in shaping the urban spatial structure, evolving over time under the influence of urbanization processes. While industrial parks previously dominated, there is now a shift toward commercial centers [34]. One of the contemporary challenges is the growth of e-commerce, which has led to an increase in the number of distribution centers within cities. In response, a new framework for integrating freight transportation, urban land use, and infrastructure management is proposed [5]. This integration is grounded in the principles of economic geography, including location, agglomeration, and urbanization, as well as spatial analysis and clustering methods to identify optimized zones for freight movement [35].
Tourism also exerts a positive influence on the development of urban logistics by fostering improvements in public transport and traffic flow management. Ensuring sustainable transport and tourist flows necessitates the establishment of integrated logistics centers, the development of urban light rail systems, and the management of urban traffic flows with consideration for tourist activity. Additionally, it requires the development of rural areas adjacent to cities [36,37,38].
Thus, the city’s transport and logistics infrastructure have a complex impact on cargo transportation, passenger traffic and tourism development. The issue of planning and developing transport and logistic facilities in the city should take into account not only external factors, but also the placement and interconnection of facilities located within the city’s meso-districts, which affect sustainability, environmental friendliness and quality of service, and are key to creating a comfortable urban environment.
The analysis of scientific literature has revealed a substantial body of work proposing mathematical methods, models, and approaches for determining the optimal location of transport and within cities or regions. The methods for identifying the location of logistic facilities can be categorized into two main groups:
  • Simple Methods and Models: These include the Ardalán method for warehouse location optimization [39], Ruttan’s model of the optimal market service area [40], and methods of commercial attraction and center of gravity [41]. These approaches rely on a significant number of assumptions and provide a rapid assessment of potential logistics infrastructure.
  • Complex Methods and Models: These encompass network modeling methods for optimizing the location of logistic facilities [42], discrete and continuous optimization [43], and graph theory [44,45,46,47]. These methods offer more advanced and detailed analyses, enabling a comprehensive evaluation of logistics infrastructure placement.
The limitations of these methods include the constraint of space to graph nodes and low computational efficiency when dealing with a significant number of potential locations for key components of transport and warehouse infrastructure. The models and methods for selecting the optimal location of logistics infrastructure facilities provide only approximate solutions and do not simultaneously allow for determining their capacity or the type of goods handled [14]. Furthermore, they fail to account for the relationship between the configuration of a specific region or city and its development indicators.
When there are significant number of possible locations of facilities, approximate heuristic methods are used [48]. These methods allow for obtaining a location of the network of transport and warehouse infrastructure facilities close to the optimal one “in a reasonable time”.
To solve the problems of the functioning of the logistics infrastructure and the formation of its development vectors, the application of graph theory, which integrates the analytical capabilities of logistics and mathematical analysis, is of interest. The application of graph theory to the problem of the layout and placement of objects has been widely studied [46,47]. At present, there are many methods in graph theory for solving general problems. Authors who applied graph theory in the formation and evaluation of individual aspects of logistic systems [26,27,30] solved various problems in logistics. In studies [49,50], the application of graph theory has been proposed for developing methods to identify strategic directions for the development of a city’s logistic infrastructure (CLI). This approach is based on dividing the urban territory into small territorial units—meso-districts—characterized by similar levels of infrastructure development. However, this approach lacks a methodology for selecting parameters to define the boundaries of meso-districts, and it requires extensive data and complex computational algorithms.
The conducted analysis of scientific literature allowed us to identify a significant number of works that propose mathematical methods and models or approaches to determining the location of a network of warehouses, transport and logistics terminals in a region [14]. To select indicators in each group of factors, an analysis of the most frequently used indicators was conducted.
From the presented review, it is evident that the application of graph theory optimizes transport flows and identifies directions for the development of a city’s transport and logistics infrastructure (TLI) [47,49,50,51,52]. However, empirical data indicate that the relationships between the polarity and logistic flows of the city’s meso-districts remain unexplored in existing research.
The relationship between the accessibility of infrastructure facilities (social, industrial, institutional, and environmental) and the capacity of TLI exhibits both linear and nonlinear characteristics. Increased accessibility (polarity of facilities) of TLI leads to enhanced capacity. The nonlinear aspect of this relationship reflects congestion in TLI, resulting in reduced capacity. Therefore, the direction and strength of these relationships influence the efficiency of urban logistics, population mobility, and overall quality of life. Based on this, the following hypothesis is proposed:
H1. 
There is a relationship between the city’s meso-districts, characterized by the logistic flow of infrastructure facilities and the accessibility of TLI.

2.2. Model of Development of Transport and Logistics Infrastructure of the City

The organizational and functional model of the CLI, which uses a systems approach as its basis, presented in the work [51], consists of social, economic and institutional spheres, which are coordinated with each other by the city’s logistics infrastructure.
One of the most important structural components of urban logistics is the system of goods and passenger movement along with its infrastructure, i.e., the logistics infrastructure of freight transportation in the city and the logistics infrastructure of passenger transportation in the city. The basis of the logistics flow in the city is the totality of material, information, financial and other flows that circulate within the urban area and are associated with the movement of goods, services, passengers, transport and resources. Factors influencing the logistic flow of the city include the following: transport and logistics infrastructure, geographic location, technology, urbanization and demography, environmental requirements, and e-commerce [32].
The key task of the TLI is to optimize logistic flows in the city. Optimization of logistic flows involves, first of all, improving the planning of the placement of economic, socio-cultural, and logistic facilities; developing infrastructure; integrating technologies; and greening processes [52,53,54,55]. Figure 1 presents a model of the city’s transport and logistics infrastructure, which incorporates four levels of coordination (economic, social, institutional, and environmental) and two subsystems (freight transportation and passenger logistics). Table 1 provides a systematization and classification of each element of the model, accompanied by descriptions and analyses based on literature sources.
Economic infrastructure: Economic infrastructure plays a pivotal role in facilitating material flows and fostering the economic development of a city [22,37]. Modern approaches enable the optimization of freight transportation and reduce the burden on the transport network [33].
Social infrastructure: Social infrastructure is crucial for creating a comfortable urban environment, promoting the development of public transport and tourism, and enhancing mobility and transport accessibility [34,35,36].
Institutional infrastructure: Institutional infrastructure ensures regulatory frameworks and funding for the development of transport and logistics infrastructure [32,64], enabling effective coordination of infrastructure development.
Environmental infrastructure: Environmental infrastructure plays a key role in establishing a sustainable urban environment. The implementation of green logistics [59] and efficient waste management [57] contribute to reducing the negative impact on the environment.
Freight transport infrastructure: Freight transport infrastructure is focused on optimizing logistics flows. Multilevel logistic systems [13,15,27], modern technologies [16], and sustainable solutions [48,57] enable the optimization of freight transportation and reduce the environmental impact.
Passenger logistics infrastructure: Passenger logistics infrastructure plays a crucial role in enhancing population mobility and the city’s attractiveness. The development of public transport [36,60], tourism [37,38], intelligent transport systems (ITS), smart city systems, and the integration of passenger and freight flows [56,61] contribute to improving the quality of life.
Thus, the model of urban transport and logistics infrastructure integrates economic, social, institutional, and environmental aspects, enabling the creation of a sustainable and efficient system.
The task of developing transport and logistics infrastructure in the urban environment is to manage logistics. The management of logistics flow will contribute to solving the problem of economic development of the city, improving transport accessibility, ensuring a positive social impact (meeting the needs of the population and improving the quality of life of people), and enhancing urban infrastructure and planning (optimal placement of facilities and cost reduction) through the development of TLI.
The location of social, industrial, institutional, and environmental infrastructure facilities within the city’s meso-districts, as well as the nature of their relationship with logistic flows and TLI accessibility, significantly influence the optimality of their placement. These factors can determine their interconnections, identify bottlenecks, and highlight opportunities for improving transport and logistic infrastructure. In this context, the following hypothesis is proposed:
H2. 
The TLI model facilitates the selection of directions for their placement and development, enabling more efficient management of logistic flows.

3. Materials and Methods

The study of the development of TLI was carried out in a sequence that included the following stages.
Stage 1. Determination of indicators reflecting the work of TLI elements.
In the first stage, we selected indicators influencing the TLI from various literary sources. The calculation of the correlation matrix for the variables included in the analysis allowed for the identification and exclusion of dependent (interrelated) parameters, as well as the determination of the 14 most significant indicators as follows:
(1)
Economic factors: Volume of innovative products (VIP), billion tenge/year; volume of sales of goods and services (retail and wholesale trade, food, vehicle maintenance and repair) (VSGS), billion tenge; volume of industrial production (VIPn), billion tenge/year; number of business entities (NBE), thousand units; transportation of freight and baggage (TBG), thousand tons; number of passengers transported (NP), million people/year;
(2)
Social factors: Volume of services rendered (VSR), billion tenge/year; average annual population (AAP), thousand people; number of social and cultural facilities (NSCF), units;
(3)
Institutional factors: Number of subjects of public administration and defense; compulsory social security (NSPA), units;
(4)
Environmental factors: Land resources (LR), billion tenge; volume of collected municipal waste (VCMW), tons; emissions of pollutants into the atmosphere (EPA), tons; environmental protection costs (EPC), million tenge.
Data collection was conducted using statistical data from the Bureau of National Statistics of the Republic of Kazakhstan (BNS RK) for the period 2021–2023, providing a more stable overview and enabling the consideration of short-term trends while avoiding significant fluctuations.
Stage 2. Division of the city territory into meso-districts.
In developing methods to identify strategic directions for the development of a city’s logistics infrastructure (CLI), an approach based on the decomposition of the urban territory into small territorial units—meso-districts—was employed. These meso-districts are characterized by similar levels of economic, social, institutional, and environmental infrastructure. Within the study, the city’s meso-districts are treated as vertices of a graph, with nodal elements represented by industrial, social, institutional, and environmental infrastructure facilities. The connections between these elements are modeled as edges.
For a more detailed analysis of the logistics infrastructure, based on the graph theory proposed in the work [49], we divided the city core into meso-districts, based on the historical features of the development and location of the basic objects of the logistics infrastructure: buildings (low-rise, high-rise, residential area, non-residential), recreational potential, industrial potential, institutional and commercial center, transport potential (transport hub, transport communications center).
The division of the city territory into meso-districts is shown in Figure 2.
The essence of the algorithm for calculating the poles and vectors of a city graph is that for each point N of a graph G, the minimum distances from this point to all points of the graph under consideration are calculated [44,66]. The maximum value is then selected among all the minimum distances between points—as a result, the value R(N) is determined, characterizing this point in the graph G [67]. Among the possible values of R(N), the minimum value is selected, which is the radius M of the graph G. The centers of the graph under study are the points at which the value of R(N) is equal to the value of M [44]. The center is found to be one of the elements of the adjacency matrix DN, the value of the i, j-th element of which is—i, j is the shortest distance from the vertex i to the vertex j.
D N   = a 11   a 12     a n a 21   a 22   a n         a i j   a i j     a n ,
where i, j are the elements of the adjacency matrix, the values of which are equal to the number of paths (edges) from the i-th vertex of the graph to the j-th vertex.
For each pair of points i, j, the minimum distance L(i, j) between them is considered. The maximum among the values of L(i, j) is the diameter of the graph. Calculations are carried out in a similar manner for all vertices aij of the graph. For each point, the minimum distance from all points of the graph is calculated ([49], p. 34). The maximum among the minimum values of distances is selected. Accordingly, this algorithm can be expressed by Formula (2). When determining the diameter of the graph, defined by the adjacency matrix DN, the largest distance from Expression (3) is determined:
M r B B X =   m i n M r B B ( i )
M r B B X =   m a x M r B B ( i ) ,  
where: M r B B X is the minimum distance between the vertices of the graph and M r B B i is the maximum distance between each pair of vertices of the graph.
In an undirected graph, each edge between two vertices simultaneously reflects both positive and negative influences, as it accounts for both incoming and outgoing flows. To analyze the primary directions of logistic flows, an adjacency matrix is constructed, which enables the identification of direct interconnections between the city’s meso-districts at various levels of analysis.
Figure 3 illustrates the adjacency structure of the graph for the city of Astana, calculated using the Excel software environment. This division can be used to determine the model of development and management of the CLI and to determine and calculate the shortest route of movement of a vehicle during transportation and distribution of goods throughout the city.
To assess the accessibility of social, industrial, institutional, and environmental infrastructure facilities within each meso-district, the method of determining graph poles was employed. In this study, polarity refers to the degree of accessibility of key vertices in the meso-district graph to urban infrastructure facilities, which is evaluated based on accessibility metrics [51].
The main point of Table 1 is to determine the most congested and densely populated meso-districts of Astana. For this purpose, the indices of congestion of meso-districts by enterprises and institutions were determined empirically. The congestion index was determined within the range from 0 to 6.
The population of the city’s meso-districts, their territorial distribution and connectivity with other districts, as well as their provision with industrial, social, institutional and environmental infrastructure facilities were taken into account. For the study, 12% of the base infrastructure facilities were selected from the total number of entities (3250 units), which is sufficient to characterize the objects under investigation. Thus, the sample size amounted to 390 units, with a desired confidence level of 95% and a permissible error margin of 5%.
The relationship between the polarity of the city’s meso-districts (the degree of accessibility of meso-districts to urban infrastructure facilities) and the logistics flow of meso-districts was evaluated using the following indicators: 1—polarity of meso-districts in relation to each other, 2—polarity of credit and financial institutions, 3—polarity of administrative institutions, 4—polarity of security service facilities, 5—polarity of children’s educational institutions, 6—polarity of public utilities facilities, 7—polarity of healthcare facilities, 8—polarity of social service facilities, 9—polarity of pre-school educational institutions, 10—polarity of cultural and educational institutions, 11—polarity of sports facilities, 12—polarity of recreational facilities not related to the previous categories, 13—polarity of industrial enterprises, and 14–17—polarity of commercial and trade facilities (shopping and entertainment complexes, shopping centers, wholesale bases, business centers).
The expert evaluation process involved the formation of an expert group comprising 15 specialists. The congestion index was defined on a scale from 0 to 6 points (where a higher score indicates worse accessibility). Data processing and analysis were conducted using the weighted sum method.
The polarity of meso-districts was assessed based on accessibility to key infrastructure facilities. The criteria for evaluating polarity included social and economic (industrial and business infrastructure), institutional, and environmental infrastructure. Sampling was performed using a combined method based on the following parameters: stratified sampling (meso-districts), geographical coverage (center, periphery, suburbs), functional zones (industrial zones, residential areas, commercial centers), and transport accessibility parameters. Table A1 presents the data from the experts’ evaluation of the polarity of meso-districts in Astana, along with descriptive statistics for the polarity indices examined in this study. The standard deviations across all meso-districts are relatively low (below 5%), indicating a stable level of participation in the analyzed area. Figure 4 presents a heat map of Astana, constructed based on the average value of polarity (AVP). The colors correspond to the AVP values, where the brighter the color, the higher the value.
The significance of indicators reflecting the relationship between the meso-districts of Astana was assessed. Table A2 of Appendix A presents the results of the assessment of significant correlation indicators by p-value: p < 0.05; p < 0.01; p < 0.001.
The algorithm for calculating the poles and vectors of a city graph involved the following process: 1. collecting statistical data on the city’s; 2. analyzing the data; and 3. software processing of the data and obtaining the result. The initial data are given in Table A3.

4. Results

The heterogeneity of indicators influencing the activities of the TLI (Table 2) by meso-districts confirms the unevenness of the planning and distribution of the infrastructure in the city of Astana.
In the paper, meso-districts are classified in relation to the average city indicators of paid, commercial and household services per capita. As can be seen from Table 2, a number of meso-districts have significantly larger volumes of these services than other meso-districts, which allows them to concentrate material, human and other flows from less “provided” meso-districts. The vertices of the graph are the meso-districts of the city under study, the nodal objects are the economic, social, institutional and environmental infrastructure, and the edges are the communications between them.
From the analysis of Table 2 it is evident that the structures of indicators for each of the four administrative districts of Astana (Yesil, Almaty, Saryarka and Baikonur) differ greatly in the total volume for each indicator.
The structure according to the VIP indicator is by districts (in %): Yesil—30; Almaty—6; Saryarka—64; Baikonur—0.01; VSGS—38.4, 17.5, 13.4, and 30.7; VIPn—13, 33, 17, and 37; VSR—35, 19, 15, and 31; and TBG—3.3, 77.7, 17, and 1.9. The structure of land resources (VCMW and EPA), respectively, is 10 and 4; 6.0 each; 3.0 each; 82 and 87. The structure of the EPC, respectively, is 56.0, 2.0, 10.0 and 32.0.
The highest level of concentration of services rendered is in the Yesil district. These are the very same meso-districts that belong to the left bank (the new city center, the south and southwest in Figure 2), and where the largest number of city residents is. The highest level of transported cargo is in the Almaty district (78%), less than the VSR (19%). The highest level of concentration by NSPA and by NSCF is in the Yesil district—42 and 28%, respectively. The highest level of VCMW and EPA is in the Baikonur district—82 and 87%, respectively, although they have relatively low EPC (32%).
The results of the analysis shown in Table 2, Figure 2 and Figure 3 indicate that a high concentration of VIP is observed in the old city center (mesorieties 13 and 14), and a high concentration of VSGS is found in the southwest (mesorieties 6 and 7) and on the northern outskirts (20 and 21). A high density of VIPn is found in the northeast (14 and 15), southeast (8, 9, 10, 11 and 12) and the old center (13, 14, 16) of the city.
High volumes of freight traffic are observed in the southeast (8, 9, 10, 11, 12 and 13) and northeast (16) of the city, which is explained by the absence or insufficiency of transport, logistics and distribution centers in other areas of the city. High passenger traffic density is in the center (10), the old center (14) and on the outskirts of the city—the north and northeast (15, 20 and 21)—which is explained by the pendulum movement of the workforce from residential areas to the city center for work.
The high density of public institutions in the new city center in meso-districts 1–4, as well as in the old city center (13, 14, 15 and 16), indicates a high concentration of objects in these meso-districts. The population is distributed relatively evenly, except for the meso-districts, where the high density is in the southeast (8, 10 and 11) and in the northwest (18 and 19). A high density of socio-cultural facilities is found in the northwest (18, 19), northeast (14–15) and north (20, 21), and government and financial institutions are concentrated in the new—in the south and southeast (2, 4, 6)—and old (17, 18, 19) city center. The largest share of land resources for the development of infrastructure facilities is in the south (1–3), in the new center (7), in the northwest (19), in the north (21) and northeast (15). In the central part of the city there are no land resources for the construction of large logistic facilities.
The results of the analysis of Table A1 (Appendix A) show that the locations of infrastructure facilities in the city’s meso-districts significantly affect the availability of TLI both in local and neighboring meso-districts for all values of the coefficients in the correlation matrix (Table A1). Comparison of the locations of meso-districts (Figure 2) and their correlation coefficients shows that neighboring meso-districts have a strong connection (from 0.53 to 0.98) (highlighted in red in Table 1). Those meso-districts that are located between themselves through one or two meso-districts also have a close connection from 0.47 to 0.90 (highlighted in yellow). Meso-districts located on the outskirts of the city have a weaker connection with meso-districts at the other end of the city and with the central meso-districts. That is, the meso-districts located on the outskirts of the city have a smaller connection with the central meso-districts—they have a connection with coefficients from 0.41 to 0.83 (highlighted in green, for example, A2 with A10–A20, A7 with A11–A21 or A16 with A11–A15, A8 with A17–A21, A9 with A16-A21, respectively). This circumstance suggests that geographically nearby meso-districts have a greater influence on the development of transport and logistics infrastructure with a coefficient of 0.53 and higher (p < 0.01 and p < 0.05) than those meso-districts that are located further from the center.
This study revealed that the lowest polarity (Figure 5) is observed in the historical center of Astana (meso-district 16) and the Yesil district (meso-districts 5 and 6).
We have identified the following relationship between the capacity of the road transport network and the average polarity of infrastructure facilities in meso-districts:
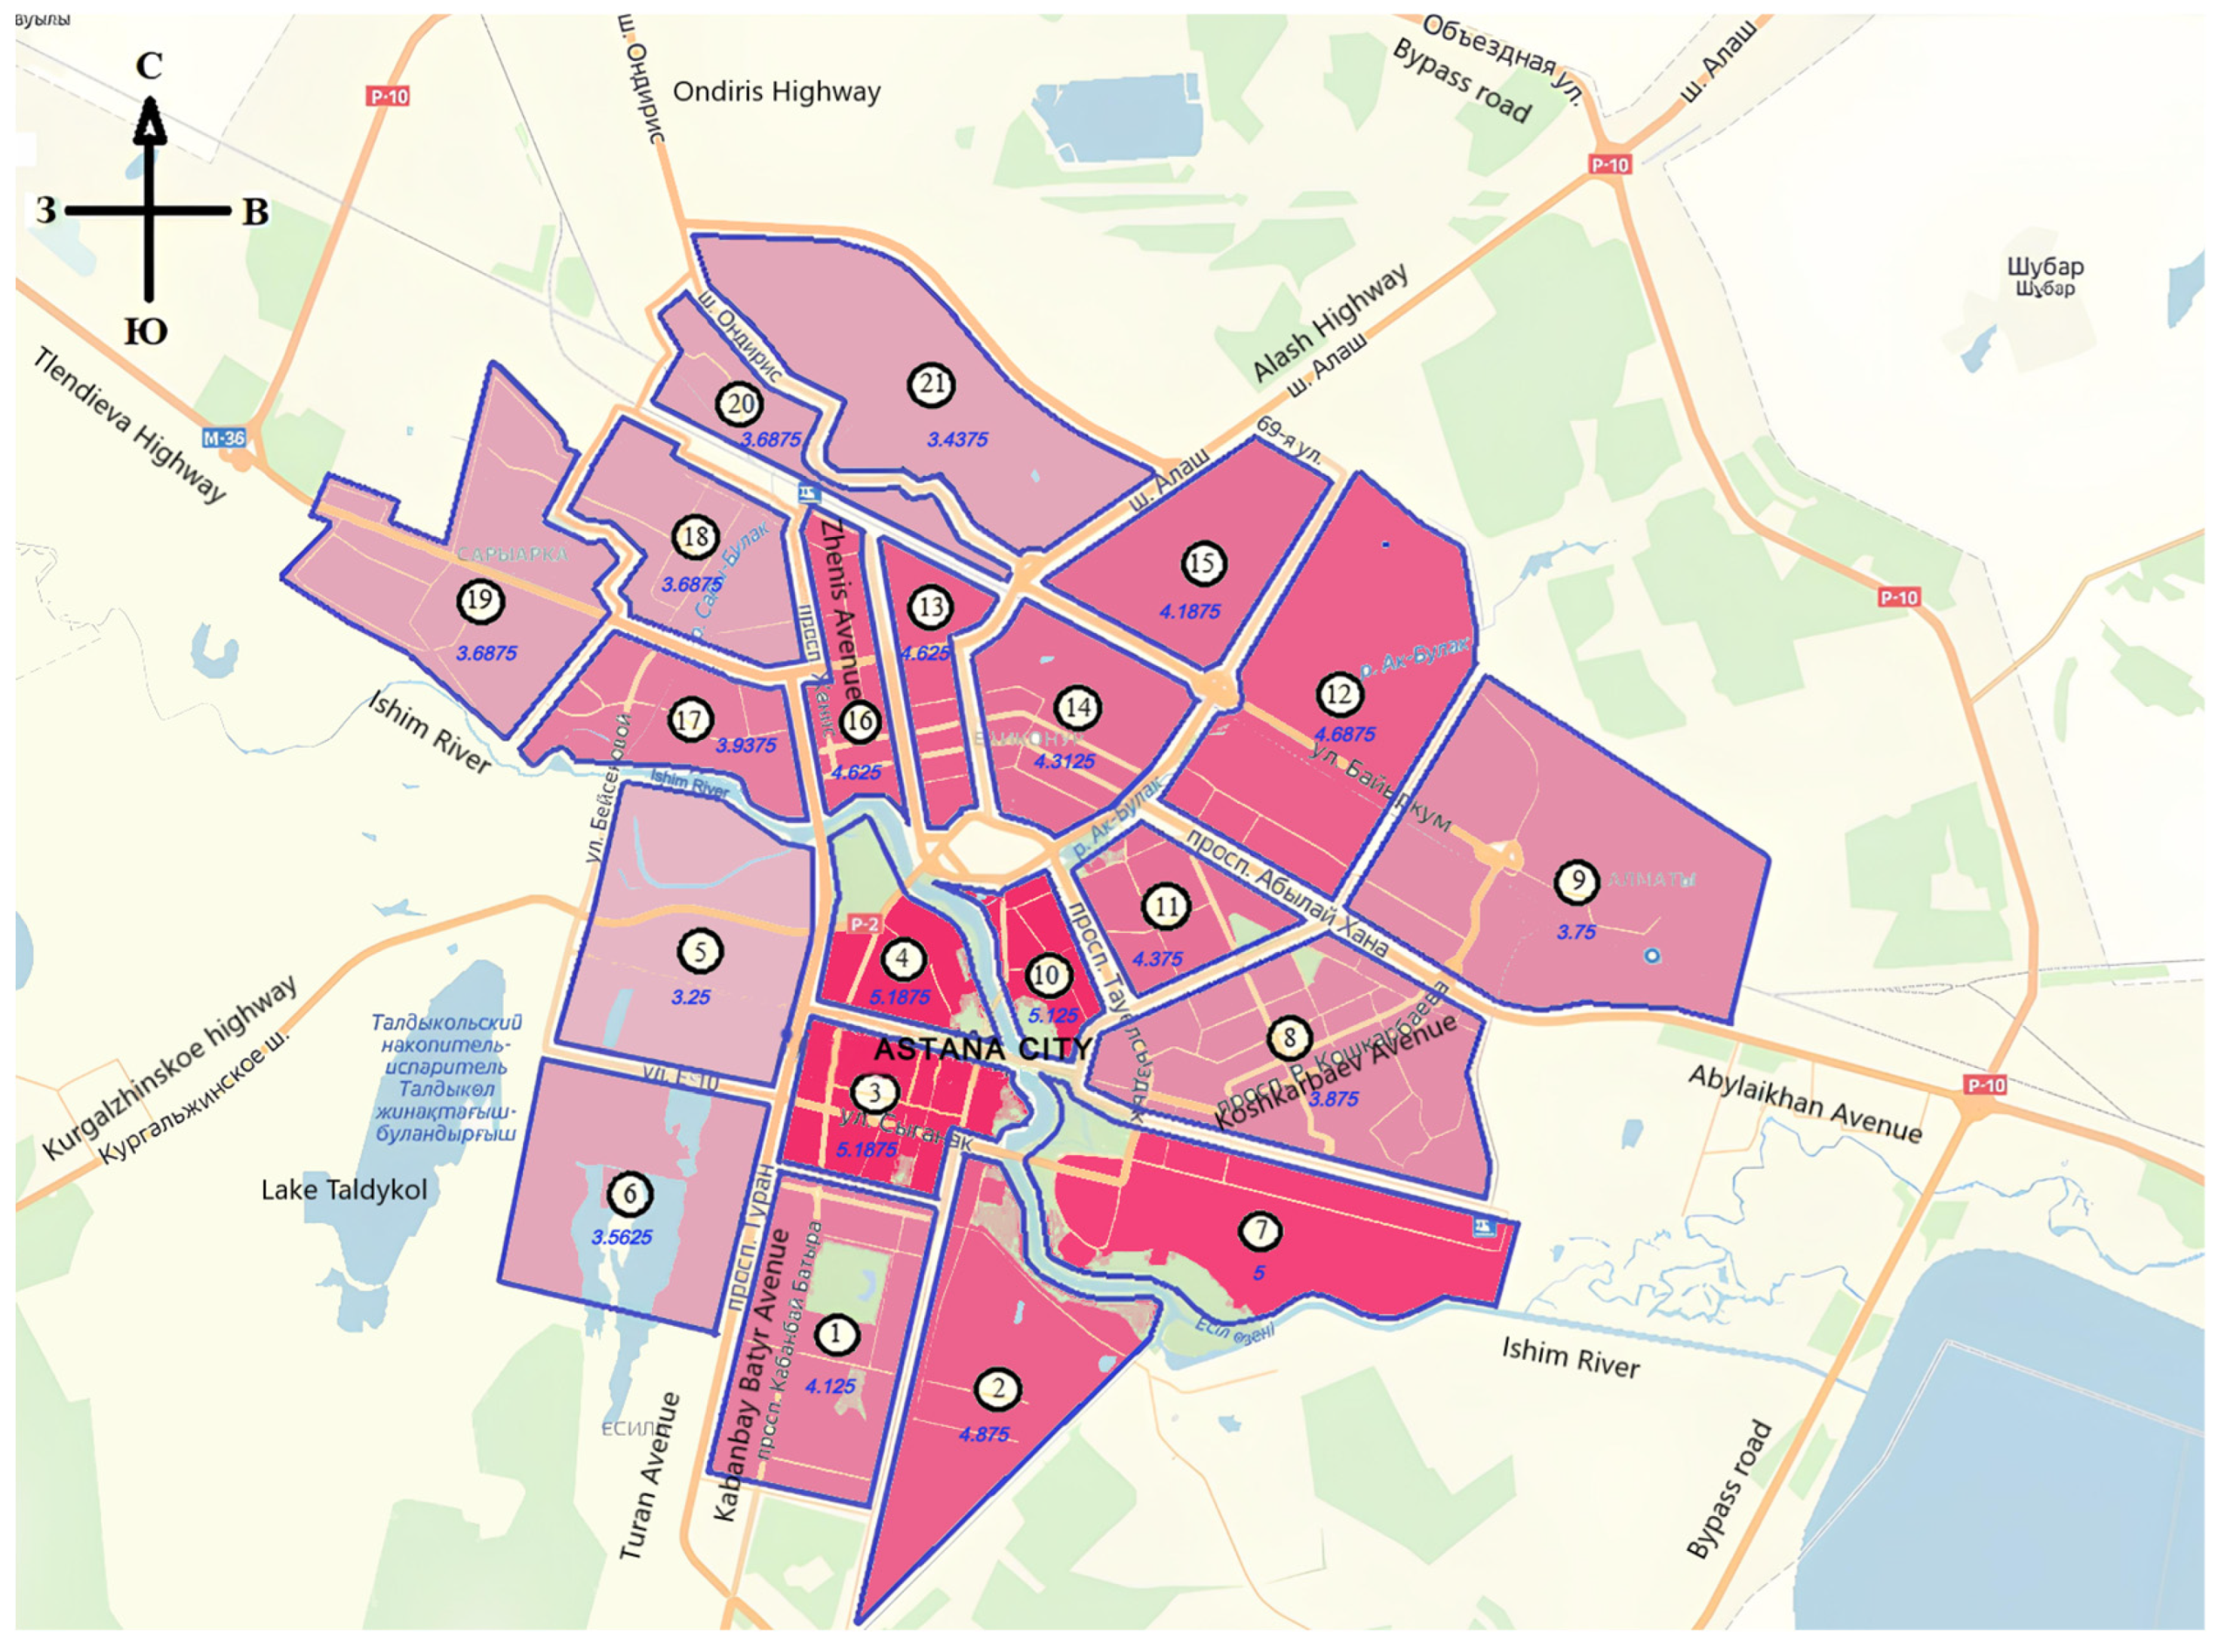
  • For meso-districts with a polarity below 3.0, the capacity of the road transport network and the average polarity of infrastructure facilities demonstrate a correlation of 0.51. This indicates that increased accessibility of infrastructure leads to enhanced transport capacity in such meso-districts.
  • For meso-districts with above-average polarity (greater than 3.0) and TLI accessibility, a negative relationship is observed (correlation coefficient of −0.31), suggesting congestion in TLI for these meso-districts. These relationships support our Hypothesis 1, although such dependencies have not been identified in the existing literature.
Less connection between the outlying meso-districts with the central meso-districts indicates the functional and spatial hierarchy of the urban area. This phenomenon indicates several aspects: (1) Poor transport accessibility: outlying areas are usually provided with worse transport infrastructure compared to the central parts of the city, which leads to lower connectivity. (2) Geographic isolation: large distances and the lack of developed transport hubs complicate communication with the city center. (3) Mono-centricity of development: peripheral meso-districts do not have their own local centers and depend on the central meso-districts.

5. Discussion of Results

The method of determining the poles of the meso-district graph aids in identifying the directions of logistic flows [51] and managing transport connections [52] (Table 2). Flows move from meso-districts with high accessibility to those with lower accessibility, enabling the determination of freight movement vectors and their intensity, taking into account population density and infrastructure provision.
This study revealed that the meso-regions with the lowest polarity remain the meso-regions of the right bank of Astana (Baikonur—14, 15, 20, 21, with a polarity index of 3.6; Saryarka—13, 16, 17, 18, 20, with a polarity index of 3.3). The highest flow load index is 6. Low polarity indicators indicate a low concentration of congestion in these areas with transport and logistics infrastructure and a low concentration of large trade, banking, social and business structures.
Astana is characterized by a high concentration of traffic congestion and trade, banking, social and government structures. For the Yesil district (1, 2, 3, 4, 7) the pole indicator is 4.78 and for the Almaty district (8, 9, 10, 11, 12) the pole indicator is 4.41. Thus, the analysis shows that the left bank of Astana is oversaturated with commercial, educational, cultural, and government structures and contributes to the formation of traffic congestion.
The moderate correlation between the capacity of the road transport network and the average polarity of meso-districts, as shown in Figure 5, indicates that an increase in the capacity of the transport network generally leads to higher polarity, i.e., improved accessibility to infrastructure facilities. However, the average strength of this relationship suggests that while transport capacity influences polarity, it is not the sole determining factor. Other factors, such as population density, the distribution of logistic facilities, the development of public transport, and other urban planning parameters, may also impact polarity. This implies that enhancing the transport network contributes to, but does not guarantee, a uniform increase in infrastructure accessibility across all districts.
The analysis of polarity indices reveals an uneven distribution of congestion across meso-districts: a high concentration is observed in districts 1–4, 7, and 10; above-average in districts 11–14; below-average in districts 5 and 6; and average in the remaining districts. Thus, the city’s freight flows are predominantly directed from peripheral meso-districts toward two main centers (line A–B and line A–D in Figure 6). This result was obtained under the existing road infrastructure and an average city driving speed of 25 km/h. The highest concentration of flows is observed in the historical city center (point A) and near the old railway station (point B).
The existing territorial structure and weak connectivity of transport networks have led to the overloading of the city center’s road network and insufficient road capacity. The traffic flow between central and peripheral districts does not exceed 2000 units per hour (Figure 4 and Figure 6), while movement from other meso-districts is significantly less intense. One of the most pressing issues is the limited capacity of transport links between the right and left banks of Astana, particularly between the left-bank meso-districts and the historical city center (Figure 6).
This study revealed that weak connectivity of is one of the key challenges facing Astana. The absence or low capacity of transport links exacerbates the load on central districts, hindering their integration into urban agglomeration. Overload in certain areas (meso-districts 3, 4, 10, 13, and 16) makes alternative routes inaccessible due to traffic congestion or the lack of connecting roads (Figure 2 and Figure 4), justifying the need for a transition to polycentric development in Astana.
One of the most critical issues is the limited capacity of transport links between the right and left banks of Astana, particularly between the left-bank meso-districts and the historical city center (Figure 7). The situation is further exacerbated by the overlapping of freight and passenger flows from the western part of the left bank and peripheral districts.
Thus, the main priority vectors of strategic development of the city’s logistics infrastructure are the West-Center-East and Center-Right Bank directions.
The analysis of the data from Table 1 and Figure 4, Figure 5 and Figure 6 enables the identification of areas within the city that are either favorable or unfavorable for the further development of transport and logistics infrastructure (TLI) facilities.
The uneven distribution of logistics facilities across the city’s meso-districts leads to an inadequate increase in the volume of logistic flows in some meso-districts, where there is a high density of infrastructure facilities, and a low density of placement in other meso-districts of the city, which affects the congestion of city streets with traffic flows.
This research confirms the necessity of regulating the volume of goods entering the city before reaching its boundaries and organizing an efficient distribution system through the coordination of all participants in the logistic process, including the establishment of trade and distribution centers.
The task of routing on the transport network is a key aspect of transport logistics. To address this, Dijkstra’s algorithm [66] was utilized. For example, the calculation of the optimal route between meso-districts is as follows: 1 → 21: the optimal path [1,3,4,16,18,20,21], with a distance of 21.91 km. The total travel time is 52.2 min. This result is understandable given the current road congestion in the city. These findings are consistent with the conclusions of study [52]. Based on this, it follows that when constructing or modernizing existing transport and logistics infrastructure facilities in Astana, it is necessary to take into account the directions and capacities of the city’s logistic flows.
  • According to global practices, terminal complexes and logistic centers are typically located outside major cities [1,3,5]. In Astana, it is advisable to position them beyond the ring road, preferably on the outskirts near transport hubs. Optimal locations include intersections of radial and ring highways of international significance, as well as junctions of road and rail corridors [53].
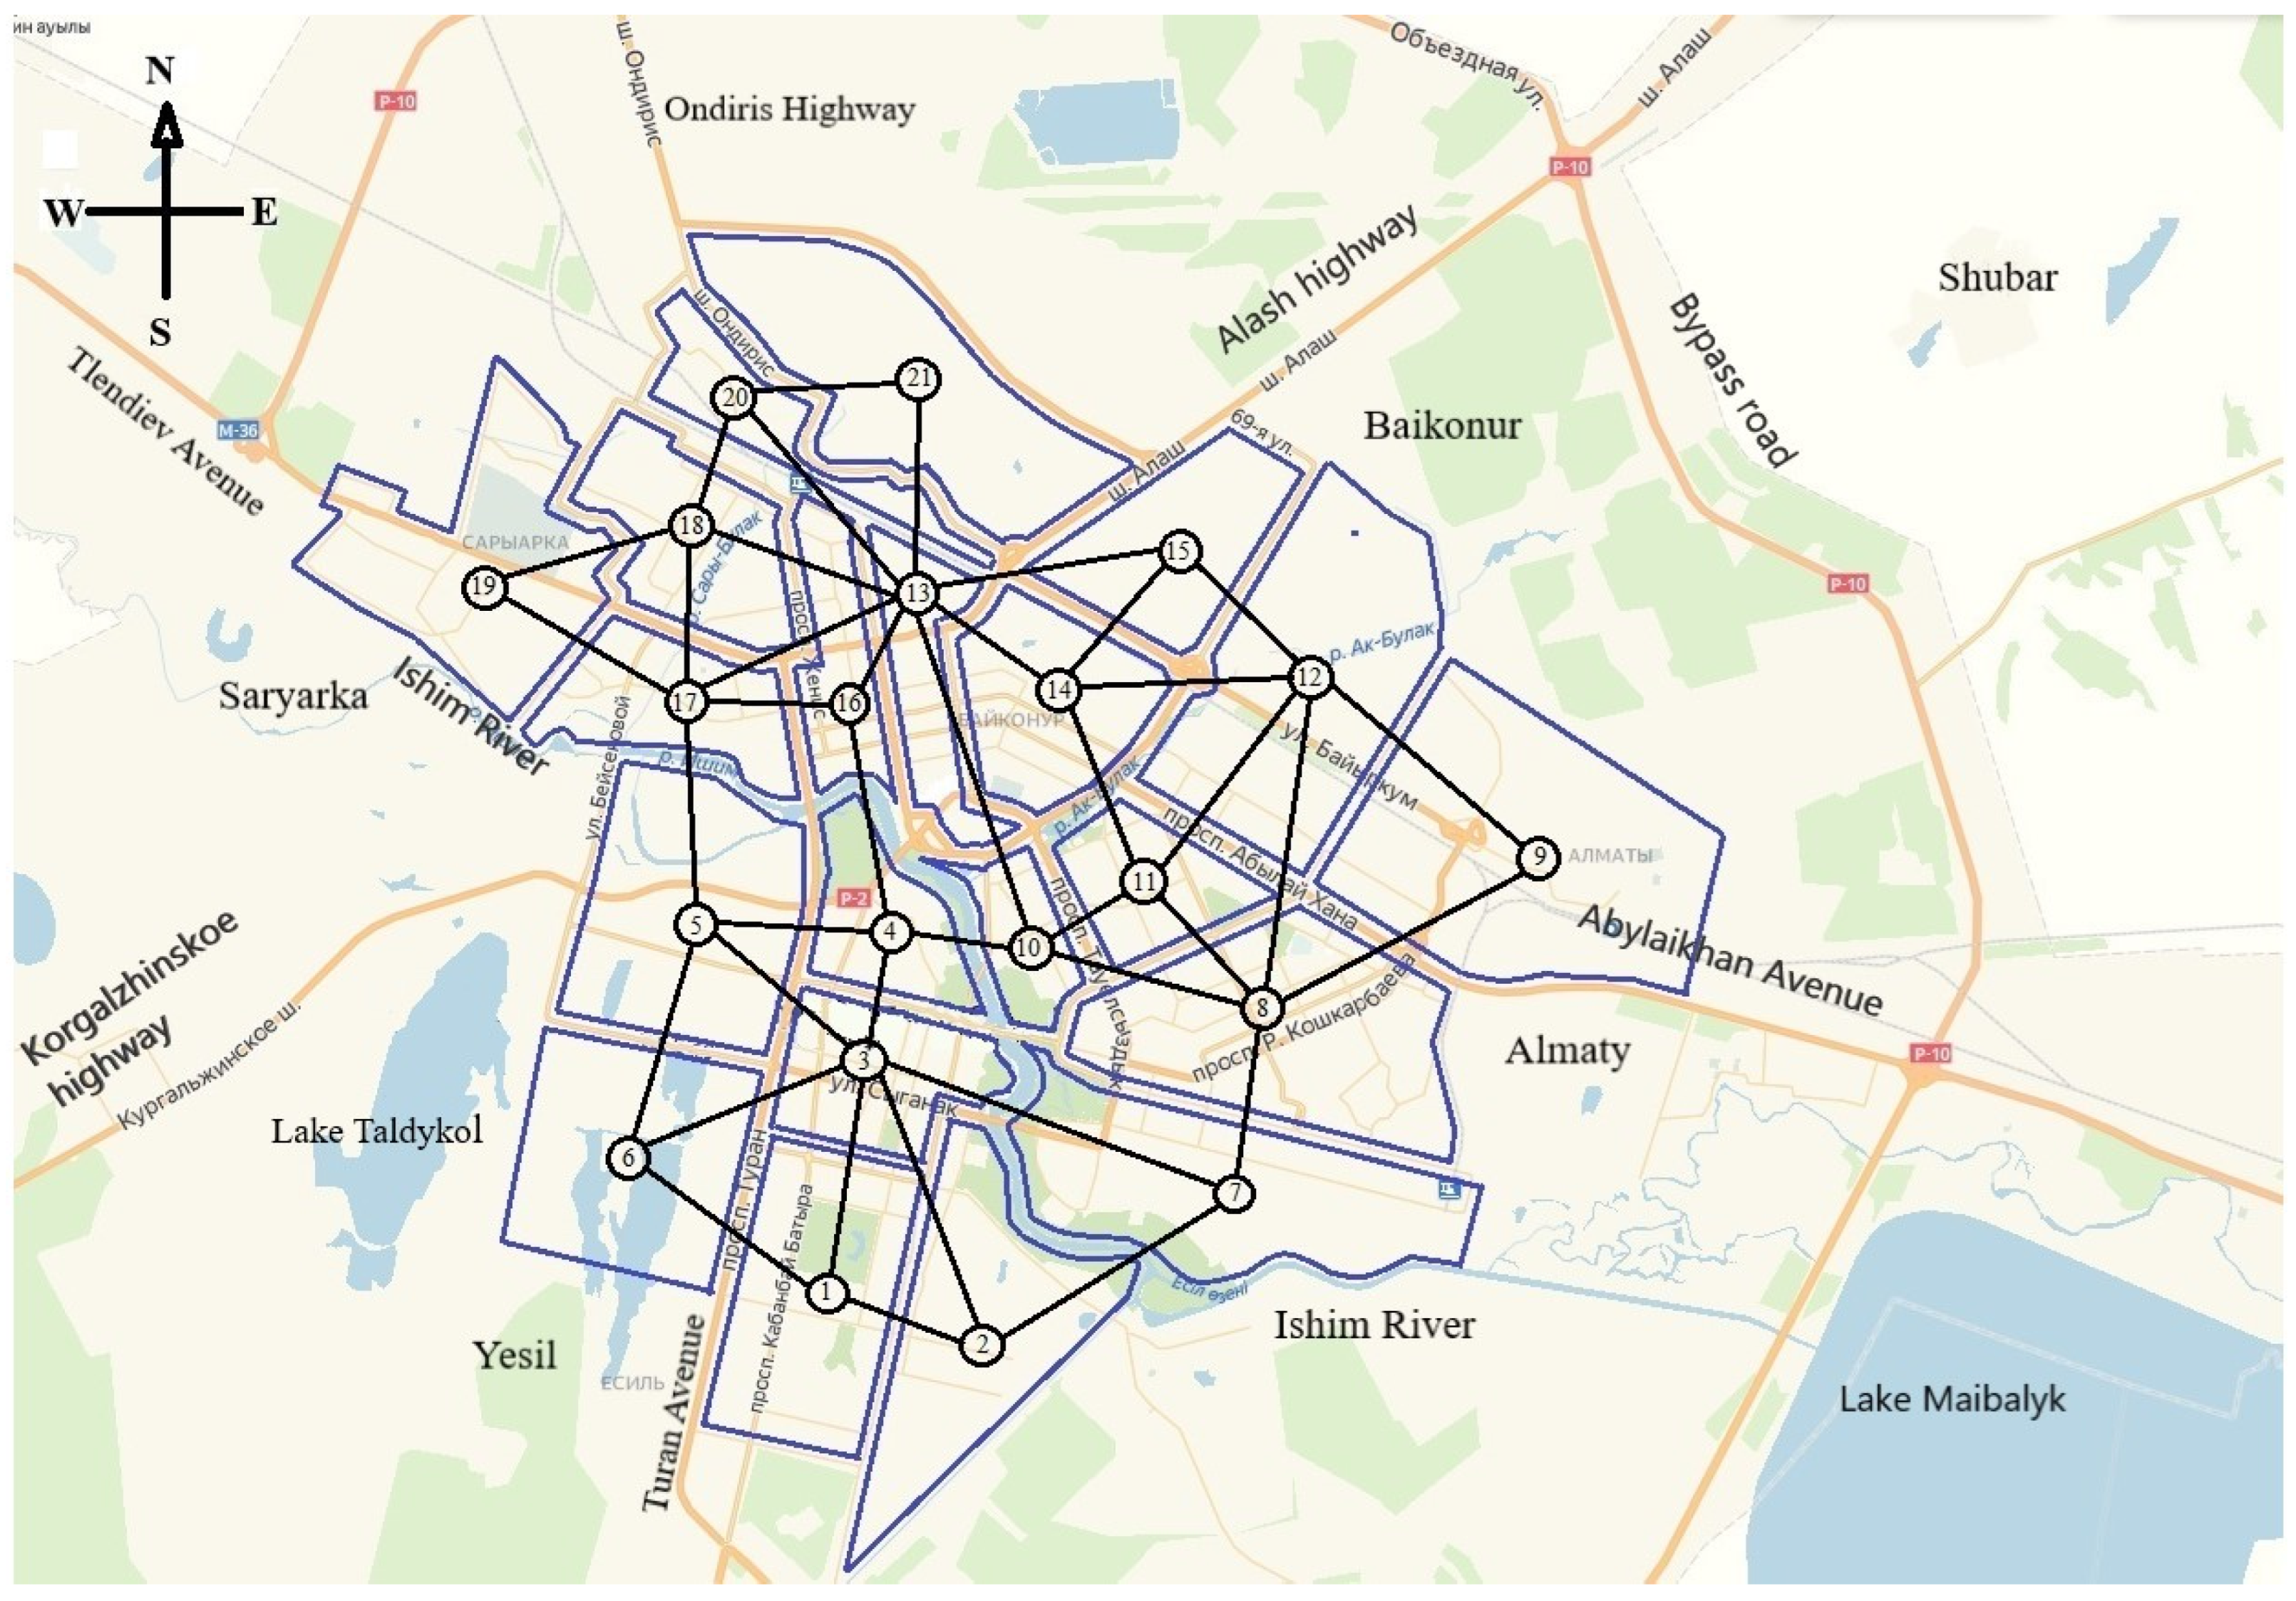
  • The construction of large multimodal terminal complexes is recommended at nodes of the transport network with the highest concentration of freight flows. Optimal locations include: (a) meso-districts 1, 2, and 3; (b) meso-districts 8, 9, and 12; and (c) meso-districts 13, 16, and 18.
  • Large transfer points for public transport should be located at the junction of meso-districts where the greatest number of passenger flows is observed: between meso-districts 3, 4 and 5; 10 and 11; 16 and 17; and 15, 20 and 21.
  • Large blocks in meso-districts should be divided into smaller streets through and through. This will also help in the fight against traffic jams, i.e., large highways will be relieved.
Based on the studied strategic directions of the development of the transport and logistics infrastructure of the city, we propose: to establish river navigation on the Ishim River as one of the urban modes of transport and for tourism purposes; construction of two multimodal logistic centers for cargo handling and one information logistic center for transport and logistic services for tourists; and increase the length of high-speed roads of continuous movement, which will lead to a decrease in the average polarity indicator of meso-districts of Astana from 4.1 to 3.9. Considering that the optimal value of this indicator tends toward one, our proposal will contribute to improving the quality of the transport and logistics infrastructure of the city and increasing the synergistic effect from its implementation.
Furthermore, it has been confirmed that reducing the polarity of meso-districts can positively impact the quality and accessibility of the city’s transport and logistics infrastructure by taking into account the multifaceted interconnections between meso-districts and key indicators of logistic flows (Hypothesis 1).
The obtained results have enabled the identification of the most problematic meso-districts in the city, the mapping of logistic flow directions, the determination of development pathways for these meso-districts, and the planning of placement and development strategies for transport and logistics infrastructure. These findings align with our Hypothesis 2 and partially corroborate conclusions from the literature [30,47,50,52].
Thus, the conclusions of this empirical study are supported by our results, as well as by findings from the literature analyzing the influence of various factors on the development of urban or regional transport and logistics infrastructure (TLI):
-
They ensure a balance between economic benefits, environmental sustainability, and social convenience, thereby promoting the development of efficient urban logistics [5,64].
-
They enhance the quality of urban planning the development of transport and logistics infrastructure in the city’s outskirts, where meso-districts have weaker connections with central areas, which can be approached comprehensively through various measures [54,59,60,65,68,69]. These measures include the development of public transport; the implementation of intelligent transport systems (ITS); the establishment of transport and logistic hubs; the promotion of non-motorized transport (bicycle lanes, pedestrian routes, bike and e-scooter sharing systems); the decentralization of urban functions (creating new business and cultural centers, tourist attractions in the outskirts, and stimulating job creation in these areas); the development and expansion of parking infrastructure; and the adoption of environmentally friendly transport solutions.
-
They reduce the gap in transport accessibility between the outskirts and the city center [19], enhance population mobility and transport connectivity, and improve the quality of life [24].
-
They stimulate the city’s economic development [37], create comfortable conditions for both residents and tourists [38], and increase its attractiveness as a tourist destination [57].
The implementation of these measures will enable the city to become a major transport, logistics, and tourism hub, as supported by the conclusions of studies advocating for the creation of an integrated model combining transport, logistics, and tourism for urban development.
This article contributes to the literature focused on assessing the impact of individual meso-districts on the sustainability of transport and logistics infrastructure (TLI) development. Furthermore, our study introduces a tool designed to measure the polarity of meso-districts and evaluate its relationship with logistic flows using graph theory and correlation analysis.
The prospects for enhancing the sustainability of TLI development and improving its planning quality in the city should be based on the following principles:
  • Close integration of socio-economic, environmental, and institutional entities with TLI facilities at the meso-level of the city. This integration is essential for creating functional land use and automatically identifying areas with improved transport accessibility, which helps reduce costs for freight and passenger transportation.
  • Improving the efficiency of TLI operations in each meso-district, which should focus on reducing costs and enhancing the quality of transport, logistics, tourism, trade, and service offerings.
  • Modernization of existing or construction of new socio-cultural, industrial, environmental, and institutional facilities as part of the transport and logistics market infrastructure. This approach should leverage modern digital technologies and logistic solutions to minimize the impact of various factors on the quality of transport and logistic services and to better meet demand.
  • Development of TLI in areas of the city with low polarity. This strategy allows for the consideration of the direction and capacity of urban logistic flows, enabling a more effective response to changing consumer demands.
By implementing these measures, the city can achieve a more balanced and sustainable development of its transport and logistics infrastructure, ultimately contributing to its overall economic and social progress. These measures will help reduce the gap in transport accessibility between the outskirts and the center, increase population mobility, improve the quality of life and stimulate economic development on the outskirts of the city. Also, these measures will not only stimulate the economic development of the city but also create more comfortable conditions for the city’s population and tourists, increasing its attractiveness as a tourist destination.

6. Conclusions

Based on this study utilizing elements of graph theory, proposals have been developed for creating a conceptual framework for the development and placement of terminal complexes and logistic centers to service freight, passenger, and tourist flows within the Astana transport hub, taking into account the specificities of its development. The proposed recommendations aim to optimize the city’s logistics infrastructure by modernizing existing logistic facilities in conjunction with the overall plan for constructing new ones. This approach will enhance the resilience of the city’s transport and logistics infrastructure and enable the efficient utilization of integrated logistic flows.
The findings will facilitate the implementation of integrated policies aimed at improving the efficiency and sustainability of transport and logistics infrastructure (TLI). They will also support the adoption of coordinated policies for measures to promote and stimulate TLI development, based on the polarity, priority, and impact of logistic flows on the quality of life in urban areas.
This study does not account for limitations related to data quality, as the analysis is based on expert and statistical indicators for a specific period without considering dynamic changes. Future research could be enhanced by further exploring the multifaceted relationships between meso-districts and key indicators of logistic flows, as well as between the components of the TLI model and the polarity of meso-districts.
Subsequent studies should incorporate seasonal variations, integrate data from urban sensors to improve accuracy, and conduct comparative analyses across different cities to test the scalability of the model. Additionally, the adoption of modern digital technologies for real-time decision-making should be considered to refine the approach and ensure its applicability in diverse urban contexts.

Author Contributions

Conceptualization, Z.R.; Methodology, B.S.; Software, Z.R.; Formal analysis, B.S., Z.R. and R.B.; Investigation, Z.R. and Z.D.; Resources, B.S.; Data curation, Z.D.; Writing—original draft, Z.R. and B.S.; Writing—review and editing, B.S and R.B.; Validation, B.S. and R.B.; Visualization, B.S. and Z.D.; Supervision, Z.R. and B.S. All authors have read and agreed to the published version of the manuscript.

Funding

This study is funded by the Science Committee of the Ministry of Science and Higher Education of the Republic of Kazakhstan (Grant No. AP26195433).

Data Availability Statement

There are no restrictions on the availability of this data. The data were obtained from the Bureau of National Statistics of the Agency for Strategic Planning and Reforms of the Republic of Kazakhstan (at URL https://stat.gov.kz/en/region/astana/) (accessed on 24 December 2024).

Conflicts of Interest

The authors declare no conflicts of interest.

Appendix A

Table A1. Initial data of experts’ assessment of the polarity of Astana city meso-districts.
Pole Number in OrderMeaning of Average Polarity IndicatorsAVPDistribution of NBIOSESDSL
12345678911121314151617ESIECO
146556254651144444.136241
244555234556155664.4452110.351.410.55
366666354666266665.38158430.311.260.57
466566254666166665.19177540.391.560.63
543333223331133442.8174310.230.910.48
633333433431223342.9462220.190.770.41
744645644555365664.88103320.240.960.51
843344544461444443.8876220.261.020.54
943344543441544443.7553120.230.930.49
1066556544564466665.251612640.210.860.45
1165456454652444444.50124220.261.030.55
1244446444641666664.69135310.351.400.44
1355555544551544444.38117430.261.020.54
1445444544451444444.00157320.220.890.47
1543243543441444463.69133120.281.140.50
1634332323324333333.0475210.120.480.25
1745444534441344443.8193110.230.910.48
1843444334431444443.5665320.200.810.43
1943444433431644443.6974340.251.010.54
2043233433431455553.5652110.291.150.61
2143233433431644443.4442210.271.090.58
Average value4.039.34.62.72
Note: (1) NBIO—the number of basic infrastructure objects (E-economic, S-social, I-institutional, ECO-ecological); AVP—average value of polarity (mean); SE—standard error; SD—standard deviation (std.Dev); SL—significance level (SL) at p ≤ 0.05%.
Table A2. Correlation coefficients reflecting the relationships among the meso-districts of Astana.
A1A2A3A4A5A6A7A8A9A10A11A12A13A14A15A16A17A18A19A20A21
A11.00
A20.36 *1.00
A30.60 **0.87 ***1.00
A40.61 **0.86 ***0.98 ***1.00
A50.61 **0.53 **0.58 **0.591.00
A60.59 **−0.030.020.010.55 **1.00
A70.050.53 **0.370.280.350.261.00
A80.25 *−0.28−0.22−0.190.330.580.051.00
A90.06−0.52 **−0.42−0.42 *0.170.53−0.040.80 ***1.00
A100.46 *0.45 *0.58 **0.560.74 **0.340.540.340.251.00
A110.73 ***−0.110.200.230.46 *0.54 **−0.270.50 *0.480.67 **1.00
A120.28−0.03−0.04−0.030.42 *0.41 *0.170.58 *0.700.45 *0.59 **1.00
A130.50 **−0.39 *−0.16−0.210.36 *0.62 **−0.150.68 **0.73 ***0.340.75 ***0.50 **1.00
A140.46 *−0.37 *−0.17−0.190.41 *0.67 **0.000.80 ***0.72 ***0.430.580.47 *0.87 ***1.00
A150.06−0.19−0.19−0.150.390.66 **0.140.71 **0.80 ***0.360.310.60 **0.45 *0.58 **1.00
A16−0.21−0.08−0.23−0.270.310.300.200.190.41 *0.04−0.070.44 *0.250.150.421.00
A170.60 **−0.140.01−0.020.597 **0.74 **0.200.62 **0.57 **0.57 **0.53 **0.47 *0.79 ***0.90 ***0.52 **0.411.00
A180.41 *−0.05−0.02−0.030.600.48 *0.010.49 *0.64 **0.360.51 **0.81 ***0.69 **0.55 **0.49 *0.65 **0.60 **1.00
A19−0.02−0.45 *−0.42 *−0.46 *0.150.31−0.110.47 *0.83 ***0.170.35 *0.77 **0.69 **0.51 **0.54 **0.61 **0.54 **0.79 ***1.00
A200.03−0.04−0.06−0.030.49 *0.42 *0.250.51 **0.69 **0.52 *0.190.82 ***0.320.45 *0.80 ***0.58 **0.49 *0.63 **0.62 **1.00
A21−0.18 *−0.52 **−0.51 **−0.48 *0.090.27−0.190.53 **0.83 ***0.160.270.75 ***0.49 *0.48 *0.71 **0.53 **0.35 *0.60 **0.85 ***0.79 ***1.00
Note: Calculated on the basis of expert assessment data, the correlation coefficient is significant at * p < 0.05; ** p < 0.01; *** p < 0.001.
Table A3. Initial data for calculating the poles and vectors of the graph by meso-districts of Astana, in km.
123456789101112131415161718192021
102.663.945.586.065.566.8910.113.87.729.310.68.59.6513.68.849.6812.814.317.916.0
22.5705.116.8210.46.88.5510.715.17.38.7414.510.311.514.112.413.015.016.418.520.3
33.925.4802.434.333.844.997.8710.63.54.89.06.486.799.726.388.3511.910.310.613.6
46.68.172.7103.133.347.747.1111.94.546.0311.14.264.048.514.995.045.955.610.413.2
57.08.825.01.4904.477.928.6312.04.445.797.153.6814.58.625.584.436.117.0310.28.87
65.827.773.424.155.9507.579.1913.26.418.099.775.178.9213.17.027.579.6210.811.914.2
76.898.554.997.747.927.5705.0812.06.925.09.7310.910.04.09.4814.517.17.2518.016.0
810.110.77.877.118.639.195.0806.56.382.55.1410.66.13.211.217.118.66.5318.317.0
915.014.012.09.411.017.012.06.507.66.94.37.25.95.78.512.012.013.011.012.0
107.727.33.54.544.446.416.926.387.601.445.435.984.116.09.2510.310.56.2612.010.0
118.28.05.86.07.08.05.02.57.01.1107.04.03.06.06.29.011.011.510.012.0
1210.614.59.011.17.159.779.735.144.35.437.006.816.98.06.2110.812.57.6414.012.0
138.510.36.484.263.685.1710.910.67.25.984.06.8102.68.22.236.296.214.288.347.4
149.911.07.34.56.49.710.06.18.34.13.16.92.605.14.15.97.98.810.09.4
1513.68.02.02.03.011.04.03.22.016.01.448.08.24.0011.06.02.510.01.07.0
168.8412.46.554.265.214.559.4811.214.59.251.206.212.233.525.8601.542.373.125.57.2
179.6813.08.355.044.437.5714.517.112.010.39.010.56.295.96.01.5402.831.569.210.0
1812.815.011.95.956.119.6217.118.612.010.511.012.06.217.92.52.372.8303.045.810.0
198.159.287.315.064.435.687.256.5311.76.268.027.644.285.947.593.361.563.0405.299.73
2017.91914.01213121818.31412.012.014.08.49.48.88.69.25.87.802.6
2116.020.313.68.8713.214.216.017.012.01012.012.07.49.47.07.210.010.09.732.60

References

  1. Crainic, T.G.; Gendreaua, M.; Jemai, L. Planning hyperconnected, urban logistics systems. In Proceedings of the 22nd EURO Working Group on Transportation Meeting, Barcelona, Spain, 18–20 September 2019; Available online: http://www.sciencedirect.com/science/article/pii/S2352146520302490 (accessed on 15 August 2024).
  2. Fatnassi, E.; Chaouachi, J.; Klibi, W. Planning and operation a shared goods and Passengers on-demand rapid transit system for Sustainable city-logistics. Transp. Res. Part B-Methodol. 2015, 81, 440–460. [Google Scholar] [CrossRef]
  3. Kevin, C. Global city regions and the location of logistcs activity. J. Transp. Geogr. 2010, 18, 354–362. [Google Scholar]
  4. Mansouri, B.; Sahu, S.; Ülkü, M.A. Toward Greening City Logistics: A Systematic Review on Corporate Governance and Social Responsibility in Managing Urban Distribution Centers. Logistics 2023, 7, 19. [Google Scholar] [CrossRef]
  5. Barrera-Jiménez, H.; Pineda-Jaramillo, J. A Framework for Integrating Freight Transport, Urban Land Planning, and Infrastructure Management under Economic Geography Principles. Urban Sci. 2024, 8, 30. [Google Scholar] [CrossRef]
  6. Raimbekov, Z.; Syzdykbayeva, B.; Baimbetova, A.; Rakhmetulina, Z. Evaluating the impact of logistics infrastructure on the functioning and development of regional economy. Econ. Ann. -XXI 2016, 160, 100–104. [Google Scholar] [CrossRef]
  7. Aljohani, K. Integrating logistics facilities in Inner Melbourne to alleviate impacts of urban freight transport. In Proceedings of the 38th Australasian Transport Research Forum, Melbourne, Australia, 16–18 November 2016. [Google Scholar]
  8. Patier, D.; Abdelhaï, L. Emerging Sustainable Urban Logistics Concepts: A Case Study in France. Transp. Res. Procedia 2025, 82, 3437–3453. [Google Scholar] [CrossRef]
  9. The Concept for the Development of the Transport and Logistics Potential of the Republic of Kazakhstan Until 2030. Decree of the Government of the Republic of Kazakhstan No. 1116. 30 December 2022. Available online: https://adilet.zan.kz/rus/docs/P2200001116/links (accessed on 3 October 2024). (In Russian).
  10. International Institute for Management Development. IMD World Competitiveness Yearbook; IMD: Lausanne, Switzerland, 2024; Available online: https://worldcompetitiveness.imd.org (accessed on 15 December 2024).
  11. Logistics Performance Index (LPI). Available online: https://lpi.worldbank.org/international/global (accessed on 16 December 2024).
  12. Travel & Tourism Development Index 2021 Rebuilding for a Sustainable and Resilient Future INSIGHT REPORT MAY 2022. Available online: https://www3.weforum.org/docs/WEF_Travel_Tourism_Development_2021.pdf (accessed on 15 November 2024).
  13. The General Plan of the City of Astana Until 2035. Decree of the Government of the Republic of Kazakhstan No. 33. 25 January 2024. Available online: https://adilet.zan.kz/rus/docs/P2400000033 (accessed on 15 November 2024). (In Russian).
  14. Raimbekov, Z.; Syzdykbayeva, B.; Rakhmetulina, A.; Rakhmetulina, Z.; Abylaikhanova, T.; Doltes, L.; Kinasheva, Z. Designing and improving the efficiency of placement of logistics infrastructure for storage, distribution and trade of agri-food products. J. Ind. Eng. Manag. 2024, 17, 777–808. [Google Scholar] [CrossRef]
  15. Batarlienė, N.; Bazaras, D. Solutions to the Problem of Freight Transport Flows in Urban Logistics. Appl. Sci. 2023, 13, 4214. [Google Scholar] [CrossRef]
  16. Pasichnyk, A.; Lebid, I.; Kushchenko, Y. Analysis of the Efficiency of Building a Network of Transport and Logistics Complexes Based on the Factor-Rating Model. Transp. Syst. Technol. 2022, 39, 216–228. [Google Scholar] [CrossRef]
  17. Pan, S.; Zhou, W.; Piramuthu, S.; Giannikas, V.; Chen, C. Smart city for sustainable urban freight logistics. Int. J. Prod. Res. 2021, 59, 2079–2089. [Google Scholar] [CrossRef]
  18. Slávik, R.; Beňová, D.; Gnap, J.; Stopka, O. City Logistics and Air Quality. Transp. Commun. 2018, 6, 26–29. [Google Scholar] [CrossRef]
  19. Dablanc, L. Goods transport in large European cities: Difficult to organize, difficult to modernize. Transp. Res. Part A-Policy Pract. 2007, 41, 280–285. [Google Scholar] [CrossRef]
  20. Crainic, T.; Ricciardi, N.; Storchi, G. Models for Evaluating and Planning City Logistics Transportation Systems. Transp. Sci. 2009, 43, 432–454. [Google Scholar] [CrossRef]
  21. Crainic, T.G.; Ricciardi, N.; Storchi, G. Advanced freight transportation systems for congested urban areas. Transp. Res. Part C 2014, 12, 119–137. [Google Scholar] [CrossRef]
  22. Antún, J.P.; Lozano, A.; Alarcón, R.; Granados, F.; Guarneros, L. The physical distribution of goods in a megalopolis: Strategies for policies on the location of logistics facilities within the Central Region of Mexico. Procedia-Soc. Behav. Sci. 2010, 2, 6130–6140. [Google Scholar] [CrossRef]
  23. Taniguchi, E.; Thompson, R.G.; Yamada, T. Emerging Techniques for Enhancing the Practical Application of City Logistics Models. Procedia-Soc. Behav. Sci. 2012, 39, 3–18. [Google Scholar] [CrossRef]
  24. Taniguchi, E. Concepts of City Logistics for Sustainable and Liveable Cities. Procedia-Soc. Behav. Sci. 2014, 151, 310–317. [Google Scholar] [CrossRef]
  25. Gupta, R.; Kumar, A. IoT-Enabled Smart Logistics for Megacities. J. Urban Technol. 2021, 28, 78–95. [Google Scholar]
  26. Bowersox, D.J.; Klos, D.J. Logistics: An Integrated Supply Chain; ZAO Olimp-Business: Moscow, Russia, 2005; 640p. (In Russian) [Google Scholar]
  27. Christopher, M. Logistics and Supply Chain Management; Lukinsky, V.S., Ed.; Piter: St. Petersburg, Russia, 2004; 316p. (In Russian) [Google Scholar]
  28. Mangan, J.; Lalwani, C.; Butcher, T.T. Global Logistics and Supply Chain Management; John Wiley and Sons: New York, NY, USA, 2008. [Google Scholar]
  29. Hoover, E.M. The Location of Economic Activity; McGraw Hill Book Company: New York, NY, USA, 1948. [Google Scholar]
  30. Sergeev, V.I. Logistics in Business: Textbook; INFRA-M: Moscow, Russia, 2001; p. 608. (In Russian) [Google Scholar]
  31. Romeijn, H.E.; Shu, J.; Teo, C.-P. Designing Two-Echelon Supply Network. Eur. J. Oper. Res. 2007, 178, 449–462. [Google Scholar] [CrossRef]
  32. Romeijn, H.E.; Al-Gwaiz, M.; Chao, X. Capacity Expansion and Cost Efficiency Improvement in the Warehouse Problem. Nav. Res. Logist. 2016, 63, 367–373. [Google Scholar]
  33. Geunes, J.; Romeijn, H.E.; Van Den Heuvel, W. Improving the Efficiency of Decentralized Supply Chains with Fixed Ordering. Eur. J. Oper. Res. 2016, 252, 815–828. [Google Scholar] [CrossRef]
  34. Savelsbergh, M.; Woensel, T.V. 50th Anniversary Invited Article—City Logistics: Challenges and Opportunities. Transp. Sci. 2016, 50, 579–590. [Google Scholar] [CrossRef]
  35. Thu, L.T.B. Interactions Between Urbanization and Logistics Infrastructure in Suburbs of Ho Chi Minh City. Lect. Notes Civ. Eng. 2024, 442, 110–118. [Google Scholar]
  36. Albalate, D.; Germà, B. Tourism and urban public transport: Holding demand pressure under supply constraints. Tour. Manag. 2010, 31, 425–433. [Google Scholar] [CrossRef]
  37. Hącia, E.; Wagner, N.; Łapko, A. The Importance of City Logistics for Urban Tourism Development: Searching for a New Research Field. Energies 2023, 16, 175. [Google Scholar] [CrossRef]
  38. Sushchenko, R.; Zapara, Y.; Saienko, V.; Kostiushko, V.; Lytvynenko, L.; Pron, S. Urban transport, logistics, and tourism: Review of a cutting-edge socially-oriented approach to industrial development. Acta Sci. Pol. Adm. Locorum 2023, 22, 101–111. [Google Scholar] [CrossRef]
  39. Ardalan, A. A Comparison of Heuristic Methods for Service Facility Locations. Int. J. Oper. Prod. Manag. 1988, 8, 52–58. [Google Scholar] [CrossRef]
  40. Rutten, W.G.M.M.; Van Laarhoven, P.J.M.; Vos, B. The extension of GOMA model for determining the optimal number of depots. IIE Trans. 2003, 33, 1031–1036. [Google Scholar] [CrossRef]
  41. Geoffrion, A.M.; Morris, J.; Webster, S. Distribution System Design. Facility Location: A Survey of Applications and Methods; Drezner, Z., Ed.; Springer: New York, NY, USA, 1995. [Google Scholar]
  42. Klose, A.; Drexl, A. Facility location models for distribution system design. Eur. J. Oper. Res. 2005, 162, 4–29. [Google Scholar] [CrossRef]
  43. Land, A.H.; Doig, A.G. An Automatic Method for Solving Discrete Programming Problems. In 50 Years of Integer Programming 1958–2008; Jünger, M., Liebling, T.M., Naddef, D., Nemhauser, G.L., Pulleyblank, W.R., Reinelt, G., Rinaldi, G., Wolsey, L.A., et al., Eds.; Springer: Berlin/Heidelberg, Germany, 2010. [Google Scholar] [CrossRef]
  44. Tutte, W.T. Graph Theory; Cambridge University Press: Cambridge, UK, 2001. [Google Scholar]
  45. Levin, O. Discrete Mathematics: An Open Introduction; University of Northern Colorado: Greeley, CO, USA, 2017; p. 345. Available online: https://discrete.openmathbooks.org/dmoi3.html (accessed on 10 November 2024).
  46. Hammouche, A.; Webster, D.B. Evaluation of an application of graph theory to the layout problem. Int. J. Prod. Res. 2007, 23, 987–1000. [Google Scholar] [CrossRef]
  47. Mohsen, H.; Hogg, G.L. A review of graph theory application to the facilities layout problem. Omega 1987, 15, 291–300. [Google Scholar]
  48. Megiddo, N.; Supowit, K.J. On the complexity of some common geometric location problems. SIAM J. Comput. 1984, 13, 182–196. [Google Scholar] [CrossRef]
  49. Shvalov, P.G.; Tarasov, S.A.; Lukinykh, V.F. A Model of Development Vectors for the Logistics Infrastructure of the Krasnoyarsk Urban Agglomeration. Manag. Econ. Syst. Electron. Sci. J. 2013, 6, 33–39. (In Russian) [Google Scholar]
  50. Lukinykh, V.F.; Shvalov, P.G. Model of development of logistics infrastructure of the urban agglomeration in Krasnoyarsk Krai. J. Sib. Fed. Univ. Humanit. Soc. Sciences. Suppl. 2015, 8, 190–208. (In Russian) [Google Scholar]
  51. Tarasov, S.A.; Tarasov, Y.S.; Shvalov, P.G. Method for determining the poles of the meso-region graph of the logistics infrastructure of a megalopolis. In Proceedings of the VIII International Scientific Practical Conference, Part 1, Krasnoyarsk, Russia, 16–18 May 2013; Krasnoyarsk State Agrarian University: Krasnoyarsk, Russia, 2013; p. 597. (In Russian). [Google Scholar]
  52. Li, S.; Xu, J.; Cele, S. Application of graph theory in transportation linkage in logistics management and its computer aided model design. J. Intell. Fuzzy Syst. 2019, 37, 3319–3326. [Google Scholar] [CrossRef]
  53. Rao, C.; Goh, M.; Zhao, Y.; Zheng, J. Location selection of city logistics centers under sustainability. Transp. Res. Part D 2015, 36, 29–44. [Google Scholar] [CrossRef]
  54. Pucher, J.; Buehler, R. Cycling towards a more sustainable transport future. Transp. Rev. 2017, 37, 689–694. [Google Scholar] [CrossRef]
  55. Lu, F.; Hao, H.; Bi, H. Evaluation on the development of urban low-carbon passenger transportation structure in Tianjin. Res. Transp. Bus. Manag. 2024, 55, 101142. [Google Scholar] [CrossRef]
  56. Škultéty, F.; Beňová, D.; Gnap, J. City Logistics as an Imperative Smart City Mechanism: Scrutiny of Clustered EU27 Capitals. Sustainability 2021, 13, 3641. [Google Scholar] [CrossRef]
  57. Ouariti, O.Z.; Jebrane, E.M. The impact of transport infrastructure on tourism destination attractiveness: A case study of Marrakesh City, Morocco. Afr. J. Hosp. Tour. Leis. 2020, 9, 1–18. [Google Scholar]
  58. Santos, G.; Ribeiro, P. Green Urban Logistics: A Framework for Sustainable Last-Mile Delivery. Sustain. Cities Soc. 2022, 76, 103–115. [Google Scholar]
  59. Scherrer, M. Coopetitive urban logistics to decrease freight traffic and improve urban liveability. In The Palgrave Handbook of Supply Chain Management; Palgrave Macmillan: Cham, Switzerland, 2024; pp. 747–768. [Google Scholar] [CrossRef]
  60. Zawieska, J.; Pieriegud, J. Intelligent Transport Systems: Cases and Policies. In Book: Smart Cities in the Post-Algorithmic Era; Springer: Berlin/Heidelberg, Germany, 2018. [Google Scholar]
  61. Mouratidis, K.; Caggiani, L. MaaS for Freight: A Paradigm Shift in Urban Logistics. Transp. Res. Part A Policy Pract. 2023, 172, 200–215. [Google Scholar]
  62. Kim, H.; Park, S. AI-Based Routing Optimization for Urban Freight: A Case Study of Seoul. Expert Syst. Appl. 2023, 214, 119–130. [Google Scholar]
  63. Bosona, T. Urban Freight Last Mile Logistics-Challenges and Opportunities to Improve Sustainability: A Literature Review. Sustainability 2020, 12, 8769. [Google Scholar] [CrossRef]
  64. Prus, P.; Sikora, M. The Impact of Transport Infrastructure on the Sustainable Development of the Region—Case Study. Agriculture 2021, 11, 279. [Google Scholar] [CrossRef]
  65. Kuse, H.; Endo, A.; Iwao, E. Logistics facility, road network and district planning: Establishing comprehensive planning for city logistics. Procedia-Soc. Behav. Sci. 2010, 2, 6251–6263. [Google Scholar] [CrossRef]
  66. Dijkstra, E.W. A note on two problems in connexion with graphs. Numer. Math. 1959, 1, 269–271. [Google Scholar] [CrossRef]
  67. Ore, O. Theory of Graphs; American Mathematical Society Colloquium Publications; American Mathematical Society: Providence, RI, USA, 1962. [Google Scholar]
  68. Cervero, R. Transit-Oriented Development and Land Use. In Encyclopedia of Sustainability Science and Technology; Meyers, R.A., Ed.; Springer: New York, NY, USA, 2012. [Google Scholar] [CrossRef]
  69. Katti, H. Role of Intelligent Transportation Solutions in Multimodal Transportation Systems. Int. J. Innov. Res. Adv. Eng. 2022, 9, 9–15. [Google Scholar] [CrossRef]
Figure 1. Scheme of the model of transport and logistics infrastructure of the city.
Sustainability 17 02486 g001
Figure 2. Division of the urban area into meso-districts (using the city of Astana as an example), where 1–21 are the city’s meso-districts.
Sustainability 17 02486 g002
Figure 3. The adjacent structure of graph G of the core of a city model (using the city of Astana as an example).
Sustainability 17 02486 g003
Figure 4. Heatmap of Astana city by AVP indicator.
Sustainability 17 02486 g004
Figure 5. The capacity of the road transport network and the average polarity of the meso-districts of the city of Astana, where the numbers and names of the meso-districts are marked on the horizontal axis and the number of cars on the vertical line.
Sustainability 17 02486 g005
Figure 6. Layout of economic, social, institutional and environmental infrastructure facilities, where A is the area of the historical center of Astana, B and C are the area of the old and new railway stations, and D is the area of the airport. Note: WRTN—wholesale and retail trade network; CDC—consolidated distribution center; WM—wholesale market; CFM—central food market; CMVF—central market for vegetables and fruit; TSW—temporary storage warehouse; TLC—trade and logistic center; SM—supermarket; TC/LC—transport company and logistic center.
Sustainability 17 02486 g006
Figure 7. Average daily speed of motor vehicles in the city core by map «https://yandex.kz/maps/ (accessed on 11 December 2024)»: V—average daily speed of movement of vehicles (km/h); Sustainability 17 02486 i001—meso-districts with a high level of traffic congestion during rush hours (8.45–9.45; 12.40–13.45; 17.30–18.30 h).
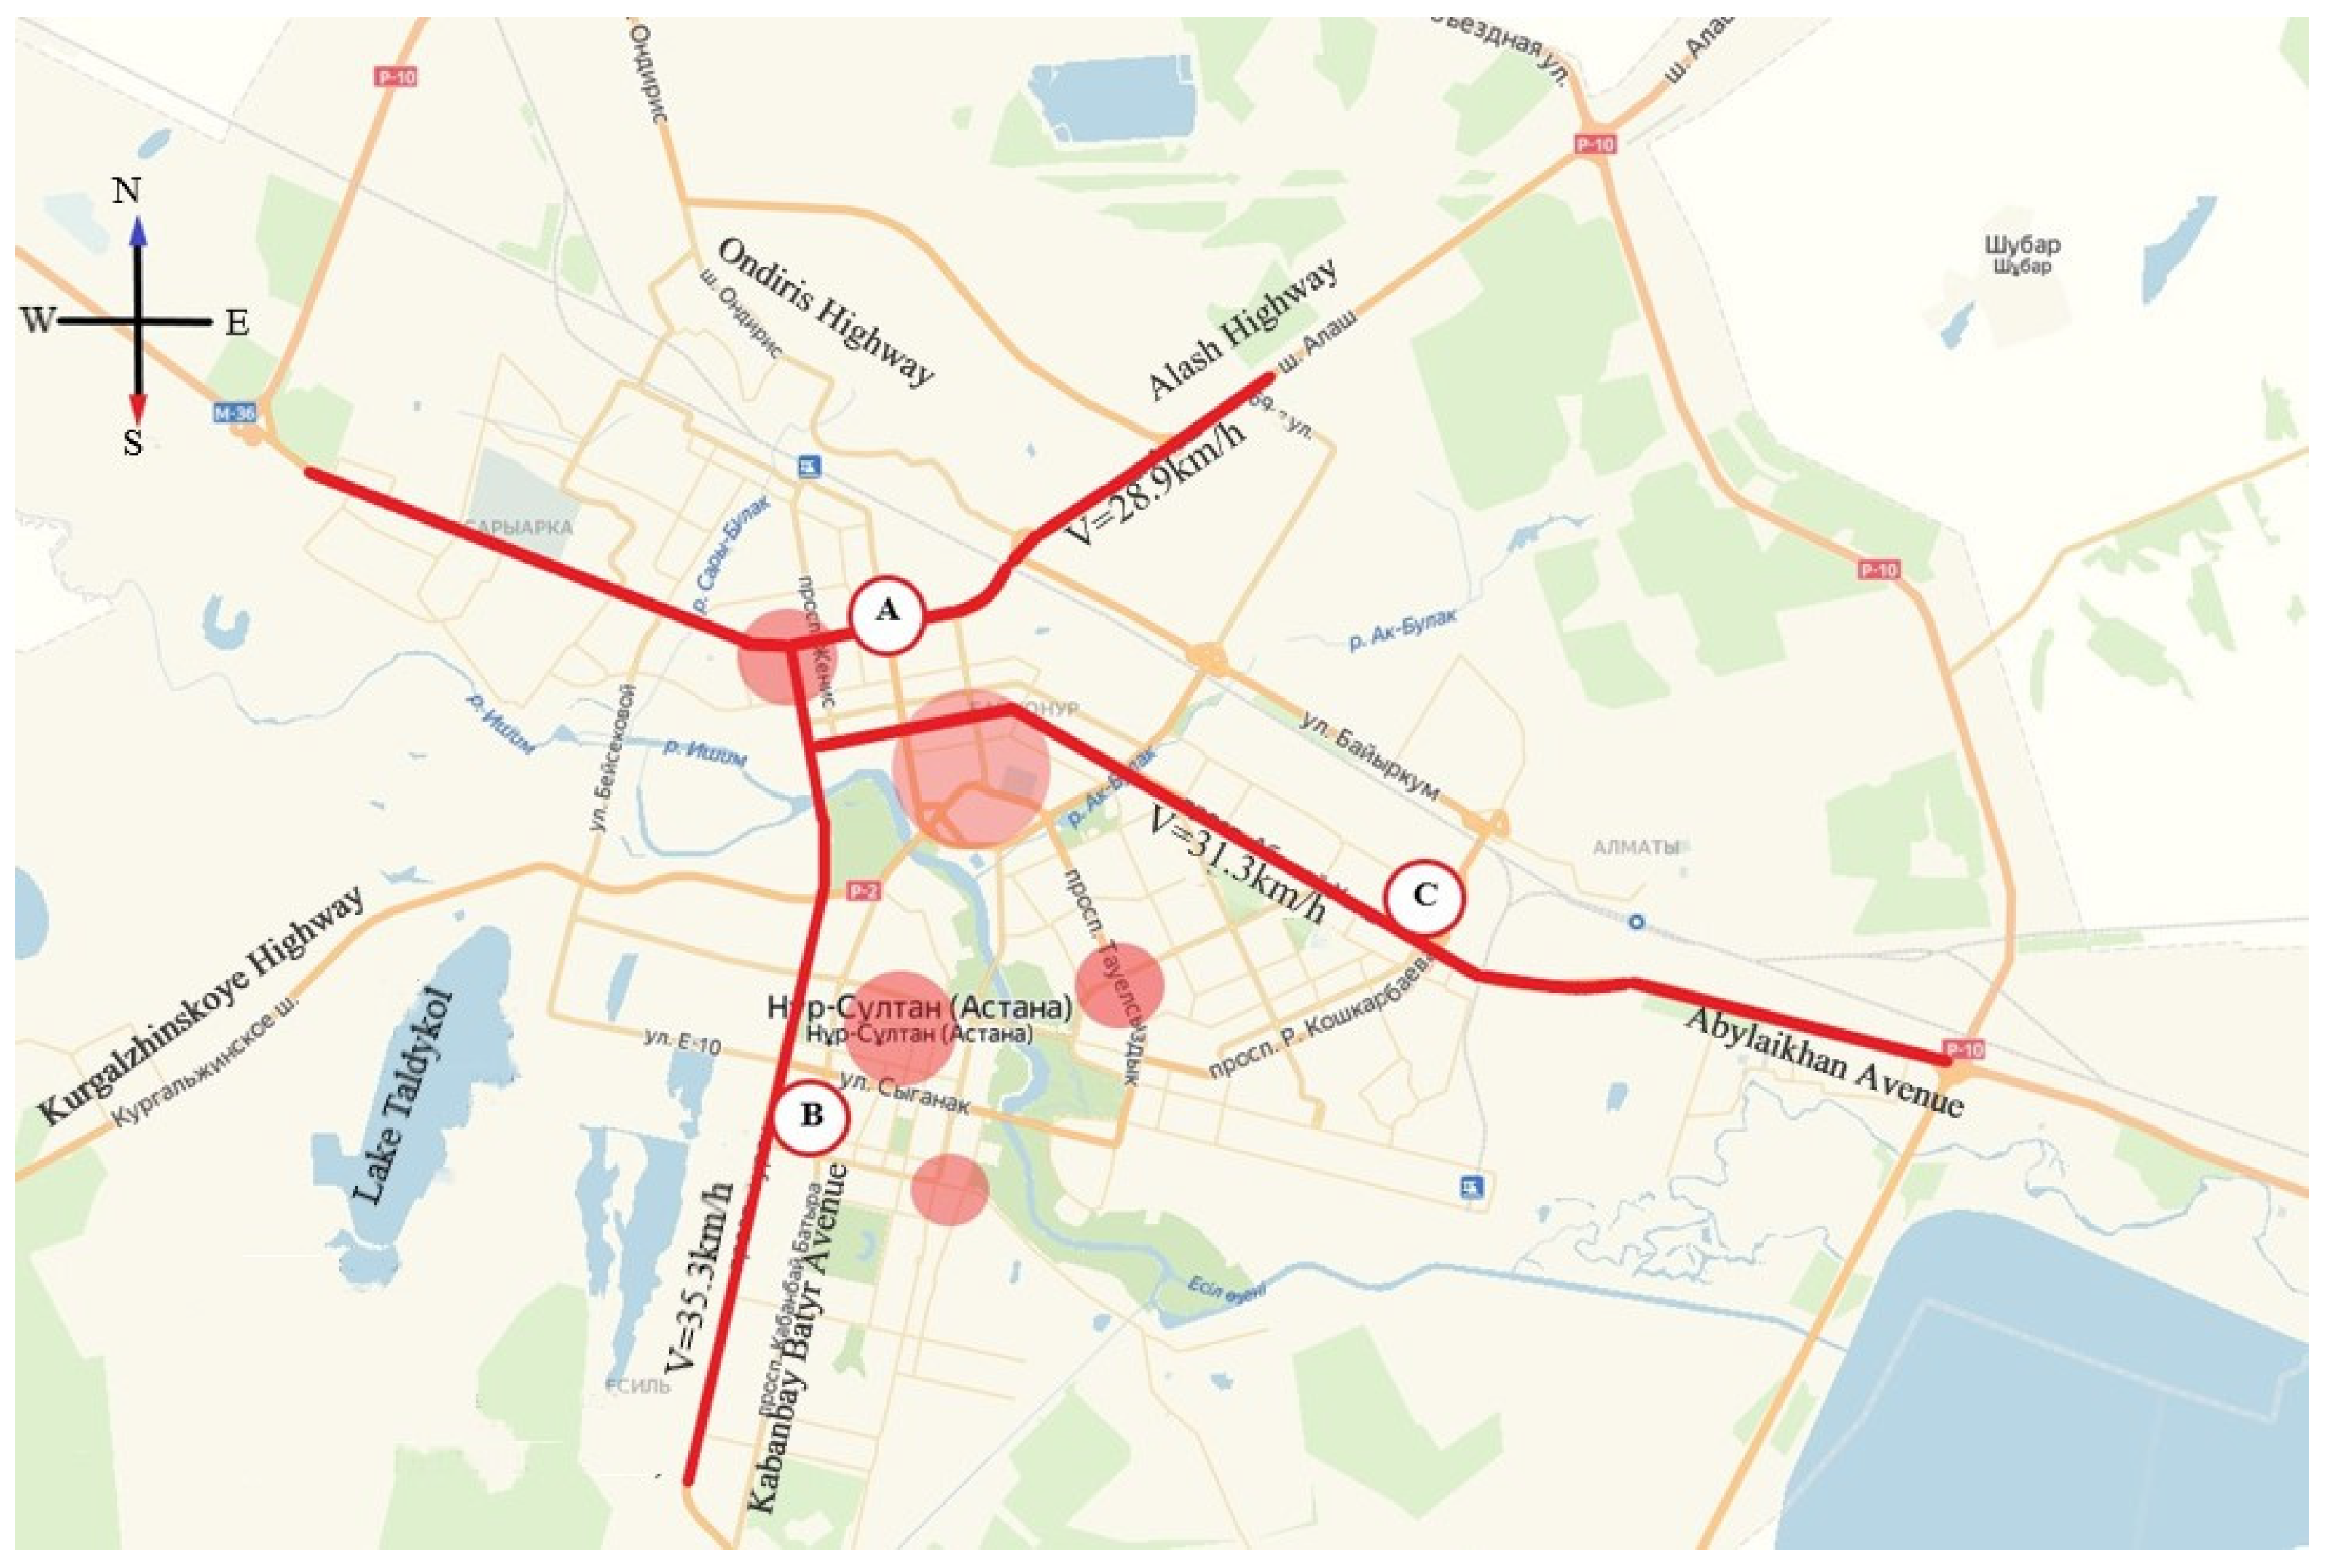
Sustainability 17 02486 g007
Table 1. Description of the components of the city transport and logistics infrastructure model.
ComponentDescriptionReferences
Economic infrastructureFocuses on trade, transportation, tourism and manufacturing. Includes two- and three-level distribution centers, e-commerce hubs and industrial zones[22,23,34,37,52,54]
Social infrastructureCovers public services, health care, education and cultural institutions. Ensures quality of life and accessibility for residents[35,36,37,38]
Institutional infrastructureIncludes governance, financial institutions, public safety, supply chain management (SCM) and intelligent transportation systems (ITS). Supports regulatory frameworks and funding mechanisms[33,50,54,56,57]
Ecological infrastructureManages natural resources, waste management systems and sustainable development. Includes “green” logistics and emission reduction strategies[48,55,56,58,59]
Freight transport infrastructureOptimizes cargo logistics through multi-tier hubs (e.g., city distribution centers, satellite platforms). Integrates “last mile” solutions and warehouse networks[13,16,30,49,56,60,61,62]
Passenger logistics infrastructureImproves public transport, tourist flows and intermodal connectivity. Uses light rail, Mobility as a Service (MaaS) and traffic management systems[36,57,63,64,65]
Table 2. Logistic flow of the city of Astana.
No. Meso-
Districts
VIPVSGSVIPnNBETBGNPVSRAAPNSCFNSPALR
1. Yesil district
12.24555.859.010.81190.219.5178.442.519.716.226.0
22.15432.356.48.41138.418.2171.058.026.922.131.4
32.05277.953.85.41086.723.5163.250.323.319.220.5
41.95154.451.33.01034.925.4155.465.730.425.16.8
50.48463.112.89.0258.724.139.158.026.922.15.5
60.58555.815.410.8310.513.546.865.730.425.14.1
70.36648.47.712.5155.217.523.646.421.517.742.3
Total of 19.803087.5256.459.75174.6141.7777.5386.6179.0147.4136.6
Share by 1, %29.638.413.028.63.329.035.029.227.70.458.6
2. Almaty district
80.44450.3143.221.226,490.321.392.975.529.810.34.1
90.42492.5136.723.225,286.223.388.757.622.77.93.3
100.4098.5130.24.624,082.131.384.586.334.111.82.1
110.36126.6117.26.021,673.925.876.075.529.810.32.4
120.38239.2123.711.322,878.020.580.364.825.68.85.3
Total of 22.021407.1650.966.3120,410.6122.2422.1359.7142.049.117.2
Share by 2, %6.117.533.031.777.725.019.027.122.014.07.4
3. Saryarka district
138.08183.2125.38.39863.821.2124.451.624.616.31.4
168.51140.1135.56.410,663.615.5134.551.624.616.32.1
171.49161.623.77.31866.127.923.762.029.519.63.5
182.13258.633.911.72665.913.733.782.639.426.14.4
191.06334.016.915.21332.914.516.996.445.930.511.8
Total of 321.271077.4335.348.926,392.392.8333.2344.2164.0108.823.1
Share by 3, %64.313.417.023.417.019.015.026.025.40.39.9
4. Baikonur district
140.00296.2277.34.11139.435.9261.458.740.311.49.5
150.00419.6262.75.81079.431.2247.749.333.89.614.0
200.00715.8109.59.9449.835.2103.554.037.010.59.5
210.001036.780.314.3329.829.776.072.749.914.123.0
Total of 40.002468.4729.834.12998.4132.0688.7234.6161.045.656.2
Share by 4, %0.0030.737.016.31.927.031.017.724.90.124.1
Total by
p. 1–21
33.18040.51972.4209.1154,975.9488.72221.91325.1646.0351.0233.1
Average
p. 1–21
1.6382.993.910.07379.823.3105.863.130.816.711.1
SD2.3228.873.35.19763.56.668.513.77.86.411.0
SE0.5149.916.01.122130.51.4414.93.01.711.402.40
RL1.05104.133.32.34444.33.031.26.23.52.95.0
Source: Data from the Bureau of National Statistics of the Republic of Kazakhstan. Note: (1) Meso-districts: Saryarka—13, 16, 17, 18, 19; Almaty—8, 9, 10, 11, 12; Yesil—1, 2, 3, 4, 5, 6, 7; Baikonur—14, 15, 20, 21. (2) SD—standard deviation, SE—standard error, RL—reliability level at 95.0%.
Disclaimer/Publisher’s Note: The statements, opinions and data contained in all publications are solely those of the individual author(s) and contributor(s) and not of MDPI and/or the editor(s). MDPI and/or the editor(s) disclaim responsibility for any injury to people or property resulting from any ideas, methods, instructions or products referred to in the content.

