Article

Research on Soil Inorganic Nitrogen Detection Technology Based on Dielectric Response

College of Water Conservancy and Construction Engineering, Northwest Agricultural and Forestry University, Yangling 712100, China
*
Author to whom correspondence should be addressed.
Sustainability 2025, 17(6), 2491; https://doi.org/10.3390/su17062491
Submission received: 8 January 2025 / Revised: 8 March 2025 / Accepted: 10 March 2025 / Published: 12 March 2025

Abstract

:
Efficient monitoring of soil inorganic nitrogen is crucial for precision agriculture fertilization and ecological environmental protection. Traditional detection methods are complex and challenging for real-time in situ measurements. This study proposes an innovative approach based on dielectric response characteristics, enabling non-destructive and rapid detection by analyzing soil polarization behavior in an electromagnetic field. Using a vector network analyzer (E5071-C), we systematically measured the complex dielectric spectra of red soil and yellow clay loam across a wide frequency range from 10 MHz to 4.5 GHz. Coupled with water–nitrogen interaction experiments (volume water content: 0.05–0.25 cm3/cm3; nitrogen concentration: 0–0.2 mol/L), we established a high-frequency–low-frequency collaborative detection model. The study found that at the 3.8 GHz high-frequency band, the interface polarization weakening effect allows for the precise measurement of soil water content (R2 = 0.82; RMSE = 0.030 cm3/cm3). In the 100–200 MHz low-frequency band, based on ion migration dynamics, we successfully identified characteristic sensitive frequency bands for NH4+ (136–159 MHz) and NO3 (97–129 MHz). Notably, at 127 MHz, the water–nitrogen coupling model predicted inorganic nitrogen content with a determination coefficient of 0.721. This method effectively overcomes the water interference issue inherent in traditional single-frequency dielectric methods through a dual-frequency decoupling mechanism. The findings lay a theoretical foundation for developing in situ sensors for farmland. Real-time monitoring can significantly improve nitrogen fertilizer utilization efficiency and reduce environmental pollution, offering substantial application value for advancing precision agriculture and sustainable development.

1. Introduction

Soil inorganic nitrogen is a crucial nutrient that is essential for plant growth and metabolism, playing a vital role in plant development [1]. Effective nitrogen management is essential for enhancing soil nitrogen fertilizer utilization efficiency, boosting crop yields, and safeguarding the ecological environment [2]. The nitrification, denitrification, and leaching of nitrogen fertilizers in agricultural soils are dynamic processes, and the presence and migration of nitrogen ions alter the dielectric properties of soils [3]. Consequently, the dynamic changes in soil nitrogen can be monitored and evaluated using dielectric spectroscopy.
Current methodologies for soil inorganic nitrogen detection encompass a range of analytical techniques, each presenting distinct advantages and limitations. Classical chemical approaches, such as the Kjeldahl method [4], have demonstrated robust reliability in determining soil nitrogen content across a broad concentration spectrum (0.03–2.7%), as validated through comprehensive sample analyses [5]. Spectrophotometric techniques have evolved through systematic optimizations [6]: UV-based methods have been refined to address extraction efficiency challenges for nitrate (NO3) and ammonium (NH4+) under multifactorial soil conditions [7], while flow injection analyzers achieve strong correlations with conventional laboratory measurements (R = 0.998 for NO3, R = 0.851 for NH4+) [8,9]. Advanced optical spectroscopy platforms [10], including visible–near-infrared spectroscopy (Vis-NIRS), exhibit exceptional predictive capabilities for soil organic carbon, total nitrogen, and mineralizable nitrogen quantification [11], complemented by mid-infrared (MIR) spectral techniques enabling comprehensive soil nitrogen profiling [12]. Near-infrared (NIR) spectroscopic innovations have further addressed matrix interference through moisture compensation algorithms, establishing real-time monitoring frameworks in nitrogen-sensitive spectral regions [13,14].
Electrochemical detection systems [15], particularly ion-selective electrodes (ISEs), provide viable alternatives for nitrate detection [16], though constrained by mandatory solution-phase immersion requirements and prolonged equilibration times that limit field applicability [17]. Voltage transduction methodologies, while demonstrating proof-of-concept for nitrate quantification [18], face inherent challenges in signal stability and soil matrix interactions.
Despite their analytical precision, these conventional methods collectively exhibit critical limitations: (1) labor-intensive protocols requiring specialized technical expertise; (2) extended analytical cycles (>1 h) incompatible with real-time monitoring needs; (3) elevated operational costs associated with consumables and instrumentation maintenance; and (4) limited adaptability to in situ agricultural environments. These constraints highlight the urgent demand for innovative detection paradigms that harmonize analytical accuracy with field-deployable practicality [12].
Dielectric measurement techniques have emerged as a promising approach for in situ, real-time, and non-destructive detection of soil inorganic nitrogen, offering distinct advantages in precision agriculture and environmental monitoring [19]. Pioneering studies have systematically explored the dielectric response mechanisms of soil nitrogen components: Time Domain Reflectometry (TDR) probes were successfully employed to monitor conductivity changes during organic nitrogen mineralization, demonstrating strong correlations between soil solute cation dynamics and inorganic nitrogen prediction accuracy [20]. Subsequent investigations utilizing frequency-specific analyses revealed critical insights into nitrogen dielectric behavior. For instance, Tsegaye et al. [21] quantified the influence of nitrate ions (NO3) on dielectric properties using Delta-T Theta probes, while Payero et al. [22] systematically evaluated temperature and solute effects on TDR-based nitrate monitoring. Advancements in sensor design include parallel-plate configurations for urea detection [23] and LCR-based methodologies achieving 1 kHz precision in ammonium measurement [24]. Notably, Chaudhari et al. [25] established significant C-band dielectric correlations with soil physical–nutrient parameters, and Bonachela et al. [26] demonstrated dielectric sensors’ efficacy in mapping nutrient distribution under drip irrigation systems. Recent innovations encompass multi-frequency approaches (1–40 MHz) employing Bruggeman’s dielectric mixing model for nitrate quantification [27], as well as biochar–urea interaction analyses through dielectric spectroscopy [25]. Breakthroughs in capacitive coupling techniques further enabled rapid multi-nutrient detection [28].
Currently, the dielectric method for monitoring soil inorganic nitrogen content is mainly based on ionic conductivity, but it is affected by complex ionic systems, leaving room for improvement in measurement accuracy. Research has focused on numerical analysis, with narrower measurement bands, and less exploration of soil polarization laws under water–nitrogen coupling conditions. Therefore, it is necessary to strengthen the theory and analysis of soil dielectric research, explore the microscopic polarization mechanisms of soil, establish multi-parameter soil nutrient measurement models, and improve measurement accuracy and stability.
This study proposes an innovative approach to measure soil inorganic nitrogen using dielectric response. It is different from traditional methods; our approach offers real-time, in situ, and non-destructive measurement capabilities, which are particularly valuable for precision irrigation and soil pollution control. This novel method allows for continuous monitoring of soil nitrogen levels, providing a more efficient and sustainable solution for agricultural management.

2. Materials and Methods

2.1. Experimental Material

The laterite and loess samples were collected from Kunming City, Yunnan Province, and Mili County, Yulin City, Shaanxi Province, respectively, at a depth of 20–30 cm. Following collection, the samples were air-dried in a well-ventilated environment, with impurities removed, and subsequently ground through an 18-mesh sieve. The soils were then oven-dried at 105 °C for 12 h using a DGG-9070A (Shanghai Xinxin Scientific Instrument Co., Ltd., Shanghai, China) drying oven and stored in zip-lock bags for further analysis. For pretreatment, the samples were leached and oscillated with a potassium chloride solution, followed by filtration to retain the leachate. Ammonium nitrogen (NH4+) and nitrate nitrogen (NO3) concentrations were quantified using a continuous flow analyzer (AA3, SEAL Analytical, Mequon, WI, USA), while soil pH was measured with a pH electrode. Soil texture, including clay, silt, and sand fractions, was determined using sieve analysis and sedimentation methods.
The measured data of some physical and chemical properties of the soil are shown in Table 1. Compared with the ratio concentration of ammonium chloride and potassium nitrate set in this experiment, the original ammonium nitrogen and nitrate nitrogen content of the soil were at a lower level, which had almost no effect on the measurement accuracy of this experiment and the subsequent statistical analysis results, ensuring that the experimental data could more accurately reflect the effect of the addition of inorganic nitrogen treatment.

2.2. Experimental Design

Analytically pure reagents of ammonium chloride (NH4Cl), potassium nitrate (KNO3), and deionized water were used to prepare ammonium chloride and potassium nitrate solutions with volumetric molar concentrations of 0, 0.05, 0.10, 0.15, and 0.20 mol/L, respectively. Soil samples with volumetric water contents of 0.05, 0.10, 0.15, 0.20, and 0.25 cm3/cm3 were prepared sequentially. At room temperature (23 °C ± 2 °C), the soil and NH4Cl solution were mixed uniformly and rested for more than 12 h. The resting soil samples were then filled and compacted into PVC pipes with a height of 7 cm and a diameter of 4.57 cm, and sealed with plastic wrap to reduce water loss, resulting in a total of 100 groups of soil samples. (See Figure 1).
A vector network analyzer (E5071-C, Keysight Technologies, Santa Rosa, CA, USA) was used to measure the soil samples, with the number of sampling points set to 501 and the measurement band ranging from 10 MHz to 4.5 GHz. The test fixture used an N1501A (Keysight Technologies, Santa Rosa, CA, USA) dielectric probe, and the measurement system is shown in Figure 2. Three dielectric measurements were taken from the prepared soil samples to obtain the average value. After the measurement was completed, the actual volumetric soil moisture content was determined using the drying method. Three soil samples were taken from each PVC pipe, placed in an aluminum box, weighed and recorded with a balance, and then dried in an oven at 105 °C for 12 h. The actual volumetric soil moisture content was calculated using the average value.

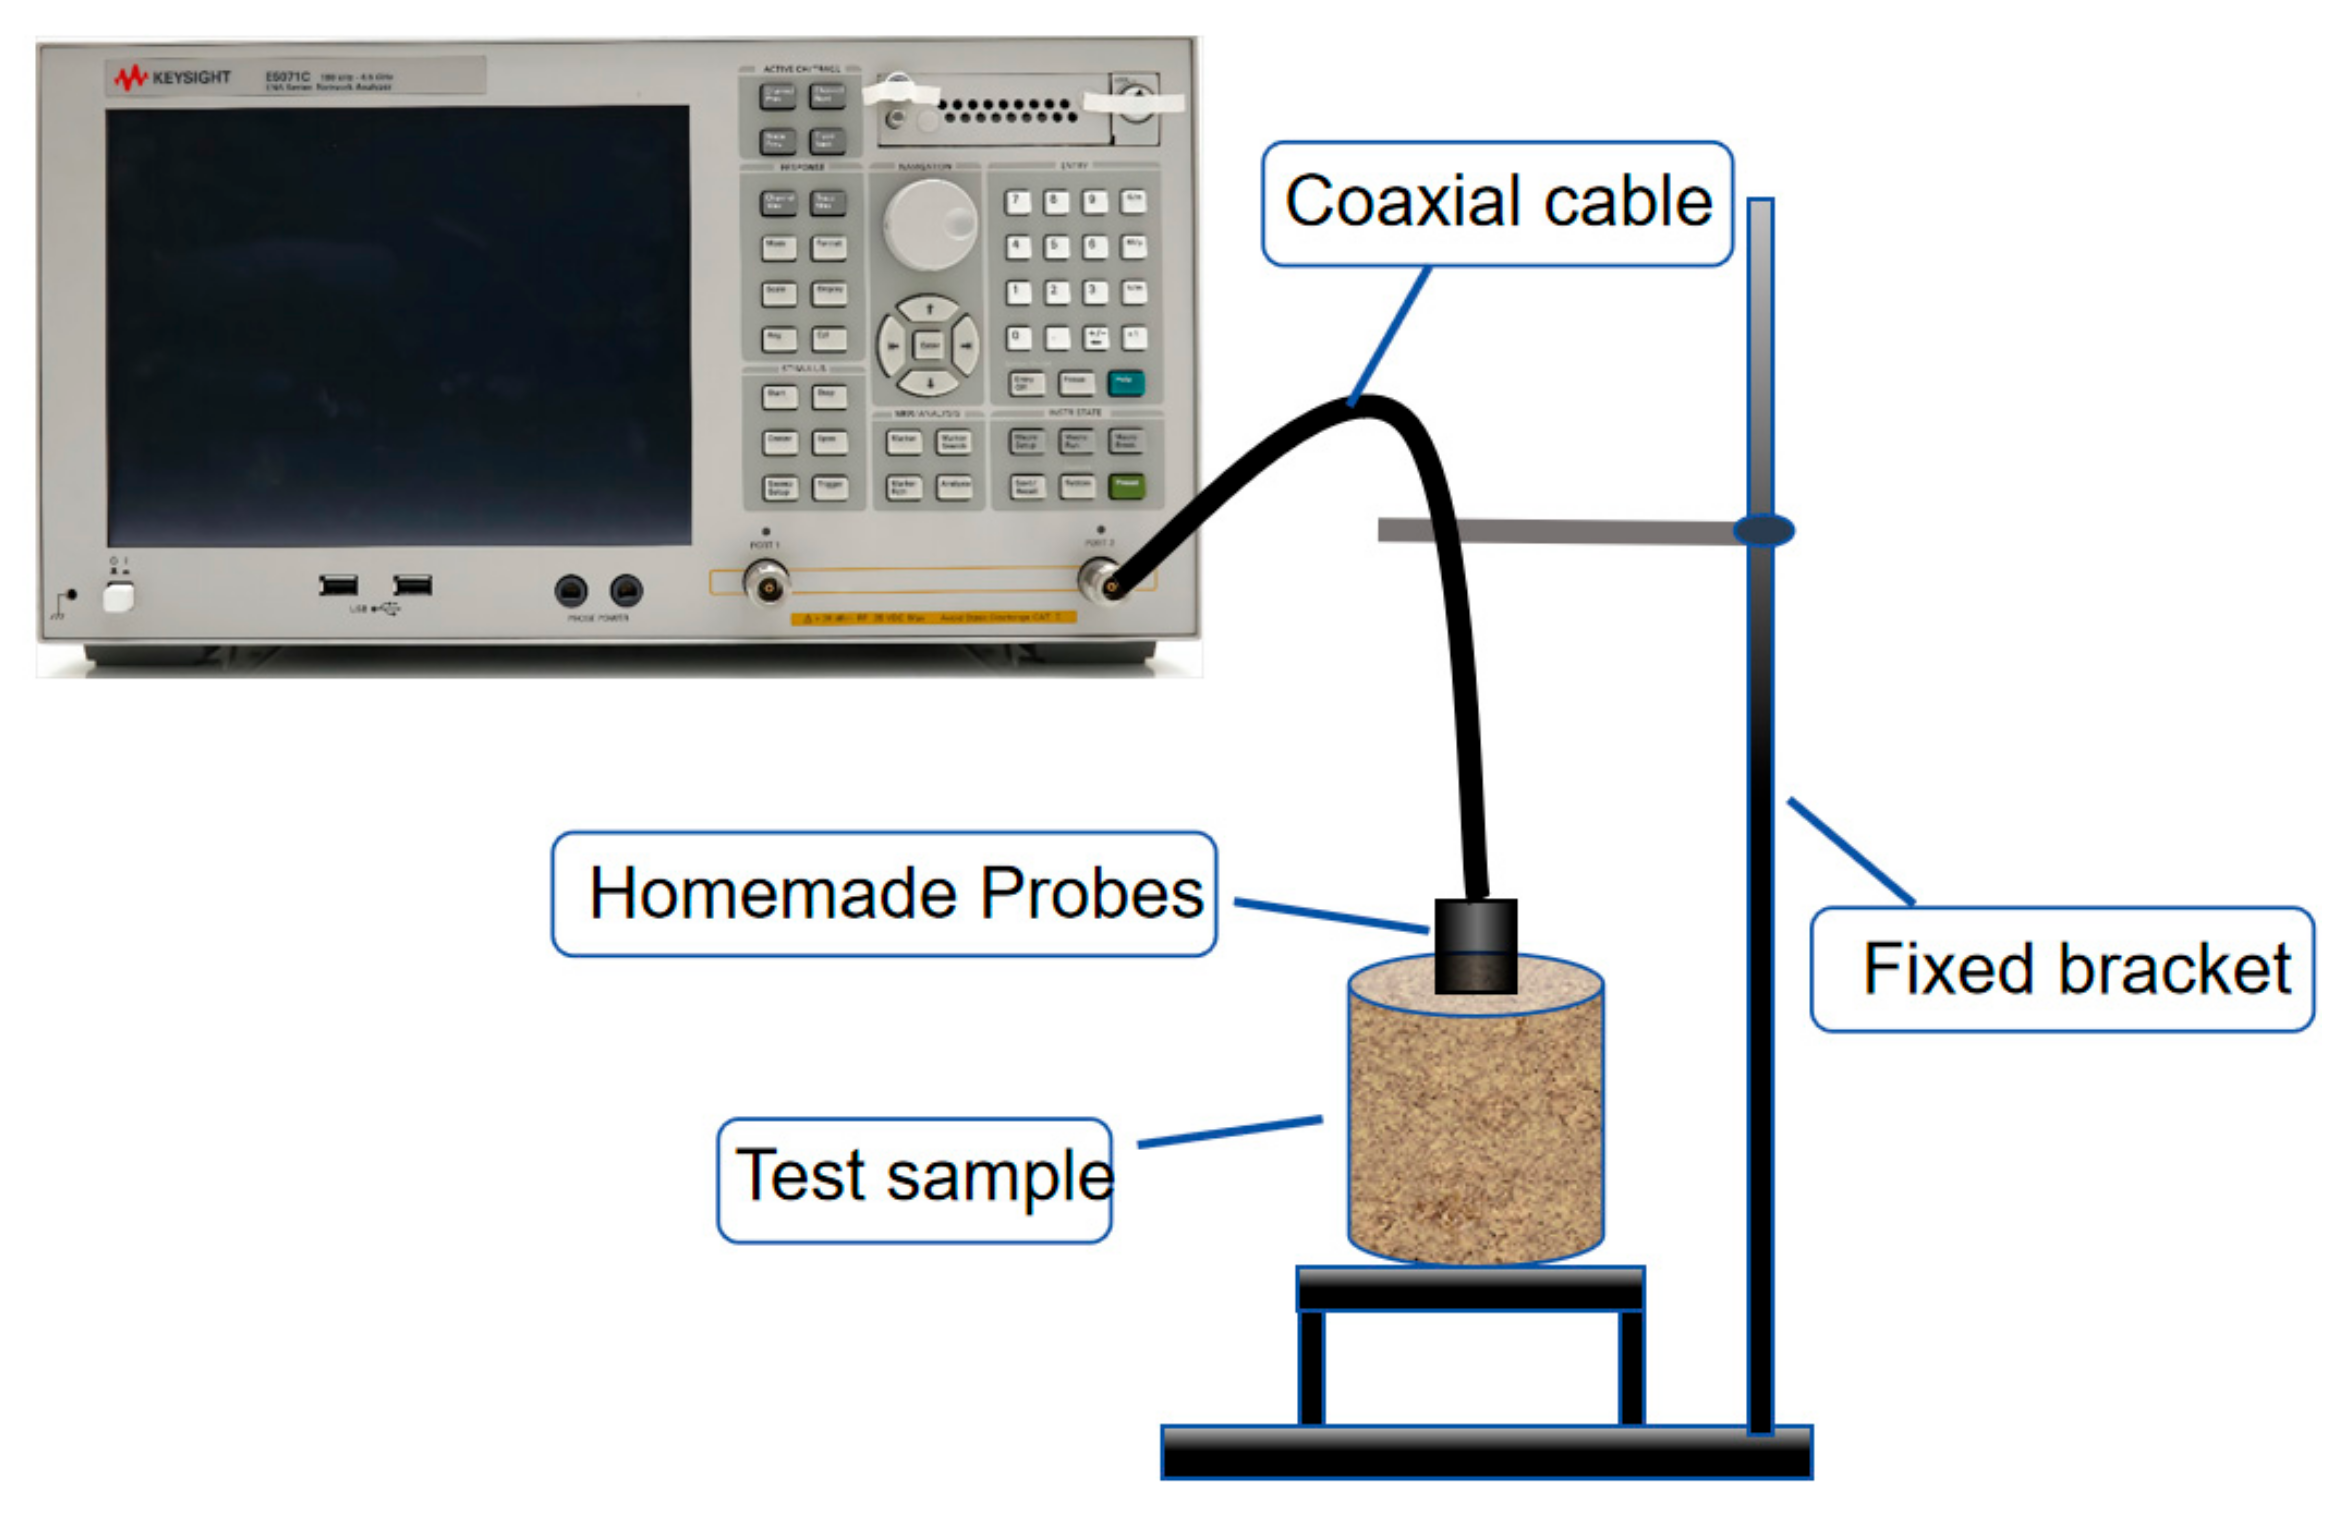
2.3. Principle of Dielectric Measurement

When soil interacts with an electromagnetic field, various polarization mechanisms, such as electronic polarization, ionic polarization, orientational polarization, and interfacial polarization, occur [29,30]. The physical quantity reflecting these microscopic polarization processes is the complex dielectric constant, as shown in Equation (1). The real part of the dielectric constant indicates the electrostatic energy stored due to the polarization of bound charges in the medium by an external electric field, while the imaginary part indicates the energy loss of the material under the action of the external electric field, which varies with the frequency of the electric field [31].
ε * ( ω ) = ε ( ω ) - j ε ( ω )
where ε * ( ω ) is the complex permittivity, ε ( ω ) is the real part of the permittivity, and ε ( ω ) is the imaginary part of the permittivity.
To achieve the research objectives, a frequency band ranging from 10 MHz to 4.5 GHz was selected. In the frequency range (10–200 MHz), ionic and interfacial polarization effects are predominant, which exhibit sensitivity to nitrogen ions (NH4+/NO3). This sensitivity enables the detection of nitrogen concentration gradients. Conversely, in the frequency range (1–4.5 GHz), the orientational polarization of water molecules is the dominant factor. This characteristic minimizes interference from nitrogen ions and effectively isolates the effects of soil moisture.
Soil dielectric values are closely related to factors such as moisture, salinity, organic matter, nutrients, temperature, and soil texture in the soil. The inorganic nitrogen content affects the soil dielectric spectrum, which is also affected by the dynamics of soil moisture and salinity. The inorganic nitrogen content of the soil can be calculated indirectly by measuring the soil dielectric spectrum. The soil dielectric constant can be considered a weighted sum of the dielectric constants of the various soil components, which usually include contributions from nitrogen solution ( ε w , N ), air ( ε a ), and solid particles ( ε s ). For a simplified model, Equation (2) can be established as follows:
ε = θ w ε w , N + ( 1 θ w ) θ s ε s + ( 1 θ s ) ε a
where θ w denotes the volumetric water content of the soil, θ s represents the volume fraction of soil solid particles, and ε w , N , ε s , and ε a refer to the dielectric constants of the inorganic nitrogen solution, soil solid particles, and air, respectively. There is a correlation between soil inorganic nitrogen content and soil moisture and soil dielectric constant content, and the inorganic nitrogen content can be estimated by measuring the soil dielectric constant. This is shown in Equation (3):
N = f ( ε , θ )
where N is the soil nitrogen content, ε is the soil dielectric constant, and θ is the soil water content.

3. Results

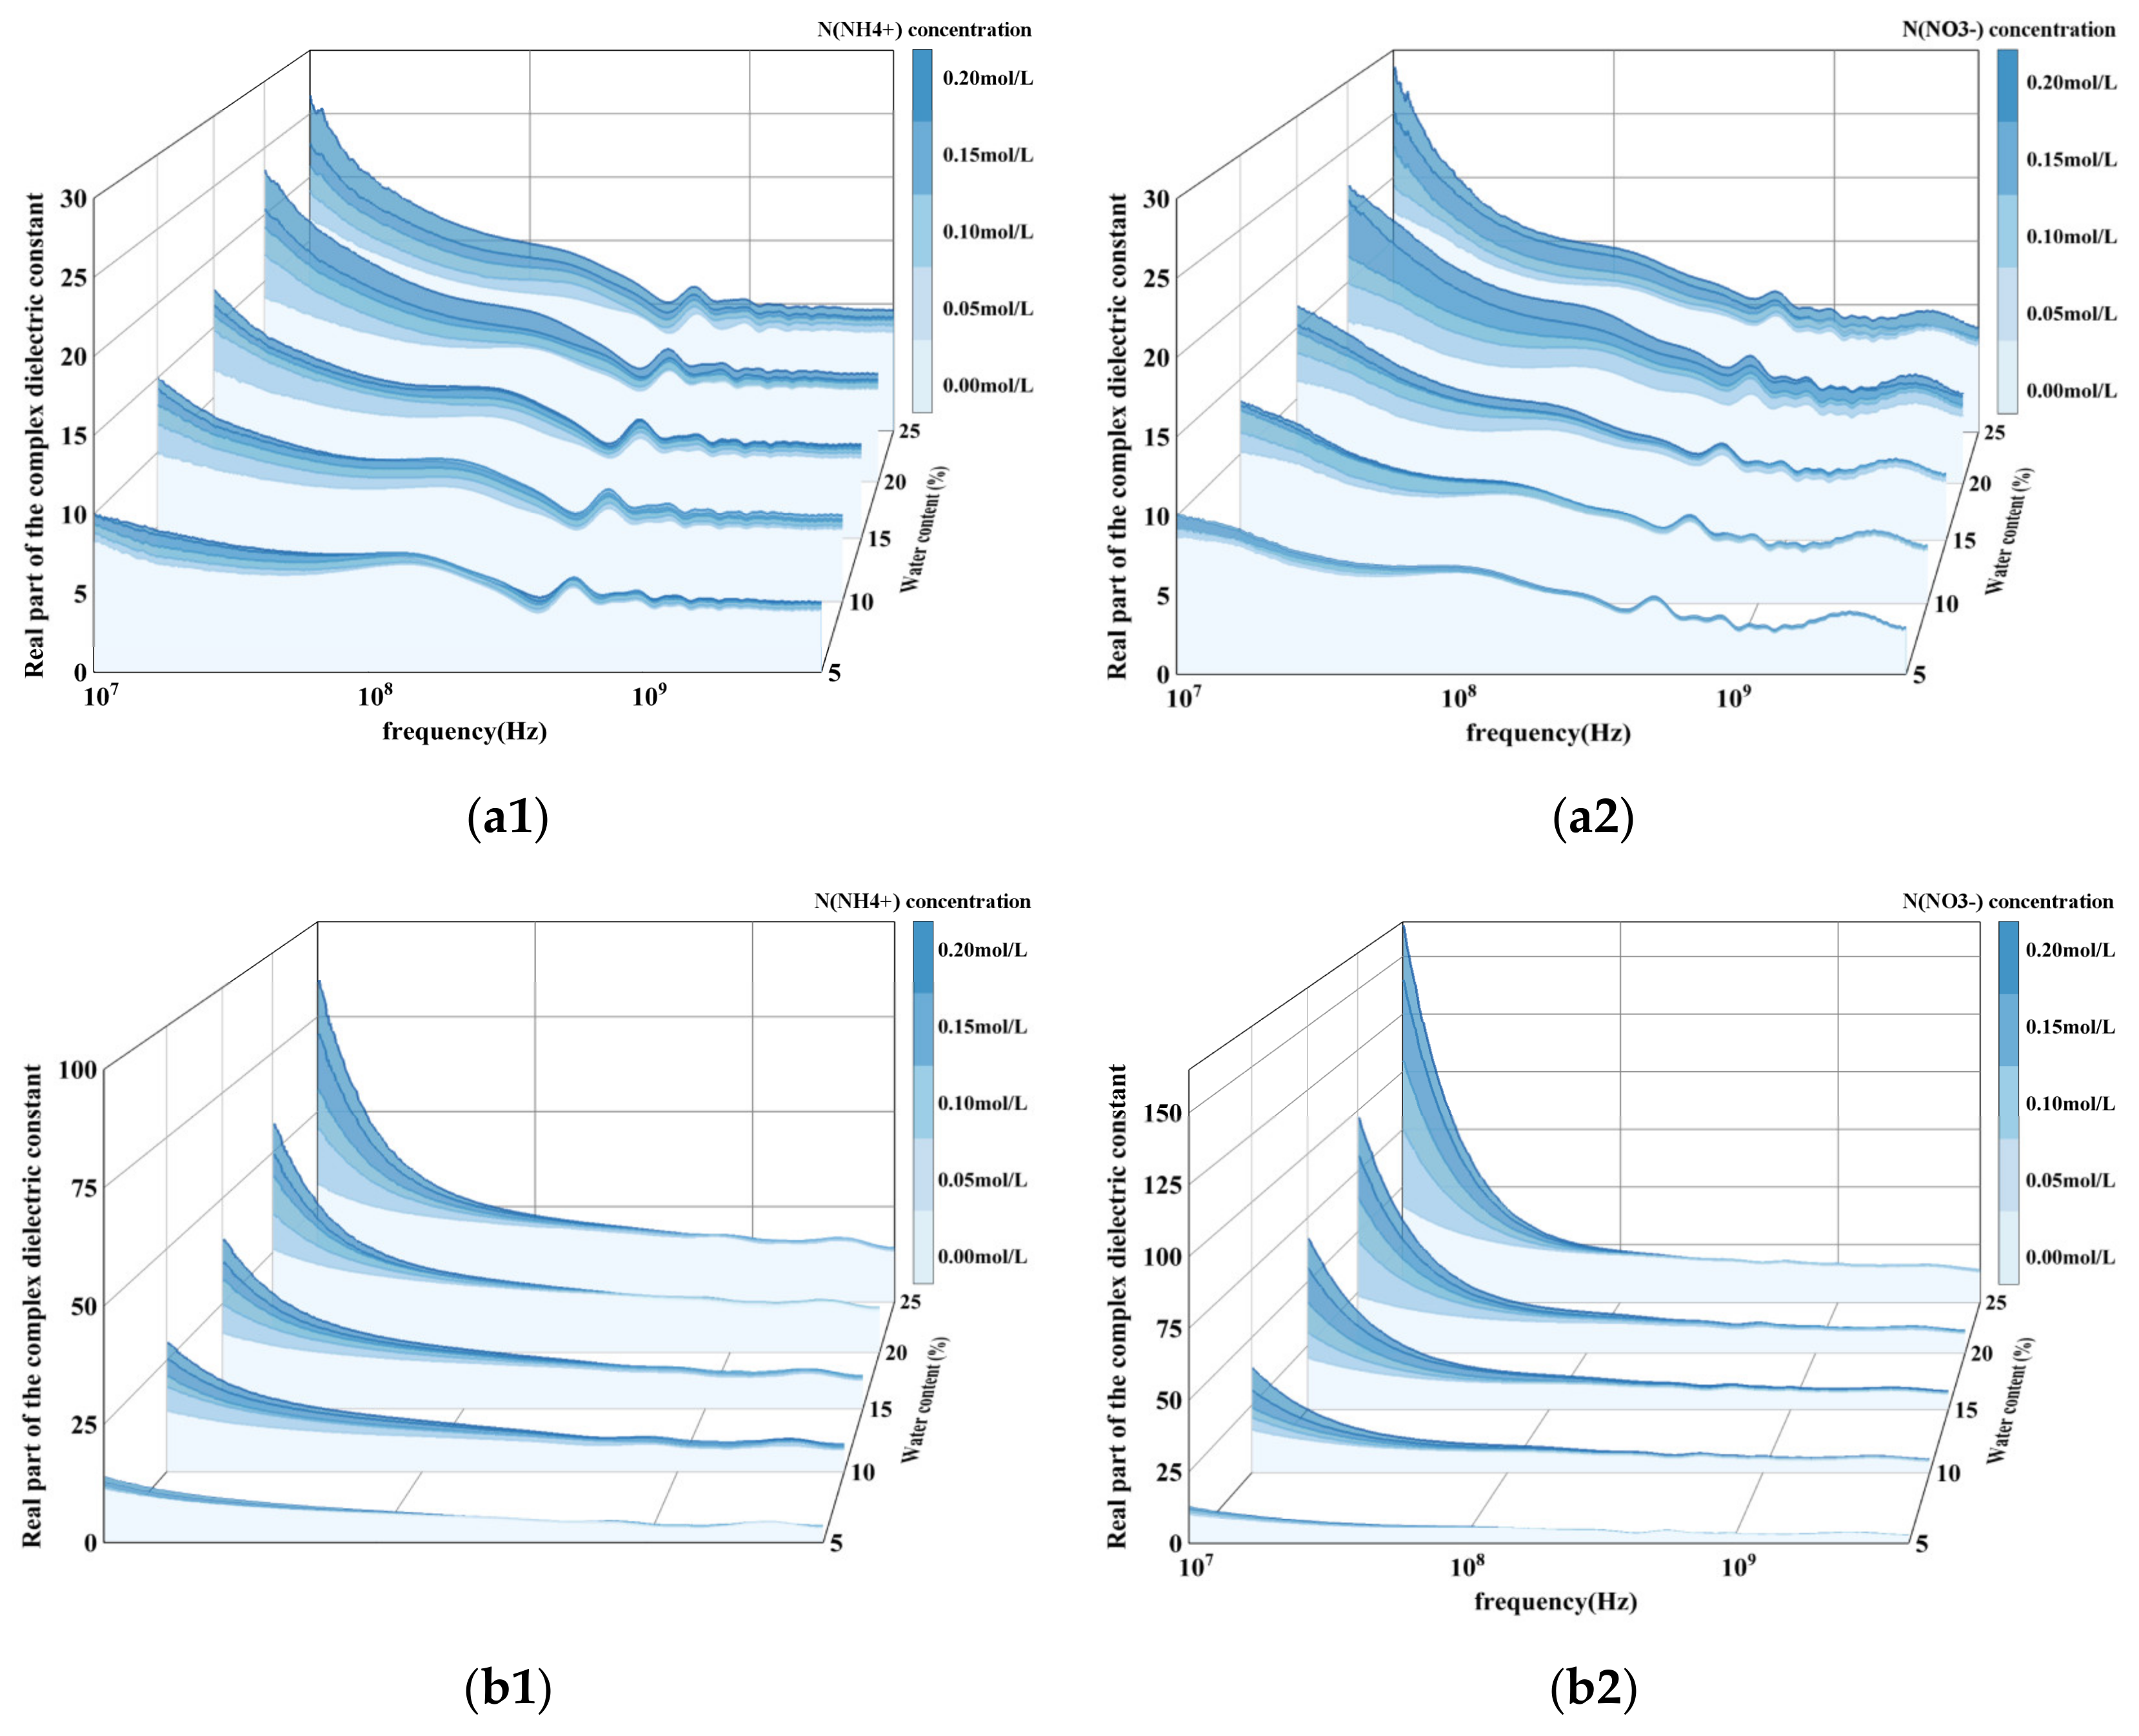
3.1. Performance of Soil Dielectric Properties Under Different Nitrogen Ion Concentrations

Figure 3 displays the frequency-dependent variations in the real permittivity (ε′) of soil samples across five nitrogen ion concentrations and volumetric water contents. A positive correlation was observed between ε′ and inorganic nitrogen concentration under constant moisture conditions. For laterite at 20% water content and 20 MHz, ε′ increased from 11.99 to 18.08 as NH4Cl concentration rose from 0.05 to 0.2 mol/L. In the 10–100 MHz range, ionic migration and surface charge aggregation under electric fields induced localized charge density heterogeneity, elevating ε′. Between 100 and 200 MHz, distinct dielectric spectral shifts emerged for NH4Cl and KNO3 treatments, with sensitivity to nitrogen ions amplifying at higher water contents (e.g., loess ε′ values at 254 MHz and 25% moisture ranged from 18.30 to 19.62 for NH4Cl concentrations of 0–0.25 mol/L). Above 1 GHz, interfacial and orientational polarization diminished, leading to frequency-stabilized ε′ values (<10) independent of nitrogen concentration. This high-frequency regime, though less moisture-sensitive than lower bands, proved suitable for water content quantification in nitrogen-rich soils due to minimal ionic interference [32].
The imaginary permittivity (ε″) of soil, representing dielectric loss, exhibited frequency- and concentration-dependent behavior as depicted in Figure 4. Within the 10–100 MHz range, ε″ decreased markedly with increasing frequency, a trend amplified at higher volumetric water contents. For instance, loess samples with 20% water content and 0.1 mol/L NH4Cl displayed ε″ values of 188.95 at 10 MHz, declining to 22.36 at 100 MHz. Elevated water content intensified the influence of inorganic nitrogen concentration on ε″, attributable to enhanced ionic conductivity from NH4Cl and KNO3 additions. This phenomenon increased soil current under external electric fields, elevating dielectric loss through Joule heating. At 51 MHz and 25% water content, laterite treated with 0–0.25 mol/L KNO3 exhibited ε″ values ranging from 7.97 to 35.86, confirming nitrogen-driven loss enhancement. Above 1 GHz, reduced charge displacement amplitudes suppressed leakage conduction losses, yielding stabilized ε″ values below 10 for both soil types [33].

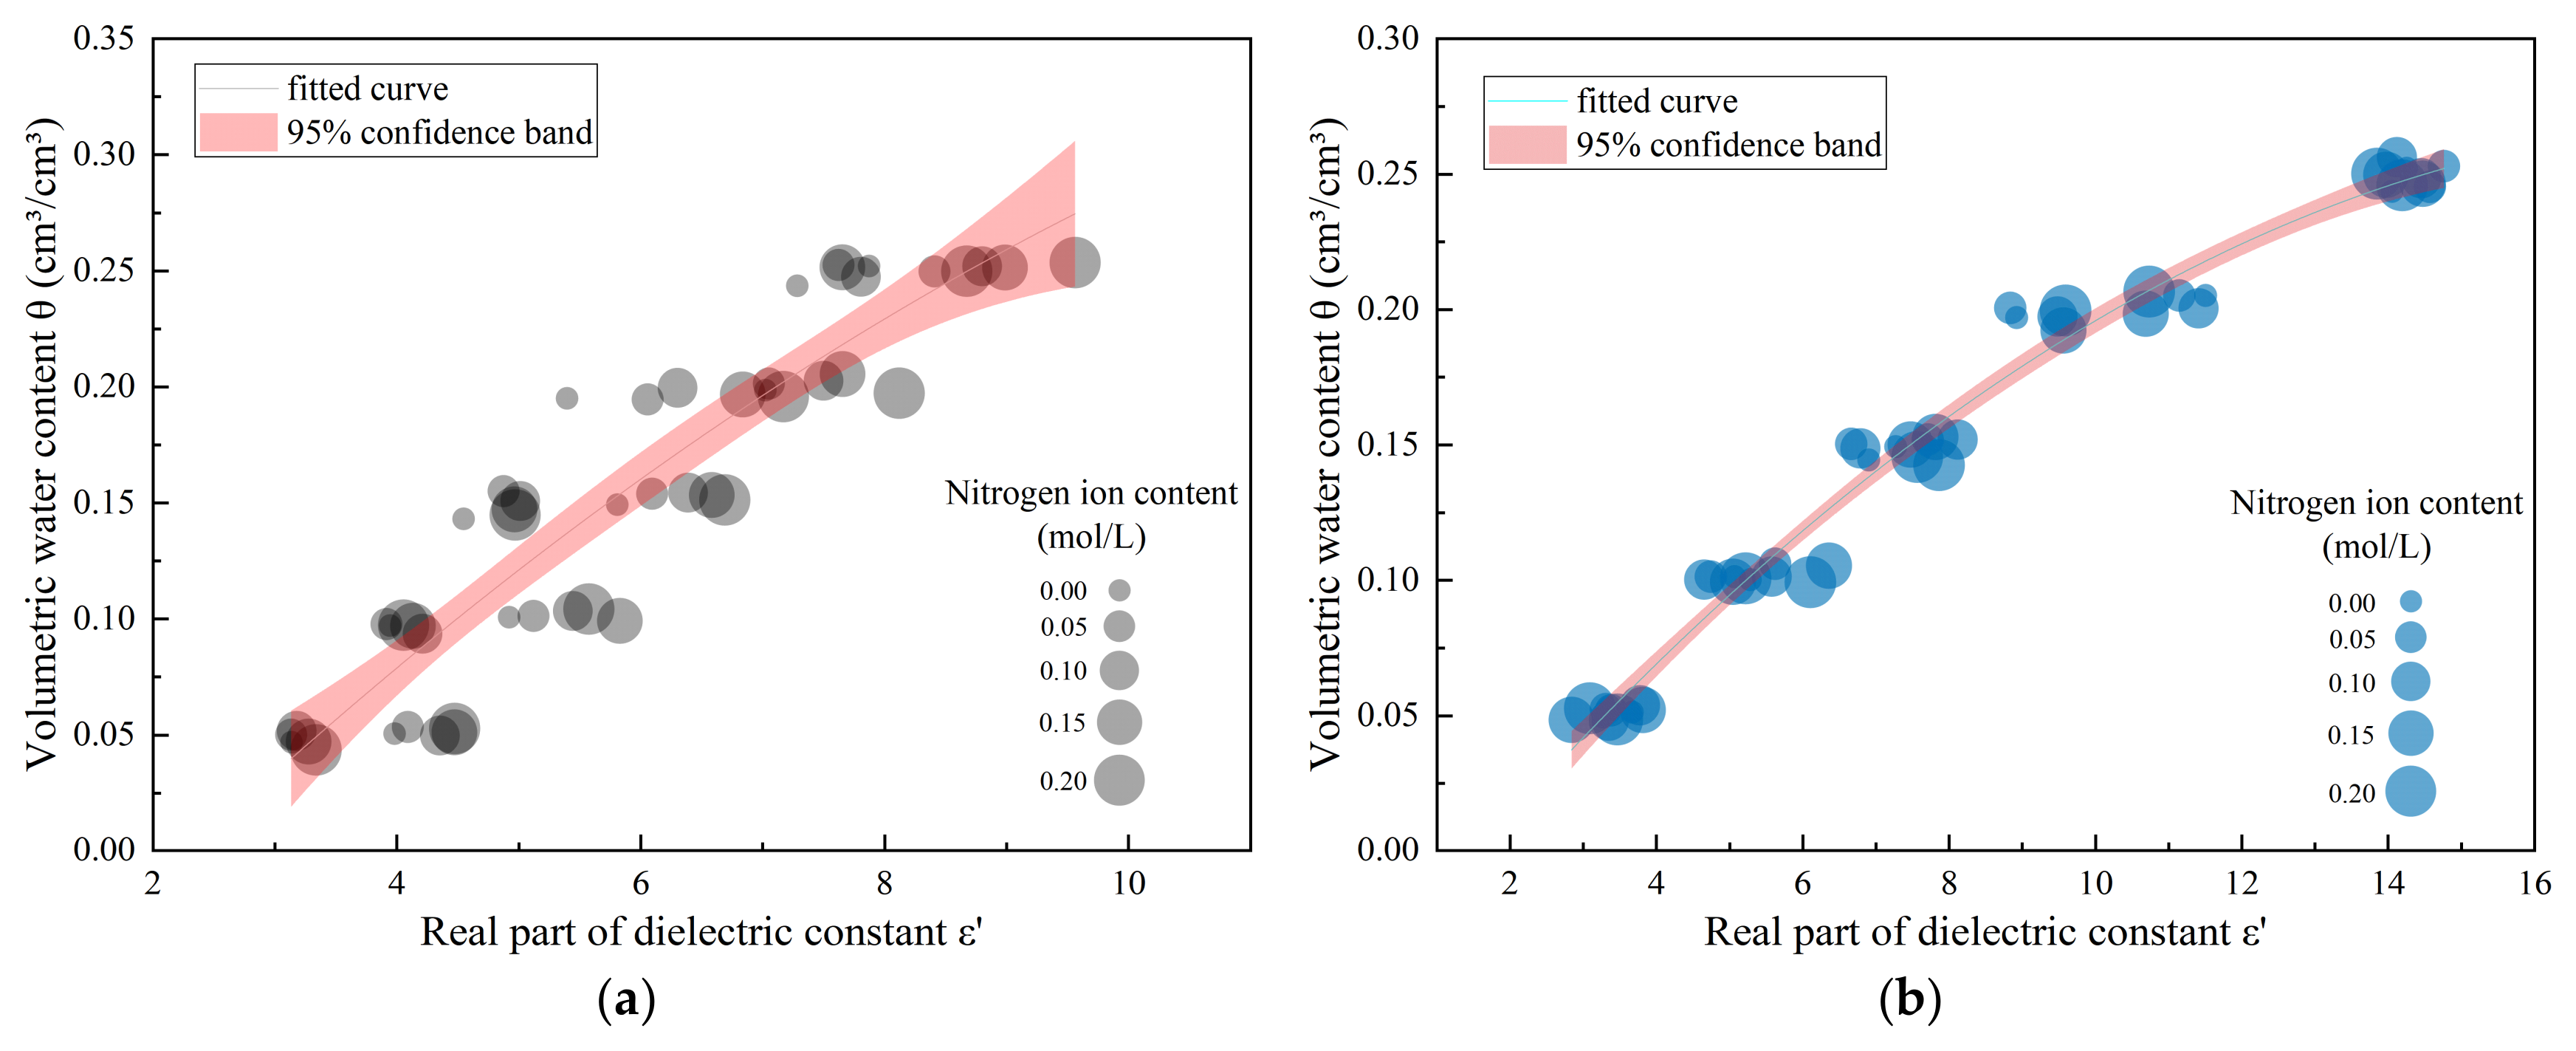
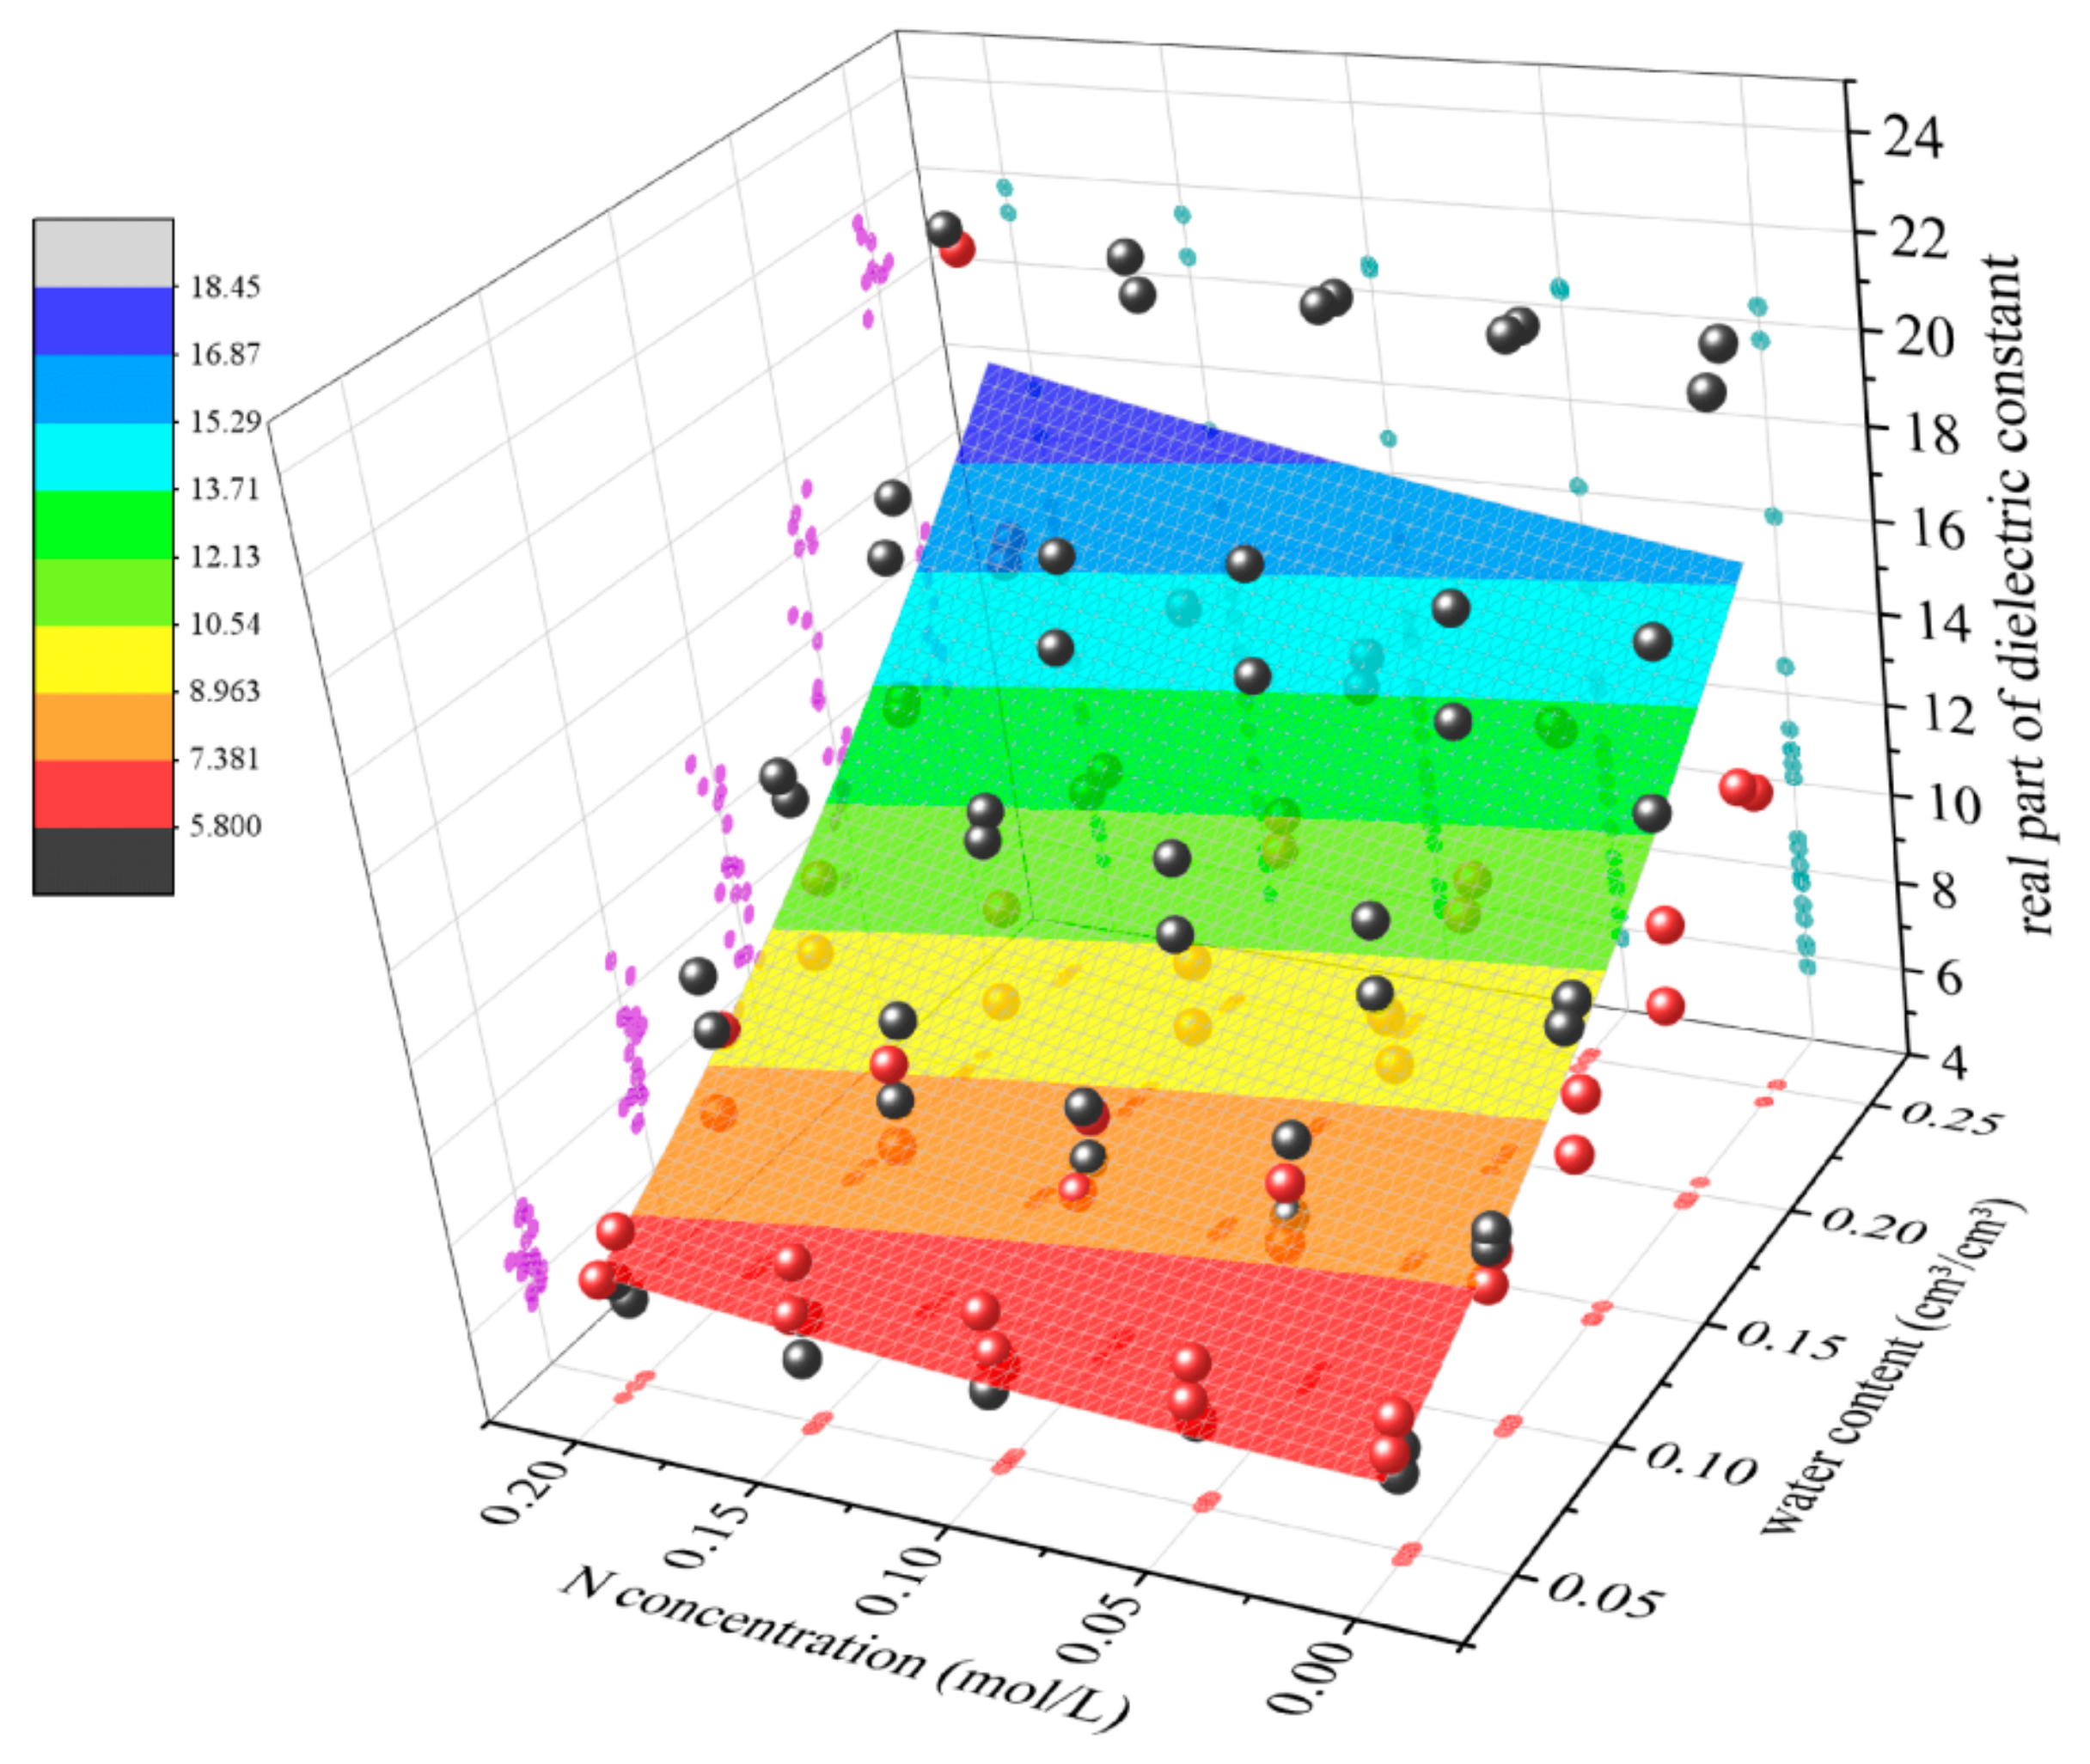
3.2. Empirical Modeling of Soil Dielectric Measurements Under Water–Nitrogen Coupling

According to the experimental data, the dielectric value is significantly correlated with nitrogen ions in the range of less than 1 GHz, but it is more difficult to construct a single model for the dielectric constant value and nitrogen ions due to the influence of soil water content. Therefore, the dielectric measurement model for soil water content can be constructed in the frequency band from 1 GHz to 4.5 GHz, where the concentration of nitrogen-containing ions in solution has relatively little influence. The model performance was evaluated using two key metrics: the coefficient of determination (R2) and the root mean square error (RMSE). The R2, ranging from 0 to 1, quantifies the proportion of variance in observed data explained by the model, with higher values indicating stronger predictive capability. The RMSE, defined as the square root of the average squared deviations between predicted and actual values, reflects the model’s precision, where lower values denote smaller prediction errors. The corresponding calculation results and analysis are shown in Figure 5.
In the frequency range from 1 GHz to 4.5 GHz, the goodness-of-fit R2 values of all frequency points exceeded 0.75. Meanwhile, the root mean square error (RMSE) was maintained in the interval from 0.03 to 0.035 cm3/cm3, indicating the high correlation of the model. At 3.8 GHz, the R2 reached up to 0.817458, and the corresponding RMSE value was as low as 0.030 cm3/cm3; therefore, the frequency point of 3.8 GHz can be selected as the optimal measurement frequency for the dielectric measurement of soil water content under water–nitrogen coupling. At this frequency point, the relationship between soil volumetric water content and dielectric constant is established as shown in Equation (4).
θ = 2.082 × 10 3 ε 2 + 5.4161 × 10 2 ε 10.5486 × 10 2
The water content dielectric measurements of loess and laterite were modeled separately at a 3.8 GHz frequency. The fitting results are shown in Table 2, and the fitting relationship curves are shown in Figure 6. Among them, the fitting results of the loess are better, with R2 values of 0.9804 and RMSE values less than 0.015 cm3/cm3, indicating that the accuracy will be better after the soil is calibrated.
On the basis of determining the soil water content, a two-parameter nitrogen measurement model of soil nitrogen and water content can be constructed in the frequency band from 10 MHz to 200 MHz. The dielectric properties of soil samples treated with different concentrations of NH4Cl and KNO3 solutions were analyzed, and the fitting results of the optimized model by nonlinear surface fitting are shown in Figure 7.
For the soil with NH4Cl applied, the optimal measurement frequency interval of NH4+ ions is from 136 MHz to 159 MHz, and the R2 values are all above 0.699. At the frequency of 152 MHz, the effect of the combination of the concentration of NH4+ ions and the volumetric water content of the soil on the real part of the soil dielectric constant is most accurately fitted with an R2 value of 0.702. The empirical formula for the dielectric measurement of NH4+ ions is shown in Equation (5), where it can be calculated using Equation (4).
ε = 4.10 + 3.52 N + 34.99 θ + 0.54 N 2 + 32.54 θ 2 + 35.99 N θ
where ε is the real part of the dielectric constant, N is the nitrogen ion content, and θ is the volumetric water content of the soil.
As for the soil samples treated with KNO3 solution, the optimal frequency band for measuring NO3 ions is from 97 MHz to 129 MHz, with R2 values above 0.759 and reaching a peak of 0.7631 at 106 MHz, and the empirical equations for measuring the dielectricity of NO3 ions were established as shown in Equation (6), where θ can be obtained through calculation of Equation (4).
ε = 5.51 4.44 N + 4.61 θ + 31.53 N 2 + 141.18 θ 2 + 54.90 N θ
The real part of the dielectric constant of the soil correlates well with both nitrate and ammonium nitrogen contents in the frequency range from 10 MHz to 200 MHz. Empirical modeling of the dielectric measurements of inorganic nitrogen (NH4+ and NO3) in soil under water–nitrogen coupling conditions was established without considering soil inorganic nitrogen species. The surface fitting results are shown in Table 3.
The results show that the R2 value of the fitted relation reaches a maximum of 0.72055 at the characteristic frequency point of 127 MHz. Therefore, this frequency point was chosen to model the soil dielectric under water–nitrogen coupling, as shown in Figure 8.
The equation describes the effect of nitrogen-containing ion content and volumetric soil water content on the real part of the dielectric constant by means of a model developed at a frequency of 127 MHz. The inverse solution for the nitrogen content N in the soil is expressed as shown in Equation (7), where θ can be obtained by the calculation in Equation (4).
N = 1.41 θ ± 0.032 43.73 θ 0.25 2 62.2 86.38 θ 2 + 19.91 θ + 4.81 ε

4. Discussion

This study enhances dielectric-based soil nitrogen detection by addressing water interference through dual-frequency decoupling. Key comparisons with previous research are as follows.

4.1. Overcoming Water Interference

Traditional single-frequency dielectric methods, such as Time Domain Reflectometry (TDR) at 50 MHz [20], struggle with water–nitrogen coupling effects. In contrast, the high-frequency model at 3.8 GHz isolates moisture effects with an R2 value of 0.82. This finding aligns with the work of Bonachela et al. [26], who emphasized the insensitivity of high-frequency measurements to ions. The dual-frequency approach effectively resolves a critical limitation highlighted by Tsegaye et al. [21], where ionic conductivity skewed moisture measurements.

4.2. Sensitivity to Nitrogen Ions

The identified sensitivity bands for NH4+ and NO3, ranging from 136 to 159 MHz and 97 to 129 MHz, respectively, corroborate the observations of Chaudhari et al. [25], who reported ion-specific dielectric shifts in C-band studies. However, the broader frequency range of 10 MHz–4.5 GHz used in this study surpasses narrowband systems, such as the 1–40 MHz range used by Pandey et al. [27], enabling simultaneous multi-parameter detection. The 127 MHz coupling model demonstrated superior performance compared to the TDR-based nitrate monitoring by Payero et al. [22], which had an R2 value of 0.65 and faced temperature-dependent instability.

5. Conclusions

A novel methodology for soil inorganic nitrogen detection has been developed through the integration of dielectric response theory with multi-frequency measurement techniques, addressing critical limitations of conventional approaches. By utilizing a vector network analyzer (VNA) across a broad frequency spectrum (10 MHz–4.5 GHz), this method enables simultaneous quantification of soil water content and nitrogen ion concentrations, surpassing the capabilities of traditional narrowband systems such as Time Domain Reflectometry (TDR) or 50 MHz sensors, which are restricted by limited bandwidth and an inability to decouple water–nitrogen interactions. At 3.8 GHz, a high-accuracy water content estimation model was established, achieving a coefficient of determination (R2) of 0.82 and a root mean square error (RMSE) of 0.030 cm3/cm3 under controlled laboratory conditions.
Frequency-specific sensitivity bands for nitrogen ion detection were identified: ammonium ions (NH4+) exhibited optimal dielectric discrimination within 136–159 MHz (peak R2 = 0.702 at 152 MHz), while nitrate ions (NO3) demonstrated maximal sensitivity at 97–129 MHz (peak R2 = 0.7631 at 106 MHz). A unified water–nitrogen coupling model, formulated at 127 MHz, yielded an R2 of 0.721 for inorganic nitrogen quantification, highlighting the efficacy of multi-frequency dielectric spectroscopy in concurrent parameter estimation.
Despite the high precision of laboratory-derived models, practical implementation in agricultural settings requires further validation. Field environments, characterized by soil heterogeneity, temperature fluctuations, and humidity variations, may introduce measurement instability due to unaccounted interfacial polarization effects and ionic mobility shifts. These findings establish a theoretical foundation for subsequent research, emphasizing the necessity of field trials to evaluate model robustness under real-world conditions. Future studies should prioritize multi-scale calibration protocols incorporating soil texture and organic matter variability to facilitate scalable agricultural applications.

Author Contributions

Research conceptualization, Z.J. and J.X.; data curation, Z.J., X.H. and R.H.; methodology, Z.J., J.X. and X.Y.; writing—original draft, Z.J.; writing—review and editing, J.X., X.H., R.H., J.Y. and X.Y. All authors have read and agreed to the published version of the manuscript.

Funding

This research was funded by the National Natural Science Foundation of China (Grant No. 52279046).

Institutional Review Board Statement

Not applicable.

Informed Consent Statement

Not applicable.

Data Availability Statement

The data that support the findings of this study are available from the corresponding author [Xu, J.] upon reasonable request.

Conflicts of Interest

The authors declare that they have no known competing financial interests or personal relationships that could have influenced the work reported in this paper.

References

  1. Zhang, L.; Zhao, L.; Yi, H.; Lan, S.; Chen, L.; Han, G. Nitrogen Addition Alters Plant Growth in China’s Yellow River Delta Coastal Wetland through Direct and Indirect Effects. Front. Plant Sci. 2022, 13, 1016949. [Google Scholar] [CrossRef]
  2. Mustafa, A.; Athar, F.; Khan, I.; Chattha, M.U.; Nawaz, M.; Shah, A.N.; Mahmood, A.; Batool, M.; Aslam, M.T.; Jaremko, M.; et al. Improving Crop Productivity and Nitrogen Use Efficiency Using Sulfur and Zinc-Coated Urea: A Review. Front. Plant Sci. 2022, 13, 942384. [Google Scholar] [CrossRef]
  3. Bhardwaj, A.K.; Rajwar, D.; Yadav, R.K.; Chaudhari, S.K.; Sharma, D.K. Nitrogen Availability and Use Efficiency in Wheat Crop as Influenced by the Organic-Input Quality Under Major Integrated Nutrient Management Systems. Front. Plant Sci. 2021, 12, 634448. [Google Scholar] [CrossRef]
  4. Zhou, X.; Wang, R.; Liu, H.; Wu, S.; Wu, H. Nitrogen Removal Responses to Biochar Addition in Intermittent-Aerated Subsurface Flow Constructed Wetland Microcosms: Enhancing Role and Mechanism. Ecol. Eng. 2019, 128, 57–65. [Google Scholar] [CrossRef]
  5. Bremner, J.M. Determination of Nitrogen in Soil by the Kjeldahl Method. J. Agric. Sci. 1960, 55, 11–33. [Google Scholar] [CrossRef]
  6. Chang, L.; Li, H.; Liu, C.; Liang, X.; Xie, C.; Li, Z.; Li, Y.; Zhan, F.; He, Y. Effects of UV-B Radiation on the Chemical Composition of Azolla and Its Decomposition after Returning to the Field and Nitrogen Transformation in Soil. Agronomy 2023, 13, 1968. [Google Scholar] [CrossRef]
  7. Li, K.; Zhao, Y.; Yuan, X.; Zhao, H.; Wang, Z.; Li, S.; Malhi, S.S. Comparison of Factors Affecting Soil Nitrate Nitrogen and Ammonium Nitrogen Extraction. Commun. Soil Sci. Plant Anal. 2012, 43, 571–588. [Google Scholar] [CrossRef]
  8. McLeod, S. Determination of Total Soil and Plant Nitrogen Using a Micro-Distillation Unit in a Continuous Flow Analyzer. Anal. Chim. Acta 1992, 266, 113–117. [Google Scholar] [CrossRef]
  9. Li, L.; Ma, L.; Zhang, H.; Wu, J.; Naqvi, S.M.Z.A.; Li, Z.; Wei, W.; Awais, M.; Li, S.; Ewulo, B.S.; et al. Development of Improved Flow Analysis Prototype Method for Measuring and Understanding Agricultural Non-Point Source (NPS) Nitrogen (N) and Phosphorus (P) Pollution. Comput. Electron. Agric. 2023, 210, 107894. [Google Scholar] [CrossRef]
  10. Chen, H.; Feng, Q.; Jia, Z.; Song, Q. Improvement of Partial Least Squares Modelling for Determination of Soil Nitrogen by Fourier Transform Near-Infrared Spectrometry. Asian J. Chem. 2014, 26, 4839–4844. [Google Scholar] [CrossRef]
  11. Ruma, F.Y.; Munnaf, M.A.; De Neve, S.; Mouazen, A.M. Visible and near Infrared Spectroscopy for Predicting Soil Nitrogen Mineralization Rate: Effect of Incubation Period and Ancillary Soil Properties. CATENA 2024, 235, 107649. [Google Scholar] [CrossRef]
  12. Liu, J.; Cai, H.; Chen, S.; Pi, J.; Zhao, L. A Review on Soil Nitrogen Sensing Technologies: Challenges, Progress and Perspectives. Agriculture 2023, 13, 743. [Google Scholar] [CrossRef]
  13. Fan, S. Physical Properties and Basic Theory of Dielectric. IOP Conf. Ser. Earth Environ. Sci. 2021, 692, 022122. [Google Scholar] [CrossRef]
  14. Zhang, Y.; Li, M.; Zheng, L.; Zhao, Y.; Pei, X. Soil Nitrogen Content Forecasting Based on Real-Time NIR Spectroscopy. Comput. Electron. Agric. 2016, 124, 29–36. [Google Scholar] [CrossRef]
  15. Li, Y.; Yang, Q.; Chen, M.; Wang, M.; Zhang, M. An ISE-Based On-Site Soil Nitrate Nitrogen Detection System. Sensors 2019, 19, 4669. [Google Scholar] [CrossRef]
  16. Ren Haiyan, Z.M. Prediction of Soil Nitrate-Nitrogen Based on Sensor Fusion. Nongye Jixie XuebaoTransactions Chin. Soc. Agric. Mach. 2015, 46, 96–101. [Google Scholar] [CrossRef]
  17. Guerrero, A.; De Neve, S.; Mouazen, A.M. Current Sensor Technologies for in Situ and on-Line Measurement of Soil Nitrogen for Variable Rate Fertilization: A Review. In Advances in Agronomy; Sparks, D.L., Ed.; Academic Press: Cambridge, MA, USA, 2021; Volume 168, pp. 1–38. [Google Scholar]
  18. Baumbauer, C.L.; Goodrich, P.J.; Payne, M.E.; Anthony, T.; Beckstoffer, C.; Toor, A.; Silver, W.; Arias, A.C. Printed Potentiometric Nitrate Sensors for Use in Soil. Sensors 2022, 22, 4095. [Google Scholar] [CrossRef]
  19. Palta, P.; Kumar, A. Soil Dielectric Response to Chemical Fertilizers in Northern India’s Key Agricultural Areas. Phys. Chem. Earth Parts ABC 2025, 137, 103806. [Google Scholar] [CrossRef]
  20. De Neve, S.; Hartmann, R.; Hofman, G. Temperature Effects on N Mineralization: Changes in Soil Solution Composition and Determination of Temperature Coefficients by TDR. Eur. J. SOIL Sci. 2003, 54, 49–61. [Google Scholar] [CrossRef]
  21. Tsegaye, T.D.; Ranatunga, T.D.; Reddy, K.C. Variation of Soil Dielectric Constant, Moisture Holding Capacity, and Nitrate-Nitrogen as Influenced by Application of Fresh and compostpPoultry Litter on a Decatur Silt Loam Soi. J. Sustain. Agric. 2003, 22, 55–73. [Google Scholar] [CrossRef]
  22. Payero, J.O.; Tarkalson, D.D.; Irmak, S. Use of Time Domain Reflectometry for Continuous Monitoring of Nitrate-Nitrogen in Soil and Water. Appl. Eng. Agric. 2006, 22, 689–700. [Google Scholar] [CrossRef]
  23. Gao, B.; Walhof, A.C.; Laird, D.A.; Toor, F.; Prineas, J.P. Analytical Evaluation of Mobile In Situ Soil Nitrate Infrared Sensor Designs for Precision Agriculture. IEEE Sens. J. 2021, 21, 20200–20209. [Google Scholar] [CrossRef]
  24. Maru, A.; Ahmed, O.H.; Primus, W.C.; Jeffary, A.V. Dielectric Response of Nitrogen in Soil Amended with Chicken Litter Biochar and Urea under Oryza Sativa L. Cultivation. Sci. Rep. 2021, 11, 12545. [Google Scholar] [CrossRef] [PubMed]
  25. Chaudhari, P.R. Variation of Dielectric Constant of Indian Soils with Their Physical Parameters at C-Band Microwave Frequency. Int. J. Innov. Res. Sci. Eng. Technol. 2014, 3, 15396–15400. [Google Scholar] [CrossRef]
  26. Bonachela, S.; Fernández, M.D.; Cabrera, F.J.; Granados, M.R. Soil Spatio-Temporal Distribution of Water, Salts and Nutrients in Greenhouse, Drip-Irrigated Tomato Crops Using Lysimetry and Dielectric Methods. Agric. Water Manag. 2018, 203, 151–161. [Google Scholar] [CrossRef]
  27. Pandey, G.; Weber, R.; Kumar, R. Agricultural Cyber-Physical System: In-Situ Soil Moisture and Salinity Estimation by Dielectric Mixing. IEEE Access 2018, 6, 43179–43191. [Google Scholar] [CrossRef]
  28. Hong, Y.; Wang, L.; Wang, R.; Su, J.; Li, H.; Zhang, J.; Guo, H.; Chen, X. Contactless Conductivity Microfluidic Chip for Rapid Determination of Soil Nitrogen and Potassium Content. Smart Agric. 2024, 6, 18. [Google Scholar] [CrossRef]
  29. Li, S.; Li, H.; Hu, F.N.; Huang, X.R.; Xie, D.T.; Ni, J.P. Effects of Strong Ionic Polarization in the Soil Electric Field on Soil Particle Transport during Rainfall. Eur. J. Soil Sci. 2015, 66, 921–929. [Google Scholar] [CrossRef]
  30. Li, Q.; Shi, W.; Yang, Q. Polarization Induced Covalent Bonding: A New Force of Heavy Metal Adsorption on Charged Particle Surface. J. Hazard. Mater. 2021, 412, 125168. [Google Scholar] [CrossRef]
  31. Acar, Y.B.; Gale, R.J.; Alshawabkeh, A.N.; Marks, R.E.; Puppala, S.; Bricka, M.; Parker, R. Electrokinetic Remediation: Basics and Technology Status. J. Hazard. Mater. 1995, 40, 117–137. [Google Scholar] [CrossRef]
  32. Chen, Y.; Or, D. Geometrical Factors and Interfacial Processes Affecting Complex Dielectric Permittivity of Partially Saturated Porous Media. WATER Resour. Res. 2006, 42, W06423. [Google Scholar] [CrossRef]
  33. Datsios, Z.G.; Mikropoulos, P.N.; Karakousis, I. Laboratory Characterization and Modeling of DC Electrical Resistivity of Sandy Soil with Variable Water Resistivity and Content. IEEE Trans. Dielectr. Electr. Insul. 2017, 24, 3063–3072. [Google Scholar] [CrossRef]
Figure 1. Main test steps in soil sample preparation. (a) Configuration of the solution. (b) Resting of the soil sample. (c) Soil sample to be tested.
Sustainability 17 02491 g001
Figure 2. Soil inorganic nitrogen dielectric measurement system.
Sustainability 17 02491 g002
Figure 3. Real part of the soil dielectric constant under water content change. (a1) Laterite (NH4Cl) and (a2) laterite (KNO3); (b1) loess (NH4Cl) and (b2) loess (KNO3).
Sustainability 17 02491 g003
Figure 4. Imaginary part of the soil dielectric constant under water content change. (a1) Laterite (NH4Cl) and (a2) laterite (KNO3); (b1) loess (NH4Cl) and (b2) loess (KNO3).
Sustainability 17 02491 g004
Figure 5. R2 and RMSE values of the fitted equations at each frequency point.
Sustainability 17 02491 g005
Figure 6. Fitted curves of water content versus dielectric constant for two soils. (a) Laterite; (b) loess.
Sustainability 17 02491 g006
Figure 7. Comparison of the fitting effects of adding nitrogen-containing ionic solutions to soil at each characteristic frequency point separately. (a) KNO3; (b) NH4Cl.
Sustainability 17 02491 g007
Figure 8. Soil dielectric modeling under 127 MHz water–nitrogen coupling.
Sustainability 17 02491 g008
Table 1. Soil ammonium nitrogen and nitrate nitrogen content, acidity, and alkalinity.
Soil TypeClay Grains (%)Powder Grains (%)Sand Grains (%)Ammonium
Nitrogen (mg/kg)
Nitrate
Nitrogen (mg/kg)
Soil PH
laterite6916151.2880.3917.2
loess954360.4870.0968.2
Table 2. Fitted relationship between water content and dielectric constant for two soils.
Soil TypeFitting the Relational EquationR2RMSE
laterite θ = 1.54 × 10 3 ε 2 + 5.609 × 10 2 ε 1.207 × 10 1 0.85350.0280
loess θ = 8.667 × 10 4 ε 2 + 3.326 × 10 2 ε 4.998 × 10 2 0.98040.0101
Table 3. Formula for dielectric measurement of ice content.
Frequency (MHz)Fitting FormulaR2
76 ε = 4.62 + 1.72 N + 22.87 θ + 11.07 N 2 + 87.43 θ 2 + 59.63 N θ 0.70112
97 ε = 4.75 + 0.48 N + 21.56 θ + 14.95 N 2 + 86.07 θ 2 + 50.69 N θ 0.71483
108 ε = 4.79 + 0.13 N + 20.99 θ + 15.63 N 2 + 85.72 θ 2 + 47.51 N θ 0.71883
125 ε = 4.82   0.22 N + 19.97 θ + 15.44 N 2 + 86.38 θ 2 + 44.17 N θ 0.71991
127 ε = 4.81   0.25 N + 19.91 θ + 15.55 N 2 + 86.38 θ 2 + 43.73 N θ 0.72055
129 ε = 4.81   0.27 N + 19.79 θ + 15.43 N 2 + 86.53 θ 2 + 43.41 N θ 0.72014
136 ε = 4.79   0.25 N + 19.46 θ + 14.97 N 2 + 86.90 θ 2 + 42.00 N θ 0.71927
152 ε = 4.73   0.34 N + 18.58 θ + 13.70 N 2 + 87.97 θ 2 + 40.75 N θ 0.71587
201 ε = 4.34 + 0.05 N + 16.93 θ + 8.83 N 2 + 90.31 θ 2 + 35.97 N θ 0.69582
Disclaimer/Publisher’s Note: The statements, opinions and data contained in all publications are solely those of the individual author(s) and contributor(s) and not of MDPI and/or the editor(s). MDPI and/or the editor(s) disclaim responsibility for any injury to people or property resulting from any ideas, methods, instructions or products referred to in the content.

