Abstract
Over the years, high levels of corruption in Sub-Saharan Africa have diverted resources from social welfare, weakened institutional effectiveness, and deepened economic inequalities. This study explores the misery index’s effects on economic inequality and social welfare in 19 Sub-Saharan African countries, highlighting corruption’s role in amplifying these issues. The misery index, a composite measure of inflation and unemployment, indicates economic distress exacerbating poverty and inequality, disproportionately affecting lower-income populations. This research employs quantile regression and the System Generalised Method of Moments to analyse data from 2007 to 2022, revealing that corruption often undermines poverty reduction efforts, with economic growth and foreign direct investment showing limited effects without strong institutional frameworks. The findings emphasise the need for multifaceted policies targeting job creation, inflation control, and anti-corruption initiatives to foster inclusive growth and mitigate economic disparity. To address inequality, this study recommends that governance be strengthened, corruption curbed, and inflation controlled while expanding welfare programmes and promoting inclusive growth across Sub-Saharan Africa.
1. Introduction
The misery index, a composite indicator combining unemployment and inflation rates, has long been used to measure various countries’ economic well-being and social welfare [1,2]. The index quantifies the economic distress experienced by populations with higher values indicating more severe economic hardship and declining living standards [3]. The repercussions of such economic distress have significant socioeconomic consequences for individuals and society [4,5]. In response, many governments worldwide have launched various social intervention programmes to alleviate poverty and reduce inequality. However, assessing the effectiveness of these initiatives remains a critical area of investigation [4,5].
While the misery index is extensively used in developed economies to gauge social inequalities, its application in developing countries, particularly Sub-Saharan Africa (SSA), remains limited [3]. Many of these nations are among the most impoverished globally, ranking high on the misery index. Moreover, the index has not been fully utilised to evaluate the corruption levels within these countries. Policymakers face the challenge of prioritising efforts to reduce inequality and poverty, with key questions focusing on which aspects, such as income, education, health, unemployment, urban disparities, or poverty gaps, can be addressed most efficiently and at the lowest societal cost. It is important to note that income per capita strongly correlates with individual outcomes, making poverty alleviation critical to reducing broader deprivation.
Aikins and McLachlan [6] noted that within Africa, poverty is most deeply entrenched in the Sub-Saharan region, closely linked to economic challenges captured by the misery index. Central Africa bears the highest extreme poverty rate, at 54.8%, which is a reflection of persistent economic distress marked by high unemployment and inflation. Southern Africa follows with a poverty rate of 45.1%, further underscoring the correlation between economic hardship and social inequality. Western and Eastern Africa report poverty rates of 36.8% and 33.8%, respectively, highlighting disparities in economic performance and welfare. In contrast, North Africa achieved the SDG target of maintaining a poverty rate below 3% by 2019, demonstrating relatively lower levels of economic misery in the region.
Sub-Saharan Africa exemplifies these challenges vividly. Countries such as South Africa, Zimbabwe, Angola, Ethiopia, Kenya, and Nigeria grapple with persistent economic difficulties exacerbated by high unemployment rates, political instability and income disparities [7,8,9,10,11,12]. In South Africa, for instance, high unemployment and income inequality contribute to social tensions [7]. Zimbabwe faces hyperinflation and political instability, resulting in severe economic mismanagement [8]. Despite Angola’s abundant natural resources, extreme inequality and poverty persist [9,13]; Ethiopia grapples with rapid population growth and political unrest, straining social welfare systems [10,11]. In contrast, despite experiencing economic growth, Kenya contends with significant inequality and unemployment [12].
Studies have shown that SSA countries frequently experience high misery index values due to persistent unemployment and inflationary pressure [14]. This macroeconomic instability hampers economic growth and perpetuates inequality across the region. As indicated by the misery index, high levels of economic hardship exacerbate existing inequalities by disproportionately affecting lower-income groups during periods of inflation and exacerbating unemployment’s impacts on vulnerable populations [15,16]. Efforts to mitigate economic misery and inequality have seen varying degrees of success. These efforts include targeted poverty reduction strategies, investments in human capital and policies promoting inclusive economic growth. However, the effectiveness of these interventions varies, necessitating ongoing evaluation and adaptation to local contexts [4,5].
Sub-Saharan African countries frequently experience high misery index values due to persistent unemployment and inflation, which impedes economic growth and deepens inequality [17]. Corruption compounds these effects by misallocating resources and undermining poverty-reduction policies, thereby worsening unemployment and inflation’s impact on lower-income populations. Corruption, often described as the abuse of entrusted power for private gain, has been identified as a significant impediment to economic growth and development in SSA [18,19,20]. Corruption distorts resource allocation, undermines public trust and exacerbates existing inequalities. Corruption entrenches disparities by limiting the effectiveness of policies designed to reduce poverty, unemployment and inflation, which are core components of the misery index. As a result, corruption amplifies the negative impact of a high misery index, further intensifying the region’s economic challenges.
This dynamic is evident across SSA, where the intersection of corruption and economic mismanagement continues to widen the gap between the wealthy and the poor. Asongu [21] opined that high corruption levels in SSA exacerbate the negative impacts of unemployment and inflation, weakening governance and social welfare systems. Therefore, understanding the moderating role of corruption in the relationship between the misery index and economic inequality is crucial for developing effective policies to promote inclusive growth and social welfare.
This study contributes to the literature by uniquely addressing how corruption moderates the relationship between economic hardship (measured through the misery index) and social welfare in SSA. While previous studies have examined the misery index’s effects in broader economic contexts, they often overlook corruption’s amplifying influence on inequality and social welfare in highly vulnerable regions. By juxtaposing corruption with the misery index, this study reveals how governance failures intensify economic distress, providing new insights into the critical need for anti-corruption policies tailored to enhance welfare outcomes in SSA. Section 2 of this study focuses on the literature review. Section 3 dwells on the methodological approach adopted in this study. Section 4 centres on data analysis and result interpretation, while Section 5 discusses the conclusion, policy implication, limitations, and suggestions for further studies.
2. Literature Review
2.1. The Misery Index and Economic Inequality in SSA
The misery index, a composite measure reflecting the sum of a country’s inflation and unemployment rates, is a crucial indicator of economic hardship with significant implications for poverty and economic inequality, particularly in SSA. Since Arthur Okun’s pioneering study in the 1970s on the misery index, numerous economists have expanded on his work. Empirical studies consistently show that higher misery index values correlate with increased economic inequality and social unrest, offering crucial insights into the overall economic health and implications for social welfare [22,23,24,25,26].
Economic inequality in SSA has been the subject of extensive research, with many scholars noting its pervasive nature and detrimental effects on social cohesion and economic progress. Odusola et al. [27] highlight that income inequality in SSA is among the highest globally, with significant variations between and within countries. Factors contributing to this inequality include uneven access to education, economic opportunities, and healthcare.
In SSA, the misery index exacerbates already existing socioeconomic inequalities. Inflation erodes the purchasing power of households, making essential goods and services unaffordable, while unemployment further limits economic opportunities [28,29]. Nwani and Osuji [30] argue that the misery index amplifies poverty by increasing economic misery, particularly for those without access to adequate sanitation, clean water, and other essential services. This view is supported by evidence from panel data across 20 SSA countries, which indicates that high unemployment and inflation significantly contribute to the rising poverty levels [30].
Moreover, income inequality is one of the most critical issues in SSA [31]. Countries such as South Africa have the highest recorded Gini coefficient in the world, reflecting the extreme disparity between the wealthy elite and the broader population [32,33]. The misery index aggravates economic inequality, as low-income households are disproportionately affected by inflation and unemployment, which restricts their ability to save or invest in future opportunities. This creates a vicious cycle of poverty that is hard to break despite economic growth in specific sectors [34]. For instance, while some upper–middle-income countries in SSA have experienced growth, the benefits have not been distributed. Rising gross domestic product (GDP) often worsens inequality due to unequal access to education, healthcare, and jobs [32].
2.2. The Misery Index and Social Welfare in SSA
The misery index also undermines social welfare programmes to alleviate poverty and support the most vulnerable. As governments struggle with high inflation and unemployment, their capacity to fund and maintain welfare services is diminished. Nwani and Osuji [30] emphasise that poor access to electricity, sanitation, and clean water, combined with high economic misery, further reduces the effectiveness of social welfare initiatives.
In SSA, social safety nets are fragile, and the population’s reliance on informal support systems rather than institutional welfare programmes further complicates the matter. The reduction in social welfare due to the misery index is evident in the region’s poorest countries. As economic conditions deteriorate, governments are often forced to cut back on public spending, including health, education, and infrastructure, which are essential to social welfare. This, in turn, exacerbates poverty and inequality, as the most vulnerable population is left without adequate support systems. According to Nwani and Osuji [30], access to improved water and sanitation services could significantly reduce poverty levels. Still, inflation and unemployment create an environment where these services remain inaccessible to many, further entrenching inequality.
Welsch [35] extends the misery index by including growth and long-term interest rates, showing that stability measured through inflation or interest rates matters as much as growth and employment for life satisfaction. This study’s findings revealed that unemployment substantially impacts well-being more than inflation, offering critical insights for shaping welfare policy.
A study by Njindan Iyke and Ho [14] found that macroeconomic instability, measured by the misery index, negatively impacts economic growth in the SSA region. This relationship underscores the importance of addressing unemployment and inflation to promote economic growth. Other researchers argue that high levels of economic hardship, as measured by the misery index, can exacerbate existing inequalities [15,16]. For instance, periods of high inflation disproportionately affect lower-income groups, widening the wealth gap. Similarly, a high unemployment rate often severely impacts vulnerable populations, further entrenching economic disparities. Policy interventions to reduce economic misery and inequality have been proposed and implemented with varying degrees of success. These include targeted poverty reduction strategies, investments in human capital, and efforts to promote inclusive growth. Following a comprehensive review of the literature exploring the relationship between the misery index, economic inequality, and social welfare in Section 2.1 and Section 2.2, key gaps remain in understanding how these factors impact SSA. This study addresses these gaps through targeted research objectives, which aim to investigate how the misery index affects economic inequality and social welfare across different levels of inequality in SSA. The research hypothesis is stated in the null form as follows:
H1.
Higher Misery Index values are associated with increased economic inequality in SSA.
2.3. Global Distribution of Extreme Poverty and Economic Inequality in 2023
Figure 1 illustrates the global distribution of extreme poverty in 2023, defined as living on less than USD 2.15 per day, according to the World Bank Report cited by [36]. Darker shades indicate a higher proportion of the population living in extreme poverty. Sub-Saharan Africa appears most affected, with countries like the Democratic Republic of Congo, Madagascar, and Malawi experiencing a significant share of their populations facing economic hardship. These high poverty levels often correlate with elevated misery index scores, as economic instability, inflation, and unemployment contribute to the population’s reduced quality of life. Other African nations also have significant portions of their populations in extreme poverty, although at slightly lower rates. Regions such as North America, Europe, and East Asia display minimal or no extreme poverty, indicating higher living standards and economic development. Figure 1 underscores the stark disparities in poverty worldwide, with SSA facing the most significant challenges.
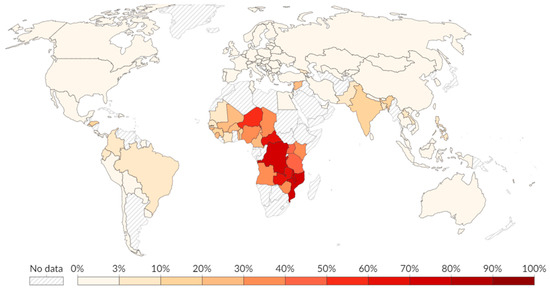
Figure 1.
Share of population living in extreme poverty, 2023. Source: Our World in Data [37]. Note: Extreme poverty is defined as living on less than USD 2.15 per day, based on the International Poverty Line. This threshold is adjusted for inflation and accounts for differences in the cost of living across countries.
As seen in Figure 2, which shows the global distribution of economic inequality, darker-shaded areas around SSA and Latin America have high Gini values, suggesting that wealth and resources are concentrated among a small elite, often leading to limited economic mobility and social stratification. In many SSA countries, economic inequality is driven by factors such as limited access to education, underdeveloped financial systems, and reliance on resource-based economies. Wealth from natural resources, such as minerals and oil, often accrues to political and business elites, bypassing broader population benefits. Latin America also suffers from entrenched inequality due to historical land concentration, weak labour protections, and tax policies that favour the wealthy.
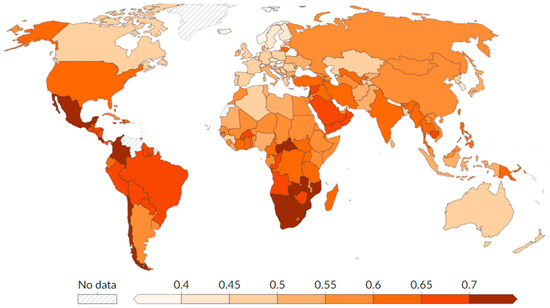
Figure 2.
Gini Coefficient 2022. Source: Our World in Data [33].
In contrast, lighter-shaded regions, as seen in Figure 2, including Europe and parts of Asia, tend to have lower Gini scores. These areas typically implement stronger social welfare systems, progressive taxation, and robust public education, which foster more equitable income distribution. Consequently, countries with lower Gini Coefficients can support broader economic stability, higher consumption levels, and reduced social tensions, ultimately enhancing overall economic growth potential.
2.4. The Moderating Role of Corruption
Corruption is critical in moderating the relationship between the misery index, economic inequality, and social welfare. In SSA, corruption is endemic, and corrupt officials often divert resources meant for public welfare into private pockets. Amini and Douarin [38] highlight that pervasive corruption exacerbates the effects of the misery index by misallocating resources that could have been used to alleviate poverty or reduce inequality. For example, funds earmarked for social welfare programmes are frequently siphoned off by corrupt officials, reducing the effectiveness of these initiatives and leaving vulnerable populations further disadvantaged [39].
Moreover, corruption normalises inequality by enabling the wealthy to maintain their status and influence. Kohnert [32] emphasises that corruption in SSA has institutionalised inequality, as elites use their political connections to bypass inflationary pressure and secure favourable economic outcomes. This exacerbates the divide between the rich and the poor, as the wealthy can shield themselves from the economic misery of inflation and unemployment while the poor bear the brunt of these challenges.
Corruption also impacts social welfare in less direct ways. Amini and Douarin [38] argued that in corrupt environments, citizens often perceive social welfare programmes as ineffective or rigged, which leads to a decline in public trust in institutions. This distrust further undermines the implementation of welfare policies and exacerbates the socioeconomic divide. In Eastern Europe, for instance, where corruption has been similarly pervasive, life satisfaction and trust in public institutions have significantly declined, mirroring the experience of SSA [38]. The psychological cost of corruption adds another layer of complexity as those affected by economic misery in corrupt environments tend to feel more disillusioned and less hopeful about escaping poverty. Corruption amplifies economic hardship and deepens inequality by diverting resources from critical welfare initiatives in SSA [40]. This moderating role underscores the complex interplay between governance quality and social outcomes, leading to the second set of research objectives to explore how corruption influences the relationship between the misery index and social welfare outcomes across varying levels of social welfare in SSA. Therefore, the hypothesis is stated as follows:
H2:
Corruption intensifies the negative impact of the misery index on social welfare outcomes in SSA countries.
3. Methodology
3.1. Data and Variable Description
This study examines economic inequality and social welfare in 19 SSA countries from 2007 to 2022. The selection of countries was based on the classification of the SSA countries with high misery index, as seen in Table A1 and sourced from [41]. This study’s time frame was determined by data availability for the variables of interest. Variables were sourced primarily from the World Development Indicators (WDI) and theGlobalEconomy.com databank, as presented in Table 1. In accordance with the corresponding literature motivating this study, as apparent in the introduction, two main outcome variables are employed, namely, economic inequality, measured by the Gini coefficient (GINI), and social welfare, represented by the percentage of the population living below the poverty line (POVERTY).

Table 1.
Variable Description.
To analyse economic hardship, this study incorporates the misery index (MISDEX), a composite independent variable that combines inflation and unemployment rates, following conventions in the hardship literature [2,17,30,35]. The misery index quantifies economic distress and is sourced from [42]. Our study also included the happiness index (HAPPY), a subjective measure of life satisfaction and well-being [43,44]. Including the happiness index allows for a broader assessment, capturing not only the financial strain indicated by inflation and unemployment but also the general sentiment and quality of life experienced by individuals in the population.
The corruption perception index (CPI) is a moderating variable that examines its influence on the relationships between hardship and inequality. Corruption perception index values range from 0 (highly corrupt) to 100 (highly transparent or corruption-free), sourced from [45]. This moderating variable allows for assessing the role of public sector integrity in shaping socioeconomic outcomes in SSA.
The control variables adopted in this study include GDP per capita (GDPPA) and official development assistance (ODA), which are expected to influence inequality and poverty outcomes. GDP per capita, representing the average income per person, provides insight into national income distribution and economic well-being. On the other hand, the official development assistance reflects the inflow of foreign aid, a critical factor for SSA economies, with both variables sourced from the WDI. Other variables adopted to enhance this study’s robustness include institutional quality measured by the rule of law (RoL), which ranges from −2.5 (weak) to 2.5 (strong) and is sourced from [42]. Institutional quality is essential for understanding how governance frameworks affect economic inequality and social welfare.
3.2. Estimation Technique
To analyse the impact of the misery index on economic inequality and social welfare, with moderating effects from CPI, we explore how these variables affect the distribution of GINI (economic inequality) and POVERTY (social welfare), capturing the differential impacts across quantiles to provide a robust understanding of these relationships. Our study adopts two dependent variables, namely, (i) Economic Inequality (GINI), represented by the Gini coefficient, and (ii) Social Welfare (POVERTY), represented by the percentage of the population living below the poverty line.
For each dependent variable , we specify a quantile regression model that allows us to examine the conditional quantiles of given a set of independent variables and moderating variable. This approach enables us to understand how the impact of these variables changes across different parts of the distribution of , such as lower (0.1, 0.25), median (0.5), and upper quantiles (0.75, 0.9).
3.2.1. Model Specification
In specifying our model, let represent the quantile of the dependent variable conditional on the independent variables and the moderating variable , where . For individual at time , the quantile regression model can be formulated as
where
is either or for individual at time ;
= , where is the misery index, representing a composite measure combining inflation and unemployment rates, and is the happiness index, ranging from 0 (unhappy) to 10 (happy);
represents the control variables, while ( (see Table 1 for variable measures and description);
is the intercept term at quantile ; and are quantile-specific parameter vectors for independent and moderating variables, respectively; is the quantile-specific error term.
3.2.2. Estimation Procedure
The parameters , , and are estimated by minimising the quantile loss function:
where the quantile loss function is defined as
The quantile regression model, without considering unobserved heterogeneity, is specified as
This study applied the System Generalised Method of Moments (GMM) to address endogeneity concerns in this model. This dynamic panel estimation technique is particularly suitable for our study as it effectively handles unobserved heterogeneity and accounts for the persistence of the dependent variable. However, the dependent variables, and were excluded from the GMM analysis due to insufficient data, which did not meet the required conditions for robust estimation. The exclusion ensures the validity of the econometric approach by focusing on variables with adequate data coverage to satisfy the instrument relevance and model specification criteria. was used as the dependent variable to estimate its relationship with key explanatory variables, providing insights into the factors influencing economic inequality and social welfare dynamics. The GMM estimation is specified in Equation (4); thus,
4. Data Analysis and Result Interpretation
The summary statistics, otherwise called descriptive statistics, in Table 2, revealed detailed insights into the socioeconomic landscape in SSA. The Gini coefficient, with an average of 43.425, suggests a moderate level of income inequality across the sampled countries. The range from 33 to 63.4 indicates that while some nations exhibit relatively equitable wealth distribution, others face severe disparities that could hinder social cohesion and sustainable economic growth.
Table 2.
Descriptive Statistics.
The poverty rate, averaging 41.063%, highlights significant economic hardship, with some countries experiencing poverty rates as high as 71.7%. This suggests that a large proportion of the population in the region faces challenges in accessing basic needs such as education, healthcare, and employment, perpetuating a cycle of poverty and inequality.
The misery index with a mean value of 16.333 indicates moderate regional economic distress. However, its wide range, from −8.17 to an extreme 565.82, underscores the economic variability among countries, with high values reflecting severe financial instability. Such conditions could undermine consumer confidence and economic resilience, posing challenges to sustained economic development.
The average happiness score of 4.33 suggests relatively low life satisfaction among individuals, ranging from 2.84 to 6.07. This reflects the significant socioeconomic challenges faced in the region, including poverty, inequality, and economic instability. While cultural and community factors may offer some resilience, they do not outweigh the overarching struggles impacting subjective well-being [46,47].
The corruption perception index averages 34.854, indicating widespread perceptions of corruption. This level of corruption can erode trust in institutions, deter foreign investment, and exacerbate inequality, ultimately hindering economic growth and development. The GDP per capita, averaging USD 2487.68, demonstrates significant economic variability across the countries, with values ranging from USD 351.84 to USD 11,643.46. This disparity highlights stark wealth generation and distribution differences, reflecting the region’s diverse economic contexts and development levels.
Official development assistance averages USD 984.12 million, with a wide range of USD 14.63 million to USD 4.44 billion, reflecting varying degrees of reliance on external support among the countries. Foreign direct investment inflows average USD 1.259 billion, but their high standard deviation underscores the uneven distribution of investment, with some countries receiving significant inflows while others see limited engagement.
The rule of law score averages −0.477, ranging from −1.87 to 1.02, indicating generally weak institutional frameworks in the region. This suggests governance challenges, which may inhibit economic performance and the equitable distribution of resources.
Table 3, which presents the correlation matrix, shows that the Gini coefficient positively correlates with poverty and foreign direct investment at 0.425 and 0.501, respectively. This suggests that countries with higher income inequality tend to experience more poverty and attract greater foreign investment. Gini also shows a weak positive correlation with the corruption perception index and the rule of law at 0.218 and 0.265, respectively, indicating that inequality might be moderately associated with governance quality and corruption levels.
Table 3.
Matrix of correlations.
Table 3 shows that poverty negatively correlates with official development assistance at −0.414, implying that increased external aid may help reduce poverty. Happiness is positively correlated with GDP per capita and the rule of law at 0.564 and 0.161, respectively, reflecting that economic prosperity and stronger institutional frameworks contribute to higher life satisfaction. Interestingly, happiness negatively correlates with the misery index of −0.236, underscoring that higher economic distress reduces overall well-being.
The corruption perception index shows a strong positive correlation with the rule of law at 0.520, reinforcing that corruption undermines institutional quality. Moreover, foreign direct investment positively correlates with GDP per capita and the rule of law at 0.503 and 0.245, respectively, suggesting that stable institutions and economic prosperity attract greater foreign investment. However, FDI shows no significant relationship with poverty at 0.034, indicating that other factors might indirectly mediate its impact on poverty reduction.
The variance inflation factor (VIF) results for the Gini and poverty models in Table 4 reveal that multicollinearity is unlikely to distort the results in either model significantly. Further analysis of models indicates that the rule of law and corruption perception index exhibit the highest VIF values above 5, indicating potential collinearity issues, but still below the rule of thumb of 10, suggesting it is not severe enough to warrant corrective measures [48,49,50]. Table 3 further indicates that all other variables exhibit relatively low VIFs, suggesting minimal concern about multicollinearity in these cases. The overall mean VIF values of 2.97 and 2.39 for the Gini and poverty models are generally acceptable, indicating the absence of multicollinearity.
Table 4.
Variance inflation factor.
As shown in Table 5, the misery index consistently exhibits a significant and positive effect on income inequality across all quantiles, particularly in lower quantiles (0.1 and 0.25). For instance, at the 0.1 quantile, a unit increase in MISDEX corresponds to a rise in income inequality of 0.028, indicating that economic hardship disproportionately affects the lower-income segments. The positive coefficients in higher quantiles (0.5, 0.75, and 0.9) further imply that inflation and unemployment exacerbate inequality across the income distribution, although the significance weakens slightly in the median and upper quantiles.
Table 5.
Quantile Regression (GINI).
The happiness index significantly negatively affects income inequality in the lower quantiles (0.1 and 0.25), suggesting that societal happiness mitigates inequality, aligning with the existing literature [51,52]. For example, at the 0.1 quantile, a unit increase in HAPPY reduces inequality by 3.751. However, this effect diminishes at higher quantiles (0.5 and 0.75), where the coefficients become insignificant, indicating that the influence of societal happiness on inequality is less pronounced in wealthier segments. At the 0.9 quantile, the coefficient is significant but weaker, reflecting a potential residual effect of happiness in reducing disparities in upper-income groups.
The corruption perception index demonstrates no significant impact on income inequality across all quantiles, with small and inconsistent coefficients. This suggests that perceived corruption levels alone may not directly influence income distribution, potentially due to structural inefficiencies or the complex nature of corruption’s effects on inequality. The log of GDP per capita shows mixed effects, with no significant impact at lower and median quantiles (0.1 to 0.5). However, at higher quantiles (0.75 and 0.9), the coefficients become positive and significant, indicating that economic growth may disproportionately benefit higher-income groups, thus increasing inequality in wealthier segments.
Official development assistance has a marginally significant and negative effect on income inequality at higher quantiles (0.75 and 0.9), with coefficients of −0.005 and −0.005, respectively. This suggests that aid may help narrow income gaps in wealthier segments, albeit weakly, possibly due to improved redistribution mechanisms or targeted programmes. Therefore, GDP per capita and foreign aid may deepen inequality, particularly in unequal societies. This finding is consistent with studies showing that economic growth can sometimes disproportionately benefit higher-income groups [53,54,55,56].
The log of foreign direct investment has a limited direct effect on inequality. While the coefficients are positive across all quantiles, they are marginally significant only at the 0.1 and 0.9 quantiles. This could indicate that FDI may contribute to inequality by favouring capital-intensive industries, which benefit higher-income groups.
The rule of law index does not significantly impact lower and median quantiles. However, at the 0.9 quantile, it becomes significant and positive, with a coefficient of 11.772. This suggests that stronger institutional frameworks may benefit wealthier groups more, potentially exacerbating inequality at higher income levels. The pseudo-R-squared values indicate moderate explanatory power, with higher values in upper quantiles (0.382 and 0.531) reflecting a stronger role of the included variables in explaining income inequality dynamics among wealthier segments.
Table 6 quantile regression analysis examines the impact of independent variables on poverty across different quantiles. Table 6 shows that the misery index negatively and significantly impacts poverty only at the upper quantiles (0.75), indicating that higher misery index scores are associated with reducing poverty at these levels. This suggests that economic distress, measured by MISDEX, may trigger targeted policies or social safety nets that disproportionately benefit individuals at higher poverty levels. For instance, during periods of high misery index scores, international organisations like the IMF and World Bank often intervene by funding social safety net programmes, such as conditional cash transfers and subsidies for basic needs, or by requiring poverty-focused reforms as part of loan agreements, which disproportionately benefit those in the upper poverty quantiles and help reduce extreme poverty [57,58,59].
Table 6.
Quantile Regression (POVERTY).
The happiness index has a significant positive impact only at the upper quantile (0.9), suggesting that higher happiness levels in this segment might not translate into poverty reduction, potentially reflecting disparities in the distribution of well-being benefits across income groups. The corruption perception index significantly reduces poverty at the upper quantiles (0.75 and 0.9), highlighting the critical role of anti-corruption measures in alleviating poverty in higher poverty brackets. The log of GDP per capita consistently and significantly reduces poverty across all quantiles, underscoring economic growth as a cornerstone for poverty alleviation. Official development assistance significantly reduces poverty across all quantiles, reinforcing its importance as an external support mechanism for poverty reduction. The rule of law significantly reduces poverty at lower quantiles (0.1 and 0.25) but shows a positive effect at upper quantiles (0.75 and 0.9), reflecting its complex and varied influence across income groups.
From Table 7, which shows the GMM output, it can be deduced that the log of GDP per capita (lngdppa) shows inconsistent effects, with no significant impact across all models. Institutional quality measured by the rule of law is also not statistically significant, indicating its limited effect on the misery index. The official development assistance and corruption perception index have minimal impact on the misery index. The coefficient of the corruption perception index indicates that corruption levels do not directly affect the misery index in SSA.
Table 7.
System GMM on the Effect of Misery Index and Determinants.
From an economic perspective, corruption is widely recognised as a factor that undermines institutional efficiency, distorts resource allocation, and diminishes public trust [60,61,62]. These effects often lead to weaker economic growth, hindered investment, and reduced social welfare. However, the insignificant coefficient for CPI suggests that the immediate relationship between corruption and the misery index may not be direct or that stronger influences like inflation and unemployment mask its effects, further agreeing with the findings of the quantile regression. For instance, while corruption can exacerbate economic inequality and erode social welfare, its contribution to inflation and unemployment might operate indirectly through reduced fiscal capacity or inefficiencies in policy implementation.
Empirical studies have shown mixed effects of corruption on macroeconomic outcomes [63,64,65]. In some developing economies, a “grease the wheels” hypothesis posits that corruption may temporarily alleviate bureaucratic inefficiencies, mitigating immediate economic distress [66,67]. Conversely, long-term effects typically include lower growth, higher poverty, and worsened public service delivery, intensifying economic misery. The Hansen test assesses instrument validity, confirming no over-identification issues in all models. The AR(1) and AR(2) tests check for autocorrelation; significant AR(1) and non-significant AR(2) indicate appropriate instrument use and model specification.
5. Conclusions
Analysing the misery index with economic inequality and social welfare in SSA highlights the region’s pressing socioeconomic challenges. High unemployment and inflation rates reflect severe economic distress, disproportionately impacting lower-income populations. This exacerbates poverty levels and widens inequality [68,69]. Corruption further compounds these issues by diverting resources intended for public welfare, undermining institutional effectiveness, and weakening efforts to alleviate poverty. Corruption’s pervasive effects erode trust in governance and disrupt targeted poverty reduction programmes, worsening socioeconomic disparities [70,71]. The quantile regression analysis reveals that economic hardships, as indicated by a high misery index, significantly worsen inequality. Simultaneously, subjective well-being, measured through the happiness index, shows an inverse relationship with inequality, particularly among lower-income groups.
While economic growth, represented by rising GDP per capita, and FDI contribute to poverty alleviation, their impact on reducing inequality remains constrained without effective institutional frameworks. Robust governance is essential to ensure that economic gains translate into equitable development. Without addressing structural inequalities, policies that merely boost growth or attract investment fail to close the widening economic disparity in SSA. Addressing poverty and inequality in the region necessitates a multifaceted approach. Policymakers must focus on mitigating inflation and unemployment while simultaneously combating corruption. Strengthening institutional frameworks and ensuring resource allocation for public welfare are critical for fostering inclusive and sustainable growth. Improving transparency, enhancing accountability, and investing in social infrastructure can significantly reduce socioeconomic disparities. In summary, this study highlights the misery index as a valuable metric for understanding the interplay between economic hardship, inequality, and welfare in SSA, emphasising the need for policies that tackle these root causes to achieve inclusive and sustainable growth.
5.1. Policy Implications
Policies must be multifaceted and resilient to address SSA’s economic inequality and welfare issues. First, controlling inflation and fostering job creation are critical to lowering the misery index. Governments should prioritise economic diversification, promoting sectors that generate stable employment. Anti-corruption initiatives must also be central to policy frameworks to ensure resources reach those most in need. Strengthening institutional quality by enforcing transparency and accountability can improve public trust and facilitate effective welfare programmes. Expanding social safety nets, particularly in healthcare, education, and sanitation, can mitigate the impacts of economic hardship on vulnerable populations, thereby reducing inequality over time.
Furthermore, enhancing access to development financing and foreign aid with stricter oversight can ensure funds are directed toward poverty alleviation rather than exacerbating inequality. Finally, fostering happiness and well-being through community-based interventions and support systems is crucial for creating a supportive social environment that can bridge economic gaps.
5.2. Limitations and Future Research Directions
This study offers valuable insights into the misery index’s impact on economic inequality and social welfare in SSA; yet, it is not without limitations. First, this study’s reliance on aggregated national-level data may mask regional disparities and local context that can impact inequality and poverty differently. A deeper, sub-national analysis could reveal more dynamics within specific countries or regions. Additionally, while the misery index captures macroeconomic stress through inflation and unemployment, it omits factors like exchange rate volatility or debt levels, which could also influence economic hardship and inequality. Further studies can inculcate these macroeconomic indicators as control variables.
This study’s quantile regression approach offers insights into the effects across income levels but does not fully capture temporal changes. Socioeconomic dynamics in SSA are often subject to rapid shifts due to political events, natural resource fluctuations, or external economic shocks. Longitudinal analysis using a time-varying approach could, thus, provide a more comprehensive understanding of how these dynamics evolve. Another limitation is the focus on traditional indicators such as GDP per capita and FDI, which may not wholly reflect the prevalent informal economic activities in the region and impact both inequality and welfare. Further studies could incorporate informal economy metrics, such as informal employment rates and household income levels outside formal sectors, to capture the broader economic landscape in SSA. This approach would offer a more comprehensive understanding of inequality and welfare, particularly where formal indicators may overlook critical dynamics.
Author Contributions
Conceptualization, G.O. and N.N.; Methodology, G.O.; Validation, G.O.; Data curation, G.O.; Writing—original draft, G.O. and N.N.; Writing—review & editing, G.O. and N.N.; Visualization, N.N.; Supervision, N.N. All authors have read and agreed to the published version of the manuscript.
Funding
This research received no external funding.
Data Availability Statement
The data presented in this study are openly available in https://www.theglobaleconomy.com/ and https://databank.worldbank.org/source/world-development-indicators (accessed on 18 November 2024).
Conflicts of Interest
The authors declare that there are no competing interests.
Appendix A
Table A1.
List of countries used for this study.
Table A1.
List of countries used for this study.
| No. | Country | Country Code | Region | Global Rank | Index |
|---|---|---|---|---|---|
| 1 | Zimbabwe | ZWE | Southern Africa | 1 | 414 |
| 2 | Angola | AO | Southern Africa | 13 | 176.1 |
| 3 | Ghana | GHA | West Africa | 15 | 86.8 |
| 4 | South Africa | ZAF | Southern Africa | 16 | 83.492 |
| 5 | Rwanda | RWA | East Africa | 20 | 69.192 |
| 6 | Madagascar | MDG | East Africa | 22 | 63.6 |
| 7 | Malawi | MW | East Africa | 23 | 63.5 |
| 8 | Gabon | GAB | Central Africa | 25 | 62.4 |
| 9 | Namibia | NAM | Southern Africa | 32 | 55.7 |
| 10 | Lesotho | LSO | Southern Africa | 38 | 51.6 |
| 11 | Nigeria | NGA | West Africa | 42 | 47.2 |
| 12 | Mauritius | MUS | East Africa | 44 | 45.4 |
| 13 | Uganda | UGA | East Africa | 71 | 35.235 |
| 14 | Mali | MLI | West Africa | 78 | 32.7 |
| 15 | Zambia | ZMB | Southern Africa | 81 | 32 |
| 16 | Tanzania | TZA | East Africa | 99 | 25.132 |
| 17 | Chad | TCD | Central Africa | 102 | 23.34 |
| 18 | Ivory Coast | CIV | West Africa | 146 | 11.622 |
| 19 | Togo | TGO | West Africa | 149 | 10.95 |
References
- Cohen, I.K.; Ferretti, F.; McIntosh, B. Decomposing the misery index: A dynamic approach. Cogent Econ. Financ. 2014, 2, 991089. [Google Scholar] [CrossRef]
- Wang, N.; Haroon Shah, M.; Ali, K.; Abbas, S.; Ullah, S. Financial structure, misery index, and economic growth: Time series empirics from Pakistan. J. Risk Financ. Manag. 2019, 12, 100. [Google Scholar] [CrossRef]
- Dadgar, Y.; Nazari, R. The impact of economic growth and good governance on misery index in Iranian economy. Eur. J. Law Econ. 2018, 45, 175–193. [Google Scholar] [CrossRef]
- Aminda, R.S.; Septiani, A.; Sundarta, M.I.; Agung, S.; Kuraesin, E.; Karyatun, S.; Endri, E.E. Analysis of the influence of poverty, human development index, and unemployment on economic growth in the regency/city of Gorontalo Province: 2012–2021 study. J. Infrastruct. Policy Dev. 2024, 8, 3513. [Google Scholar]
- Hamza, E.A.; Tindle, R.; Pawlak, S.; Bedewy, D.; Moustafa, A.A. The impact of poverty and socioeconomic status on brain, behaviour, and development: A unified framework. Rev. Neurosci. 2024, 35, 597–617. [Google Scholar] [CrossRef]
- Aikins, E.R.; McLachlan, J.D.T. Africa is losing the battle against extreme poverty. Inst. Secur. Stud. 2022, 13. Available online: https://issafrica.org/iss-today/africa-is-losing-the-battle-against-extreme-poverty (accessed on 10 November 2024).
- Francis, D.; Webster, E. Poverty and inequality in South Africa: Critical reflections. Dev. South. Afr. 2019, 36, 788–802. [Google Scholar] [CrossRef]
- Coomer, J.; Gstraunthaler, T. The Hyperinflation in Zimbabwe. Q. J. Austrian Econ. 2011, 14, 311–346. [Google Scholar]
- Bribena, K. The dynamics and complexities of natural resources and conflicts in Angola. In Political Economy of Resource, Human Security and Environmental Conflicts in Africa; Springer: Berlin/Heidelberg, Germany, 2021; pp. 67–91. [Google Scholar] [CrossRef]
- Malmberg, B.; Tegenu, T. Population pressure and dynamics of household livelihoods in an Ethiopian village: An elaboration of the Boserup-Chayanovian framework. Popul. Environ. 2007, 29, 39–67. [Google Scholar] [CrossRef]
- Wassie, S.B. Natural resource degradation tendencies in Ethiopia: A review. Environ. Syst. Res. 2020, 9, 33. [Google Scholar] [CrossRef]
- Mubecua, M.A.; David, O.J. So far so good? Tracking the poverty eradication goal of SDGs in Kenya, Nigeria, and South Africa. J. Public Aff. 2019, 19, e1964. [Google Scholar] [CrossRef]
- Power, M. Angola 2025: The future of the “World’s richest poor country” as seen through a Chinese rear-view mirror. Antipode 2012, 44, 993–1014. [Google Scholar] [CrossRef]
- Njindan Iyke, B.; Ho, S.-Y. Exchange rate uncertainty and domestic investment in Ghana. Cogent Econ. Financ. 2017, 5, 1362157. [Google Scholar] [CrossRef]
- Belle, D.; Doucet, J. Poverty, inequality, and discrimination as sources of depression among US women. Psychol. Women Q. 2003, 27, 101–113. [Google Scholar] [CrossRef]
- Halleröd, B. Sour grapes: Relative deprivation, adaptive preferences and the measurement of poverty. J. Soc. Policy 2006, 35, 371–390. [Google Scholar] [CrossRef]
- Lewkowicz, J.; Woźniak, R. Pandemic Misery Index: How to Overcome the Effects of the COVID-19 Pandemic? Soc. Indic. Res. 2024, 172, 925–946. [Google Scholar] [CrossRef]
- Farooq, A.; Shahbaz, M.; Arouri, M.; Teulon, F. Does corruption impede economic growth in Pakistan? Econ. Model. 2013, 35, 622–633. [Google Scholar] [CrossRef]
- Erum, N.; Hussain, S. Corruption, natural resources and economic growth: Evidence from OIC countries. Resour. Policy 2019, 63, 101429. [Google Scholar] [CrossRef]
- Xu, X. Corruption and economic growth: An absolute obstacle or some efficient grease? Econ. Political Stud. 2016, 4, 85–100. [Google Scholar] [CrossRef]
- Asongu, S.A. Fighting corruption in Africa: Do existing corruption-control levels matter? Int. J. Dev. Issues 2013, 12, 36–52. [Google Scholar] [CrossRef]
- Ali, A.; Mujahid, N.; Rashid, Y.; Shahbaz, M. Human capital outflow and economic misery: Fresh evidence for Pakistan. Soc. Indic. Res. 2015, 124, 747–764. [Google Scholar] [CrossRef]
- Lelkes, O. Minimising misery: A new strategy for public policies instead of maximising happiness? Soc. Indic. Res. 2013, 114, 121–137. [Google Scholar] [CrossRef][Green Version]
- Tule, K.M.; Egbuna, E.N.; Dada, E.; Ebuh, G.U. A dynamic fragmentation of the misery index in Nigeria. Cogent Econ. Financ. 2017, 5, 1336295. [Google Scholar] [CrossRef]
- Ghobarah, H.A.; Huth, P.; Russett, B. Comparative public health: The political economy of human misery and well-being. Int. Stud. Q. 2004, 48, 73–94. [Google Scholar] [CrossRef]
- Mirowsky, J.; Ross, C.E. Social patterns of distress. Annu. Rev. Sociol. 1986, 12, 23–45. [Google Scholar] [CrossRef]
- Odusola, A.; Mugisha, F.; Workie, Y.; Reeves, W. Income inequality and population growth in Africa. In Income Inequality Trends in Sub-Saharan Africa: Divergence, Determinants and Consequences; United Nations Development Programme: New York, NY, USA, 2017. [Google Scholar]
- Kaplan, G.; Schulhofer-Wohl, S. Inflation at the household level. J. Monet. Econ. 2017, 91, 19–38. [Google Scholar] [CrossRef]
- Sylla, N.S. Measuring labour absorption problems in developing countries: Limitations of the concept of unemployment. Int. Labour Rev. 2013, 152, 27–41. [Google Scholar] [CrossRef]
- Nwani, S.E.; Osuji, E. Poverty in Sub-Saharan Africa: The dynamics of population, energy consumption and misery index. Int. J. Manag. Econ. Soc. Sci. IJMESS 2020, 9, 247–270. [Google Scholar] [CrossRef]
- Fosu, A.K. Growth, inequality and poverty in Sub-Saharan Africa: Recent progress in a global context. Oxf. Dev. Stud. 2015, 43, 44–59. [Google Scholar] [CrossRef]
- Kohnert, D. Are Africans Happy? ‘Return to Laughter’ in Times of War, Famine and Misery; GIGA Institute for African Affairs: Hamburg, Germany, 2022. [Google Scholar] [CrossRef]
- Our World in Data. Income Inequality: Gini Coefficient. 2023. Available online: https://ourworldindata.org/grapher/economic-inequality-gini-index (accessed on 8 January 2025).
- Aremo, A.G.; Abiodun, S.T. Causal nexus among fiscal policy, economic growth and income inequality in Sub-Saharan African Countries (1995–2016). Afr. J. Econ. Rev. 2020, 8, 1–25. [Google Scholar]
- Welsch, H. Macroeconomics and life satisfaction: Revisiting the “Misery Index”. J. Appl. Econ. 2007, 10, 237–251. [Google Scholar] [CrossRef]
- Hasell, J.; Roser, M. From $1.90 to $2.15 a Day: The Updated International Poverty Line. Our World in Data 2024. Available online: https://ourworldindata.org/from-1-90-to-2-15-a-day-the-updated-international-poverty-line#:~:text=In%20September%202022%2C%20the%20figure,dollars%20given%20in%202017%20prices. (accessed on 8 January 2025).
- Our World in Data. Share of Population Living in Extreme Poverty. 2023. Available online: https://ourworldindata.org/grapher/share-of-population-in-extreme-poverty (accessed on 8 January 2025).
- Amini, C.; Douarin, E. Corruption and life satisfaction in transition: Is corruption a social norm in Eastern Europe? Soc. Indic. Res. 2020, 151, 723–766. [Google Scholar] [CrossRef]
- Pattanayak, S.; Verdugo-Yepes, C. Protecting public infrastructure from vulnerabilities to corruption: A risk-based approach. In Well Spent: How Strong Infrastructure Governance Can End Waste in Public Investment; International Monetary Fund: Washington, DC, USA, 2020; pp. 175–200. [Google Scholar]
- Jones, C.; Reddy, P.; Zondi, S. Poverty and Corruption in Africa: Implications and Consequence. In The Nexus between Poverty and Corruption: Quo Vadis; Cambridge Scholars Publishing: Newcastle upon Tyne, UK, 2023; Available online: https://www.cambridgescholars.com/product/978-1-5275-0241-3 (accessed on 3 January 2025).
- The World Ranking. Misery Index By Country December 2022. 2022. Available online: https://www.theworldranking.com/statistics/164/misery-index-understanding-economic-distress-and-inflation/ (accessed on 8 January 2025).
- The GlobalEconomy.Com. Economic Data. 2023. Available online: https://www.theglobaleconomy.com/ (accessed on 10 November 2024).
- Ruggeri, K.; Garcia-Garzon, E.; Maguire, Á.; Matz, S.; Huppert, F.A. Well-being is more than happiness and life satisfaction: A multidimensional analysis of 21 countries. Health Qual. Life Outcomes 2020, 18, 192. [Google Scholar] [CrossRef] [PubMed]
- Bennett, P.N.; Weinberg, M.K.; Bridgman, T.; Cummins, R.A. The happiness and subjective well-being of people on haemodialysis. J. Ren. Care 2015, 41, 156–161. [Google Scholar] [CrossRef] [PubMed]
- Transparency International. CPI 2022 for Sub-Saharan Africa: Corruption Compounding Multiple Crises; Transparency International: Berlin, Germany, 2023. [Google Scholar]
- Janssen, B.M.; Van Regenmortel, T.; Abma, T.A. Identifying sources of strength: Resilience from the perspective of older people receiving long-term community care. Eur. J. Ageing 2011, 8, 145–156. [Google Scholar] [CrossRef]
- Ong, A.D.; Bergeman, C.S.; Bisconti, T.L.; Wallace, K.A. Psychological resilience, positive emotions, and successful adaptation to stress in later life. J. Personal. Soc. Psychol. 2006, 91, 730. [Google Scholar] [CrossRef]
- O’brien, R.M. A caution regarding rules of thumb for variance inflation factors. Qual. Quant. 2007, 41, 673–690. [Google Scholar] [CrossRef]
- García, C.; García, J.; López Martín, M.; Salmerón, R. Collinearity: Revisiting the variance inflation factor in ridge regression. J. Appl. Stat. 2015, 42, 648–661. [Google Scholar] [CrossRef]
- Osuma, G. The impact of financial inclusion on poverty reduction and economic growth in Sub-Saharan Africa: A comparative study of digital financial services. Soc. Sci. Humanit. Open 2025, 11, 101263. [Google Scholar] [CrossRef]
- Oishi, S.; Kesebir, S.; Diener, E. Income inequality and happiness. Psychol. Sci. 2011, 22, 1095–1100. [Google Scholar] [CrossRef]
- Tavor, T.; Gonen, L.; Weber, M.; Spiegel, U. The effects of income levels and income inequalities on happiness. J. Happiness Stud. 2018, 19, 2115–2137. [Google Scholar] [CrossRef]
- Fields, G.S. Who benefits from economic development? A reexamination of Brazilian growth in the 1960’s. Am. Econ. Rev. 1977, 67, 570–582. [Google Scholar]
- Rubin, A.; Segal, D. The effects of economic growth on income inequality in the US. J. Macroecon. 2015, 45, 258–273. [Google Scholar] [CrossRef]
- Batrancea, L.M. The hard worker, the hard earner, the young and the educated: Empirical study on economic growth across 11 CEE countries. Sustainability 2023, 15, 15996. [Google Scholar] [CrossRef]
- Roine, J.; Vlachos, J.; Waldenström, D. The long-run determinants of inequality: What can we learn from top income data? J. Public Econ. 2009, 93, 974–988. [Google Scholar] [CrossRef]
- Grosh, M.; Del Ninno, C.; Tesliuc, E.; Ouerghi, A. For Protection and Promotion: The Design and Implementation of Effective Safety nets; World Bank Publications: Chicago, IL, USA, 2008. [Google Scholar]
- Momani, B. IMF rhetoric on reducing poverty and inequality. In Global Governance, Poverty and Inequality; Routledge: London, UK, 2010; pp. 103–121. [Google Scholar]
- Weaver, C.; Park, S. The role of the World Bank in poverty alleviation and human development in the twenty-first century: An introduction. Glob. Gov. 2007, 13, 461–468. [Google Scholar] [CrossRef]
- Bjørnskov, C. Combating corruption: On the interplay between institutional quality and social trust. J. Law Econ. 2011, 54, 135–159. [Google Scholar] [CrossRef]
- Efobi, U. Politicians’ attributes and institutional quality in Africa: A focus on corruption. J. Econ. Issues 2015, 49, 787–813. [Google Scholar] [CrossRef]
- Dang, V.C.; Nguyen, Q.K.; Tran, X.H. Corruption, institutional quality and shadow economy in Asian countries. Appl. Econ. Lett. 2023, 30, 3039–3044. [Google Scholar] [CrossRef]
- Osuma, G.; Ayinde, A.; Ntokozo, N.; Ehikioya, B. Evaluating the impact of systemic corruption and political risk on foreign direct investment inflows in Nigeria: An analysis of key determinants. Discov. Sustain. 2024, 5, 432. [Google Scholar] [CrossRef]
- Azariadis, C.; Ioannides, Y.M. On the macroeconomics of corruption. Indian Econ. Rev. 2023, 58, 105–147. [Google Scholar] [CrossRef]
- Shaw, P.; Mauro, J.A. The macroeconomic implications of corruption in the choice to educate. Econ. Syst. 2023, 47, 101074. [Google Scholar] [CrossRef]
- Méon, P.-G.; Sekkat, K. Does corruption grease or sand the wheels of growth? Public Choice 2005, 122, 69–97. [Google Scholar] [CrossRef]
- Dreher, A.; Gassebner, M. Greasing the wheels? The impact of regulations and corruption on firm entry. Public Choice 2013, 155, 413–432. [Google Scholar] [CrossRef]
- Blanchflower, D.G.; Bell, D.N.; Montagnoli, A.; Moro, M. The happiness trade-off between unemployment and inflation. J. Money Credit. Bank. 2014, 46, 117–141. [Google Scholar] [CrossRef]
- Zaman, S.; Khan, A.U. Nexus of crime rate, misery index and urbanization in Pakistan. Iran. Econ. Rev. 2023, 27, 229–245. [Google Scholar] [CrossRef]
- Iheukwumere, E.O.; Iheukwumere, C.A. Colonial rapacity and political corruption: Roots of African underdevelopment and misery. Chi.-Kent J. Int’l Comp. L. 2003, 3, 1. [Google Scholar]
- Bulut, A.; Çavuşoğlu, T. Pros and cons of corruption to income inequality: An extensive literature survey. Hitit Sos. Bilim. Derg. 2023, 16, 582–600. [Google Scholar] [CrossRef]


Disclaimer/Publisher’s Note: The statements, opinions and data contained in all publications are solely those of the individual author(s) and contributor(s) and not of MDPI and/or the editor(s). MDPI and/or the editor(s) disclaim responsibility for any injury to people or property resulting from any ideas, methods, instructions or products referred to in the content. |
© 2025 by the authors. Licensee MDPI, Basel, Switzerland. This article is an open access article distributed under the terms and conditions of the Creative Commons Attribution (CC BY) license (https://creativecommons.org/licenses/by/4.0/).