Article

The Keywords in Corporate Social Responsibility: A Dictionary Construction Method Based on MNIR

1
School of Management & Engineering, Nanjing University, Nanjing 210093, China
2
School of Business, Anyang Normal University, Anyang 455000, China
*
Author to whom correspondence should be addressed.
Sustainability 2025, 17(6), 2528; https://doi.org/10.3390/su17062528
Submission received: 3 February 2025 / Revised: 6 March 2025 / Accepted: 12 March 2025 / Published: 13 March 2025
(This article belongs to the Section Economic and Business Aspects of Sustainability)

Abstract

:
Corporate social responsibility (CSR) and environmental, social, and governance (ESG) disclosures are critical for sustainable value creation. However, traditional evaluation methods struggle to quantify authentic performance and detect disclosure biases. In response, this study proposes an automated CSR polarity dictionary construction method that innovatively combines natural-language-processing technology and the multinomial inverse regression (MNIR) method. This method analyzes the correlations between corporate CSR reports and CSR ratings and constructs a dictionary that best reflects the CSR level of listed companies. We also used the CSR dictionary to construct a CSR disclosure level index for listed companies’ annual reports. This study reveals that CSR disclosure levels in annual reports expose manipulative disclosure practices and image management. However, this behavior has been proven to fail in generating excess returns for the company in the stock market. This phenomenon provides novel insights into corporate stock market performance management. In addition, the CSR disclosure level index is shown to effectively reflect the CSR level of enterprises in different industries and provides a theoretical reference for the social responsibility management of companies with different pollution levels. These findings facilitate efficient information release and strengthen ESG assessment frameworks through data-driven standardization.

1. Introduction

As a core component of the environmental, social, and governance framework, corporate social responsibility disclosure not only reflects a company’s commitment to sustainable development [1] but is also a key basis for the capital market to evaluate the quality of non-financial information [2]. As regulators tighten their requirements for ESG information disclosure, the regulatory requirements for the CSR disclosure reports of Chinese listed companies are constantly evolving. Since the Shanghai Stock Exchange issued the Information Disclosure Evaluation Guidelines in 2013, CSR disclosure has gradually shifted from a voluntary practice to a standardized obligation [3]. As an important indicator for measuring corporate social responsibility performance, the CSR disclosure level index is usually defined as a standardized tool for systematically evaluating the non-financial information disclosed by companies through quantitative or qualitative methods. Specifically, the CSR disclosure level index quantifies the level of corporate social responsibility fulfillment by analyzing the text content of corporate annual reports, CSR reports, and so on, combined with statistical models [4,5].
The existing CSR disclosure indices mainly face three challenges. Firstly, traditional manual scoring methods are inefficient and highly subjective, making it difficult to handle the large amount of text that requires automated processing [6]. Secondly, companies may manipulate disclosure content through “obfuscation” behavior to conceal their actual social responsibility performance and maintain their corporate image [7,8]. This problem is even more complicated in the Chinese context. For example, “strategic ambiguity” expressions (such as “actively responding to the dual carbon goals”) often appear in the annual reports of Chinese listed companies. Although such words convey positive signals, they may lack substantive action support [9]. Thirdly, the existing CSR disclosure indices mostly focus on word frequency statistics or topic classification. The underlying dictionary they rely on lacks the quantitative distinction of word polarity, meaning that they do not account for the positive or negative contribution of words to CSR ratings. Additionally, the indices fail to thoroughly integrate the dynamic relationship between text semantics and rating targets [4,10]. Therefore, in this context, constructing CSR disclosure level indicators that are both objective and explanatory represents not only a theoretical gap in academic research but also an urgent need for regulators to optimize information disclosure standards [5,11].
This research proposes a CSR disclosure level index construction method based on natural language processing and MNIR to solve the above problems. Specifically, this study applies the MNIR model to Chinese CSR text analysis for the first time. Through analyzing the statistical relationship between corporate ESG scores and the distribution of annual report terms, positive and negative words that have significant explanatory power for CSR levels are identified [12]. Compared to the traditional topic models, such as latent Dirichlet allocation (LDA), MNIR can directly quantify the marginal effect of words on the score, thereby constructing a more explanatory dictionary [13]. Based on this dictionary, we further designed a weighted disclosure index to achieve automated rating of the CSR level of corporate annual reports. In addition, we also examined the economic consequences of CSR disclosure levels, analyzing the correlations among the operating performance, stock market performance, and CSR disclosure levels of Chinese listed companies. We also grouped companies by performance (above/below the industry average) to explore the differentiated performance of “image management” motivation [14].
Then, we identified the annual trends of the CSR disclosure level indicators constructed based on the dictionary. Specifically, this study averaged the CSR disclosure level indicators by year and observed the consistency of their trends with other known indicators. The data show that the CSR disclosure level indicators constructed in this study reflect the actual CSR rating indicators and CSR market index, which indicates that the CSR indicators in this study have market value. At the same time, after averaging the CSR disclosure level indicators constructed in this study by year and by industry group, the observed industry CSR disclosure level indicators reflect the nature of the industry itself and, therefore, play an essential role in industry research.
Moreover, we used mediating effects and group regression to explore the mechanism and results of managers’ CSR disclosure manipulation behavior based on corporate image management motivation. This study found that managers of companies with poor performance tended to manipulate the CSR disclosure levels for image management, aiming to improve their market performance in the information disclosure process. However, the experimental results show that this manipulation behavior cannot improve companies’ stock market performance. In addition, we conducted a heterogeneity test on companies; that is, we divided companies into two groups—namely, high- and low-pollution industries—and explored the differences in their CSR disclosure manipulation motivations. The empirical results show that CSR disclosure manipulation is more common in companies with low pollution levels. Finally, the results of this study have proven to be robust.
The contributions of this study are reflected in three aspects: (1) At the methodological level, this study developed a CSR dictionary construction framework suitable for Chinese reports, filling the gap in word polarity quantification tools for ESG text analysis. (2) Theoretically, this study reveals negative relationships among CSR disclosure levels, operating performance, and stock returns. It verifies the “image management hypothesis”, which suggests that companies with poor performance improve their market performance through CSR disclosure manipulation [7,15,16]. (3) At the policy level, this study provides a data-driven solution for regulators to identify greenwashing behavior and optimize information disclosure standards [17].
The subsequent sections of this paper are arranged as follows: Section 2 reviews the relevant literature on CSR disclosure quality assessment and text analysis technology; Section 3 details the MNIR model and dictionary construction method; Section 4 presents the dictionary characteristics and validity test; Section 5 empirically analyzes the impact of CSR disclosure level on market performance; and Section 6 summarizes the research conclusions and policy implications.

2. Literature Review

The evaluation mechanism for CSR and ESG information disclosure has emerged as a pivotal issue of common concern in both academic circles and the capital market in recent years. As the concept of sustainable development gains prominence, the ESG framework has evolved from being a peripheral concern to a fundamental criterion for assessing corporate non-financial performance. In the last few years, CSR has received extensive attention in academia as a core component. CSR has become the predominant keyword in ESG-related research, highlighting its irreplaceable role in social responsibility [18]. With the development of ESG theory, the concept of CSR has gradually become closely linked with corporate management [19], thus providing the possibility of manipulating CSR information disclosure [20]. Therefore, the inconsistent quality of information disclosure, the subjectivity of evaluation methodologies, and the strategic manipulation by companies remain significant obstacles to the efficacy of ESG implementation. This study reviews the literature from three dimensions: ESG information disclosure and evaluation, CSR information disclosure and text analysis technology, and manipulative behaviors in CSR information disclosure with the objective of corporate image management. Finally, we identify the research gap and innovative contributions of this study.

2.1. ESG Information Disclosure and ESG Evaluation

Since the United Nations introduced the ESG concept in 2004, its meaning has evolved from a singular focus on environmental responsibility to a comprehensive framework encompassing environmental, social, and governance dimensions [21]. High-quality ESG information disclosure mitigates capital costs [22], bolsters investor confidence [23], and enhances corporate long-term value [24].
In China, the regulatory framework for ESG information disclosure is shifting from voluntary to mandatory reporting, particularly for state-owned businesses and heavily polluting sectors [25,26]. Some empirical studies have indicated that a positive correlation exists between ESG information disclosure and financial performance [27,28]. This is primarily attributed to the optimization of credit channels, the alleviation of borrowing restrictions, and enhanced stock performance following the improvement of the information disclosure regulatory framework, particularly for companies with higher-quality environmental information disclosure [29]. However, in the case of inadequate shareholder protection mechanisms, the impact of ESG information disclosure on financial performance may be minimal or insignificant [30]. Moreover, ESG information disclosure encounters the issue of greenwashing. Some companies tend to selectively disclose favorable data or employ “strategic ambiguity” in their language (e.g., “actively responding to policies”) to obscure negative performance, leading to a substantial disparity between actual practices and stated commitments [31,32].
In terms of ESG evaluation, early methods mainly relied on expert judgment and manual scoring (e.g., MSCI, S&P Global). These methods had high costs, were difficult to update in real time, lacked unclear scoring criteria, and were susceptible to subjective bias [33,34]. In addition, traditional evaluation methods, such as word frequency statistics or the LDA topic model, are limited in semantic depth and fail to quantify the dynamic impact of words on scores accurately. The underlying dictionary also lacks the capability to differentiate word polarity [35].

2.2. CSR Information Disclosure and Text Analysis Technology

Corporate social responsibility (CSR) information disclosure refers to the process by which a company publicly releases its internal activities and strategies related to social responsibility. Different from traditional financial disclosure, CSR disclosure includes not only economic statistics but also the company’s performance in environmental protection, social responsibility, and corporate governance. In recent years, CSR information disclosure has emerged as a significant metric for evaluating corporate social responsibility performance.
Existing research has pointed out that CSR disclosure is closely linked to the decision making of corporate managers. The three main areas of current research include managers’ motivations for CSR disclosure, the effects of CSR disclosures, and the attributes that influence the quality of disclosure [5]. For instance, managers’ personalities and voluntary disclosure tendencies indirectly affect the evaluation of CSR disclosure levels 6. In addition, the social, cultural, and regulatory environments significantly shape the quality of CSR disclosures [36]. Moreover, recent years have witnessed a growing research interest in the influence of corporate governance structure on CSR disclosure, with several studies demonstrating that robust corporate governance is positively correlated with higher-quality CSR disclosure [37,38].
Building on existing text analysis methods, recent methodological innovations have demonstrated that structural and content-based examination of disclosure texts provides critical insights for CSR evaluation [4]. Some scholars constructed a CSR dictionary based on the Italian language environment to analyze the content of CSR reports [39]. Although the study did not distinguish between the polarity and other attributes of words, it offered insights for this study.
The swift development of natural-language-processing technology has propelled text analysis into an automated era. NLP-driven methods now allow researchers to systematically extract semantic patterns from CSR reports, transforming qualitative disclosures into quantifiable metrics. Scholars have developed three core analytical dimensions, including topic classification [40], sentiment analysis [10], and similarity analysis [9,10], to analyze the text of CSR reports. However, LDA-based topic models frequently suffer from interpretive subjectivity and topic instability across different corpora, often generating inconsistent classification results when applied to CSR reports with overlapping sustainability themes. Sentiment analysis tools demonstrate contextual blindness in specialized domains, failing to capture CSR-specific linguistic nuances. Similarity metrics relying on surface-level textual features struggle to detect semantic equivalency in sustainability disclosures, particularly when comparing reports across industries.
In addition to traditional NLP methods, other studies have used deep learning and machine learning to assess the CSR level. Some scholars have employed large-scale pre-training models to discern topics and keywords in CSR reports and have further used deep learning to predict CSR levels [17,40]. Meanwhile, some researchers have concentrated on applying computer technology to analyze corporate social responsibility management and market mechanisms [14,41,42,43]. Although these methods have significantly advanced the automation and refinement of CSR assessment, it should be noted that they may exhibit instability and ambiguity and fail to conduct comprehensive analysis of CSR reports at a fine-grained level.

2.3. Manipulative Behaviors in CSR Information Disclosure for Image Management

Corporate social responsibility (CSR) disclosure serves as the primary medium for companies to communicate with stakeholders. The text content not only conveys information regarding social responsibility activities, but it also serves as a strategic instrument for management to execute “image management” [44]. Existing studies have identified three prevalent strategies for manipulative behaviors in CSR information disclosure: tone management [45,46,47], obfuscation [48,49], and selective emphasis [50,51,52]. Companies tend to employ these semantic manipulation methods to enhance disclosure content, aiming to shape a positive image rather than genuinely improve their social responsibility performance [53]. This phenomenon intensifies the principal–agent dilemma and may result in a distortion of resource allocation efficiency [54].
The manipulative behaviors in CSR information disclosure have been demonstrated to increase agency costs, stemming from managers’ opportunistic and self-serving objectives. The principal–agent theory posits that managers may manipulate CSR information disclosure to mitigate reputational risks and performance pressures [55], offer a rational defense for speculative behaviors [56,57], and potentially attract social investment through deceptive promises, thus misleading investors’ judgments [53]. Moreover, in times of crisis, manipulating CSR information disclosure may serve as a defensive strategy to preserve reputation and image [58].
In order to identify manipulative behaviors in CSR information disclosure with image management, scholars have extensively employed computational linguistic techniques to solve this problem. Sentiment analysis, natural language processing (NLP) technologies and machine learning models are employed to examine optimistic bias, inconsistent tone, and selective issue emphasis in CSR reports. These technical methods not only expose the phenomena of semantic whitewashing in CSR information disclosure but also elucidate how corporations dynamically modify CSR information disclosure in response to external crises or alterations in the regulatory landscape [59,60,61].

2.4. Summary

In summary, traditional ESG evaluation methods predominantly depend on expert judgment and manual scoring, which are inefficient and subjective and lack a unified standard framework. The underlying dictionary utilized in current CSR text analysis frequently inadequately quantifies the positive and negative polarity of words, making it difficult to capture the actual semantics of the disclosed content accurately. This deficiency is pronounced in the Chinese context, as companies may manipulate information through “strategic ambiguity” or “semantic whitewashing” to obscure their actual social responsibility performance. Therefore, it is challenging for traditional methods to detect image management behaviors.
While the LDA model may extract probable topics from texts, its output does not provide a quantifiable differentiation of word polarity. The topic division also exhibits a degree of uncertainty, which makes it difficult to map to specific CSR scores directly. While sentiment analysis technology may identify the emotional inclination of texts, it typically depends on predefined dictionaries and struggles to dynamically adjust to the varied and nuanced semantic shifts in corporate information disclosure materials. Deep learning techniques have advantages in capturing contextual semantics, but their models exhibit complexity, lack interpretability, and depend on extensive annotated datasets, thus constraining their widespread application in CSR evaluation.
In view of this, we selected the MNIR model because it directly models the statistical relationship between the word distribution and the CSR score to quantify the positive and negative contribution value of each word [5]. We not only developed an objective and well-defined Chinese CSR dictionary but also, more precisely, captured the semantic manipulation behavior in corporate information disclosure texts. This study further examines the relationship between the level of CSR information disclosure and market performance, offering a robust theoretical and empirical framework for analyzing the behavior of companies that conceal their actual social responsibility performance through text manipulation.

3. Data and Methodology

3.1. Research Design

In order to conduct interpretable CSR quality assessment based on CSR reports, this study adopted the statistical method proposed by [12], namely multinomial inverse regression (MNIR), facilitating text training and the construction of a CSR dictionary. MNIR is a statistical technique grounded in word frequency and word distribution, where the frequency of a word’s occurrence in a text adheres to a multinomial distribution. Due to the extensive number of words in documents, conducting forward regression may result in problems such as collinearity and overfitting. Therefore, MNIR is a viable option.
The main objective of this study is to identify the words that affect corporate CSR rating scores and to establish a corresponding CSR dictionary that facilitates the effective measurement of the CSR disclosure level in the annual reports of Chinese listed companies. Based on the linguistic structure of the corpus, this study correlates the variance in the social responsibility scores of CSR documents with the frequency distribution of the words in each document. A CSR-level label is assigned to each word, so as to identify the words that most significantly influence the CSR rating score.
This study selected the “S score” (the score pertaining to the “social” topic) from the corporate ESG score developed by the China Research Data Service Services (CNRDS) as the CSR score for each document. Referring to the MNIR model, this study quantified the influence of each word on the document’s CSR score, and ultimately created a CSR dictionary by analyzing words with high contribution scores and their corresponding scores.
According to the MNIR model in [12], this study first matched the corresponding CSR score S i of each document D i . The CSR score S i of each document D i served as the label for MNIR training, where | D i | denotes the total number of words in the document. Thus, the word frequency modeling x i of each document D i adheres to a multinomial distribution:
x i ~ M N q i , D j
The j-th component q i , j of q i i s a s f o l l o w s :
q i , j = e x p η i , j j = 1 n e x p η i , j , η i , j = α j + μ i , j + S j ϕ j
According to the MNIR model, ϕ = ( ϕ 1 , ϕ 2 , , ϕ n ) is the sufficient reduction score of each word on the CSR score S i , and the sufficient statistics z i = ϕ · θ i can be obtained. z i comprehensively represents the influence of the word composition difference in document D i on the CSR score S i , where θ i = x i | D i | .
Then, through the parametric construction, we determined the function F · such that E S i = F z i , where F · generally uses a linear function or logistic function to calculate the influence of z i on the CSR score S i . In this study, we selected least square regression to determine the function F · . Therefore, the CSR score of each word w o r d s c o r e j is as follows:
w o r d s c o r e j = F ϕ i
Furthermore, according to the MNIR residual calculation, we differentiated between meaningful words and meaningless words. Specifically, words with a higher MNIR residual are more effective in CSR quality assessment; words with lower residual may be caused by wrong word segmentation or mixed words. After MNIR residual sorting, we selected the top N meaningful words to construct a CSR dictionary for Chinese listed companies. The higher the w o r d s c o r e , the higher the CSR score of the company as indicated by the text; that is, the more frequently words with high scores appear in the text, the greater the CSR performance of the company. To the contrary, if the w o r d s c o r e is negative, it means that the frequent occurrence of the word is associated with a lower CSR score, suggesting that these words may reflect poor social responsibility performance of the company.

3.2. Construction of CSR Dictionary

This study collected 14,450 CSR reports in PDF format disclosed by Chinese listed companies from 2006 to 2023. After excluding documents that were less than 2 KB in size and the unrelated revision and review documents, 11,781 CSR reports of 1951 listed companies were finally obtained. We used the jieba package for word segmentation and obtained texts with an average length of 146.42 million words per piece. This study extracted the 500 most frequent words as a proxy for the original text due to the fact that many words in the text had low informational content. We acquired 11,781 text samples, each including 500 words, and we used 48,681 unique words as text samples for analysis.
Based on the MNIR model, we calculated the scores of 48,681 words, then eliminated all personal names, geographical locations, institutional names, and both ordinal and cardinal numbers to ensure the dictionary remained highly related to CSR. Following the research methodology in [13], we selected the 300 words with the highest and lowest scores to construct a positive CSR dictionary and a negative CSR dictionary, respectively. Positive words imply higher CSR scores in the text, indicating excellent social responsibility performed by the company. Conversely, negative words denote lower CSR scores with poor social responsibility performance. Ultimately, this study developed a CSR dictionary for Chinese listed companies that comprises 600 Chinese words, including 300 positive CSR words and 300 negative CSR words. Appendix A presents detailed information on the dictionary and corresponding word scores.
In the positive CSR dictionary, the top 10 words are “electrical”, “high-speed”, “steel”, “software”, “wind power”, “medicine”, “issuer”, “poverty alleviation”, “overcome difficulties”, and “retail”. Among them, “electrical”, “high-speed”, “steel”, “software”, “wind power”, “medicine”, and “retail” are industry-related words, basically covering the seven strategic emerging industries identified by the State Council in China. “Issuer” is a functional word related to corporate management. “Poverty alleviation” and “overcome difficulties” reflect the core values advocated for in corporate culture development. In addition, the positive words also include “well-being”, “responsibility”, “farmers”, “intelligence”, “rescue”, “unity”, “countryside”, “anti-corruption”, “dual carbon”, and others, which not only reflect the core values of Chinese socialism prosperity but also reflect the friendly interaction between companies and the community environment, consistent with [62].
In the negative CSR dictionary, the 10 words with the lowest scores are “vaccine”, “disaster area”, “electrical appliances”, “earthquake”, “medicinal materials”, “climate”, “gold”, “compression”, “data security”, and “pharmaceutical industry”. Among them, “electrical appliances”, “medicinal materials”, and “pharmaceutical industry” are industry-related words. “Vaccine”, “disaster area”, “earthquake”, and “compression” show more obvious negative emotions. “Climate”, “gold”, and “data security” reflect higher risk and uncertainty, which is consistent with the findings in [63,64,65]. In addition, words such as “bribery”, “greenhouse”, “unemployment”, “money laundering”, “discrimination”, and “pollution” show significantly negative emotions and their negative impact on social responsibility.
Therefore, the CSR dictionary we constructed in this study can effectively distinguish the differences in the emotional tone of CSR levels. In order to verify the effectiveness of the CSR dictionary, we further conducted an empirical test between the CSR levels of Chinese listed companies and their market performance.

4. Results and Discussions

This section aims to measure the CSR level disclosed in the annual reports of Chinese listed companies and further explore the relationship between the CSR levels and the market performance of companies. The positive and negative CSR dictionaries constructed in Section 3 were used to quantify the text of annual reports through a weighted calculation method and calculate the CSR disclosure score of each report. The CSR disclosure scores are compared with existing ESG indicators to verify its effectiveness and representativeness.

4.1. Measurement of CSR Level Disclosed in Annual Report

The annual report of listed companies is one of the most important documents in information disclosure. Since the Shanghai Stock Exchange (Shanghai Stock Exchange: “Shanghai Stock Exchange Listed Company Information Disclosure Evaluation Measures (Trial)”) further clarified the necessity and completeness of ESG disclosure in 2013, listed companies have attached increasing importance to disclosure in the ESG field, especially the disclosure of corporate social responsibility (CSR). In order to explore the level of CSR reflected in the annual reports of listed companies, we selected 50,198 annual reports of listed companies spanning 22 years, from 2000 to 2021, covering a total of 4829 listed companies. This study used 600 CSR-related words, weighted according to the frequency of their appearance in the annual report documents, and finally obtained the CSR disclosure score for the annual report of each listed company. The specific calculation method is as follows:
S c o r e c s r i = j = 1 600 w o r d c o u n t i , j   *   w o r d c s r j
where S c o r e c s r i is the CSR disclosure score in the i-th annual report; w o r d c o u n t i , j denotes that the frequency of the j-th word from the CSR dictionary as recorded in the i-th annual report; w o r d c s r j is the CSR score of the j-th word in the dictionary.
After obtaining the CSR scores of each annual report, we averaged these scores and drew a line graph (see Figure 1). Figure 1 shows that the CSR levels disclosed in the annual reports of Chinese listed companies present a continuous upward trend. This result indicates that the social responsibility performance of listed companies in information disclosure has consistently strengthened year after year. Additionally, the overall improvement of corporate social responsibility awareness in Chinese companies is in line with the increasing attention being paid to socially responsible investment and sustainable development goals in recent years.
In addition, this study also observed the levels of other ESG indicators. Limited by the data release years, we selected the annual average values of the Huazheng ESG Index (2010–2021), the ESG index, and the S (Social) index proposed by the CNRDS (2007–2021) for analysis. We compared these ESG indicators with the annual average CSR levels calculated from the annual reports. It was found that the annual average CSR levels obtained from the annual reports accurately reflect the trend of the ESG index and the S (Social) index evaluated by the CNRDS. In addition, we selected the annual average curve of the Huazheng ESG index as a reference. The Huazheng ESG Index is derived by weighting the market capitalization of listed companies based on their market value and ESG-rating performance. Although the Huazheng ESG Index is consistent with the overall trend of the CSR disclosure levels measured, it primarily reflects the stock prices of companies with high ESG. This is because the majority of the companies selected by Huazheng have high ESG ratings, diverging from the CSR disclosure levels conceptualized in this study. Therefore, this study subsequently explores the correlation between CSR disclosure levels and market performance.

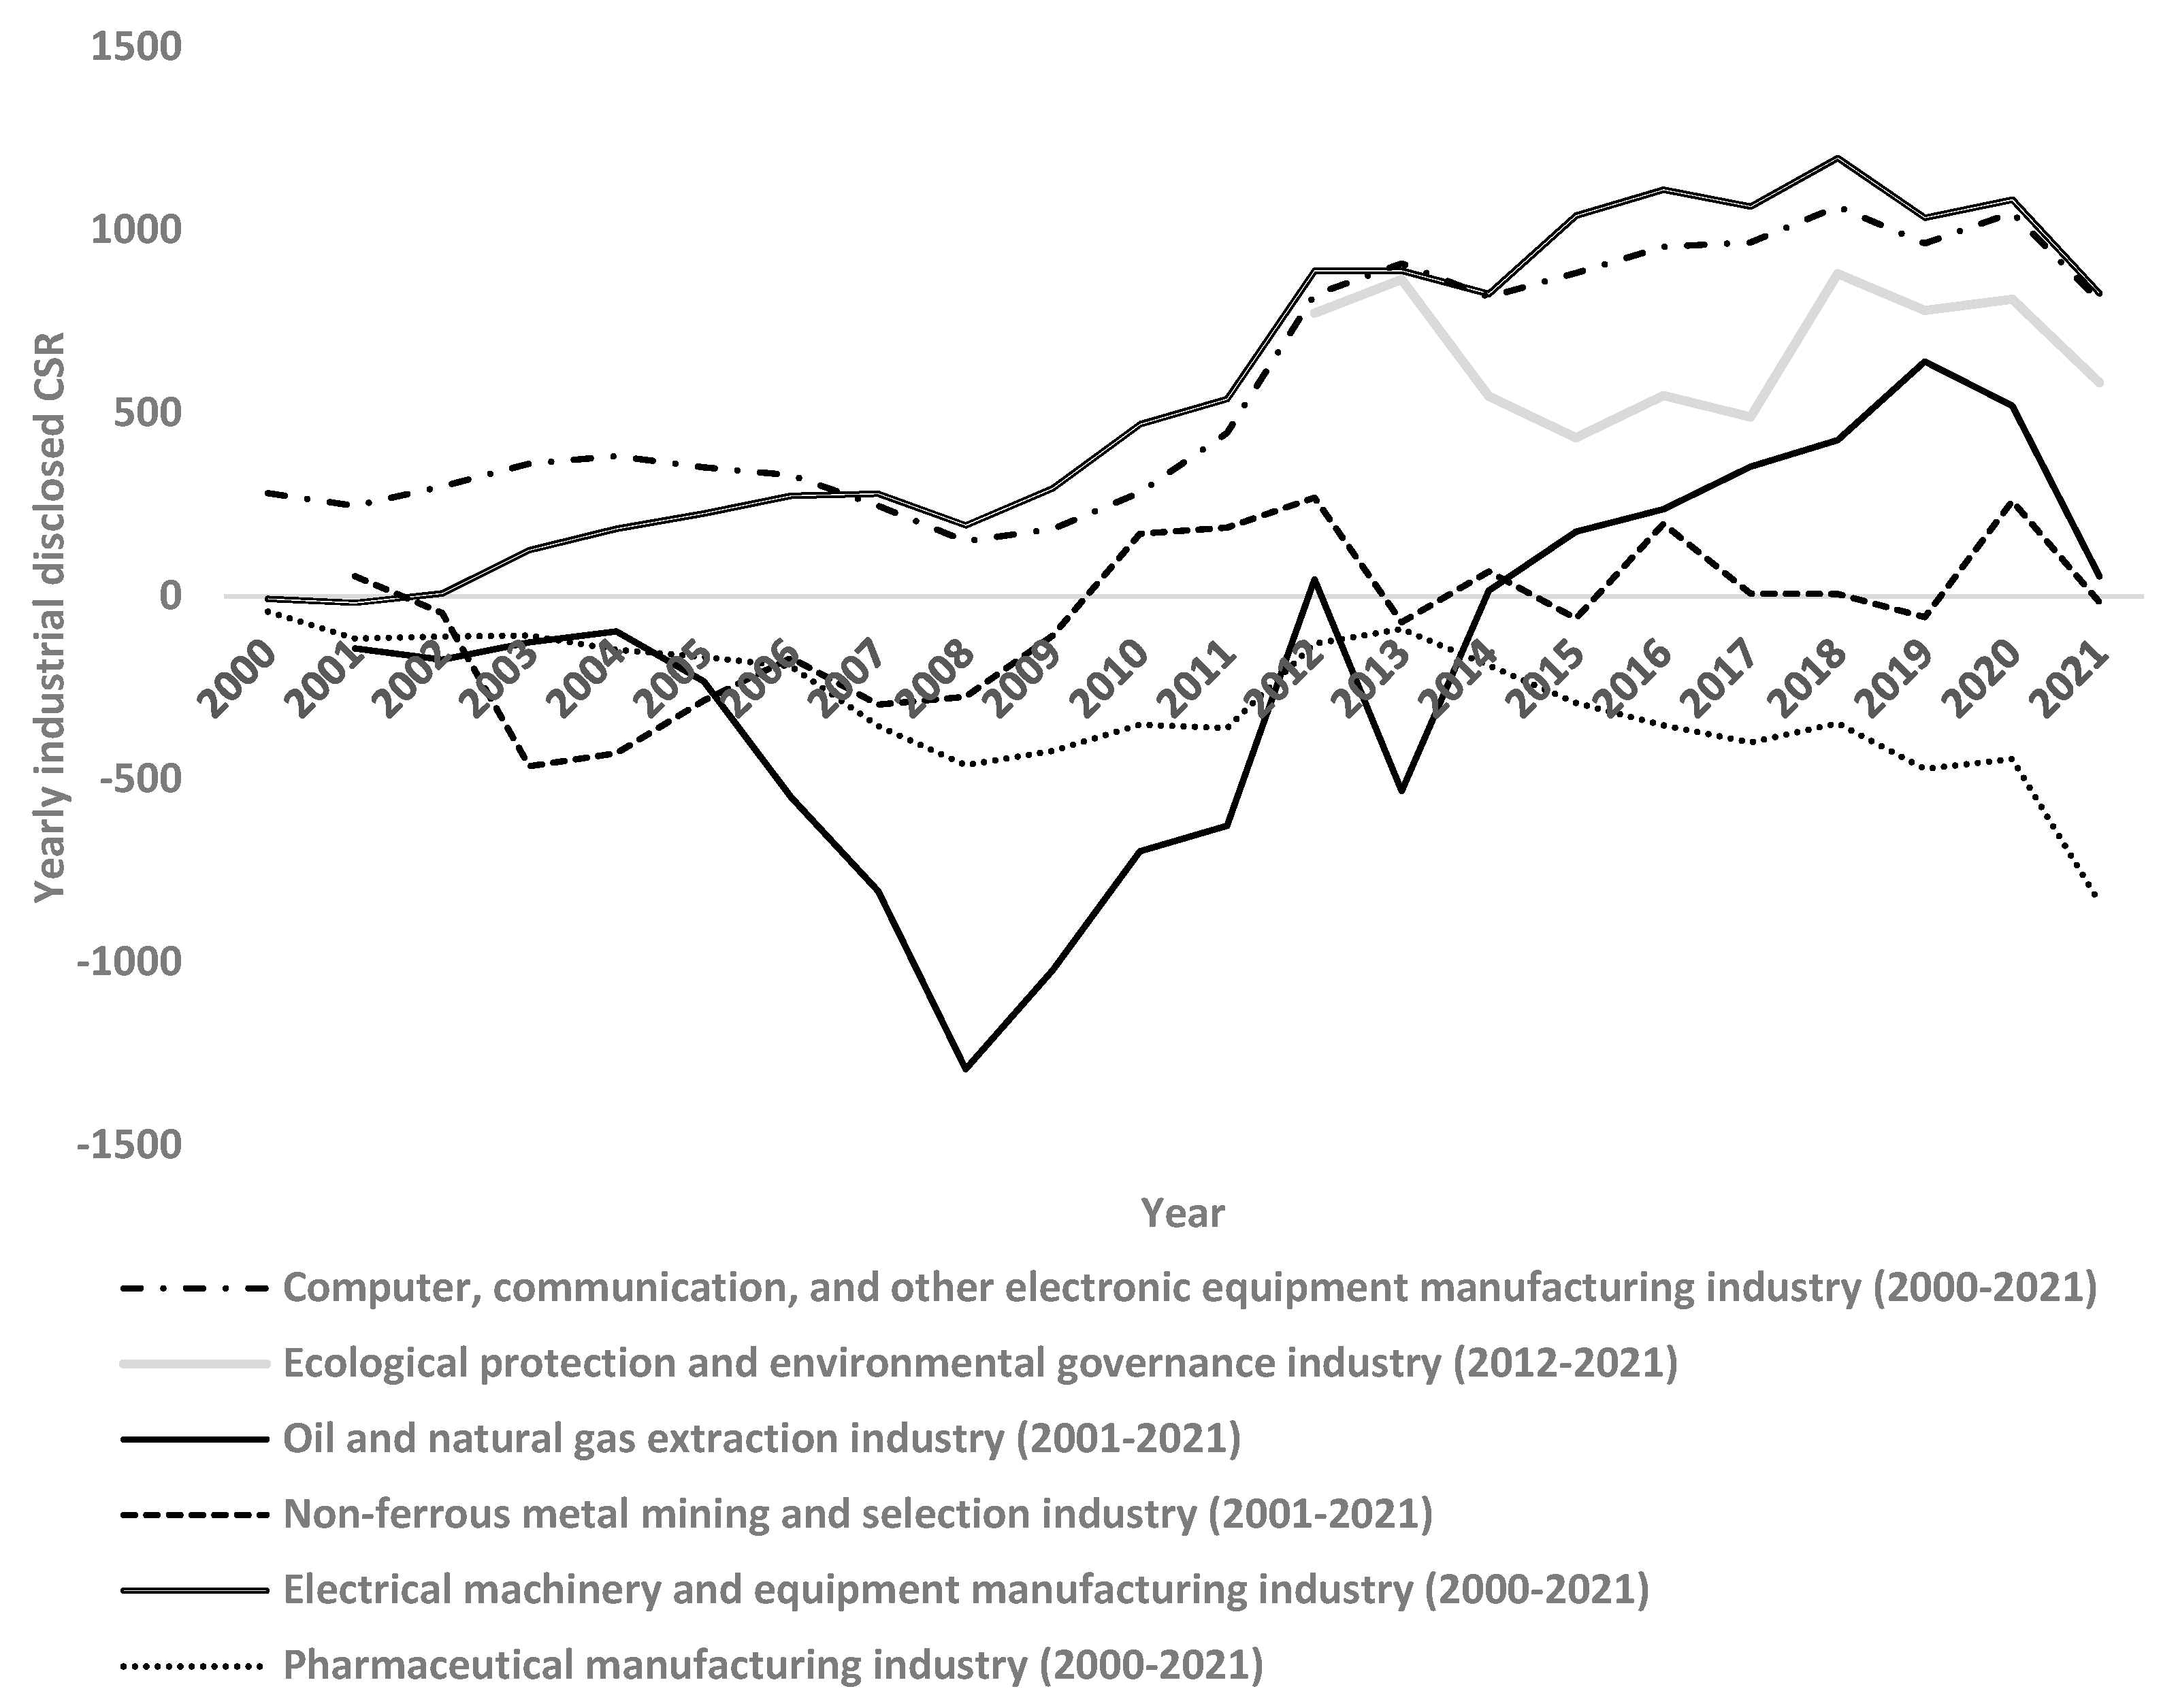
4.2. CSR Disclosure Levels in Different Industries

Furthermore, this study examines the CSR disclosure levels across six industries: computer communications and other electronic equipment manufacturing, ecological protection and environmental governance, oil and gas extraction, non-ferrous metal mining, electrical machinery and equipment manufacturing, and pharmaceutical manufacturing. The annual CSR disclosure levels of the above six industries are equal to the mean CSR disclosure levels of all companies within each industry for the year. Figure 2 illustrates the CSR disclosure levels of these six industries. It should be noted that the time spans for the CSR disclosure levels across the six industries evaluated in this study resulted in different numbers of listed companies.
As shown in Figure 2, the oil and gas extraction industry exhibited the lowest CSR disclosure level among the six industries in 2008. From 2006 to 2013, international crude oil prices exhibited significant volatility, leading to heightened business risks for enterprises and a corresponding decline in their social responsibility performance. This observation aligns with research on crude oil prices and ESG investment [66]. In 2008, the global financial crisis precipitated an economic recession and severe fluctuations in oil prices, subjecting oil and gas extraction companies to unprecedented financial pressure and a drastic decline in revenue. In response to these challenges, firms were compelled to significantly curtail non-core expenditures, prioritizing operational sustainability and debt repayment at the expense of long-term CSR investments. Concurrently, capital markets during the crisis exhibited a pronounced preference for short-term financial stability over social responsibility performance, prompting companies to reduce proactive CSR disclosures, while ESG issues were temporarily marginalized amid liquidity constraints. Moreover, the collapse in oil prices led to the suspension or cancelation of numerous exploration and production projects, thereby diminishing the scope of associated environmental and social impact assessments. Collectively, these factors culminated in the industry’s CSR disclosure levels reaching a historic low.
In addition to the oil and gas sector, the CSR disclosure levels in the pharmaceutical-manufacturing and non-ferrous-metal-smelting industries also performed poorly. We argue that the majority of these industries involve high-energy consumption and high-emission industries, such as energy and chemical industries. Their production emissions and other factors contradict the principles of environmental sustainability promoted by social responsibility. Consequently, these industries are closely associated with low CSR levels, resulting in the inclusion of words such as “medicinal materials” and “pharmaceutical industry” in the negative CSR dictionary.
The ecological protection and environmental governance industry aligns with the principles of ESG. Despite its later emergence, it has consistently excelled in corporate social responsibility. Furthermore, the rapid development of computer software and the electrical manufacturing industry has generated beneficial externalities for social activities. Therefore, words related to these industries are classified as CSR-positive words.
The CSR disclosure levels of the above six industries align with fundamental cognitive expectations and exhibit a strong correlation with industry characteristics. At the same time, the relevant words in these industries can be effectively identified using the MNIR method, demonstrating the scientific rigor and effectiveness of this method in the construction of CSR polarity dictionaries.

5. CSR Disclosure Level Manipulation and Corporate Performance

In this section, we explore the correlation between corporate operating performance and CSR disclosure levels, as well as the relationship between CSR disclosure levels and stock market return, based on the regression model and mediating effect test. Then, we explore the differences in the correlation between CSR disclosure levels and market performance across industries with different pollution levels. We conducted a heterogeneity analysis to examine if managers depend on CSR for their image management and to pursue personal excess compensation. Finally, we conducted a robustness test to provide further empirical evidence to reveal managers’ motivations for manipulating CSR disclosure to maintain their corporate image.

5.1. CSR Disclosure Levels and Corporate Business Performance

According to the trends illustrated in Section 4, we identified significant inter-group differences in the CSR disclosure levels across the six industries, with cyclical factors influencing index fluctuations. Therefore, we examined the correlation between CSR disclosure levels and corporate fundamentals, especially those belonging to different industries. We further explored how managerial self-interest, proxied by excess compensation (EC), mediates this relationship and whether the manipulation of CSR disclosure impacts market value.

5.1.1. Business Performance and CSR Disclosure Levels of Listed Companies

Prior literature suggests that CSR activities can be exploited by management to obscure poor performance or adverse conditions [44,67]. We argue that companies with a lower ROE will improve their CSR disclosure levels to mask poor operating performance. This study first conducted a correlation test between the CSR levels disclosed in the annual reports and the ROEs of listed companies in the current period. The baseline regression model is as follows:
C S R i , t = α 0 + α 1 R O E i , t + α 2 S i z e i , t + α 3 B M i , t + α 4 L E V i , t + α 5 S O E i , t + α 6 A g e i + α 7 S E O i , t + α 8 M A i , t + Y e a r + I n d u s t r y + ε i , t
where
  • C S R i , t : the CSR level disclosed in the annual report of the company i in year t;
  • R O E i , t : the return on common stockholders’ equity of the company i in year t;
  • S i z e i , t : the total assets of the company i at the end of the year t;
  • B M i , t : the book-to-market ratio of the company i in the current year t;
  • L E V i , t : the asset–liability ratio of the company i in year t;
  • S O E i , t : the dummy variable describing whether the company i is a state-owned enterprise; if the company i is a state-owned enterprise, S O E i , t is 1; otherwise, it is 0;
  • A g e i : the number of years since the company was listed;
  • S E O i , t : the dummy variable, which is 1 if the company i has refinancing activities, such as issuance or allotment, in the year t; otherwise, it is 0;
  • M A i , t : the dummy variable, which is 1 if the company i has merger and acquisition activities in the year t; otherwise, it is 0;
  • ε i , t : a random error term.
In addition, the regression model fixes the industry and year effects. The industry classification is based on the industry classification standard of the China Securities Regulatory Commission in 2012. A total of 34,538 valid samples were considered in the model.
Meanwhile, managers with performance-linked compensation may prioritize self-interest, leading to overinvestment in CSR to enhance their corporate image, thereby increasing agency costs and diminishing financial performance [68]. We chose managers’ excess compensation as a proxy variable for self-interest incentives to test the mediating effect.
M E D I A N i , t = β 0 + β 1 R O E i , t + β 2 S i z e i , t + β 3 B M i , t + β 4 L E V i , t + β 5 S O E i , t + β 6 A g e i + β 7 S E O i , t + β 8 M A i , t + Y e a r + I n d u s t r y + ε i , t
C S R i , t = γ 0 + γ 1 R O E i , t + γ M M E D I A N i , t + γ 2 S i z e i , t + γ 3 B M i , t + γ 4 L E V i , t + γ 5 S O E i , t + γ 6 A g e i + γ 7 S E O i , t + γ 8 M A i , t + Y e a r + I n d u s t r y + ε i , t
where M E D I A N i , t represents the excess compensation of managers, which is the difference between the managers’ compensation and the average compensation of managers within the same industry for that year. This variable serves as a mediating variable and is referred to as EC (excess compensation) in the following section. The other variables have been explained above. In the case where β 1 and γ M both exhibit significance, if γ 1 is significant, it indicates a partial mediating effect; conversely, if γ 1 is not significant, it indicates a complete mediating effect. The detailed mediating effect regression results are presented in Table 1.
We found that there was a complete mediating effect between the operating performance of the listed companies and the CSR levels disclosed in their annual reports. This effect is conveyed through the mediating variable “EC”. Consistent with the findings of [69,70], the companies with poor operating performance in the current period exhibited superior social responsibility, which is contrary to the common assumptions. At the same time, the managerial compensation of listed companies is frequently modest due to poor operating performance, while the corresponding CSR disclosure level is relatively high. It should be noted that managers are motivated to manipulate the CSR disclosure level in annual reports to secure high compensation, thereby cultivating a favorable image of the company as a “highly socially responsible organization” to conceal its unfavorable conditions.

5.1.2. Stock Market Performance and CSR Disclosure Levels of Listed Companies

Referring to [15,71], we believe that the annual report is a tool to communicate internal information of the company to the outside. The readers of the annual report are the target audience for managers to manipulate their CSR disclosure levels. CSR exhibited by listed companies may be “paid” by shareholders to obtain favorable stock market performance [15,71,72]. To test the validity of this mechanism, we further explored the correlation between the CSR disclosure levels of the listed companies and their stock market performance in the following year. The regression model is as follows:
S t o c k r e t u r n i , t = β 0 + β 1 C S R i , t 1 + β 2 R O E i , t + β 3 S i z e i , t + β 4 B M i , t + β 5 L E V i , t + β 6 S O E i , t + β 7 A g e i + β 8 S E O i , t + β 9 M A i , t + Y e a r + I n d u s t r y + ε i , t
where S t o c k _ r e t u r n i , t is the annual stock return rate of the company i in the year t. C S R i , t 1 is the CSR disclosure level of the company i in the previous year t − 1. The other variables have been explained above. The regression model fixed the industry and year effects. A total of 28,459 valid samples were considered in the model. The detailed results of the regression analysis are presented in Table 2.
After detecting the managers’ motivations to manipulate CSR disclosure, we explored whether the manipulative behaviors in CSR information disclosure can achieve the expected positive market effect. According to the results in Table 2, we found that there was a significant negative correlation between the CSR levels disclosed in the annual reports of listed companies and their stock market performance in the following year. This finding supports the theoretical view that CSR is “paid for” by shareholders [7,15,20,53]. According to the information asymmetry theory, it takes a certain amount of time for information to be reflected in the market price. The information about the current poor operation conditions took one period to permeate the market via alternative channels, resulting in investors’ negative expectations of poor operation performance being reflected in the stock market price after one period. This study contends that the manipulative behavior of managers has proven to be ineffective in achieving the anticipated outcomes. This result preliminarily confirms that the CSR level indicator developed in this study can explain stock market performance to some degree.

5.2. Heterogeneity Analysis

Based on the “List of Industry Classification Management for Environmental Audit of Listed Companies” issued by the Ministry of Environmental Protection,” (the “List of Industry Classification Management for Environmental Audits of Listed Companies” identifies 14 industries, including thermal power, steel, cement, electrolytic aluminum, coal, metallurgy, and building materials, as high-pollution industries, and other industries as low-pollution industries), this study categorized companies into high-pollution companies and low-pollution companies to analyze the differences in the correlations between their CSR disclosure levels and ROEs through grouped regression. The regression model is presented in Equation (5). The regression outcomes are presented in Table 3 below.
Table 3 illustrates that the ROE of low-pollution companies exhibits a strong negative correlation with the CSR disclosure level. In contrast, the ROE of high-pollution companies has a positive correlation with the CSR disclosure level. In high-pollution industries, companies with favorable operating conditions exhibit excellent performance in corporate social responsibility compared to those with unfavorable conditions. We believe that high-pollution companies with favorable operating conditions possess greater financial resources to support the development of corporate social responsibility initiatives, whereas those with unfavorable conditions lack adequate funds and struggle to allocate insufficient resources and management capabilities to CSR efforts. Moreover, in low-pollution industries, companies exhibiting lower ROE in the current period generally have better CSR disclosure levels, so managers may rely on CSR for image management to attract investors and obtain personal excess returns.

5.3. Robustness Test

To ensure the robustness of the empirical results, we conducted a robustness test on the above samples. We classified the samples based on “stock return below the industry average performance in the current period” and “stock return above the industry average performance in the current period”. The detailed regression results are presented in Table 4.
According to the empirical results, the CSR disclosure level had a significantly negative correlation with the following period’s stock returns in the companies with poor financial performance, while no significance was observed in the companies with excellent financial performance. In conjunction with the regression results presented in Table 1, it was observed that companies with poor financial performance tended to exhibit superior CSR disclosure levels in their annual reports, resulting in better market performance in the following period. This phenomenon aligns with the opportunistic behavior exhibited by managers and their motivation to manipulate disclosures [52,73]. In the case of poor financial performance, managers may be motivated to manipulate the CSR disclosure level, especially by promoting the display of social responsibility for image management 20,53, so as to obscure unfavorable financial performance [7] and strive for excess market returns. However, their manipulative behaviors fail to bring effective market returns to the company’s stock market in the next year. Therefore, the results of this study are robust.

6. Conclusions

This study used natural-language-processing technology and the MNIR method, combined with CSR rating indicators and the CSR reports of listed companies, to construct a Chinese CSR dictionary, which contains 300 positive words and 300 negative words. Based on this dictionary, we constructed the CSR indicators of the disclosure reports of Chinese listed companies, and then calculated the annual average CSR disclosure level index and industry CSR disclosure level index. This study found that the annual average CSR disclosure level showed a fluctuating upward trend, which indicates that the explanation of social responsibility activities in information disclosure by enterprises has increased year after year, and the overall level has continued to improve. In addition, the index constructed in this study is basically consistent with the trend of the existing ESG index. This proves that it has certain practical significance.
This study examined the mediating effect of self-interest motivation between corporate ROEs and CSR disclosure levels. The results show that managers are motivated to manipulate the level of CSR disclosure to maintain their corporate image when the company’s operating performance is poor. We believe that good corporate image is used to obtain high stock market returns in the next year. Therefore, we explored the correlation between the level of corporate CSR disclosure and the stock market return in the next year. However, a significant negative linear correlation existed between the CSR levels of the listed companies and their stock returns in the next year. It is worth noting that this phenomenon was particularly significant in companies with poor operating performance but not significant in companies with performance above the industry average. We believe that the information asymmetry mechanism can explain this result: when the operating performance is poor, managers may manage their corporate image through increasing the level of their CSR disclosure, thereby trying to improve their market performance. However, the information about the actual poor performance of the company in the next year is gradually diffused to the market through other channels, causing investors to develop negative market expectations and thus fail to obtain excess stock returns.
In addition, we conducted a classification heterogeneity test on the sample. We divided all the companies in the sample into two categories according to the pollution level of the industry—namely, companies in high- and low-pollution industries—and tested the correlation between their ROEs and CSR disclosure levels. We found that the companies in low-pollution industries were more likely to have engaged in CSR disclosure manipulation, while companies in high-pollution industries were more concerned about their actual CSR level. This phenomenon further illustrates that the CSR disclosure level index constructed in this study has practical significance and explanatory power. Finally, the empirical results of this study have proven to be robust.
In general, the MNIR dictionary constructed in this study effectively avoids the subjective bias of manual scoring, can directly quantify the explanatory and semantic contribution of each word in the CSR score, and overcomes the ambiguity problem of traditional topic models and deep learning methods in addressing lexical polarity. At the same time, the CSR disclosure level index constructed using this dictionary successfully identifies corporate image management behaviors based on managers’ self-interest motivations, and its empirical results have shown good robustness after multi-dimensional tests.
This study still has shortcomings in terms of exploring the specific impact mechanisms of each word on the level of CSR disclosure. In the future, these can be studied in depth from the perspectives of morphemes and semantic elements, and the impact of the information diffusion process on market reactions can be further examined. Based on the above conclusions, we recommend that regulators strengthen the monitoring of ESG- and CSR-related words in the information disclosure reports of listed companies. Investors and industry analysts should remain objective when interpreting CSR disclosure content, in order to avoid misleading interpretations caused by word selection. At the same time, promoting mandatory requirements for CSR disclosure will help to achieve fair and efficient information release and provide strong support for the construction of a more complete social responsibility assessment standard.

Author Contributions

Conceptualization, Y.L. (Yinong Liu) and H.C.; methodology, Y.L. (Yinong Liu) and Y.L. (Yanying Li); software, Y.L. (Yinong Liu); validation, Y.L. (Yinong Liu), Y.L. (Yanying Li), and H.C.; data curation, Y.L. (Yinong Liu); writing—original draft preparation, Y.L. (Yinong Liu) and Y.L. (Yanying Li); writing—review and editing, Y.L. (Yinong Liu), Y.L. (Yanying Li), and H.C.; visualization, Y.L. (Yinong Liu) and Y.L. (Yanying Li); supervision, H.C. All authors have read and agreed to the published version of the manuscript.

Funding

This research received no external funding.

Institutional Review Board Statement

Not applicable.

Informed Consent Statement

Not applicable.

Data Availability Statement

Data are contained within the article.

Conflicts of Interest

The authors declare no conflicts of interest.

Abbreviations

The following abbreviations are used in this manuscript:
ESGEnvironmental, Social, Governance
CSRCorporate Social Responsibility
MNIRMultinomial inverse regression
LDALatent Dirichlet Allocation

Appendix A

Table A1. Positive and negative CSR words in the CSR dictionary.
Chinese MeaningPositive WordsCSR ScoreChinese MeaningNegative WordsCSR Score
电气electric5.235439238疫苗vaccine−7.71509462
高速high speed4.318568245灾区disaster area−7.179618983
钢铁steel4.188377093电器electrical appliances−4.802384926
软件software4.031842191地震earthquake−4.4738809
风电wind power3.376950434药材medicinal materials−4.015034535
医学medicine3.190805375气候climate−3.886457005
发行人issuer3.074498056黄金gold−3.768210578
脱贫poverty alleviation3.014665613压缩compression−3.464121787
攻坚overcome difficulties3.012960829数据安全data security−3.340894219
零售retail2.981262624药业pharmaceutical industry−3.283041007
公路highway2.815950217气候变化climate change−3.240787006
养殖farming2.806286455纺织textile−3.196856468
深耕deep cultivation2.795730658通讯communication−3.038191147
精准precision2.786784954家电household appliances−2.899968794
期货futures2.779917025相关者related−2.767522357
智慧wisdom2.763927811公用public−2.669426796
信息技术information technology2.662733401本年this year−2.484712074
互联网internet2.605910892导致lead to−2.482753065
美好生活happy life2.549043123住宅residential−2.482325505
扶贫poverty alleviation2.47416871质量体系quality system−2.474943348
轨道track2.422596975规程regulations−2.362860274
担当responsibility2.403452417中医traditional Chinese medicine−2.337672092
美好happiness2.388326668完全completely−2.333481231
管理方management2.240577617节约型economical−2.302848075
微信WeChat2.237766376指数index−2.302681481
旅游travel2.184467708用车car used−2.246912144
农村rural2.139607259高产high yield−2.242926717
研究院research institute2.124480868医药medicine−2.23320935
混合型hybrid2.024685017消耗量consumption−2.220650247
电站power station2.012363127多样性diversity−2.181649171
程度degree2.005995303药品drug−2.166290704
集团股份group shares1.986376961本年度this year−2.10812581
核电nuclear power1.96536327余额balance−1.968834556
定点fixed point1.916647074合力together−1.965313924
村民villagers1.883146504救灾provide disaster relief−1.908607614
坚守persistence1.877955433产业园industrial park−1.899893345
物流logistics1.841692092中小企业small and medium enterprises−1.878214881
全力full strength1.836263167制订formulate−1.84898863
全文full text1.787563983污水处理wastewater treatment−1.825049104
集成integrated1.786948643理财financial management−1.814960992
农户farmers1.73209381技术改造technological transformation−1.799564969
密度density1.69604136负面negative−1.783265677
国民national1.668508337应对response−1.754587036
交付deliver1.660472001信贷credit−1.753646211
智能intelligent1.58711716调动transfer−1.729300953
智慧intelligence1.577688043捐款donate−1.727857134
交通transportation1.577470732电机motor−1.726174819
法定legal1.536588968供电power−1.686079805
定制customized1.525614599反应reaction−1.674140215
救援rescue1.518400963资源管理resource management−1.66270394
初心original intention1.5147728电网power grid−1.652139798
格局pattern1.506256902可再生renewable−1.63260363
装备equipment1.483119213租赁lease−1.62438176
贸易trading1.482684591手册manual−1.622114278
管理者manager1.479946536集装箱container−1.615096768
发行issue1.47400242小企业small enterprise−1.60364027
布局layout1.466328804经济效益economic benefits−1.602579394
备案record keeping1.464239793贿赂bribe−1.595138497
人才队伍talent team1.452235042变化change−1.594792147
机器machine1.424160186集装container−1.552403009
党建party building1.424049765飞行flight−1.548132863
智能化intelligent1.42349092煤矿coal mine−1.529039983
混合mix1.421668974年末end of the year−1.51947605
携手together1.41614985产业化industrialization−1.517209852
传真fax1.406796487运动会sports day−1.499248788
限制limit1.404025691酒店hotel−1.493249783
年报annual report1.395630486颗粒particles−1.485475375
驱动drive1.392494081装箱packing−1.482992508
食品food1.39211178银行bank−1.454710934
高端high-end1.378767854成绩score−1.448666348
管控control1.357585964产品质量product quality−1.444239237
招募recruit1.355006158决议resolution−1.441349353
董事长chairman1.341113336机电electromechanical−1.439061328
人才培养talent cultivation1.336835165友好friendly−1.438013934
成就achievement1.336359135对待treat−1.426744895
分公司branch company1.333035913温室greenhouse−1.415960231
共享shared1.316201207失业unemployment−1.413838158
整治remediation1.292765638报道report−1.361252413
引领leading1.261211558纳入inclusion−1.360754876
公司简介company profile1.259027855安全性security−1.349922064
玻璃glass1.252356052绿化greenery−1.347303739
巩固consolidation1.223588177复合complex−1.343295201
课程course1.222545597改进improve−1.338324651
走进walk In1.21809698贷款loan−1.337398592
股权equity1.217353564恢复recover−1.322558846
方法method1.210659292认识know−1.319240439
网络安全cybersecurity1.185770596社会各界all sectors of society−1.310332291
线上on-line1.185306121资管asset management−1.296790955
互助mutual aid1.18462562煤炭coal−1.293206767
水电hydropower1.179319635隐私privacy−1.285804709
线下offline1.178765283验证verify−1.279037251
前行forward1.177474256气体gas−1.278221291
民营private1.172704006收到receive−1.254791179
上线go online1.167276365生物biology−1.23726249
信息化informatization1.167190339人类human−1.216690483
美丽beauty1.16555521重要性importance−1.214642559
团结unity1.157273315药物drug−1.214220777
控股holdings1.156793755房地产real estate−1.212911453
生态ecology1.155717471上升rise−1.203963502
党员party member1.152104073灾害disaster−1.198699567
商品commodity1.137818037空调air conditioner−1.197820051
机械mechanical1.130983171审查review−1.195228368
突发Breakout1.12525412工伤work Injury−1.194543052
生日birthday1.119790528污泥sludge−1.193695314
公司党委company party committee1.119213065石油oil−1.193252988
说明会information session1.105299058潜在potential−1.192066283
照明illumination1.091045764老年elderly−1.177011474
特种special1.088996877污水sewage−1.165900041
动力power1.087753357物料materials−1.159721923
科创science and technology innovation1.078991901重组reorganization−1.159104657
民生people’s livelihood1.078636885毕业生graduate−1.152107048
大赛competition1.070134469同业the same business−1.144695682
便捷convenient1.065754865容量capacity−1.13984069
在线online1.060800044循环cycle−1.138923618
持有人owner1.060330434生存survive−1.135677755
地址address1.060316632次数frequency−1.12788152
最新up to date1.050588672出行travel−1.124480618
关键技术key technologies1.044356306护工nursing−1.123064083
联盟alliance1.038737996努力实现strive to achieve−1.112416804
实时real time1.033397023商业道德business ethics−1.111870477
梦想dream1.028255386机遇opportunity−1.111436176

References

  1. Godfrey, P.C.; Hatch, N.W. Researching Corporate Social Responsibility: An Agenda for the 21st Century. J. Bus. Ethics 2007, 70, 87–98. [Google Scholar] [CrossRef]
  2. Berg, F.; Koelbel, J.F.; Pavlova, A.; Rigobon, R. ESG Confusion and Stock Returns: Tackling the Problem of Noise; National Bureau of Economic Research Working Paper Series; National Bureau of Economic Research: Cambridge, MA, USA, 2022; p. 30562. [Google Scholar] [CrossRef]
  3. Xu, N.; Chen, J.; Zhou, F.; Dong, Q.; He, Z. Corporate ESG and Resilience of Stock Prices in the Context of the COVID-19 Pandemic in China. Pac. Basin Financ. J. 2023, 79, 102040. [Google Scholar] [CrossRef]
  4. Michelon, G.; Pilonato, S.; Ricceri, F. CSR Reporting Practices and the Quality of Disclosure: An Empirical Analysis. Crit. Perspect. Account. 2015, 33, 59–78. [Google Scholar] [CrossRef]
  5. Tsang, A.; Frost, T.; Cao, H. Environmental, Social, and Governance (ESG) Disclosure: A Literature Review. Br. Account. Rev. 2023, 55, 101149. [Google Scholar] [CrossRef]
  6. Bhatia, A.; Makkar, B. CSR Disclosure in Developing and Developed Countries: A Comparative Study. J. Glob. Responsib. 2020, 11, 1–26. [Google Scholar] [CrossRef]
  7. Li, F. Annual Report Readability, Current Earnings, and Earnings Persistence. J. Account. Econ. 2008, 45, 221–247. [Google Scholar] [CrossRef]
  8. Goldstein, I.; Kopytov, A.; Shen, L.; Xiang, H. On ESG Investing: Heterogeneous Preferences, Information, and Asset Prices; National Bureau of Economic Research Working Paper Series; National Bureau of Economic Research: Cambridge, MA, USA, 2022; p. 29839. [Google Scholar] [CrossRef]
  9. Han, S.; Liu, Z.; Deng, Z.; Gupta, S.; Mikalef, P. Exploring the Effect of Digital CSR Communication on Firm Performance: A Deep Learning Approach. Decis. Support Syst. 2024, 176, 114047. [Google Scholar] [CrossRef]
  10. Kang, H.; Kim, J. Analyzing and Visualizing Text Information in Corporate Sustainability Reports Using Natural Language Processing Methods. Appl. Sci. 2022, 12, 5614. [Google Scholar] [CrossRef]
  11. Zhou, B.; Zhang, C. When Green Finance Meets Banking Competition: Evidence from Hard-to-Abate Enterprises of China. Pac. Basin Financ. J. 2023, 78, 101954. [Google Scholar] [CrossRef]
  12. Taddy, M. Multinomial Inverse Regression for Text Analysis. J. Am. Stat. Assoc. 2013, 108, 755–770. [Google Scholar] [CrossRef]
  13. García, D.; Hu, X.; Rohrer, M. The Colour of Finance Words. J. Financ. Econ. 2023, 147, 525–549. [Google Scholar] [CrossRef]
  14. Bilokha, A.; Cheng, M.; Fu, M.; Hasan, I. Understanding CSR Champions: A Machine Learning Approach. Ann. Oper. Res. 2024, 1–14. [Google Scholar] [CrossRef]
  15. Becchetti, L.; Ciciretti, R. Corporate Social Responsibility and Stock Market Performance. Appl. Financ. Econ. 2009, 19, 1283–1293. [Google Scholar] [CrossRef]
  16. Chen, S.; Han, X.; Zhang, Z.; Zhao, X. ESG Investment in China: Doing Well by Doing Good. Pac. Basin Financ. J. 2023, 77, 101907. [Google Scholar] [CrossRef]
  17. Gorovaia, N.; Makrominas, M. Identifying Greenwashing in Corporate-social Responsibility Reports Using Natural-language Processing. Eur. Financ. Manag. 2024, 31, 427–462. [Google Scholar] [CrossRef]
  18. Li, T.-T.; Wang, K.; Sueyoshi, T.; Wang, D.D. ESG: Research Progress and Future Prospects. Sustainability 2021, 13, 11663. [Google Scholar] [CrossRef]
  19. Fu, R.; Tang, Y.; Chen, G. Chief Sustainability Officers and Corporate Social (Ir) Responsibility. Strateg. Manag. J. 2020, 41, 656–680. [Google Scholar] [CrossRef]
  20. Mashayekhi, B.; Hasanzadeh, S.; Samavat, M.; Nazari, S. Corporate Social Responsibility Disclosure and Management Opportunism: The Role Moderating of Corporate Governance. Account. Audit. Rev. 2023, 30, 560–589. [Google Scholar]
  21. Kotsantonis, S.; Pinney, C.; Serafeim, G. ESG Integration in Investment Management: Myths and Realities. J. Appl. Corp. Financ. 2016, 28, 10–16. [Google Scholar] [CrossRef]
  22. Dhaliwal, D.S.; Li, O.Z.; Tsang, A.; Yang, Y.G. Voluntary Nonfinancial Disclosure and the Cost of Equity Capital: The Initiation of Corporate Social Responsibility Reporting. Account. Rev. 2011, 86, 59–100. [Google Scholar] [CrossRef]
  23. Clark, G.L.; Feiner, A.; Viehs, M. From the Stockholder to the Stakeholder: How Sustainability Can Drive Financial Outperformance; SSRN: Rochester, NY, USA, 2015. [Google Scholar]
  24. Fatemi, A.; Glaum, M.; Kaiser, S. ESG Performance and Firm Value: The Moderating Role of Disclosure. Glob. Financ. J. 2018, 38, 45–64. [Google Scholar] [CrossRef]
  25. Xu, D.; Liu, Y. The Impact of Environmental Information Disclosure in the “Carbon Trading Pilot” Project on the Financial Performance of Listed Enterprises in China. Sustainability 2024, 16, 8410. [Google Scholar] [CrossRef]
  26. Wu, L.; Liu, S.; Qi, L.; Lin, D. Mandatory Disclosure and Corporate ESG Performance: Evidence from China’s “Explanation for Nondisclosure” Requirement. Corp. Soc. Responsib. Environ. Manag. 2025, 32, 176–191. [Google Scholar] [CrossRef]
  27. Wang, X.; Elahi, E.; Khalid, Z. Do Green Finance Policies Foster Environmental, Social, and Governance Performance of Corporate? Int. J. Environ. Res. Public Health 2022, 19, 14920. [Google Scholar] [CrossRef]
  28. Xu, Y.; Zhu, N. The Effect of Environmental, Social, and Governance (Esg) Performance on Corporate Financial Performance in China: Based on the Perspective of Innovation and Financial Constraints. Sustainability 2024, 16, 3329. [Google Scholar] [CrossRef]
  29. Naseer, M.M.; Guo, Y.; Zhu, X. ESG Trade-off with Risk and Return in Chinese Energy Companies. Int. J. Energy Sect. Manag. 2024, 18, 1109–1126. [Google Scholar] [CrossRef]
  30. Shen, Y. The Impact of Environmental, Social, and Governance Factor on the Financial Performance of China’s Companies. Adv. Econ. Manag. Political Sci. 2024, 57, 129–137. [Google Scholar] [CrossRef]
  31. Wu, Y.; Zhang, K.; Xie, J. Bad Greenwashing, Good Greenwashing: Corporate Social Responsibility and Information Transparency. Manag. Sci. 2020, 66, 3095–3112. [Google Scholar] [CrossRef]
  32. Vollero, A.; Palazzo, M.; Siano, A.; Elving, W.J. Avoiding the Greenwashing Trap: Between CSR Communication and Stakeholder Engagement. Int. J. Innov. Sustain. Dev. 2016, 10, 120–140. [Google Scholar] [CrossRef]
  33. Halbritter, G.; Dorfleitner, G. The Wages of Social Responsibility—Where Are They? A Critical Review of ESG Investing. Rev. Financ. Econ. 2015, 26, 25–35. [Google Scholar] [CrossRef]
  34. Pagano, M.S.; Sinclair, G.; Yang, T. Understanding ESG ratings and ESG indexes. In Research Handbook of Finance and Sustainability; Edward Elgar Publishing: Cheltenham, UK, 2018; pp. 339–371. ISBN 1-78643-263-3. [Google Scholar]
  35. Kim, M.; Kim, S.; Kim, Y.; Moon, J. Analyzing the Financial Impact of ESG News Sentiment on ESG Finance Trends. In Proceedings of the 2024 International Conference on Platform Technology and Service (PlatCon), Jeju, Republic of Korea, 26–28 August 2024; IEEE: Piscataway, NJ, USA, 2024; pp. 95–100. [Google Scholar]
  36. Giannarakis, G. The Determinants Influencing the Extent of CSR Disclosure. Int. J. Law Manag. 2014, 56, 393–416. [Google Scholar] [CrossRef]
  37. Chan, M.C.; Watson, J.; Woodliff, D. Corporate Governance Quality and CSR Disclosures. J. Bus. Ethics 2014, 125, 59–73. [Google Scholar] [CrossRef]
  38. Fahad, P.; Rahman, P.M. Impact of Corporate Governance on CSR Disclosure. Int. J. Discl. Gov. 2020, 17, 155–167. [Google Scholar] [CrossRef]
  39. Zavarrone, E.; Forciniti, A. CSR & Sentiment Analysis: A New Customized Dictionary; Springer: Cham, Switzerland, 2023; pp. 466–479. [Google Scholar]
  40. Niveditha, R.; NS, N.K.; Parimi, M.R.; Raam, A.; Babu, S. Develop CSR Themes Using Text-Mining and Topic Modelling Techniques. In Proceedings of the 2020 IEEE International Conference on Cloud Computing in Emerging Markets (CCEM), Bengaluru, India, 6–7 November 2020; IEEE: Piscataway, NJ, USA, 2020; pp. 67–71. [Google Scholar]
  41. Chia, A.; Doyle, K.; Kern, M.L. Community Construals of CSR for Happiness: A Mixed-Method Study Using Natural Language. Soc. Bus. Rev. 2023, 18, 296–320. [Google Scholar] [CrossRef]
  42. Teoh, T.-T.; Heng, Q.K.; Chia, J.J.; Shie, J.M.; Liaw, S.W.; Yang, M.; Nguwi, Y.-Y. Machine Learning-Based Corporate Social Responsibility Prediction. In Proceedings of the 2019 IEEE International Conference on Cybernetics and Intelligent Systems (CIS) and IEEE Conference on Robotics, Automation and Mechatronics (RAM), Bangkok, Thailand, 18–20 November 2019; IEEE: Piscataway, NJ, USA, 2019; pp. 501–505. [Google Scholar]
  43. Huang, Z.; Liew, K.; Rahman, M. Employing Machine Learning to Deduce a Causal Link Between Corporate Social Responsibility and Financial Performance. Fluct. Noise Lett. 2023, 2440015. [Google Scholar] [CrossRef]
  44. Sandberg, M.; Holmlund, M. Impression Management Tactics in Sustainability Reporting. Soc. Responsib. J. 2015, 11, 677–689. [Google Scholar] [CrossRef]
  45. Hamza, S.; Jarboui, A. CSR or Social Impression Management? Tone Management in CSR Reports. J. Financ. Report. Account. 2021, 20, 599–617. [Google Scholar] [CrossRef]
  46. Pouryousof, A.; Nassirzadeh, F.; Askarany, D. Inconsistency in Managers’ Disclosure Tone: The Signalling Perspective. Risks 2023, 11, 205. [Google Scholar] [CrossRef]
  47. Luo, Y.; Zhou, L. Textual Tone in Corporate Financial Disclosures: A Survey of the Literature. Int. J. Discl. Gov. 2020, 17, 101–110. [Google Scholar] [CrossRef]
  48. Koh, K.; Li, H.; Tong, Y.H. Corporate Social Responsibility (CSR) Performance and Stakeholder Engagement: Evidence from the Quantity and Quality of CSR Disclosures. Corp. Soc. Responsib. Environ. Manag. 2023, 30, 504–517. [Google Scholar] [CrossRef]
  49. Doyle, J.T.; Magilke, M.J. The Timing of Earnings Announcements: An Examination of the Strategic Disclosure Hypothesis. Account. Rev. 2009, 84, 157–182. [Google Scholar] [CrossRef]
  50. Kanbaty, M.; Hellmann, A.; He, L. Infographics in Corporate Sustainability Reports: Providing Useful Information or Used for Impression Management? J. Behav. Exp. Financ. 2020, 26, 100309. [Google Scholar] [CrossRef]
  51. Nadeem, M. Board Gender Diversity and Managerial Obfuscation: Evidence from the Readability of Narrative Disclosure in 10-K Reports. J. Bus. Ethics 2022, 179, 153–177. [Google Scholar] [CrossRef]
  52. Leung, S.; Parker, L.; Courtis, J. Impression Management through Minimal Narrative Disclosure in Annual Reports. Br. Account. Rev. 2015, 47, 275–289. [Google Scholar] [CrossRef]
  53. Merkl-Davies, D.M.; Brennan, N.M. Discretionary Disclosure Strategies in Corporate Narratives: Incremental Information or Impression Management? J. Account. Lit. 2007, 27, 116–196. [Google Scholar]
  54. Jensen, M.C.; Meckling, W.H. The Nature of Man. J. Appl. Corp. Financ. 1994, 7, 4–19. [Google Scholar] [CrossRef]
  55. Yung, K.K. Value of Multinationality: Internalization, Managerial Self-interest, and Managerial Compensation. J. Bus. Financ. Account. 2002, 29, 55–75. [Google Scholar] [CrossRef]
  56. Muttakin, M.B.; Khan, A.; Azim, M.I. Corporate Social Responsibility Disclosures and Earnings Quality: Are They a Reflection of Managers’ Opportunistic Behavior? Manag. Audit. J. 2015, 30, 277–298. [Google Scholar] [CrossRef]
  57. García-Sánchez, I.-M.; Hussain, N.; Khan, S.A.; Martínez-Ferrero, J. Managerial Entrenchment, Corporate Social Responsibility, and Earnings Management. Corp. Soc. Responsib. Environ. Manag. 2020, 27, 1818–1833. [Google Scholar] [CrossRef]
  58. Bachmann, R.L.; Spiropoulos, H. CSR Restatements: Mischief or Mistake? J. Manag. Account. Res. 2023, 35, 21–50. [Google Scholar] [CrossRef]
  59. Clarkson, P.M.; Ponn, J.; Richardson, G.D.; Rudzicz, F.; Tsang, A.; Wang, J. A Textual Analysis of US Corporate Social Responsibility Reports. Abacus 2020, 56, 3–34. [Google Scholar] [CrossRef]
  60. Conrad, M.; Holtbrügge, D. Antecedents of Corporate Misconduct: A Linguistic Content Analysis of Decoupling Tendencies in Sustainability Reporting. Bus. Ethics Environ. Responsib. 2021, 30, 538–550. [Google Scholar] [CrossRef]
  61. Zheng, J.; Ng, K.C.; Zheng, R.; Tam, K.Y. The Effects of Sentiment Evolution in Financial Texts: A Word Embedding Approach. J. Manag. Inf. Syst. 2024, 41, 178–205. [Google Scholar] [CrossRef]
  62. Boadi, E.A.; He, Z.; Darko, D.F.; Abrokwah, E. Unlocking from Community Stakeholders, Corporate Social Responsibility (CSR) Projects for Effective Company–Community Relationship. Labor Hist. 2018, 59, 746–762. [Google Scholar] [CrossRef]
  63. Atsu, F.; Adams, S. Energy Consumption, Finance, and Climate Change: Does Policy Uncertainty Matter? Econ. Anal. Policy 2021, 70, 490–501. [Google Scholar] [CrossRef]
  64. Liang, Z.; Qamruzzaman, M. An Asymmetric Investigation of the Nexus between Economic Policy Uncertainty, Knowledge Spillover, Climate Change, and Green Economy: Evidence from BRIC Nations. Front. Environ. Sci. 2022, 9, 807424. [Google Scholar] [CrossRef]
  65. Benlemlih, M.; Yavaş, Ç.V. Economic Policy Uncertainty and Climate Change: Evidence from CO2 Emission. J. Bus. Ethics 2024, 191, 415–441. [Google Scholar] [CrossRef]
  66. Bandeira, G.L.; Trindade, D.N.; Sodario, M.; Ferronatto, G. Creating sustainable value: An ESG framework for the petroleum industry. In Proceedings of the Offshore Technology Conference Brasil, OTC, Rio de Janeiro, Brazil, 24–26 October 2023; p. D021S019R006. [Google Scholar]
  67. Hemingway, C.A.; Maclagan, P.W. Managers’ Personal Values as Drivers of Corporate Social Responsibility. J. Bus. Ethics 2004, 50, 33–44. [Google Scholar] [CrossRef]
  68. Healy, P.M.; Palepu, K.G. Information Asymmetry, Corporate Disclosure, and the Capital Markets: A Review of the Empirical Disclosure Literature. J. Account. Econ. 2001, 31, 405–440. [Google Scholar] [CrossRef]
  69. Buallay, A. Is Sustainability Reporting (ESG) Associated with Performance? Evidence from the European Banking Sector. Manag. Environ. Qual. Int. J. 2019, 30, 98–115. [Google Scholar] [CrossRef]
  70. Alareeni, B.A.; Hamdan, A. ESG Impact on Performance of US S&P 500-Listed Firms. Corp. Gov. 2020, 20, 1409–1428. [Google Scholar]
  71. Bhattacharyya, A.; Rahman, M.L. Mandatory CSR Expenditure and Stock Return. Meditari Account. Res. 2020, 28, 951–975. [Google Scholar] [CrossRef]
  72. Chen, T.; Dong, H.; Lin, C. Institutional Shareholders and Corporate Social Responsibility. J. Financ. Econ. 2020, 135, 483–504. [Google Scholar] [CrossRef]
  73. Williamson, O.E. Opportunism and Its Critics. Manag. Decis. Econ. 1993, 14, 97–107. [Google Scholar] [CrossRef]
Figure 1. Line chart of the average CSR levels disclosed in the annual reports of listed companies from 2000 to 2020, and other ESG indicators.
Sustainability 17 02528 g001
Figure 2. Annual CSR disclosure levels of six industries from 2000 to 2021.
Sustainability 17 02528 g002
Table 1. Empirical results of ROE and CSR disclosure levels.
(1)(2)(3)
CSRECCSR
ROE−0.004 **0.617 ***0.037
(−2.41)(111.21)(1.00)
EC −0.065 ***
(−3.30)
LEV0.081 ***−0.513 ***0.054 **
(3.45)(−145.14)(2.09)
BM−0.570 ***−0.004−0.112 ***
(−2.90)(−1.22)(−5.47)
SOE−0.020−0.215 ***−0.042 ***
(−1.54)(−114.79)(−2.78)
SEO−0.105 ***−0.006−0.097 ***
(−3.09)(−1.24)(−2.98)
MA0.088 ***−0.004 **0.082 ***
(7.14)(−2.02)(6.79)
Age−0.100 ***0.005 ***−0.099 ***
(−9.00)(5.12)(−8.72)
Size0.235 ***0.67 ***0.304 ***
(31.93)(647.61)(22.44)
Constant−0.049−1.39 ***−0.36 ***
(−0.64)(−71.99)(−2.69)
Year FETRUETRUETRUE
Industry FETRUETRUETRUE
Notes: t-values in parentheses, *** p < 0.01, ** p < 0.05, * p < 0.1.
Table 2. Empirical results of CSR levels and stock market performance.
S t o c k _ r e t u r n Coef.
CSR (t − 1)−0.110 ***
(−2.72)
ROE0.422 ***
(23.18)
LEV0.252 ***
(12.81)
BM−1.063 ***
(−60.71)
SOE−0.012 *
(−1.71)
SEO−0.021
(−0.73)
MA0.040 ***
(3.13)
Age−0.006 *
(−1.66)
Size0.106 ***
(22.06)
Constant0.631 ***
(14.21)
Year FEYes
Industry FEYes
Notes: t-values in parentheses, *** p < 0.01, ** p < 0.05, * p < 0.1.
Table 3. Empirical results of heterogeneity analysis.
CSR Disclosure Level
Model (1)Model (2)
ROE−0.151 ***0.13 *
(−2.69)(1.74)
LEV0.197 ***0.086
(9.59)(1.53)
BM−0.109 ***−0.254 ***
(−5.93)(−5.62)
SOE−0.013−0.101 ***
(−1.07)(−3.17)
SEO−0.093 ***−0.184 *
(−3.22)−1.82
MA0.077 ***0.109 ***
(7.02)(3.35)
Age−0.099 ***−0.08 ***
(−9.86)(−2.97)
Size0.264 ***0.214 ***
(36.20)(9.76)
Constant−0.034−0.377 ***
(−0.48)(−4.00)
Year FEYesYes
Industry FEYesYes
Notes: t-values in parentheses, *** p < 0.01, ** p < 0.05, * p < 0.1. Model (1) uses the ROE of low-pollution companies as the dependent variable to conduct empirical tests. Model (2) uses the ROE of high-pollution companies as the dependent variable to conduct empirical tests.
Table 4. Empirical results of robustness tests.
S t o c k _ r e t u r n
Model (1)Model (2)
CSR (t − 1)−0.031 ***0.000
(−3.82)(0.07)
ROE0.006 ***0.805 ***
(3.05)(13.92)
LEV−0.098 ***0.297 ***
(−2.75)(9.62)
BM−1.126 ***−1.073 ***
(−27.26)(−39.94)
SOE−0.005−0.005
(−0.30)(−0.48)
SEO−0.099−0.005
(−1.08)(−0.14)
MA0.0210.054 ***
(0.67)(3.12)
Age−0.001−0.008
(−0.20)(−1.54)
Size0.177 ***0.091 ***
(15.44)(13.38)
Constant0.790 ***0.640 ***
(7.65)(9.45)
Year FEYesYes
Industry FEYesYes
Notes: t-values in parentheses, *** p < 0.01, ** p < 0.05, * p < 0.1. Model (1) uses stock return below the industry average performance in the current period as the dependent variable to conduct empirical tests. Model (2) uses stock return above the industry average performance in the current period as the dependent variable to conduct empirical tests.
Disclaimer/Publisher’s Note: The statements, opinions and data contained in all publications are solely those of the individual author(s) and contributor(s) and not of MDPI and/or the editor(s). MDPI and/or the editor(s) disclaim responsibility for any injury to people or property resulting from any ideas, methods, instructions or products referred to in the content.

