Article

Coupling Coordination Analysis of Water, Energy, and Carbon Footprints for Wastewater Treatment Plants

1
School of Geography and Environment, Shandong Normal University, Jinan 250358, China
2
Antai College of Economics & Management, Shanghai Jiao Tong University, Shanghai 200240, China
3
School of International and Public Affairs, Shanghai Jiao Tong University, Shanghai 200240, China
4
School of Economics and Management, China University of Mining & Technology, Xuzhou 221116, China
*
Authors to whom correspondence should be addressed.
This author’s two institutions are co-first institutions.
Sustainability 2025, 17(6), 2594; https://doi.org/10.3390/su17062594
Submission received: 13 February 2025 / Revised: 10 March 2025 / Accepted: 13 March 2025 / Published: 15 March 2025

Abstract

:
It is urgent for the wastewater treatment sector to respond to global climate change. Although studies related to the water–energy–carbon (WEC) nexus have been widely conducted, the application of the coupling coordination indicator is still limited in the wastewater treatment sector. This study fills such a research gap by linking water footprint (WF), energy footprint (EF), and carbon footprint (CF) together and testing these indicators in 140 wastewater treatment plants (WWTPs) in Shandong province, China. Both the EF and CF of these WWTPs were calculated by conducting hybrid life cycle assessments, while WF was calculated by using a WF method. The results show that gray WF generated from 1 m3 of wastewater ranged from 9.58 to 12.90 m3, while EF generated from 1 m3 of wastewater ranged from 9.42 × 10⁻² to 0.22 kg oil eq and CF generated from 1 m3 of wastewater ranged from 0.58 to 1.27 kg CO2 eq. Also, the total WF, EF, and CF of these WWTPs in Shandong were 4.26 × 10¹⁰ m3, 5.32 × 10⁸ kg oil, and 3.35 × 10⁹ CO2 eq in 2021, respectively. Key factors contributing to the overall greenhouse gas (GHG) emissions were the on-site GHG emissions and off-site electricity-based GHG emissions. Meanwhile, total nitrogen was the dominant contributor to the gray WF. In addition, the coupling coordination indicators of WF, EF, and CF ranged from 0.7571 to 0.9293. Finally, this study proposed several policy recommendations to improve the overall sustainability of this wastewater treatment sector by considering local realities, including adopting multi-dimensional indicators, decarbonizing current electricity grids, promoting the utilization of renewable energy, and initiating various capacity building efforts.

1. Introduction

Wastewater treatment plants (WWTPs) play a crucial role in improving the quality of the water environment by removing contaminants from wastewater [1]. This is critical to the achievement of the United Nations’ Sustainable Development Goals (SDGs), especially SDG 6 (Clean Water and Sanitation) [2,3]. For instance, SDG 6.3 emphasizes the enhancement of water quality through the reduction in pollution, the improvement of treated wastewater proportions, and the promotion of recycling and reuse [4]. Consequently, more WWTPs should be established or upgraded globally to ensure the effective treatment of both domestic and industrial wastewater [2]. However, wastewater treatment is associated with greenhouse gas (GHG) emissions [5,6,7]. Specifically, the degradation of organic matter during wastewater treatment contributes to approximately 1.5% of the global GHG emissions [8] and accounts for 5% of the global non-carbon dioxide GHG emissions [9]. Wastewater treatment is also energy-intensive [10,11], accounting for 3% of the global electricity consumption [9]. Moreover, wastewater recycling is essential for addressing climate change and alleviating water stress [12]. In summary, challenges related to water depletion and contamination, climate change, and energy crisis have garnered significant global attention [13,14]. It is therefore essential to link energy, water, and carbon issues together within the wastewater treatment sector so that the harmonious development can be achieved.
Academically, water footprint (WF) is a widely recognized indicator for assessing the volume of freshwater consumed and polluted of a product or process [15,16], including blue WF, green WF, and gray WF. Several studies have investigated WF for wastewater treatment. For instance, Shao and Chen [17] evaluated both the direct and indirect water cost of a specific wastewater treatment process. Morera et al. [18] highlighted the beneficial role of WWTPs within the urban water cycle by comparing the WF of wastewater discharge with and without treatment. Similarly, Teodosiu et al. [19], Gu et al. [20], and Gómez-Llanos et al. [21,22] evaluated the operational efficiency and sustainability of WWTPs by using the gray WF indicator.
Life cycle assessment (LCA) is an effective method for environmental accounting, widely adopted for assessing carbon footprint (CF) and energy footprint (EF). According to ISO 14067 [23], CF is defined as the net GHG emissions of a process that can be calculated using the climate change category based on LCA. Currently, more research is being devoted to GHG emissions generated from the operational process of wastewater treatment because of high GHG emissions associated with such a process [11]. Studies have been conducted on GHG emissions of specific plants and at different scales [24,25]. For example, such studies have been conducted in individual countries, such as Nepal [25], Greece [5], and China [1,26]. Similarly, such studies have also been conducted at the city level, including Shenzhen [11], Shanghai [27], and Beijing [24]. In addition, several studies focus on the energy consumption of the operational process of WWTPs. For instance, Nguyen et al. [28] assessed the fossil fuel consumption of different wastewater treatment technologies using LCA. Wang et al. [29] compared the electricity intensities of WWTPs in various countries and found that the electricity intensities of WWTPs were higher in China than those in USA and Germany.
The coupling coordination model essential for describing the interaction between two or more systems has been widely applied in assessing the overall sustainability of different systems [30,31,32]. In this regard, water–carbon–energy nexus studies offer a systematic perspective that integrates these three perspectives. Unfortunately, few coupling coordination analyses have been conducted for WWTPs [33]. This study has only found one study in this regard [34], in which the operational performance of a WWTP was evaluated by using a coupling indicator integrating water, energy, and carbon footprints. In their analysis, Ni et al. [34] focused solely on electricity consumption in the EF analysis, while the EF embodied in auxiliary materials (e.g., chemicals and transportation) was not covered. In reality, GHG emissions, energy consumption, and effluent quality vary in different WWPTs because of numerous factors such as temperature, emission standards, operation efficiency, and others [34,35]. Such variations influence the WF, EF, and CF of WWTPs, leading to diverse relationships among these three elements. This means that site-specific data may not adequately reflect the environmental performance of WWTPs at the regional level.
In order to address these challenges, this study aims to evaluate the environmental footprints of 140 WWTPs in the Shandong province of China by a bottom-up hybrid LCA integrating on-site data and statistical data. A spatial distribution analysis of environmental footprints from WWTPs is also conducted so that location-specific solutions can be made. Moreover, coupling coordination indicators are used to further investigate the relations among WF, EF, and CF.

2. Methods and Data Sources

2.1. Environmental Footprint Evaluation

2.1.1. System Boundary

In this study, the functional unit for calculating environmental footprints generated from these WWTPs is defined as 1 m3 of treated wastewater. Prior research has predominantly focused on the operational stage, as it accounts for the majority of total energy consumption. Additionally, high-quality data for the upstream and downstream stages remain limited [11]. Therefore, this study assesses footprints from the operational phase of wastewater treatment. The system boundary is set by using a “gate to gate” approach, which means that the discharge and delivery of wastewater are not included. The inputs of wastewater treatment include necessary chemicals and energy inputs, as well as the delivery of these chemicals. The outputs of this system include various emissions to local water bodies and the atmosphere. Since it is difficult to obtain downstream data [11], the disposal of sludge is not included in the system boundary of this study.

2.1.2. Water Footprints

The gray WF indicator, defined as the volume of freshwater required to dilute pollutants to meet water quality standards [15], was used to evaluate the environmental burden of WWTPs in this study. Following the WF assessment manual reported in Hoekstra et al. [15], gray WF from wastewater treatment is calculated by using Equations (1) and (2).
W F g r e y ( P i ) = Q e × C ( P i ) C m a x ( P i ) C m a x ( P i ) C n a t ( P i )
W F g r e y = max [ W F g r e y ( P i ) ]
where WFgrey(Pi) and WFgrey represent the gray WF of pollutant i (m3/m3) and the gray WF of effluent (m3/m3), respectively. Qe is the effluent flow, with a functional unit of 1 m3 in this study. C(Pi), Cmax(Pi), and Cnat(Pi) are the concentration of pollutant i in the effluent (g/m3), the maximum acceptable concentration of pollutant i in the receiving waterbody (g/m3), and the natural background concentration of pollutant i in the receiving waterbody (g/m3), respectively.

2.1.3. Energy and Carbon Footprints

EF is an indicator for evaluating the demand for energy resources of one product or process [36]. The EF of each wastewater treatment shown in Equation (3) is evaluated by using the ReCiPe Midpoint (H) [37] method within the LCA framework.
E F = i = 1 n M i × E F i
where EF represents the total fossil fuel consumption during wastewater treatment (kg oil/m3). Mi represents the amount of input i used for wastewater treatment. EFi represents the consumption of fossil fuels of input i.
GHG emissions of these WWTPs include direct GHG emissions from the wastewater operational process (GHGdirect) and indirect GHG emissions associated with resource inputs for the operational process (GHGindirect). In particular, CO2 emissions generated from the operational process are not considered since such emissions are regarded as being of a biogenic origin [6]. The guideline [38] issued by the Ministry of Ecology and Environment of China is used to calculate direct GHG emissions of wastewater treatment, which is shown in Equations (4) and (5).
G H G d i r e c t = ( R C O D S G × ρ s ) × E F C H 4 ω C H 4 × G W P C H 4 + 44 28 × R T N × E F N 2 O × G W P N 2 O
E F C H 4 = B 0 × M C F
where GHGdirect represents GHG emission directly generated from wastewater treatment (CO2 eq/m3). RCOD and RTN are the removal of chemical oxygen demand (COD) and total nitrogen (TN) during wastewater treatment, respectively (t COD/m3 and t TN/m3). SG, ρs, and ω C H 4 represent the amount of dry sludge generated from wastewater treatment (t/m3), the amount of organic matter contained in dry sludge (t COD/t, set as 0.75 by referring to [39]), and the amount of methane (CH4) recovered at the wastewater treatment site (t CH4/m3), respectively. The recovery of CH4 is not considered and the value of ω C H 4 is set as 0. E F N 2 O is the emission factor of dinitrogen oxide (N2O), with a default value of 0.005 t N2O-N/t TN by referring to [6]. G W P C H 4 and G W P N 2 O are the global warming potential of CH4 (set as 34 [40,41]) and N2O (set as 298 [40,41]), respectively. E F C H 4 , B0, and MCF are the emission factor for CH4 (t CH4/t COD), the maximum CH4-producing capacity of organic matter (t CH4/t COD, with a default value of 0.25 by referring to [38]), and the methane correction factor (with a default value of 0.3 by referring to [10]).
For indirect off-site GHG emissions (GHGindirect) from these WWTPs shown in Equation (6), ReCiPe Midpoint (H) [37] is adopted for the environmental impact evaluation. The global warming potential values of CH4 and N2O in ReCiPe Midpoint (H) are 34 and 298, respectively, aligning with those used in the direct on-site GHG emission evaluation.
G H G i n d i r e c t = i = 1 n M i × E F G H G , i
where GHGindirect represents the indirect GHG emission generated from wastewater treatment (CO2 eq/m3). Mi represents the amount of input i used for wastewater treatment. EFGHG,i represents the GHG emission generated from input i.
A specific case study of one individual WWTP is usually insufficient for representing a regional inventory due to their different treatment capacities and electricity efficiencies [10]. In this study, a bottom-up approach combining a process-based LCA with statistical data based on Chen et al. [1,42] is performed to estimate the regional inventory of CF and EF from these WWTPs. Firstly, LCA studies on the wastewater treatment process of six WWTPs are performed to calculate the EF and CF of these WWTPs. Subsequently, statistical data of WWTPs are adopted to replace the identified key factors attributing to EF and CF. Then, the evaluation of both EF and CF is repeated until no new key factors are found. Finally, statistics on wastewater treatment are used to determine the EF and CF of WWTPs at the regional level. Further details on this method can be found in our previous studies [1,42].

2.2. Water–Energy–Carbon Coupling Indicator

In this study, the relationships between WF, EF, and CF are investigated using the coupling indicator and the coupling coordination indicator [14,43]. Specifically, the interaction strength can be measured by this coupling indicator and the positivity of the interaction can be measured by this coupling coordination indicator [43]. A higher coupling coordination indicator means a more harmonized and balanced development between the studied systems, whereas a lower value indicates substantial disparity and misalignment.
The coupling indicator of WF, EF, and CF is calculated by using Equations (7) and (8).
Y i = X i max ( X i )
where i is the category of the environmental footprint (that is, WF, EF, and CF). Xi and Yi represent the sequence of environmental footprint i and the dimensionless normalization of individual Xi.
C = f ( x ) g ( y ) h ( z ) 3 1 3 ( f ( x ) + g ( y ) + h ( z ) )
where C represents the coupling indicator for WF, EF, and CF. If the value of C is close to 0, the coupling degree is significantly weak and the investigated system is inclined towards disorder [44]. f(x), g(y), and h(z) represent the dimensionless normalization of WF, EF, and CF, respectively. These data sets are calculated by using Equation (7).
The coupling coordination indicator is an indicator measuring the comprehensive level of interactions of the water–energy–carbon (WEC) nexus. The coupling coordination indicator of WF, EF, and CF is calculated by using Equations (9) and (10).
D = C × T
T = α f ( x ) + β g ( y ) + γ h ( z )
where D and C represent the coupling coordination indicator and the coupling indicator, respectively. T is the comprehensive development indicator of WF, EF, and CF in the wastewater treatment system. α, β, and γ represent the weights of WF, EF, and CF, respectively. Based on the assumption that each subsystem is equally important to the sustainable development of the entire WWTP, α = γ = β = 1/3 is considered.

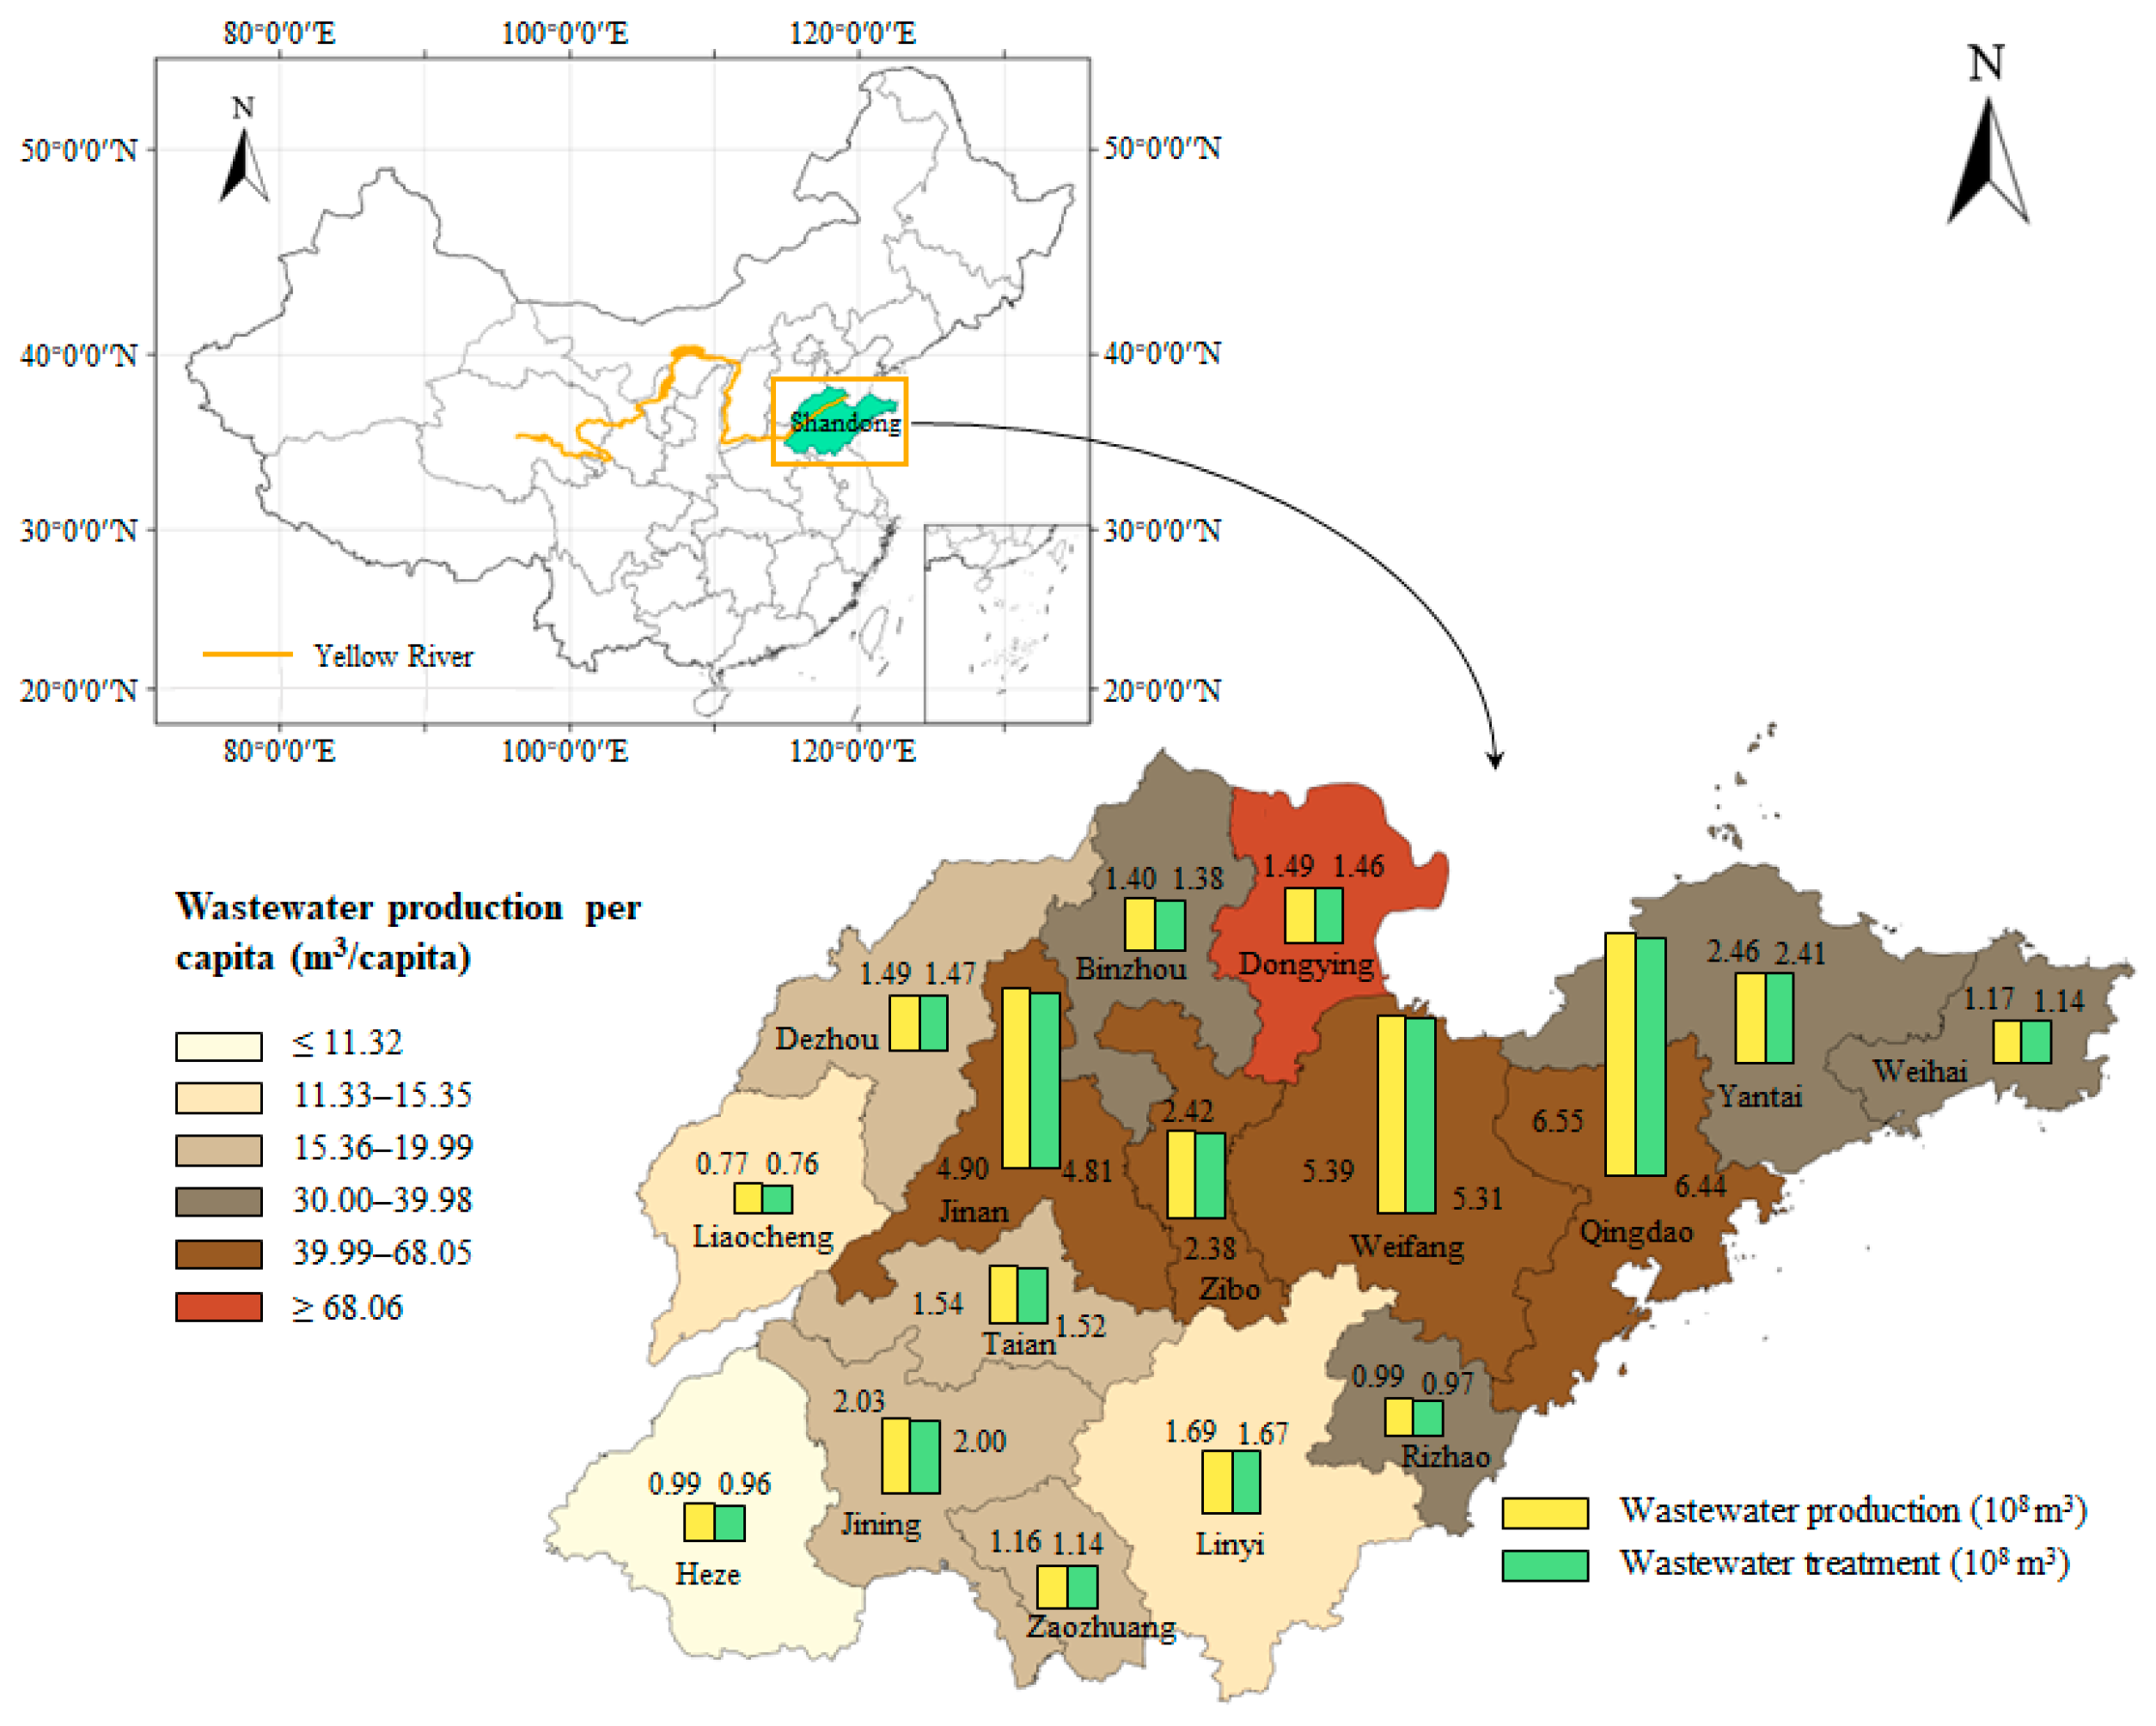
2.3. Life Cycle Inventory and Data Sources

Table 1 lists the life cycle inventories (LCIs) for the wastewater treatment of six WWTPs (abbreviated as P-1 to P-6), located in Weifang, Zaozhuang, and Taian in Shandong province. Annual monitoring data were collected to minimize uncertainty caused by factors such as temperature. The technology used for wastewater treatment in these selected plants is anaerobic/anoxic/oxic (A2O), which is commonly used in Shandong’s WWTPs. Detailed parameters for each WWTP are provided in Table 2.
In addition, the eco-invent database [46], which is widely applied for LCA, was used to obtain background data for environmental footprints analysis. Specially, the electricity of production mix in Shandong (ID number: EI3ARUNI000011519613720) was selected for this analysis.
Statistical data on wastewater discharge, electricity consumption, and direct emissions (e.g., COD and TN) of 140 plants were taken from the Urban Drainage Statistical Yearbooks [47] and China Urban-Rural Construction Statistical Yearbooks [48]. Table 3 presents the statistical data on the effluent concentrations and electricity consumption of these 140 WWTPs. Data on natural background concentrations and maximum acceptable concentrations for biochemical oxygen demand (BOD), COD, TN, total phosphorus (TP), and ammonia nitrogen were derived from the Ministry of Ecology and Environment [49], and more detailed data can be found in Table S1 of the Supplementary Information. Figure 1 illustrates the wastewater generation and treatment across different cities in Shandong in 2021.

3. Results

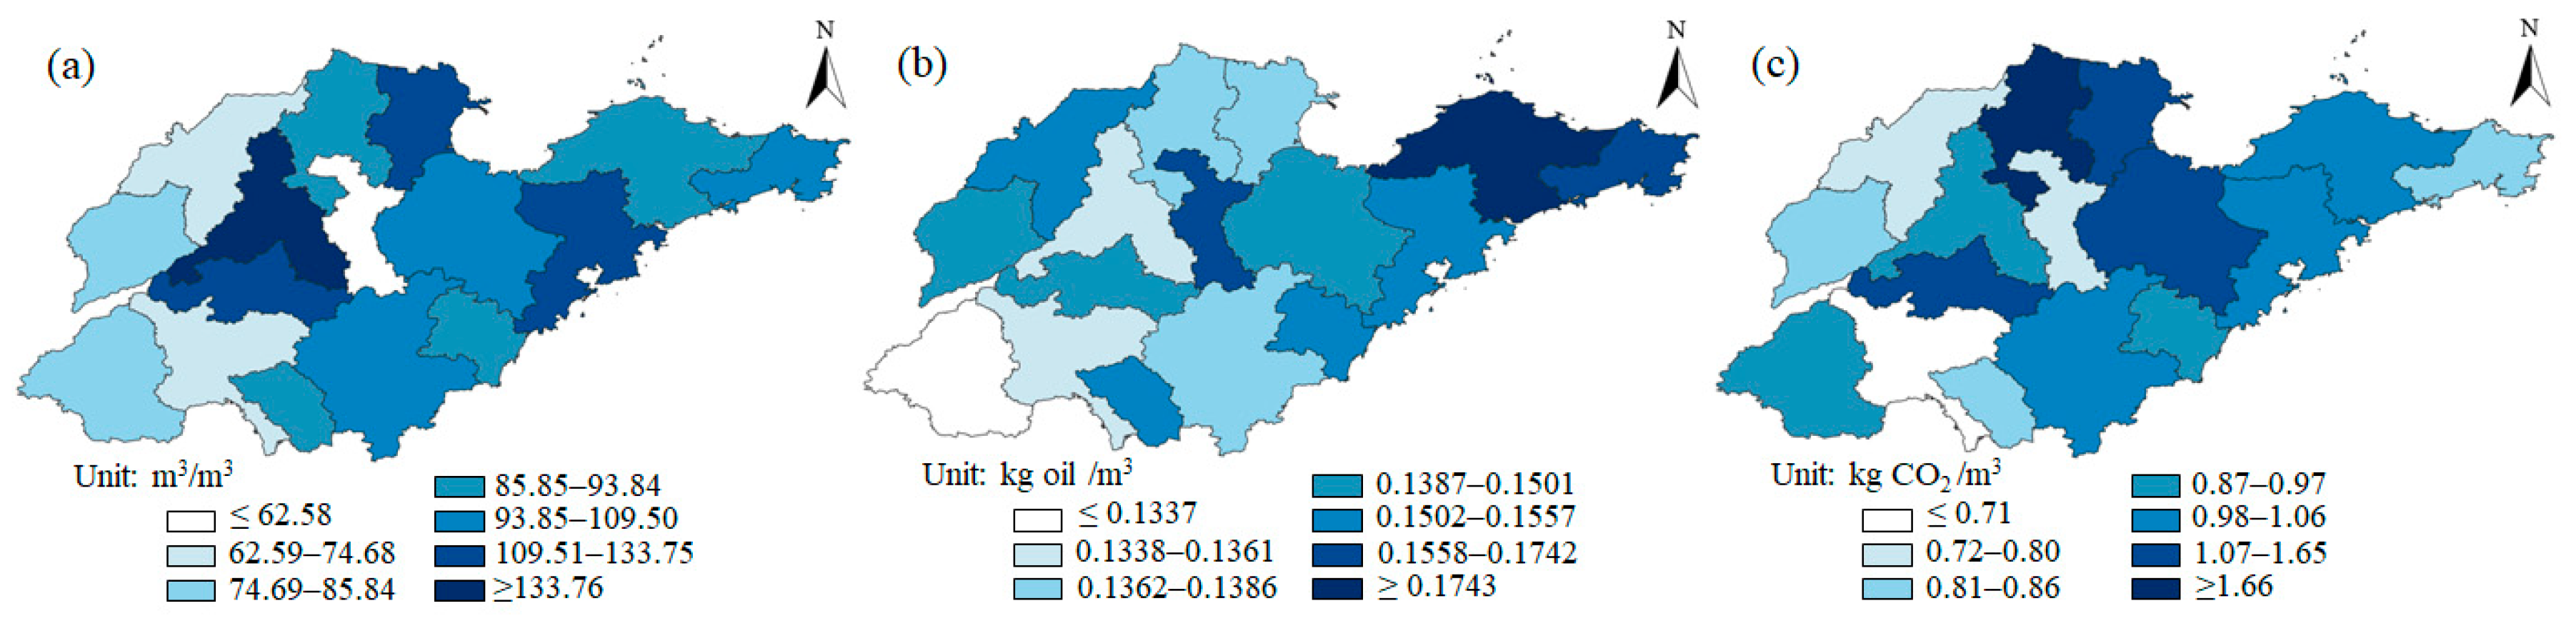
3.1. Environmental Footprints

Table 4 presents the values of WF, EF, and CF of the six WWTPs investigated in this study. These results show that gray WF generated from 1 m3 of wastewater treatment ranges from 9.58 to 12.90 m3, which is close to the results of Yapıcıoğlu [50] and Ansorge et al. [51]. In addition, EF generated from the six investigated WWTPs was 0.16, 9.42 × 10⁻², 0.13, 0.16, 0.20, and 0.22 kg oil/m3, respectively, values that are close to the results of two relevant studies [52,53]. In particular, the electricity consumed to treat 1 m3 of wastewater ranges from 0.33 to 0.48 kWh based on the annual monitoring data, which is within the wide range of 0.12 to 0.78 kWh/m3 reported in three previous studies [10,11,29]. In this study, CF in the six investigated plants was 0.93, 0.58, 0.93, 0.82, 1.02, and 1.27 kg CO2 eq/m3, respectively, values that are close to four previous studies ranging from 0.36 to 3.27 kg CO2 eq/m3 [10,35,54,55]. Such results indicate that different wastewater treatment plants consume different amounts of energy for their treatments and generate different amounts of GHG emissions. This means that it is necessary to improve energy efficiency so that the associated GHG emissions can be reduced. This also indicates that more studies should be conducted on such aspects so that more specific solutions can be found.
Table 4 also identifies the key processes that contribute to WF, EF, and CF generated from wastewater treatment, in which TN is the dominant contributor to the WF from WWTPs. This finding echoes that of Li et al. [56], who also found that TN was the key contributor to gray WF. In terms of CF, direct GHG emission (39.19%) was the dominant contributor for P-6, followed by electricity generation (38.36%) and polyacrylamide production (16.07%). For the other five WWTPs, electricity generation was the dominant contributor to CF, followed by direct GHG emissions. Also, sodium acetate made additional contributions for P-1, P-4 and P-5. In terms of EF, electricity generation was the dominant contributor across all six WWTPs. Sodium acetate production made additional contributions for P-1, P-4 and P-5, while methanol production and polyacrylamide production made additional contributions for P-3 and P-6. These variations are influenced by factors such as changes in carbon sources and chemicals used for flocculation.
The regional WF, EF, and CF of these WWTPs were subsequently evaluated by replacing the identified key factors with related regional statistical data collected from all 140 WWTPs. The results show that the average WF, EF, and CF of 1 m3 wastewater treated in Shandong were 11.89 m3, 0.15 kg oil, and 0.94 kg CO2 eq, respectively. With the amount of 3.58 billion m3 wastewater treated in 2021, the total WF, EF, and CF of wastewater treatment in Shandong were 4.26 × 10¹⁰ m3, 5.32 × 10⁸ kg oil, and 3.35 × 10⁹ CO2 eq, respectively.
The spatial distributions of these environmental footprints are illustrated in Figure 2, showing clear regional disparities. These disparities are induced by factors such as variations in pollutant concentrations in effluents, differences in TN and COD removal, and electricity usage efficiency. At the city level, the provincial capital city of Jinan (with nine plants, abbreviated as N = 9) had the highest WF per cubic meter (14.30 m3/m3), while Zibo (N = 5) had the lowest value (6.12 m3/m3). The main reason for such disparities is that Jinan had the highest average concentration of water contamination (12.44 g-TN/m3), while Zibo had the lowest average value (5.90 g-TN/m3). For EF generated from wastewater treatment at the city level, Yantai (N = 12) had the highest value (0.17 kg oil/m3), while Heze (N = 7) had the lowest value (0.13 kg oil/m3). The main reason is that Yantai had the highest average electricity consumption for wastewater treatment, while Heze had the lowest average electricity consumption. For CF generated from wastewater treatment at the city level, Binzhou (N = 10) had the highest value (1.67 kg CO2/m3), while Jining (N = 8) had the lowest value (0.71 kg CO2/m3). The main reason is that the average removal efficiency of TN in Binzhou’s WWTPs was higher than that in Jining. Finally, Qingdao (N = 11) had the highest total WF, EF, and CF (see Figure S1), while Liaocheng (N = 15) had the lowest environmental footprints. This contrast can be explained by the largest amount of wastewater treated in Qingdao and the lowest amount of wastewater treated in Liaocheng.

3.2. Water–Energy–Carbon Coupling

Water quality, energy consumption, and carbon emissions are closely interlinked in the operation of WWTPs. For instance, the energy required for wastewater treatment directly affects both water quality and carbon emissions. Consequently, it is necessary to investigate the interrelationships among these three footprints so that valuable insights can be gained to improve the overall wastewater treatment efficiency by coordinating the three dimensions simultaneously. Table 5 lists these coupling indicators. They are close to 1 in Shandong, indicating that there are strong correlations between these three dimensions. Interestingly, Zibo has the lowest value of the coupling coordination indicator (0.7571), while Binzhou has the highest value of the coupling coordination indicator (0.9293). Actually, both WF and CF values are lower in Zibo, but the value of EF is high. The results of the environmental footprints (Table 4) show that electricity consumption and direct GHG emissions are the dominant contributors to CF, implying that Zibo achieves water quality improvement at the expense of electricity consumption. The lack of coordination between WF, CF, and EF is attributed to the low value of the coupling coordination indicator in Zibo, indicating that Zibo should pay more attention to the coordination efforts of water quality, energy efficiency, and carbon reduction.
In order to explore the operational performance of WWTPs, various weights of WF, EF, and CF were considered. Three scenarios were made for simulations. These results are listed in Table S2, showing that the changes in the coupling coordination indicator of WEC exhibit regional variations. For instance, if only WF and CF were considered (Scenario 1), the coupling coordination indicator of WEC would increase in Dongying and Binzhou but would decrease in other cities. If only WF and EF were considered (Scenario 2), the coupling coordination indicator of WEC would decrease in Binzhou but would increase in other cities. If only EF and CF were considered (Scenario 3), the coupling coordination indicator of WEC would increase in Zibo, Yantai, Jining, Dezhou, Binzhou, and Heze but would decrease in other cities. These findings suggest that each city should implement tailored strategies based on their local reality to improve water quality, reduce carbon emission, and promote energy conservation.

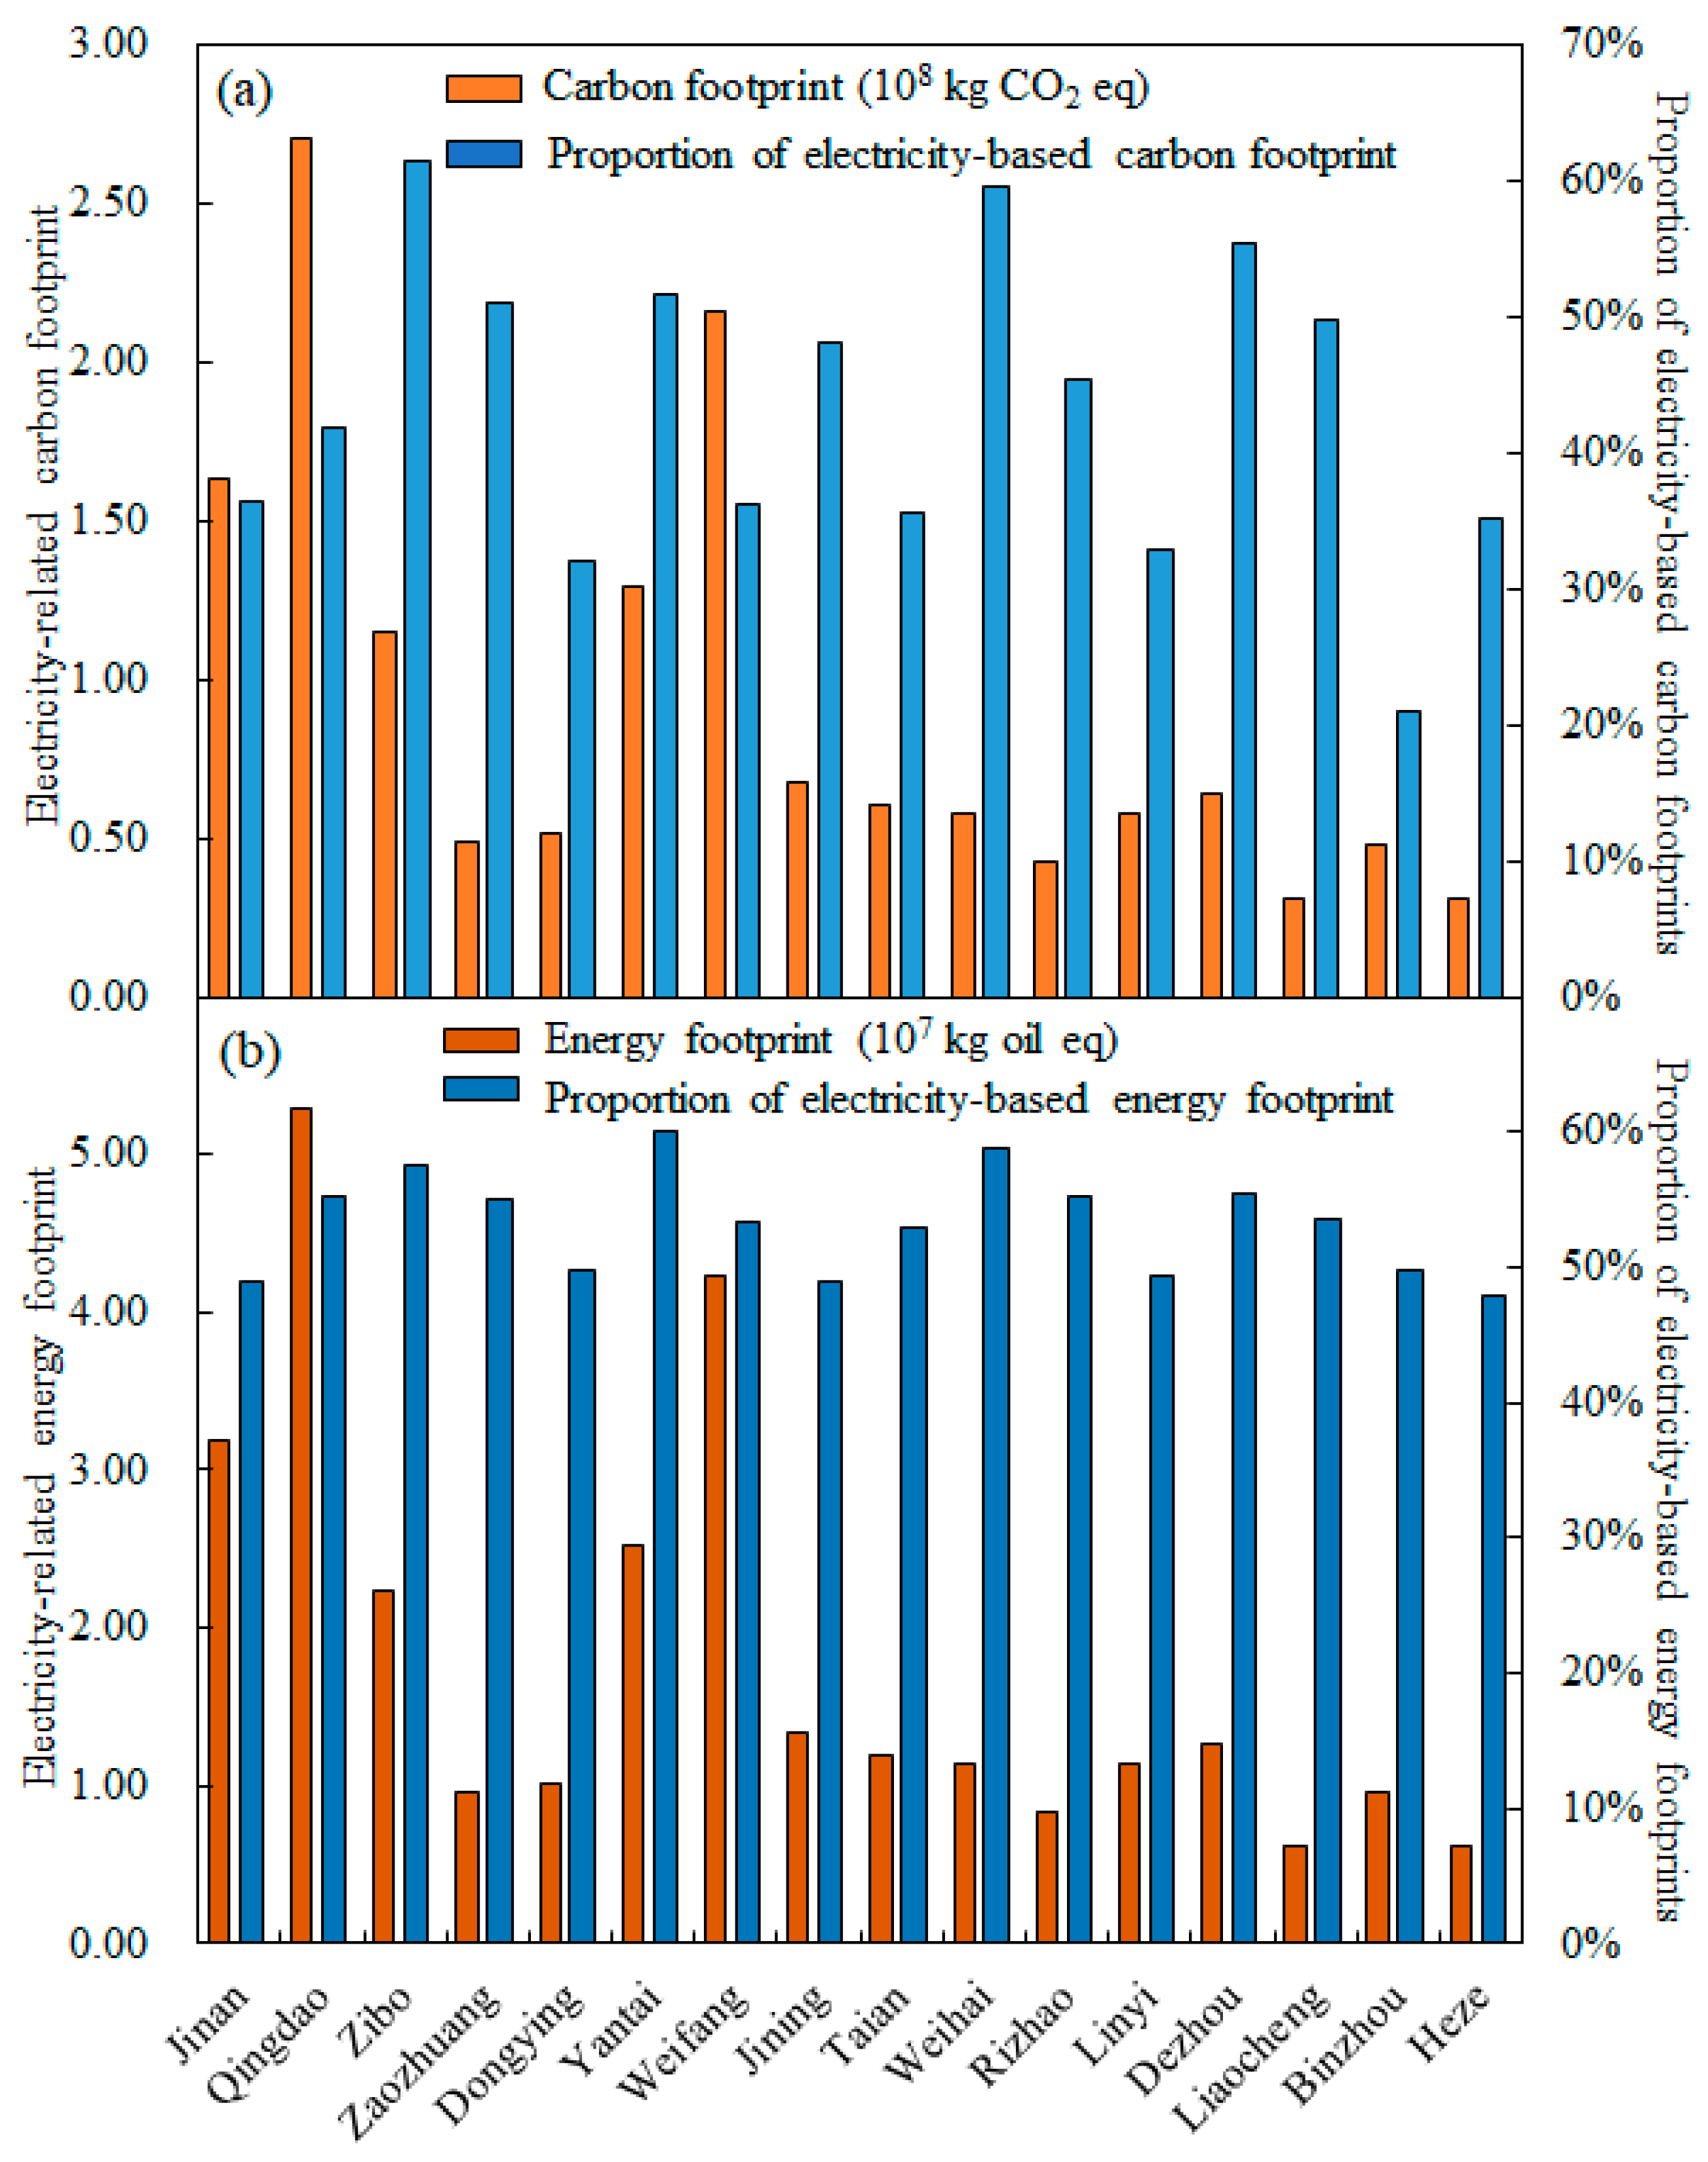
3.3. Regional Disparity of Electricity-Related Carbon and Energy Footprints

According to the Urban Drainage Statistical Yearbook [47], the average electricity intensity for wastewater treatment is 0.33 kWh/m3 in Shandong, with Yantai and Heze presenting the highest intensity (0.44 kWh/m3) and lowest electricity intensity (0.267 kWh/m3), respectively. The results show that the EF from electricity consumed during the operational process in these 140 WWTPs was 2.82 × 10⁸ kg oil eq in 2021, accounting for 53.11% of the total EF from Shandong’s WWTPs. Simultaneously, the total CF caused by electricity consumption in these 140 WWTPs was 1.45 × 10⁹ kg CO2 eq, accounting for 43.13% of the total CF in these 140 WWTPs. Figure 3 illustrates both CF and EF from electricity consumption across 16 cities. With the largest wastewater treatment amount among these 16 cities in 2021 (6.16 × 10⁸ m3), Qingdao had the largest electricity-relevant EF and CF. Meanwhile, Liaocheng had the lowest electricity-relevant EF and CF due to its lowest wastewater treatment amount (3.13 × 10⁷ m3).
Figure 3 also shows the different impacts that electricity consumption had on the carbon and energy footprints from 140 WWTPs in 16 cities. For instance, EF caused by electricity in Yantai accounted for 60.10% of the total EF from all the WWTPs in this city, ranking first among these 16 cities, followed by Weihai (58.72%), Zibo (57.48%), and Dezhou (55.31%). For the contribution of the CF caused by electricity to the total CF generated from all the WWTPs in a city, Zibo ranked first (61.55%), followed by Weihai (59.66%), Dezhou (55.45%), and Yantai (51.60%). Although numerous factors affect the total EF (for example, chemical consumption) and CF (for example, direct GHG emissions and emissions embodied in chemicals), enhancing electricity efficiency is crucial for these four cities to effectively reduce both CF and EF in the wastewater treatment sector.

4. Policy Recommendations

Wastewater treatment has been widely promoted to enhance water quality. But such treatment is always associated with energy consumption and generates corresponding GHG emissions. In this study, wastewater-related WF, EF, and CF were calculated based on a hybrid LCA, and the overall performance was evaluated by using the coupling indicator and the coupling coordination indicator. The findings of this study can facilitate the appropriate policy design to improve the operation of WWTPs. By considering Shandong’s realities, this study proposes the following policy recommendations.
Firstly, it is necessary to adopt multi-dimensional indicators to assess the sustainability of WWTPs. Various indicators such as CF, EF, and gray WF have been used to evaluate the performance of WWTPs, but each can only reflect a partial picture of the operational status of a WWTP [11,34]. For instance, better water quality is usually associated with increased energy consumption and higher GHG emissions [11,20]. The relationships between the removal of the COD, BOD, TN, and TP and electricity consumption are analyzed using the Spearman rank correlation test, as illustrated in Figure S2. The correlation coefficients between electricity consumption and the removal of COD, BOD, TN, TP were 0.459, 0.417, 0.354, and 0.290, respectively. These findings suggest that higher levels of COD, BOD, TN, and TP removal were associated with increased electricity consumption. Compared with a single indicator, the coupling coordination indicator reflects coupled characteristics of water, energy, and carbon footprints. Take Zibo as an example (Table 5); although Zibo had a lower WF and CF, its EF was relatively higher. Correspondingly, the coupling coordination indicator is relatively lower in Zibo than that in other cities in Shandong. This result underscores the importance of investigating the coupling coordination so that the overall performance of WWTPs can be measured. As such, multi-dimensional indicators such as a coupling indicator or coupling coordination indicator can be used to measure the operational performance of WWTPs. Regular measurements in these WWTPs by using such indicators can help them improve their operations under a transparent and publicized environment and facilitate them to learn from each other.
Secondly, it is necessary to optimize the local electricity structure. Since electricity is a dominant contributor to EF and CF generated from WWTPs (Table 4), the relationship between environmental footprints (i.e., EF and CF) and renewable electricity (including hydropower and wind power) should be investigated so that more insights can be obtained to facilitate decision makers to optimize their electricity structure. As shown in Figure S3, both EF and CF associated with wastewater treatment can be reduced with the application of hydropower and wind power. Additionally, policies for optimizing energy structures have been prepared in Shandong in order to achieve China’s carbon neutrality targets. For instance, Shandong’s provincial government issued its 14th Five-Year Plan (2021–2025), in which the electricity share generated from renewable energy will be increased to approximately 19%. However, this share in Shandong was lower than that of the national level in 2020 [57]. If this share could be adjusted to that of the national level, EF and CF could be reduced by 13.36% and 9.87% in these WWTPs, respectively. Therefore, the Shandong provincial government should make more efforts to further optimize its electricity structure by encouraging solar, wind, and hydropower so that the associated EF and CF from wastewater treatment can be mitigated.
Thirdly, it is urgent to promote the utilization of renewable energy. Located at the lower reach of the Yellow River, Shandong province has proposed that the effluent quality of its newly built WWTPs should meet Grade IV of the national surface water standard. But the stricter standard of wastewater discharge has induced more electricity consumption in China’s wastewater treatment sector [58]. Effective methane utilization generated from the wastewater treatment process is one way to address this problem since methane recovery has not been implemented in most of China’s WWTPs. Previous studies show that the energy efficiency of municipal wastewater treatment can be improved by adjusting the percentages of different organic matters in the bio-treatment units so that microorganisms can metabolize more effectively to remove pollutants from wastewater [39,59]. Also, the effective utilization of sludge generated from WWTPs should be promoted. Over 80% of such sludge has been improperly dumped in China, leading to soil contamination and the loss of precious land resources [11]. If sludge disposal via sanitary landfill [60] was considered, the average CF and EF associated with treating 1 m3 of wastewater in Shandong would increase by 37.72% and decrease by 2.05%, respectively. Incineration is one way to recover energy from such sludge, which can provide energy to the operation of WWTPs and contribute to the reduction in GHG emissions. If the sludge disposal of incineration [60] was considered, the average CF and EF of 1 m3 wastewater treatment in Shandong would decrease by 15.35% and 21.05%, respectively. In addition, WWTP photovoltaic (PV) projects can support WWTPs to reduce their electricity demand [61] and the associated carbon emissions [62]. The electricity cost from PV panels is now reasonable in China with the rapid expansion of the PV sector [62]. However, the installation of a PV system is complex and may pose a significant challenge upon applying PV technology in WWTPs [63]. Therefore, more research and development efforts should be made to further improve the application of such PV systems in these wastewater treatment plants.
Finally, it is critical to improve the overall awareness of all the stakeholders through various capacity building efforts. The results (Table 5) reveal regional heterogeneity in the coupling coordination indicators of WF, EF, and CF. For example, Zibo had the lowest value of coupling coordination indicators because of its high electricity consumption for wastewater treatment. This means improving electricity efficiency in the wastewater treatment sector is crucial in Zibo. Consequently, the Zibo municipal government should prepare more policies to adjust its energy structure and promote energy efficiency improvement in all its WWTPs. Targeted training activities should be conducted so that local stakeholders can quickly adopt innovative energy-efficient technologies to achieve smart water management. In general, there are more industries in Shandong, especially many heavy industries, meaning that this province has to appropriately treat its large amount of industrial wastewater. Plus, Shandong has a large population (ranking second in China), which further exacerbates the pressure of its wastewater treatment. Without integrated efforts to improve the overall environmental awareness of all the stakeholders (e.g., the government, industries, general public, and non-governmental organizations), it will be extremely difficult to reduce the associated WF, CF and EF. Consequently, the provincial government should organize various capacity-building activities, such as regular workshops, TV and Internet promotions, and community education. These activities can help all the stakeholders understand how they can work together toward the same target, namely sustainable wastewater treatment.

5. Conclusions

Wastewater treatment is essential to maintain a clean water environment. But this sector is facing a great challenge in addressing global climate change. Rapid urbanization and industrialization continue to accelerate, meaning that it is necessary to pay attention to electricity consumption and GHG emissions from this wastewater treatment sector. Our results indicate that EF and CF ranged from 9.42 × 10⁻² to 0.22 kg oil eq/m3 and from 0.58 to 1.27 kg CO2 eq/m3, respectively. The gray WF generated from 1 m3 of wastewater treatment ranged from 9.58 to 12.90 m3. In this study, the coupling coordination indicator was also adopted to measure the overall performance of WWTPs at the city level, which integrated water quality, energy consumption, and carbon emission together. The coupling coordination indicators of WF, EF, and CF for WWTPs at the city level ranged from 0.7571 to 0.9293, indicating that such a coupling coordination indicator analysis is necessary for assessing the integrated performance of WWTPs. To improve the operational performance of the entire wastewater treatment sector, this study proposes several recommendations, such as adopting multi-dimensional indicators, decarbonizing local electricity grids, promoting the utilization of renewable energy, and initiating capacity building efforts by considering the local reality. These findings (WF, CF, EF, and the coupling coordination indicator, identified key factors, and suggestions) provide valuable insights to decision makers to facilitate the sustainable transition of WWTPs.
There are several research limitations in this study. Firstly, annual average values of daily monitoring data were used in order to avoid the uncertainty caused by seasonal changes, but such average values cannot capture the dynamic changes in different months. This means that future studies may consider using more dynamic data to capture a more complete picture. Also, the disposal of sludge was not considered in this study due to the lack of relevant statistical data. The disclosure of statistical data on sludge disposal (e.g., resource consumption and environmental emissions of various treatment technologies) should be considered in the future.

Supplementary Materials

The following supporting information can be downloaded at: https://www.mdpi.com/article/10.3390/su17062594/s1, Figure S1: Spatial distribution of environmental footprints generated from wastewater treatment of Shandong (a) wastewater treatment (b) total water footprint (c) total energy footprint (d) total carbon footprint; Figure S2: Relationship between electricity consumption and pollutant removal; Figure S3: Scenarios analysis of electricity type; Table S1: Natural background concentration and maximum acceptable concentration of pollutants.

Author Contributions

Conceptualization, W.C. and Y.G.; methodology, W.C.; software, W.C.; formal analysis, W.C.; investigation, Y.X. and X.T.; data curation, Y.X.; writing—original draft preparation, W.C., Y.G. and C.W.; writing—review and editing, Y.G.; visualization, W.C.; supervision, Y.G.; funding acquisition, W.C., Y.G. and C.W. All authors have read and agreed to the published version of the manuscript.

Funding

This study is supported by the National Natural Science Foundation of China (72004125, 72088101, and 42401220), the Humanities and Social Science Fund of the Ministry of Education of China (24YJC630016), the China Postdoctoral Science Foundation (2023M732228), the Education Department of Shandong Province (2022RW063), and the Major Project of Key Research Bases for Humanities and Social Sciences Funded by the Ministry of Education of China (22JJD790015).

Institutional Review Board Statement

Not applicable.

Informed Consent Statement

Not applicable.

Data Availability Statement

The data are available upon request.

Conflicts of Interest

No potential conflicts of interest were reported by the authors.

References

  1. Chen, W.; Zhang, Q.; Hu, L.; Geng, Y.; Liu, C. Understanding the greenhouse gas emissions from China’s wastewater treatment plants: Based on life cycle assessment coupled with statistical data. Ecotoxicol. Environ. Saf. 2023, 259, 115007. [Google Scholar] [CrossRef] [PubMed]
  2. Obaideen, K.; Shehata, N.; Sayed, E.; Abdelkareem, M.; Mahmoud, M.; Olabi, A. The role of wastewater treatment in achieving sustainable development goals (SDGs) and sustainability guideline. Energy Nexus 2022, 7, 100112. [Google Scholar] [CrossRef]
  3. Taweesan, A.; Kanabkaew, T.; Surinkul, N.; Polprasert, C. Convenient solutions to inconvenient truth: Domestic wastewater management-based approaches to sustainable development goal no. 6. Environ. Sustain. Indic. 2023, 18, 100255. [Google Scholar] [CrossRef]
  4. United Nations. Sustainable Development Goals. Available online: https://www.un.org/sustainabledevelopment/water-and-sanitation/ (accessed on 30 September 2024).
  5. Koutsou, O.; Gatidou, G.; Stasinakis, A. Domestic wastewater management in Greece: Greenhouse gas emissions estimation at country scale. J. Clean. Prod. 2018, 188, 851–859. [Google Scholar] [CrossRef]
  6. Yan, X.; Qiu, D.; Zheng, S.; Cheng, K.; Han, Y.; Sun, J.; Su, X. Spatial and temporal distribution of greenhouse gas emissions from municipal wastewater treatment plants in China from 2005 to 2014. Earth’s Future 2019, 7, 340–350. [Google Scholar] [CrossRef]
  7. Capodaglio, A. Energy use and decarbonisation of the water sector: A comprehensive review of issues, approaches, and technological options. Environ. Technol. Rev. 2025, 14, 40–68. [Google Scholar] [CrossRef]
  8. Knappe, J.; Somlai, C.; Gill, L. Assessing the spatial and temporal variability of greenhouse gas emissions from different configurations of on-site wastewater treatment system using discrete and continuous gas flux measurement. Biogeosciences 2022, 19, 1067–1085. [Google Scholar] [CrossRef]
  9. Dickin, S.; Bayoumi, M.; Giné, R.; Andersson, K.; Jiménez, A. Sustainable sanitation and gaps in global climate policy and financing. npj Clean Water 2020, 3, 24. [Google Scholar] [CrossRef]
  10. Zeng, S.; Chen, X.; Dong, X.; Liu, Y. Efficiency assessment of urban wastewater treatment plants in China: Considering greenhouse gas emissions. Resources. Conserv. Recycl. 2017, 120, 157–165. [Google Scholar] [CrossRef]
  11. Liao, X.; Tian, Y.; Gan, Y.; Ji, J. Quantifying urban wastewater treatment sector’s greenhouse gas emissions using a hybrid life cycle analysis method–An application on Shenzhen city in China. Sci. Total Environ. 2020, 745, 141176. [Google Scholar] [CrossRef]
  12. UN-WATER. Progress on Wastewater Treatment–2024 Update. Available online: https://www.unwater.org/publications/progress-wastewater-treatment-2024-update (accessed on 30 September 2024).
  13. Wang, C.; Miao, Z.; Chen, X.; Cheng, Y. Factors affecting changes of greenhouse gas emissions in Belt and Road countries. Renew. Sustain. Energy Rev. 2021, 147, 111220. [Google Scholar] [CrossRef]
  14. Yu, L.; Liu, S.; Wang, F.; Liu, Y.; Li, M.; Wang, Q.; Dong, S.; Zhao, W.; Tran, L.-S.P.; Sun, Y.; et al. Effects of agricultural activities on energy-carbon-water nexus of the Qinghai-Tibet Plateau. J. Clean. Prod. 2022, 331, 129995. [Google Scholar] [CrossRef]
  15. Hoekstra, A.; Chapagain, A.; Aldaya, M.; Mekonnen, M. The Water Footprint Assessment Manual: Setting the Global Standard. Available online: https://waterfootprint.org/resources/TheWaterFootprintAssessmentManual_English.pdf (accessed on 30 September 2024).
  16. Chen, W.; Hong, J.; Wang, C.; Sun, L.; Zhang, T.; Zhai, Y.; Zhang, Q. Water footprint assessment of gold refining: Case study based on life cycle assessment. Ecol. Indic. 2021, 122, 107319. [Google Scholar] [CrossRef]
  17. Shao, L.; Chen, G. Water footprint assessment for wastewater treatment: Method, indicator, and application. Environ. Sci. Technol. 2013, 47, 7787–7794. [Google Scholar] [CrossRef] [PubMed]
  18. Morera, S.; Corominas, L.; Poch, M.; Aldaya, M.; Comas, J. Water footprint assessment in wastewater treatment plants. J. Clean. Prod. 2016, 112, 4741–4748. [Google Scholar] [CrossRef]
  19. Teodosiu, C.; Barjoveanu, G.; Sluser, B.; Popa, S.; Trofin, O. Environmental assessment of municipal wastewater discharges: A comparative study of evaluation methods. Int. J. Life Cycle Assess. 2016, 21, 395–411. [Google Scholar] [CrossRef]
  20. Gu, Y.; Dong, Y.N.; Wang, H.; Keller, A.; Xu, J.; Chiramba, T.; Li, F. Quantification of the water.; energy and carbon footprints of wastewater treatment plants in China considering a water–energy nexus perspective. Ecol. Indic. 2016, 60, 402–409. [Google Scholar] [CrossRef]
  21. Gómez-Llanos, E.; Durán-Barroso, P.; Matías-Sánchez, A. Management effectiveness assessment in wastewater treatment plants through a new water footprint indicator. J. Clean. Prod. 2018, 198, 463–471. [Google Scholar] [CrossRef]
  22. Gómez-Llanos, E.; Matías-Sánchez, A.; Durán-Barroso, P. Wastewater treatment plant assessment by quantifying the carbon and water footprint. Water 2020, 12, 3204. [Google Scholar] [CrossRef]
  23. ISO 14067; Greenhouse Gases-Carbon Footprint of Products-Requirements and Guidelines for Quantification. ISO: Geneva, Switzerland, 2018.
  24. Zhou, X.; Yang, F.; Yang, F.; Feng, D.; Pan, T.; Liao, H. Analyzing greenhouse gas emissions from municipal wastewater treatment plants using pollutants parameter normalizing method: A case study of Beijing. J. Clean. Prod. 2022, 376, 134093. [Google Scholar] [CrossRef]
  25. Shrestha, A.; Bhattarai, T.; Ghimire, S.; Mainali, B.; Treichel, H.; Paudel, S. Estimation of greenhouse gases emission from domestic wastewater in Nepal: A scenario-based analysis applicable for developing countries. Chemosphere 2022, 300, 134501. [Google Scholar] [CrossRef] [PubMed]
  26. Wang, D.; Ye, W.; Wu, G.; Li, R.; Guan, Y.; Zhang, W.; Wang, J.; Shan, Y.; Hubacek, K. Greenhouse gas emissions from municipal wastewater treatment facilities in China from 2006 to 2019. Sci. Data 2022, 9, 317. [Google Scholar] [CrossRef]
  27. Xi, J.; Gong, H.; Zhang, Y.; Da, X.; Chen, L. The evaluation of GHG emissions from Shanghai municipal wastewater treatment plants based on IPCC and operational data integrated methods (ODIM). Sci. Total Environ. 2021, 797, 148967. [Google Scholar] [CrossRef] [PubMed]
  28. Nguyen, T.K.L.; Ngo, H.H.; Guo, W.; Nghiem, L.D.; Qian, G.; Liu, Q.; Liu, J.; Chen, Z.; Bui, X.T.; Mainali, B. Assessing the environmental impacts and greenhouse gas emissions from the common municipal wastewater treatment systems. Sci. Total Environ. 2021, 801, 149676. [Google Scholar] [CrossRef]
  29. Wang, H.; Yang, Y.; Keller, A.A.; Li, X.; Feng, S.; Dong, Y.-N.; Li, F. Comparative analysis of energy intensity and carbon emissions in wastewater treatment in USA.; Germany.; China and South Africa. Appl. Energy 2016, 184, 873–881. [Google Scholar] [CrossRef]
  30. Elshkaki, A. The impacts of material-energy-water-carbon nexus on the sustainability of lighting technologies. ACS Sustain. Chem. Eng. 2021, 9, 4224–4233. [Google Scholar] [CrossRef]
  31. Yadav, G.S.; Das, A.; Kandpal, B.K.; Babu, S.; Lal, R.; Datta, M.; Das, B.; Singh, R.; Singh, V.; Mohapatra, K.; et al. The food-energy-water-carbon nexus in a maize-maize-mustard cropping sequence of the Indian Himalayas: An impact of tillage-cum-live mulching. Renew. Sustain. Energy Rev. 2021, 151, 111602. [Google Scholar] [CrossRef]
  32. Gómez-Gardars, E.; Rodríguez-Macias, A.; Tena-García, J.; Fuentes-Cortés, L. Assessment of the water-energy-carbon nexus in energy systems: A multi-objective approach. Appl. Energy 2022, 305, 117872. [Google Scholar] [CrossRef]
  33. Chen, K.; Wang, H.; Han, J.; Liu, W.; Cheng, H.; Liang, B.; Wang, A. The application of footprints for assessing the sustainability of wastewater treatment plants: A review. J. Clean. Prod. 2020, 277, 124053. [Google Scholar] [CrossRef]
  34. Ni, X.; Huang, X.; Guo, R.; Wang, J.; Peng, K.; Zhang, W.; Zhu, Y.; Yang, W.; Wang, L.; Cai, C.; et al. Water-energy-carbon synergies and trade-offs: A daily nexus analysis for wastewater treatment plants. Resour. Conserv. Recycl. 2023, 188, 106712. [Google Scholar] [CrossRef]
  35. Maktabifard, M.; Awaitey, A.; Merta, E.; Haimi, H.; Zaborowska, E.; Mikola, A.; Mąkinia, J. Comprehensive evaluation of the carbon footprint components of wastewater treatment plants located in the Baltic Sea region. Sci. Total Environ. 2022, 806, 150436. [Google Scholar] [CrossRef] [PubMed]
  36. Čuček, L.; Klemeš, J.; Kravanja, Z. A review of footprint analysis tools for monitoring impacts on sustainability. J. Clean. Prod. 2012, 34, 9–20. [Google Scholar] [CrossRef]
  37. Huijbregts, M.A.J.; Steinmann, Z.J.N.; Elshout, P.M.F.; Stam, G.; Verones, F.; Vieira, M.; Zijp, M.; Hollander, A.; van Zelm, R. ReCiPe2016: A harmonised life cycle impact assessment method at midpoint and endpoint level. Int. J. Life Cycle Assess. 2017, 22, 138–147. [Google Scholar] [CrossRef]
  38. Ministry of Ecology and Environment, the People’s Republic of China. Technical Guide for Greenhouse Gas Accounting for Collaborative Control of Pollutant Removal in Urban Sewage Treatment Plants. Available online: https://www.mee.gov.cn/xxgk2018/xxgk/xxgk06/201804/W020180926550238576829.pdf (accessed on 30 September 2024).
  39. Xiong, Y.; Zhang, J.; Chen, Y.; Guo, J.; Fang, F.; Yan, P. Geographic distribution of net-zero energy wastewater treatment in China. Renew. Sustain. Energy Rev. 2021, 150, 111462. [Google Scholar] [CrossRef]
  40. Anthropogenic and Natural Radiative Forcing. In Climate Change 2013–The Physical Science Basis: Working Group I Contribution to the Fifth Assessment Report of the Intergovernmental Panel on Climate Change (ed. Intergovernmental Panel on Climate Change) 659–740; Cambridge University Press: Cambridge, UK, 2014.
  41. Bauduin, T.; Gypens, N.; Borges, A. Seasonal and spatial variations of greenhouse gas (CO2.; CH4 and N2O) emissions from urban ponds in Brussels. Water Res. 2024, 253, 121257. [Google Scholar] [CrossRef] [PubMed]
  42. Chen, W.; Hong, J.; Xu, C. Pollutants generated by cement production in China.; their impacts.; and the potential for environmental improvement. J. Clean. Prod. 2015, 103, 61–69. [Google Scholar] [CrossRef]
  43. Han, D.; Yu, D.; Cao, Q. Assessment on the features of coupling interaction of the food-energy-water nexus in China. J. Clean. Prod. 2020, 249, 119379. [Google Scholar] [CrossRef]
  44. Zhang, P.; Deng, M.; Long, A.; Deng, X.; Wang, H.; Hai, Y.; Wang, J.; Liu, Y. Coupling analysis of social-economic water consumption and its effects on the arid environments in Xinjiang of China based on the water and ecological footprints. J. Arid. Land 2020, 12, 73–89. [Google Scholar] [CrossRef]
  45. Ecology and Environment Bureau of Shandong, 2022. Available online: http://fb.sdem.org.cn:8801/zxjc/index.htm (accessed on 30 September 2024).
  46. Ecoinventcentre, 2024. Swiss Centre for Life Cycle Inventories. Available online: https://support.ecoinvent.org/ecoinvent-version-3.10 (accessed on 30 September 2024).
  47. China Urban Water Supply and Drainage Association. Urban Drainage Statistical Yearbook 2018; China Urban Water Supply and Drainage Association Press: Beijing, China, 2018. [Google Scholar]
  48. Ministry of Housing and Urban-Rural Development, The People’s Republic of China. China Urban-Rural Construction Statistical Yearbook 2021; China Statistics Press: Beijing, China, 2022.
  49. GB 3838-2002; Environmental Quality Standards for Surface Water. Ministry of Ecology and Environment, The People’s Republic of China: Beijing, China, 2002. Available online: https://www.mee.gov.cn/ywgz/fgbz/bz/bzwb/shjbh/shjzlbz/200206/W020061027509896672057.pdf (accessed on 30 September 2024).
  50. Yapıcıoğlu, P. Grey water footprint assessment for a dye industry wastewater treatment plant using Monte Carlo simulation: Influence of reuse on minimisation of the GWF. Int. J. Glob. Warm. 2020, 21, 199–213. [Google Scholar] [CrossRef]
  51. Ansorge, L.; Stejskalová, L.; Dlabal, J. Effect of WWTP size on grey water footprint—Czech Republic case study. Environ. Res. Lett. 2020, 15, 104020. [Google Scholar] [CrossRef]
  52. Niero, M.; Pizzol, M.; Bruun, H.; Thomsen, M. Comparative life cycle assessment of wastewater treatment in Denmark including sensitivity and uncertainty analysis. J. Clean. Prod. 2014, 68, 25–35. [Google Scholar] [CrossRef]
  53. Abyar, H.; Younesi, H.; Nowrouzi, M. Life cycle assessment of A2O bioreactor for meat processing wastewater treatment: An endeavor toward the achievement of environmental sustainable development. J. Clean. Prod. 2020, 257, 120575. [Google Scholar] [CrossRef]
  54. Shahabadi, M.; Yerushalmi, L.; Haghighat, F. Impact of process design on greenhouse gas (GHG) generation by wastewater treatment plants. Water Res. 2009, 43, 2679–2687. [Google Scholar] [CrossRef]
  55. Bao, Z.; Sun, S.; Sun, D. Assessment of greenhouse gas emission from A/O and SBR wastewater treatment plants in Beijing, China. Int. Biodeterior. Biodegrad. 2016, 108, 108–114. [Google Scholar] [CrossRef]
  56. Li, H.; Liu, G.; Yang, Z. Improved gray water footprint calculation method based on a mass-balance model and on fuzzy synthetic evaluation. J. Clean. Prod. 2019, 219, 377–390. [Google Scholar] [CrossRef]
  57. National Bureau of Statistics, People’s Republic of China. China Statistical Yearbook 2021; China Statistics Press: Beijing, China, 2022.
  58. Smith, K.; Guo, S.; Zhu, Q.; Dong, X.; Liu, S. An evaluation of the environmental benefit and energy footprint of China’s stricter wastewater standards: Can benefit be increased? J. Clean. Prod. 2019, 219, 723–733. [Google Scholar] [CrossRef]
  59. Yan, P.; Qin, R.; Guo, J.; Yu, Q.; Li, Z.; Chen, Y.; Shen, Y.; Fang, F. Net-zero-energy model for sustainable wastewater treatment. Environ. Sci. Technol. 2017, 51, 1017–1023. [Google Scholar] [CrossRef]
  60. Hong, J.; Li, X.; Cui, Z. Life cycle assessment of four municipal solid waste management scenarios in China. Waste Manag. 2010, 30, 2362–2369. [Google Scholar] [CrossRef]
  61. Xu, J.; Li, Y.; Wang, H.; Wu, J.; Wang, X.; Li, F. Exploring the feasibility of energy self-sufficient wastewater treatment plants: A case study in eastern China. Energy Procedia 2017, 142, 3055–3061. [Google Scholar] [CrossRef]
  62. Chen, X.; Zhou, W. Economic and ecological assessment of photovoltaic systems for wastewater treatment plants in China. Renew. Energy 2022, 191, 852–867. [Google Scholar] [CrossRef]
  63. Hao, X.; Liu, R.; Huang, X. Evaluation of the potential for operating carbon neutral WWTPs in China. Water Res. 2015, 87, 424–431. [Google Scholar] [CrossRef] [PubMed]
Figure 1. Wastewater generation and treatment in different cities in Shandong.
Sustainability 17 02594 g001
Figure 2. Spatial distribution of environmental footprints associated with wastewater treatment in Shandong (a) water footprint; (b) energy footprint; (c) carbon footprint.
Sustainability 17 02594 g002
Figure 3. Energy footprint and carbon footprint from electricity consumption (a) carbon footprint; (b) energy footprint.
Sustainability 17 02594 g003
Table 1. Life cycle inventories of six WWTPs (functional unit: treatment of 1 m3 wastewater).
P-1P-2P-3P-4P-5P-6
Energy and chemical consumption aElectricity (kWh)0.480.350.360.330.390.39
Sodium acetate (kg)0.241.55 × 10−2 0.260.36
Methanol (kg) 9.07 × 10⁻² 6.20 × 10⁻²
Polyacrylamide (g)2.261.371.360.941.3661.64
Polyferric chloride (kg)0.146.69 × 10−20.15
Polymeric ferric sulfate (kg) 8.58 × 10⁻²
Polyaluminum chloride (g) 0.160.11
Emissions to
water a
Chemical oxygen demand (g)20.5228.0336.9118.5717.1820.32
Biochemical oxygen demand (g)6.124.735.284.862.031.58
Ammonia nitrogen (g)0.472.441.290.440.260.28
Total nitrogen (g)10.959.9111.328.948.669.73
Total phosphorus (g)0.30.270.20.100.170.13
Suspended solids (g)4.256.646.056.913.473.88
Animal and vegetable oils (g)0.340.20.40.43--
Petroleum (g)0.130.210.390.47--
Anion active agent (LAS) (g)0.10-0.32---
Zinc (g)----5.47 × 10−21.70 × 10−2
Fluoride (g)-0.56----
Emissions to airMethane b (g)2.481.379.223.545.1611.58
Nitrous oxide b (g)0.540.240.290.310.230.34
Ammonia c (g)0.168.33 × 10−2----
Hydrogen sulfide c (g)7.00 × 10−35.67 × 10−3
a Data were gathered from actual processing flows. b The amounts of methane and nitrous oxide were calculated by referring to [38,39]. c Data were taken from the monitoring system of the Ecology and Environment Bureau of Shandong [45].
Table 2. Primary parameters of six investigated WWTPs.
Removal of Pollutants (g/m3)Treatment Capacity (104 m3/d)Dry Sludge Yield (g/m3)
Biochemical Oxygen DemandChemical Oxygen DemandTotal Nitrogen
P-1131.26226.7466.594272.03
P-282.89221.7130.092271.34
P-395.60275.6937.345203.73
P-487.78244.4639.304263.09
P-591.13179.3428.746147.43
P-6121.41294.7943.8520187.14
Table 3. Statistical data on Shandong’s WWTPs.
Removal of Pollutants (g/m3)Electricity (kWh/m3)
Biochemical Oxygen DemandChemical Oxygen DemandAmmonia NitrogenTotal PhosphorousTotal Nitrogen
Jinan (N = 9)Max168.78391.8050.826.5152.600.53
Min21.3482.8014.851.7510.780.24
Mean124.42308.2533.895.1733.810.28
Qingdao (N = 11)Max151.22502.5044.6816.4347.340.95
Min39.60166.308.741.574.490.22
Mean117.44347.3032.898.3837.150.36
Zibo (N = 5)Max119.79296.9038.633.7154.480.55
Min66.05247.7018.221.8120.690.21
Mean90.68265.7228.903.0818.420.39
Zaozhuang (N = 6)Max150.23455.2027.585.7431.260.55
Min47.18150.0018.950.8114.980.21
Mean82.72234.8421.673.7123.260.35
Dongying (N = 4)Max140.51337.8034.204.4628.580.35
Min36.88241.3017.562.0114.810.21
Mean105.44282.9325.533.4025.150.29
Yantai (N = 12)Max240.96402.1057.4211.7459.181.66
Min46.75195.8014.351.3412.430.25
Mean139.81313.6233.345.0340.850.44
Weifang (N = 11)Max314.13852.6049.825.1455.210.43
Min44.87192.8020.611.8120.090.25
Mean143.74381.0330.833.3231.280.33
Jining (N = 8)Max111.00322.4031.332.4530.020.35
Min25.6162.6010.161.3010.630.18
Mean75.79175.8719.811.7919.450.28
Taian (N = 5)Max131.90322.1047.077.0557.530.46
Min71.95212.2023.271.7418.690.25
Mean102.34286.4032.044.1633.120.33
Weihai (N = 4)Max146.60366.9034.064.7644.740.53
Min74.54170.7024.092.1330.000.33
Mean101.45267.3230.343.8537.050.41
Rizhao (N = 10)Max111.63588.8033.214.7734.300.68
Min9.81140.905.791.0013.070.29
Mean84.89222.6820.372.5723.590.36
Linyi (N = 10)Max183.63495.1046.606.9344.820.53
Min48.12129.1021.222.1518.220.00
Mean134.51287.7828.533.7627.470.28
Dezhou (N = 13)Max144.94251.5039.214.5137.050.60
Min24.4286.3012.881.5512.620.19
Mean69.81183.7024.712.8327.660.36
Liaocheng (N = 15)Max490.251971.7046.5122.4675.731.53
Min63.94124.209.672.0417.410.20
Mean107.51264.4226.803.8529.440.33
Binzhou (N = 10)Max156.18427.9050.015.2949.420.67
Min71.58156.2018.501.0012.190.23
Mean87.03291.0429.463.3328.180.29
Heze (N = 7)Max139.39285.6032.053.3831.590.35
Min22.88113.4020.492.1022.940.21
Mean93.66252.8228.032.8026.650.27
Note: N is the amount of WWTPs contained in Urban Drainage Statistical Yearbook [47].
Table 4. Life cycle water, energy, and carbon footprints of six WWTPs (functional unit: 1 m3 of wastewater treatment).
Environmental FootprintsAmountKey Factors
P-1Water footprint (m3)12.44Water footprintgrey(TN)
Energy footprint (kg oil eq)0.16Electricity (70.73%) + sodium acetate (17.65%)
Carbon footprint (kg CO2 eq)0.93Electricity (62.84%) + direct GHG emissions (22.93%) + sodium acetate (7.97%)
P-2Water footprint (m3)11.14Water footprintgrey(TN)
Energy footprint (kg oil eq)9.42 × 10⁻²Electricity (88.36%)
Carbon footprint (kg CO2 eq)0.58Electricity (73.99%) + direct GHG emissions (20.29%)
P-3Water footprint (m3)12.9Water footprintgrey(TN)
Energy footprint (kg oil eq)0.13Electricity (64.73%) + methanol (22.48%)
Carbon footprint (kg CO2 eq)0.93Electricity (47.83%) + direct GHG emissions (41.13%)
P-4Water footprint (m3)9.93Water footprintgrey(TN)
Energy footprint (kg oil eq)0.16Electricity (50.57%) + sodium acetate (39.09%)
Carbon footprint (kg CO2 eq)0.82Electricity (49.49%) + direct GHG emissions (25.78%) + sodium acetate (19.45%)
P-5Water footprint (m3)9.58Water footprintgrey(TN)
Energy footprint (kg oil eq)0.20Electricity (47.15%) + sodium acetate (36.87%)
Carbon footprint (kg CO2 eq)1.02Electricity (46.92%) + direct GHG emissions (23.69%) + sodium acetate (18.65%)
P-6Water footprint (m3)10.91Water footprintgrey(TN)
Energy footprint (kg oil eq)0.22Electricity (42.40%) + polyacrylamide (40.74%) + methanol (9.19%)
Carbon footprint (kg CO2 eq)1.27Direct GHG emissions (39.19%) + electricity (38.36%) + polyacrylamide (16.07%)
Note: Water footprintgrey(TN) means the gray water footprint caused by total nitrogen.
Table 5. Coupling indicators and coupling coordination indicators of water, energy, and carbon footprints.
Coupling Indicator (C)Comprehensive Development Indicator (T)Coupling Coordination Indicator (D)
Jinan0.97260.77970.8708
Qingdao0.98320.83050.9036
Zibo0.93700.61180.7571
Zaozhuang0.97240.73810.8472
Dongying0.99000.79630.8879
Yantai0.98170.80970.8915
Weifang0.99350.79870.8908
Jining0.97000.59970.7627
Taian0.98930.82690.9044
Weihai0.96140.79910.8765
Rizhao0.98290.77130.8707
Linyi0.98880.77900.8776
Dezhou0.96570.65250.7938
Liaocheng0.97380.70320.8275
Binzhou0.99450.86840.9293
Heze0.99170.66060.8094
Disclaimer/Publisher’s Note: The statements, opinions and data contained in all publications are solely those of the individual author(s) and contributor(s) and not of MDPI and/or the editor(s). MDPI and/or the editor(s) disclaim responsibility for any injury to people or property resulting from any ideas, methods, instructions or products referred to in the content.

