Abstract
The past years have seen semiconductors become increasingly important across various sectors, and technological advancements have driven this phenomenon. Nanometer-sized semiconductor chips are not only efficient in reducing power consumption but are also environmentally friendly. Our research analyzes the technological rivalry among leading global corporations in semiconductor production technology, specifically atomic layer deposition (ALD) technology, which is pivotal for nanoscale manufacturing. We conducted a comprehensive examination of 5460 ALD patents of 40 premier companies. The first part is a longitudinal study to perform a leadership change study upon six countries and three subindustries. The second part is a comparative study on companies, countries, and subindustries, respectively, to analyze ALD patent portfolios. This longitudinal study has revealed that fierce patent leadership changes have happened among the three leading countries and that leadership is shifting from chipmakers to equipment companies. The comparative study used five two-dimensional patent matrices for competence analysis to elucidate ALD patent competition among companies and extend the level of analysis for companies to countries and subindustries. The research results provide insights for managers and policymakers regarding the dynamics of the ALD patent race, the importance of high-impact patent competence, and the evolving competitive landscape between chipmakers and equipment companies.
1. Introduction
Semiconductor technology has witnessed unparalleled advancement in the last half-century, substantially outpacing other domains of the technological evolution. In particular, over the past five decades, the semiconductor industry has concentrated on continually refining its miniaturization techniques to reduce the size of semiconductor devices further, particularly transistors [1]. This refinement has led to an evolutionary leap in transistor gate lengths, which have shrunk from the micrometer scale ( m) to the nanometer scale ( m) [2]. These innovations have greatly improved the efficiency and environmental friendliness of semiconductor production because nanotechnology allows for the precise layer-by-layer growth of nanomaterials, which can reduce the use of excess materials and elements in manufacturing. Amid this rapid growth, competition among companies has intensified as they aim to secure a vantage point in the global market, transforming it into a veritable technological battleground. In recent years, such competition has transcended corporate boundaries, with countries entering the fray as late participants where they have matched the investment levels and technological prowess of more developed counterparts. Semiconductor technology and related industries have also transcended corporate control, with geopolitical factors coming into play and marking the field as a key battleground for national strategic development. Notably, the United States (US) launched strong incentive initiatives to address the burgeoning demand for semiconductors from 2020 to 2030, while other nations, such as South Korea, China, and Taiwan, have bolstered their respective industries with vigorous support and investment [3].
The high-tech threshold and substantial investment requisites of the semiconductor industry have traditionally shielded it from easy market entry by nascent competitors. However, recent innovations in AI, cloud computing, and autonomous systems have precipitated a paradigm shift that has ignited intense competition across international borders and compelled countries to embrace aggressive technological contests. This fierce competition can be seen in the divergent strategic pursuits of semiconductor chipmakers, equipment companies, and material suppliers. Nations such as South Korea, Taiwan, and China semiconductor chipmakers have emerged as formidable challengers to traditional industry stalwarts, such as the US and Japan, thus exemplifying the competitive dynamism of leading chipmakers [4]. Meanwhile, the domain of semiconductor equipment companies and material suppliers continues to be dominated by pioneering entities from the US and the European Union (EU). New gaps have emerged between early movers and late entrants, especially in advanced fields such as exposure equipment. Rapid innovations in process technology underpin this shifting landscape of competition among chipmakers, equipment companies, and material suppliers, as well as the ensuing inter-country rivalries [5,6].
Semiconductors are the foundation of modern electronics and are essential to many everyday products, and their unique ability to conduct electricity under certain conditions has enabled a range of advanced technologies, revolutionizing many industries. Electronic devices and components have raised environmental concerns due to the environmental impact of electronic waste and rapid development, but the continued miniaturization of semiconductors and single-chip technology innovations, including ALD technology, is driving powerful, affordable, and energy-efficient consumption. Semiconductors also play a critical role in shaping the digital landscape and are used in everything from sophisticated renewable energy systems that address the global climate crisis to solar panels and wind turbines [7].
The semiconductor manufacturing process comprises wafer fabrication, assembly, packaging, and testing. Within this framework, the semiconductor thin film deposition process is a particularly critical technology as it involves meticulously layering thin films to impart the desired conductive or insulating properties at the molecular level. This technique is a cornerstone among vital semiconductor technologies [8]. Embedded within this classification of nanoscale deposition technology are atomic layer deposition (ALD), physical vapor deposition (PVD), and chemical vapor deposition (CVD) technologies, with ALD—which evolved from CVD—emerging as the pinnacle of technological advancement [2]. In general, conventional chemical vapor deposition (CVD) and physical vapor deposition (PVD) have difficulty in obtaining continuous films in the thin thickness region and suitable films with high aspect ratio features. In addition, PVD causes ion-induced damage to the underlying layer. Unlike CVD and PVD, ALD has atomic-scale precision, high step coverage in high aspect ratio features, high-density amorphous films, no pinholes and grain boundaries, excellent within-wafer and between-wafer uniformity, and excellent electrical properties [9]. By offering unparalleled precision in film uniformity and control at sub-nanometer thickness, ALD technology has come to be applied across a broad spectrum of fields beyond semiconductors, including the energy, aerospace, and biotechnological domains, in response to growing demands for ultra-thin film deposition [10]. Especially, ALD semiconductors are widely used in the development of eco-friendly products and services, including electric vehicles, batteries and fuel cells, exhaust emission control, green buildings, and renewable energy production.
A patent is a legal entitlement that is granted in exchange for disclosing an invention, and it allows the holder to prevent others from manufacturing, utilizing, or vending the invention for a set duration [11]. While individuals typically obtain patents to safeguard their innovations, corporations leverage patents not only to protect their intellectual property but also as pivotal intellectual assets in and of themselves to secure market dominance. By acquiring patents, companies can achieve several strategic competitive advantages. Patents primarily serve as a barrier against unauthorized replication by competitors or external entities, making them critical instruments in helping corporations develop, govern, and commercialize their technological advancements. Patents enable corporations to demonstrate their prowess in technological innovation as well as research and development (R&D), which makes patent portfolio management a strategic asset for envisioning and implementing future product developments. Patents are the most dependable source of data for monitoring the evolution of a company’s proprietary technology over time. By monitoring the patent landscape, including competitor patent holdings and market shifts, companies can use their patent approaches to shape innovative strategies to align with evolving industry dynamics. Patents also signify an organization’s technological vigor, and they act as a communication channel that unites various stakeholders in the company’s innovation ecosystem. They also provide a means to both recognize and encourage inventors within a company while signaling the company’s commitment to innovation to customers and investors. This perception supports the establishment of strategic alliances by facilitating technological transactions and cross-licensing agreements among peer firms [12].
The current study has two sections. The first one is a longitudinal study to explore the patent leadership changes among distinguished enterprises in ALD technology. The second one is a comparative study to scrutinize the technological competence of companies among the leading companies, which are across various countries and subindustries. For this purpose, this study analyzed international patents, which are operationally defined as those registered with the patent offices of major ALD patent producers from six countries, i.e., South Korea (KR), Japan (JP), the US (US), the EU (EU), Taiwan (TW), and China (CN). The patent data from these patent offices, spanning 20 years from 2003 to 2022, were divided into four chronological phases for comparison. The longitudinal study focused on the leadership change trajectories, and the comparative study examined patent competence based on six quantitative and qualitative indicators and a strategic matrix analysis. We set up two research questions for the longitudinal study and comparative study, respectively, as follows:
- Research question 1 (longitudinal study): how have technological leadership changes in the field of ALD patents progressed among companies, countries, and subindustries over the past 20 years?
- Research question 2 (comparative study): how have the various competencies in the ALD patent portfolio differed by company, country, and subindustry during the past 20 years?
2. Literature Review
The concept of technology catch-up refers to the efforts of a leading entity to bridge the technological gap with a follower. Research on technology catch-up focusing on leaders and late entrants across various technologies and industries has been conducted at both the national and corporate levels. In these studies, catch-up is deemed to have successfully occurred when the late entrant surpasses the leader. Conversely, when a late entrant fails to surpass a leader, it is considered to be a case of sustained leadership.
Research into national catch-up cycles has spanned various industries, and steel, automobiles, shipbuilding, semiconductors, and televisions have been identified as quintessential domains in the leadership transition from pioneer countries to challenger countries [13,14]. This transition emphasizes the nature of industries at the peak of a catch-up cycle as well as the circumstances under which leaders relinquish leadership to challengers within specific technologies and industries. For example, there have been a number of studies specifically investigating Japan’s emergence in electronics and automobiles during the 1970s and 1980s, as well as South Korea’s advancements in electronics, automobiles, and shipbuilding since the late 1990s [13,15]. Moreover, during the late 2000s, research began to target China’s attempted catch-up with Japan, the US, and the EU, with such research focusing on both traditional flagship industries and emerging sectors [16].
Previous studies have outlined the catch-up process from a follower to a leader with the following three distinct phases: the first phase is the entry phase, wherein the late entrant mitigates its technological deficits by leveraging cost advantages; the second phase is the catch-up phase, during which the latecomer hastens its pursuit of the leaders through investment, learning, and incrementally gaining competitiveness, all while aiming for market leadership; and the third phase is the success or failure of the catch-up phase, where the latecomer’s progress begins to lead the latecomer to either success or stagnation [15]. Once the pioneer fails to sustain its superiority in technology, production, and marketing, it relinquishes leadership to the latecomer, who—having benefited from the knowledge and technology pioneered by the early entrants—emerges as an international front-runner. By contrast, the pioneer sees a decline in stature as the latecomer capitalizes on the accrued technological and knowledge gains.
The phenomenon of national level catch-up initiated by pricing competitiveness catalyzes the creation of new demand, thus presenting latecomers with abundant opportunities to overtake their predecessors. Examples of such initial price competitive catch-up scenarios include the automobile and electronics industries in South Korea, the telecommunications and electric vehicle industries in China, and the pharmaceutical and cost-effective automobile segments in India [17,18,19].
On the other hand, technological superiority can only be achieved when technological capabilities undergo both accumulation and restructuring. From this perspective, when only accumulation and quantitative improvement are succeeded by latecomers, the technological pursuit could fail. Regarding restructuring, path creation was related to existing core technologies, and when adjusted and aligned, it brought about positive results, which is observed in the semiconductor industry as follows [20]: Before the 1990s, the semiconductor industry was dominated by several companies in the United States and Japan. A Japanese memory chipmaker overtook Intel, which invented memory chips. Subsequent U.S. trade restrictions on Japanese chips and the inability of Japanese semiconductor companies to adapt to a more specialized chip production model led to the decline of Japan’s semiconductor business, while Taiwanese and Korean companies emerged. Samsung took the lead in memory chips in the mid-1990s, and China has started technical catch-up since the 2000s.
According to recent studies, technical catch-ups since the 2000s are different from the last century. South Korea and Taiwan maintained a technical advantage over China in terms of the amount and quality of semiconductor patents, while Japan lost its previous advantage over China, at least in terms of the number of memory chip-related patents [21]. China’s pursuit speed is very fast in quantity but slow in quality in semiconductor technologies, and the U.S. has recently implemented “chokepoint” measures to limit China’s semiconductor manufacturing growth [21]. According to an extant study, while the competition in the global semiconductor industry has changed in the context of new geopolitics, these actions by the U.S. will probably help slow the tech chase, but they will not completely prevent fast followers, such as the Chinese semiconductor industry, from rising in the long-term period [21].
In the semiconductor industry, innovation is frequent, and technology is highly accumulated, putting latecomers at a disadvantage [22]. In addition, the IC chip market is not fragmented and is highly integrated, making it difficult for latecomers to catch-up with technology. For latecomers in the semiconductor industry, the situation is recently worsening as the technology life cycle shortens despite the ever-increasing investment required [23]. However, the recent remarkable growth in the non-memory sector and the different business ecosystem from memory chips are creating a different aspect of technology catch-up. Taiwan’s TSMC’s strategic model was that while general semiconductor companies like Samsung were involved in the entire semiconductor process, TSMC would focus on a critical step in the production process. Thus, the clear division of labor between TSMC and its customers helped build mutual trust and focused on lasting partnerships with customers rather than competing with them. In addition, U.S. semiconductor companies did not have to build expensive foundries of their own and could focus on chip design and R&D activities. This series of catch-up strategies could lead to TSMC surpassing Samsung as the top global semiconductor company in 2022 [24].
Studies on inter-company leadership and catch-up are distinct from those investigating cross-country studies in that companies aim to implement strategies that leverage their specific capabilities in response to the surrounding business environment, and these strategies are often implemented over shorter time horizons than those pursued by countries. From this perspective, the so-called late entrants begin their technological catch-up journey by assimilating knowledge from leading entities and subsequently engaging in enhancements or innovations [25]. Despite having gained early disadvantages in terms of technology and market penetration, these companies aim to secure a competitive edge through rigorous technological analysis along with cost advantages derived from patents. This foundational competitive advantage fuels the increased collection of resources, sparks technological innovation, and improves production quality and product reliability, thereby enabling gradual convergence with the market leader. As part of this process, late entrants carve out new market niches, heighten competition with pioneers, and endeavor to reshape the business landscape. While pioneers often commit to incremental innovations to refine their established domains, late entrants typically have the flexibility to adopt a bolder strategy, leaning toward disruptive products [26]. This inclination toward disruption empowers late entrants to seize market share and occasionally usurp pioneers. In these cases, late entrants exhibit superior absorptive capacities and a better understanding of how to leverage new knowledge for active participation in technological innovation [27]. Conversely, pioneering companies may excessively prioritize stable evolution over groundbreaking innovations, which could potentially lead to their downfall due to complacency stemming from the success of their technologies and an underestimation of the late entrants’ potential to catch-up [28].
Moreover, research examining the interrelationship between leadership and the catch-up phenomenon in companies distinguishes between market catch-up, which pertains to trade performance or market share, and technology catch-up, which involves accumulating collective knowledge or know-how that leads to technological advancement, and different approaches must be used to assess these two types of catch-up [15]. A study by Vernon elucidated that, while a late entrant can temporarily align with a leader’s market performance, the late entrant must surpass the leader’s technological capabilities to sustain and expand their catch-up efforts over the long term [29]. Christensen’s S-curve theory indicates that the existence of abbreviated technology cycles enhances the success rates of catch-up activities [30,31]. A late entrant can successfully transition to market leadership through technological innovation, thus creating continuous opportunities and heightened profits [32]. This concept is effectively illustrated in the competitive trajectory of Samsung and Sony in the television sector. In the 1980s, Sony, as a new competitor, first gained a technological edge over the US companies, which were the market leaders, and Sony eventually achieved market dominance [33]. Park and Lee’s analysis of the success factors for technology catch-up, which explored the approval and growth rates of US patents in comparison to those of South Korean patents [32,33], revealed that South Korean conglomerates showed an increased tendency to focus on honing their technological innovation capabilities drawn from overseas original equipment manufacturer (OEM) experiences while channeling all possible resources into a globally competitive product [34]. This meticulously crafted strategy enabled South Korean conglomerates to achieve technology and market catch-up in sectors that are heavily reliant on manufacturing, spanning automobiles, IT, and multimedia equipment, including mobile phones [13].
The extensive literature exploring inter-company leadership and catch-up dynamics also suggests that technology, demand, and institutional frameworks shape the relationship between pioneering entities and new entrants. Studies in this area posit that the emergence of new technologies or alterations within an industry’s technological landscape can either broaden or narrow the windows of opportunity for new entrants. Some researchers argue that shifts in national institutions and public policy interventions can create conducive environments for new market entrants to challenge and potentially surpass pioneers, while fluctuations in market demand can either enhance or diminish catch-up prospects [11,35]. Consequently, even if a new entrant manages to innovate a product, it is unlikely to outperform the incumbent if it lacks the institutional leverage to scale its operations [11].
The narrowing of the technology gap between companies is seen to lead to a surge in the quantity and quality of technical knowledge, which is typically measured using patent metrics. Therefore, as technology catch-up requires a shift in the knowledge flow from the first movers to the new entrants, late entrants are advised to extensively analyze patents—as an indicator of knowledge creation over the long term—and accordingly develop a patent strategy rather than a cost-based market catch-up strategy. Researchers claimed that late entrants could cultivate their technological prowess through strategic patenting actions in anticipation of brief technology cycles, given that technology catch-up is more probable in contexts that are characterized by concise cycles and robust knowledge accumulation [36]. However, prior research on catch-ups and leadership changes in the traditional industry has extensively studied these areas, but less has explored what happened in the emerging high-tech industry, such as the semiconductor industry, especially focused on patent areas. Moreover, the current patent analysis has also paid less attention to using correlated patent indices simultaneously. In addition, the semiconductor industry and technology are not only the contribution of chipmakers, which have led this industry, but also the competencies of equipment companies and material suppliers have not received much attention. There is a great need to bridge these research gaps because emerging technology, such as ALD technology, has different characteristics for catch-ups and leadership changes than traditional technology and industry, and there is fierce competition among companies in the semiconductor industry, as well as between countries and subindustries.
3. Data and Methodology
3.1. Patent Data
Prior research has identified an array of innovative activities that can serve as markers of the technological prowess and outcomes of corporations or research institutions, including scholarly publications, patent activities, and new product development. These activities encompass various phases of the innovation timeline, including the basic research, applied research, and product development stages. Patents specifically are most directly linked to tangible applied research outcomes and product development capabilities. The transition of innovation from the ideation phase to a patent involves several stages, including the patent application phase, patent registration, and eventual patent commercialization through avenues such as licensing. The transition from patent application to registration is marked by a highly rigorous screening process, which has the ultimate effect of conferring a much higher technical value to registered patents, as only a select subset of patents that are entered into the application process attain registration [37]. Metrics on commercialization, such as licensing, can be good indicators of innovation activity, but they have limited value in the study of a company’s innovation activity because most such metrics are internal to the company.
The current analysis focuses on patenting within the context of ALD technology, which is considered to be the most suitable innovation activity for scrutiny given its relevance to process innovations in semiconductor manufacturing, alongside product innovations spanning finished products, materials, and equipment. We elected to analyze registered patents rather than patents that were merely submitted to the patent application phase, owing to the former’s greater economic significance. As such, a comprehensive set of registered ALD patents spanning from the early 2000s to 31 December 2022 was collated from the patent offices of six major ALD patent registering countries—South Korea, Japan, the US, the EU, Taiwan, and China—using specific search criteria in the Wipson database (http://wipson.com). Wipson is a paid online search service for patent databases, offering a variety of features, including global patent searches, relevant patent statistics, and patent valuations.
A search was conducted for patents registered from 2003 to 2022 using the keywords “(semiconduc*) and ((ALD* and Atomi*))”, which returned 8506 semiconductor ALD registered patents held by companies, research institutes, schools, and individuals. After the search, we eliminated duplicate patents from the patent offices of different countries. Since the focus of this study is on the competition among leading players in ALD patents, we excluded entities or individuals holding 16 or fewer ALD patents over 20 years. This criterion filtered the dataset to the top 63 entities, which comprised 40 corporations and 23 academic or research institutions, and which together accounted for 6360 out of the original 8506 patents. In addition, we removed 900 patents associated with 23 academic and research institutions to focus on the dominance of companies in the ALD technology field. None of these patents have ever mentioned the 40 companies under study as co-applicants. We finally selected 5460 patents held by 40 leading global companies as the study sample. These companies were classified into three subindustries, i.e., chipmakers, equipment companies, and material suppliers, as follows: 20 semiconductor chipmakers, 14 equipment companies, and 6 material suppliers. These top 40 companies have 5460 patents, accounting for approximately 64.2% of all 8506 ALD patents that were initially found in the search. Therefore, we believe that the patent data of these top 40 companies is suitable for a representative analysis of the technological competence of companies in the ALD space.
3.2. Patent Index
The existing literature has studied companies’ patenting activities both quantitatively and qualitatively. The present study chose six key patent indices derived from the existing literature: entry year, patent share, compound annual growth rate (CAGR), revealed technological advantage (RTA), patent impact index (PII), and family size share (FSS). These metrics were used to analyze the competence of patent portfolios of the 40 selected companies over the 20 years of interest (i.e., from 2003 to 2022). The entry year for the first patent registration in the study period was used to categorize companies as early entrants or latecomers. Patent shares and CAGR were selected to quantitatively evaluate a corporation’s patent portfolio volume and growth trajectory, respectively. RTA was measured to assess a company’s technological specialization. Meanwhile, the PII and FSS, as indicated by citation frequency and family patent size, reflect impact quality and the international market strength of patents, respectively. The definitions and formulations of these indices are provided below, and they are accompanied by Figure 1 which illustrates the patent data analysis procedure.

Figure 1.
Patent data analysis procedure of this study.
The patent share metric reflects a company’s relative position regarding patent application competence, and it is calculated as the quotient of a company’s patent registry count divided by the total patent count across all considered entities, as illustrated in Equation (1) [38]. For this analysis, all considered entities are defined as the 40 leading ALD patent-holding companies identified in the search phase.
where N = number of total patents, and = number of company i’s patents.
The CAGR over n years was derived from the n-square root of the total growth factor, as presented in Equation (2) [39]. This calculation elucidates the growth rate of a company’s ALD patent registry count over a specified period, where encompasses the number of years between a company’s initial ALD patent registration and the end of the study period (i.e., 2022).
The RTA elucidates the dimension of technological specialization by illustrating the technological domains in which a corporation predominantly focuses its innovative efforts. It represents an effective metric for gauging the status of a corporation’s technological concentration, as illustrated in Equation (3) [40]. This index is based on the number of ALD patents and all technology field patents that a company procures within a designated timeframe. The numerator in Equation (3) encapsulates the proportion of patents that are registered by company i for technology j of the aggregate patents of all 40 companies for technology j, which is ALD technology in the present study. Meanwhile, the denominator in Equation (3) represents the proportion of patents that are registered by company i of the aggregate patents of all 40 companies across all technology fields, not just for technology j [40].
The forward citation count for a patent is the number of subsequent patents that cited the patent. Generally, this indicates the influence of the technology represented by the patent in a manner similar to a research article’s ‘impact factor’. Existing studies suggest that having a higher forward citation count correlates with a greater influence of the patent [41]. This concept of the forward citation count for a patent can be extended to a company’s patent portfolio. The PII of company i is derived from a comparison of the average number of citations of patents in company i’s patent portfolio to the average number of citations of patents in all companies’ patent portfolios [41]. The PII can indicate the impact of a company’s patent portfolio in a specific technology field. In this study, we calculated the PII of ALD patents for each of the 40 leading companies using the following equation:
where forward citation number for the patent portfolio for company k, and = number of patents for the patent portfolio for company k.
A patent family is a collection of patent applications that are filed in multiple countries that cover the same or similar technical content. The family size of a patent is defined as the number of countries in which patent applications for the same invention have been applied. Extant studies argue that the value of international patents is associated with the geographical scope of patent protection because having sought patent protection in a higher number of jurisdictions can provide a company with a competitive edge [42]. The family size of the company’s patent portfolio is therefore considered to be a key index of its international patent competitiveness [43]. This study devised the FSS for company i, which is calculated as the quotient of company i’s ALD patent family size divided by the total ALD patent family size accumulated across all 40 leading companies, as illustrated in Equation (5).
3.3. Strategic Matrix Analysis
The strategic matrix model is a tool that is used to evaluate and analyze different business portfolios based on two key performance indicators [41]. The two axes of this model represent the two indicators that are used for this analysis, and they can be used to categorize the matrix plane into four quadrants based on high and low performance levels for each indicator. The two axes are chosen based on whether it is useful to consider the performance indicators together. For example, the BCG (Boston Consulting Group) matrix is a renowned strategic matrix model designed to assess the strategic positioning of a company’s brand portfolio based on two key performance indicators: current market share and future market growth rate. Analysis of how a company’s portfolio is distributed across the four quadrants of the strategic matrix helps the company to reorganize its existing portfolio or make new plans to allocate resources.
In this study, it was determined that if patent indicators are highly correlated, a multifaceted evaluation of the various competencies of a patent portfolio is possible by analyzing the two correlated indicators simultaneously. Accordingly, two performance indicators with a high correlation coefficient are selected as the two axes of our strategic matrix, the so-called patent competence matrix. As Table 1 shows, five pairs of correlated indicators with a correlation coefficient of 0.2 or higher, which was calculated using 5460 patents held by 40 leading global companies, were selected for composing the patent competence matrix from the possible 15 pairs of the 6 patent indicators, entry year, patent share, CAGR, RTA, PII, FSS.

Table 1.
Patent competence matrix.
4. Research Results
4.1. Longitudinal Study—Leadership Change Analysis of ALD Patents
4.1.1. ALD Patents of 40 Leading Companies
As Table 2 shows, the average proportion of the ALD patents of 40 leading companies over the total ALD patents during the study period was 64.2%, and the patent proportion of the 40 companies in the total ALD patents was at least 48.5% in 2017 and 92.9% in 2007.
Table 2.
Registered ALD patents of total entities vs. 40 leading companies.
Figure 2 illustrates a discernible trend that arises when aggregating the annual ALD patent filings from these 40 primary entities over the 20-year study period, from 2003 to 2022, segmented into four quintennial phases. An initial surge in patent registrations is evident from 2003 to 2007 (Phase 1), followed by a decline in 2008, and subsequent stagnation until 2012 (Phase 2). The subsequent phase, spanning 2013 to 2017, is characterized by a stagnation in filings with small fluctuations (Phase 3), before a pronounced resurgence is seen in patent registrations from 2018 to 2022 (Phase 4).

Figure 2.
The trend in the number of ALD patent registrations by year.
Table 3 shows the patent indices of the ALD companies investigated in our study. It can be seen from the table that the five most prolific entities in ALD patent filings over the last two decades are Samsung, TEL, SK Hynix, AMAT, and TSMC. These top five companies contributed to more than half (50.4%) of all patent filings among the 40 leading ALD patent enterprises. Moreover, as presented in Table 3, 26 out of 40 companies started to register one or more ALD patents between 2003 and 2007. The present study categorized these 26 companies as early entrants, while the remaining 14 companies were classified as late entrants. Ten of these late entrants marked their entry into the patent market during the second period, followed by three entrants in the third period, and a single entrant in the fourth period.
Table 3.
ALD patent data for 40 companies.
4.1.2. ALD Patent Catch-Up Analysis from the Country Perspective
This study required the classification of leading companies by country to analyze the competitiveness of each country in ALD patents. Some of the companies in the study are multinational companies. Their ALD production or R&D facilities may be located in multiple countries. Still, the top 40 companies were classified by country, taking into account the location of their headquarters and major facilities. These top-tier ALD technology companies were distributed across six nations. The patent registrations regarding ALD technology within each country were scrutinized accordingly. Upon comparing the aggregate patent counts, as depicted in Table 3, South Korea emerged as the frontrunner in the study period, with ten companies holding 1892 patents. The US ranks second, with eight companies holding 1295 patents. Japan ranks third, with 13 companies holding 1144 patents, while the EU ranks fourth, with four companies holding 515 patents. The fifth and sixth ranks, respectively, go to Taiwan, with two companies holding 445 patents, and China, with three companies holding 169 patents.
Table 4 further delineates the annual number of registered ALD patents as well as the patent share by country, thus highlighting the annual patent registrations of each nation. Over the 20 years from 2003 to 2022 there were significant fluctuations in the numbers of ALD patent registrations by the 40 leading companies across the six nations. Specifically, while South Korea stood out in terms of its total number of patents, its average annual growth rate of 21.9% over these two decades was the lowest among the six countries, culminating in a patent share of merely 13.8% in 2022, the final year of the study period, which ranked third among the six contenders. Conversely, the US exhibited remarkable growth, increasing from only four registered patents in 2003 to 216 out of 549 patents registered in 2022, boasting a cumulative CAGR of 35.6% over the two decades and securing the highest patent share of 39.3% in 2022. Taiwan and China have the top two highest 20-year CAGRs of 40.3% and 40.8%, respectively. However, they, respectively, rank fifth and sixth in terms of patent share even in 2022, the last year of the study period.
Table 4.
ALD patent statistics by country and subindustry.
This study subdivided the 20-year study period into four phases to track changes in ALD patent registrations. As Figure 3 shows, which is based on Table 4, in the initial phase, from 2003 to 2007, South Korea emerged as the definitive leader, securing a patent count more than four times that of Japan, the US, Taiwan, Europe, and China combined, with the US and Japan competing for second place. The second phase, from 2008 to 2012, showed a pronounced surge for Japan, as it overtook the US in 2009 to definitively secure second-place standing during this phase. Japan took first place in 2013, the starting point of the third phase, then dropped to second in 2014 before holding the top spot until 2017. South Korea also succumbed to competitive pressure from Japan and the US, causing South Korea to drop to third in patent counts, although it briefly returned to the lead in 2014. Finally, in the fourth phase, from 2018 to 2022, the US solidified its dominance, seizing the first rank for the first time in 2018 and increasing its patent quota from 26.9% in 2018 to 39.3% by 2022, thus widening its lead. During this period, Japan, South Korea, the EU, and Taiwan competed for sub-leading positions, with frequent changes in the second, third, fourth, and fifth spots regarding patent tallies. Despite its delayed entry into this competitive arena, China has made substantial efforts to narrow the gap; nonetheless, by the end of the study period (2022), its patent achievements remained notably below those of the top five contenders.

Figure 3.
Comparisons of country-level ALD patents.
4.1.3. ALD Patent Catch-Up Analysis from the Subindustry Perspective
Next, this study further investigates the competition for patent leadership among companies related to the semiconductor industry by classifying the 40 leading companies into three categories based on their industry affiliations, i.e., chipmakers, equipment companies, and material suppliers. Table 4 presents the number of registered patents of each subindustry over the 20-year study period. Upon comparing the cumulative numbers of patents within each subindustry over the two decades in question, chipmakers emerged as the leading subindustry, with 20 companies amassing 2940 patents, accounting for 53.8% of the patent share. Equipment companies ranked a clear second, with 14 companies registering 2221 patents, thus representing 40.7% of the patent share.
There were dynamic shifts in the patent leadership landscape across these three subindustries from 2003 to 2022, as illustrated in Table 4 and Figure 4. In 2003, at the outset of the entire study period and the beginning of the first phase, chipmakers dominated the other subindustries in terms of patent holdings with a 91.1% share. However, beginning in the second phase, equipment companies accelerated their catch-up, leading to a rapid decline in the chipmakers’ patent share. By the start of Phase 3 in 2013, equipment companies had successfully caught up, marking the end of chipmakers’ dominance in ALD patents. By 2022, at the end of the total analysis period and the last year of the fourth phase, the patent share among chipmakers had dropped to 34.4%, falling behind the 62.7% share of equipment companies. This observation corroborates the prevailing view that recent evolutions in ALD technology are being spearheaded by equipment companies over chipmakers, with companies such as AMAT, LAM, TEL, and ASM engaging in continuous research efforts that lead to excellent patent competence in ALD technology [44].

Figure 4.
Comparisons of subindustry level ALD patents.
4.2. Comparative Study—Patent Matrix Analysis of ALD Patents
4.2.1. Entry Time and Growth Competence Matrix Analysis
Prior investigations have shown that early entry into the patent arena favorably influences a company’s ability to commercialize its products while also strengthening its technological leadership [45]. It is universally acknowledged that latecomers must accelerate their technological advancement to swiftly bridge the gap with market and technology leaders [46]. In the present analysis, companies that entered the ALD patent landscape between 2003 and 2007, demarcated as the first phase in Figure 2, were classified as early entrants. By contrast, those entering the fray post-2008 were considered to be latecomers. The median CAGR among the top 40 companies was found to be 27.5%, as indicated on the y-axis in Figure 5 and as calculated in Table 3. Consequently, companies with a CAGR exceeding 27.5% are categorized as high-growth entities, whereas those below this threshold are considered low-growth entities. The two-dimensional patent competence matrix illustrating entry timing and growth rate is shown in Figure 5. The x-axis represents the initiation timing of ALD patent registrations, while the y-axis plots the growth rate of the patent count. The Pearson correlation coefficient between entry timing and the mean annual growth rate was found to be 0.656, indicating a pronounced positive correlation, which reflects a faster growth-up process among late entrants in ALD technology.

Figure 5.
Entry time vs. CAGR by company.
In the first quadrant of the patent competence matrix, enterprises such as YMTC (26), BEIJING NMC (25), TOPPAN (33), TES (20), AIR LIQUID (17), and L.G. Chem (32) were identified as late entrants showing significant growth rates in the ALD patent arena. Aside from YTMC (2) and Eastman (29), all companies in the first quadrant predominantly operate within the equipment or material sector. Despite their late entry, these entities have demonstrated robust growth in the ALD patent domain, thereby fulfilling the prerequisites for a successful catch-up. Companies in the second quadrant, such as TEL (2), AMAT (4), TSMC (5), ASM (6), LAM (8), KOKUSAI (12), and SEMICON MANUF (18), have maintained consistently high CAGRs, thus demonstrating sustainable competence over the past 20 years, despite their early entry into ALD patents. Companies in the third quadrant, which comprise early entrants into the ALD market, such as SK Hynix (3), Panasonic (24), and SHARP (30), encountered stagnation in their growth rates. The fourth quadrant includes late-entrant companies such as ENTEGRIS (31), Canon (39), and OSRAM (40). Their growth rates fall below the median, meaning they are lagging in terms of having a high growth rate, which is a prerequisite for a successful catch-up.
As Figure 6 illustrates, the country-wise analysis revealed that the first quadrant includes three companies from South Korea, one from the US, two from the EU, two from Japan, and two from China. Notably, despite only having three companies among the forty leading companies, China has two companies in the first quadrant, underscoring their swift catch-up despite their late market entry. Four of the eight US companies are in the second quadrant, meaning that half of the US companies are early entrants that have been able to maintain high growth rates, thus demonstrating sustainable competence in ALD patents. Most companies in the third quadrant, which are early entrants in the ALD field that have exhibited stagnated patent growth, are from South Korea and Japan: six are from South Korea (out of ten total), and eight are from Japan (out of thirteen total).

Figure 6.
Entry time vs. CAGR by country.
When scrutinizing the two-dimensional patent matrix by subindustry, as depicted in Figure 7, it can be seen that four out of six material suppliers are in the first quadrant. From this, we can conclude that material suppliers are typically late entrants to the ALD market but that they then show high growth rates. Conversely, more than half of the third quadrant is populated by chipmakers (13 out of 20), meaning they were typically early entrants to the ALD sector but then experienced stagnant growth.

Figure 7.
Entry time vs. CAGR by subindustry.
4.2.2. Quantitative and Impact Competence Matrix Analysis
In the existing literature, PII, which is calculated by the number of forward citations, is used to evaluate the influence of individual patents or patent portfolios held by specific organizations, interpreting patents with high technical influence as having high patent quality [47]. In the present investigation, we constructed a two-dimensional patent matrix with patent share on the x-axis and PII on the y-axis, as Figure 8 depicts, to determine whether the top 40 companies exhibited quantitative and impactful competitive strengths in ALD patents. The median patent share and PII for ALD patents were found to be 1.15% and 0.411, respectively (Table 3). Among the 40 companies analyzed, 15 are positioned in the first quadrant of Figure 8, 5 are in the second quadrant, 15 are in the third quadrant, and 5 are in the fourth quadrant. The Pearson correlation coefficient of 0.341 between patent share and PII suggests a modest yet positive correlation, indicating that there is a meaningful association between the quantitative and impact metrics.

Figure 8.
Patents share vs. PII by company.
As Figure 8 shows, companies in the first quadrant are interpreted as having relatively many patents with high technological influence. This quadrant contains 15 companies, including TEL (2), AMAT (4), ASM (6), TSMC (5), LAM (8), and MICRON (7). Companies in the second quadrant, which includes five companies, such as ENTEGRIS (31) and Eastman (27), have a relatively small number of patents but a high patent impact. A total of 15 companies in the third quadrant, such as Canon (39), OSRAM (40), Hitachi (38), Resonac (37), and BEIJING NMC (25), have relatively weak patent performance regarding both quantity and the impact of ALD technology. Finally, companies with many patents but low patent influence appear in the fourth quadrant, which contains five companies, including SK Hynix (3) and DB Hitek (15). They are urged to elevate the impact quality of their patents to increase their competitiveness.
The US, with six of the eight companies in the first quadrant of Figure 9, demonstrates high capabilities in both the quantity and impact of ALD patents. Similarly, the EU also demonstrates robust competence, with three out of its four companies being positioned in the first quadrant. By contrast, Japan displays notable competitive shortcomings in both patent quantity and PII, with the majority of its companies (eight out of thirteen) positioned in the third quadrant. On the other hand, seven out of ten Korean companies are in the third and fourth quadrants, which means their patents have a low patent influence.

Figure 9.
Patents share vs. PII by country.
Figure 10 presents the subindustry analysis, which shows that six out of twenty chipmakers, seven out of fourteen equipment companies, and two out of six material suppliers occupy spots in the first quadrant, which highlights that equipment companies show relatively high quantitative strength and impact strength in ALD technology compared to chipmakers. Remarkably, a significant fraction of chipmakers—8 out of 20—reside in the third quadrant, meaning they trail significantly in both competitive measures. As for the six material suppliers, they show a polarization in competency, with two in the first quadrant and three in the third quadrant.

Figure 10.
Patents share vs. PII by subindustry.
4.2.3. Technology Specialization and Impact Competence Matrix Analysis
According to the extant literature, the more specialized a patent for a particular technology is, the higher the technology concentration, allowing companies to focus their capabilities through specialized technological innovation [41]. This study examined ALD patents using a two-dimensional patent matrix with RTA, which is an effective metric for measuring the corporation’s technological concentration, and PII as the x-axis and y-axis, respectively. The Pearson correlation coefficient between RTA and PII is 0.204, indicating a weak but positive correlation. As shown in Table 3, the median values for RTA and PII for ALD patents are 1.149 and 0.411, respectively.
As Figure 11 shows, companies that are located in the first quadrant, such as ASM (6), AMAT (4), INTERMOLECULAR (13), LAM (8), ENTEGRIS (31), Eastman (27), TEL (2), and MICRON (7), exhibit high competence in both the specialization and impact indicators of ALD technology. Conversely, companies in the second quadrant, such as TSMC (5), Intel (11), and G.F. (9), have above-average PII indices yet below-par RTA indices compared to those in the first quadrant, thus indicating a need for enhanced specialization. The third quadrant includes 13 companies, such as DB Hitek (15), L.G. Chem (32), Panasonic (24), and Canon (39), which trail in both ALD technological specialization and patent impact quality. Finally, companies that are located in the fourth quadrant have superior ALD expertise but low patent influence.

Figure 11.
RTA vs. PII by company.
As Figure 12 depicts, in terms of geographical distribution, five of the US’s eight companies are located in the first quadrant, as are three of the EU’s four companies, meaning that both regions demonstrate superior patent specialization and impact competence compared to other countries. By contrast, Japan shows weaknesses in both technological specialization and impact competence, as evidenced by the positioning of seven of its thirteen companies in the third quadrant.

Figure 12.
RTA vs. PII by country.
The analysis by subindustry shown in Figure 13 indicates a stark discrepancy in technological specialization and impact competence among chipmakers, equipment companies, and material suppliers. In particular, equipment companies are competitive in these two metrics, with 8 of the 14 equipment companies positioned in the first quadrant. Meanwhile, chipmakers show low technological specialization, with seven companies positioned in the second quadrant and nine companies positioned in the third quadrant, indicating that such companies show a weakness in terms of pursuing ALD technology specialization.

Figure 13.
RTA vs. PII by subindustry.
4.2.4. Quantitative and International Competence Matrix Analysis
In this section, technological competence within a specific technological domain is assessed using the following two metrics: the quantitative and international competency of a company’s patent portfolio. Using a two-dimensional patent matrix, we plotted a company’s patent share on the x-axis against the FSS of its patents—which represents the international competence of its patent portfolio—on the y-axis in Figure 14. As listed in Table 3, the median patent share and FSS for ALD patents are 1.15% and 1.0%, respectively. The Pearson correlation coefficient of 0.932 between patent share and FSS suggests a very high positive correlation, signifying a very strong association between quantitative and international competence.

Figure 14.
Patent share vs. FSS by company.
Figure 14 reveals insights into the patent competence matrix related to these two metrics. A total of 16 companies are positioned in the first quadrant, 5 in the second quadrant, 15 in the third quadrant, and 4 in the fourth quadrant. Notably, companies that are located in the first quadrant, such as TEL (2), Samsung (1), AMAT (4), TSMC (5), SK Hynix (3), ASM (6), LAM (7), and MICRON (8), exhibit both high quantitative and international competence. Companies in the second quadrant, such as Panasonic (24), also exhibit noteworthy international competence, albeit with lower patent shares than those in the first quadrant. The 15 companies in the third quadrant, such as Canon (39) and OSRAM (40), exhibit weaknesses in both quantitative and international competence. Lastly, companies in the fourth quadrant, such as KC TECH (14), JUSUNG (16), and SEMICON MANUF (18), are quantitatively competitive, but they suffer from stunted international competence when compared with their counterparts in the first quadrant.
An analysis by country, which is illustrated in Figure 15, shows a varied distribution of the 40 corporations across quadrants. The first quadrant houses six of the eight companies from the US, thus highlighting the strength of many US companies in ALD technology in terms of both quantitative and international competence. In stark contrast, the third quadrant is predominantly occupied by Japanese companies, with 8 out of its 13 companies being positioned in the quadrant, thus indicating a lag in both quantitative and international competence among these companies when compared to their counterparts. Lastly, China’s strategic positioning—with two companies in the third quadrant and one in the fourth—signals that it is not closing the international competence gap with companies from other countries.

Figure 15.
Patent share vs. FSS by country.
According to the subindustry analysis in Figure 16, six out of fourteen equipment companies are in the first quadrant, whereas five are in the third quadrant. Meanwhile, eight out of twenty chipmakers are in each of the first and third quadrants, respectively. Therefore, there is a similarity between equipment companies and chipmakers in terms of the ratio of companies with strong and weak competitiveness regarding both quantitative and international competence. However, when we look at companies in the second and fourth quadrants, there is a subtle difference between chip manufacturers and equipment manufacturers. Chip manufacturers have three companies in the second quadrant, indicating that their quantitative competence is relatively low. In comparison, equipment manufacturers have three companies in the fourth quadrant, indicating that their international competence is relatively low.

Figure 16.
Patents share vs. FSS by subindustry.
4.2.5. Impact and International Competence Matrix Analysis
In this section, we constructed a two-dimensional patent matrix with PII on the x-axis and FSS on the y-axis, as Figure 17 depicts, to assess the impact and international competitive strength of ALD patents among the top 40 companies. Among the 40 scrutinized companies, 16 are positioned in the first quadrant of Figure 17, 4 are in the second quadrant, 16 are in the third quadrant, and 4 are in the fourth quadrant. The Pearson correlation coefficient of 0.457 (Table 1) between the PII and FSS suggests a modest positive correlation, signifying a meaningful association between impact and international competence.

Figure 17.
PII vs. FSS by company.
The first quadrant of Figure 17, which is defined by high values in both PII and FSS, comprises companies that possess not only a high number of patents but also notably high international strength. This quadrant includes 16 companies, including Samsung (1), TEL (2), AMAT (4), ASM (6), TSMC (5), Lam (7), and MICRON (8). Notably, AMAT (4), ASM (6), and TEL (2), which are positioned at the upper right, are further distinguished by their strong international patent portfolios and superior patent impact quality. The four entities in the second quadrant, including SK Hynix (3) and Panasonic (24), exhibit high international caliber in their patents but lack patent impact quality. The third quadrant is made up of companies, such as Canon (39), TES (20), and NCD (29), that are competitively weak in terms of both the impact and international strength of their ALD technology patents. Meanwhile, the four companies in the fourth quadrant, including Eastman (27) and SHARP (30), are characterized by robust patent impact quality but below-average international metrics; these companies are encouraged to elevate the international strength of their patents.
Figure 18 reveals that seven of the eight US companies fall within the first quadrant, indicating high international strength and impact in terms of ALD patent competence. Similarly, the EU demonstrates robust competence in these two metrics, with three of its four companies occupying the first quadrant. By contrast, Japan exhibits notable competitive shortcomings, with six out of its thirteen companies in the third quadrant. China also shows relative weaknesses in this area, with all three of its companies in the third quadrant.

Figure 18.
PII vs. FSS by country.
The subindustry analysis, illustrated in Figure 19, shows that out of the top 40 companies, 7 out of 20 chipmakers, 6 of 14 equipment companies, and 3 of the 6 material suppliers are positioned in each of the first and third quadrants, respectively. These figures indicate that the ALD companies of each subindustry are evenly distributed across the simultaneously strong and weak quadrants in terms of international competence and patent impact quality.

Figure 19.
PII vs. FSS by subindustry.
5. Discussion and Conclusions
5.1. Theoretical Implications and Discussions
This study explored the phenomenon of technology catch-ups and leadership changes across companies, countries, and subindustries among the top 40 influential entities in the chipmaker, equipment, and material supplier sectors, all of which are vying for ALD patent leadership. The theoretical implications of our study are multifaceted. First, we found that traditional technology catch-ups did not happen in ALD technology at the country level. Prior investigations into cross-country technology catch-up in sectors such as the automotive, steel, and television industries have revealed that a complete leadership transition from pioneer to latecomer has occurred and that the completed catch-up cycle tends to be fixed. However, this narrative diverges significantly for ALD patents. Over the past 20 years, four distinct cycles of leadership change have emerged, which we believe reflect various geopolitical, industrial, and technological external factors. South Korea led the first phase, the second phase began with Japan challenging South Korea’s leadership, the third cycle saw Japan emerge as a leader, and the US led in the fourth cycle. On the other hand, both China and Taiwan cannot yet challenge the pre-eminence of the US and other powerful nations. The existing research that explains this difference shows that the semiconductor industry requires high barriers to entry, tacit knowledge within organizations, close cooperation within the value chain, bold government support, and bold investment. We believe that in the case of advanced process industries, there is another factor that requires the technological competencies not only to be accumulated but also to be restructured for companies to advance to the top leading position [21,48].
Second, this study created interesting results by generating five two-dimensional patent competence matrices combining two correlated indicators, which are based on the six competence indicators of patent entry timing, patent count growth, patent share, RTA, PII, and FSS. For example, a strong positive correlation of 0.932 between patent share and FSS reveals that companies with a high patent share in ALD technology tend to have stronger international patents. In addition, moderate positive correlations of 0.341, 0.204, and 0.457 were observed between PII and patent share, RTA, and FSS, respectively. The correlation-based matrix analysis method revealed that two correlated indicators have a synergistic effect on patent competence, showing that this method allows for a more effective analysis of a company’s patent portfolio. Previous studies also claimed that four patent indicators, including PII, patent share, RTA, and FSS, are correlated, and this study expands on this [49,50]. In addition, this method can aggregate the competences of companies and expand it to a means of analysis by country and subindustry level so that it can be expanded to a competence analysis between countries and industries.
Third, using correlation-based matrix analysis, we were able to identify companies that demonstrated consistent leadership in most of the various competence indicators in the field of ALD technology patents during the study period. As shown in Table 1, among the five proposed patent competence matrices, with the exception of the Entry Time and Growth Competence Matrix, which is used for longitudinal analysis of catching-up and leadership change, all four patent matrices consist of a combination of four indicators, RTA, patent share, FSS, and PII. We claim that the companies in the first quadrant of all four patent matrices have demonstrated consistent capabilities across the four competence indicators, demonstrating ALD technology leadership over the past 20 years. As a result, we find that the following nine companies are the leading companies in the ALD patent field: TEL (2), AMAT (4), ASM (6), MICRON (7), LAM (8), WONIK (10), KOKUSAI (12), INTERMOLECULAR (13), and AIR LIQUID (17).
5.2. Managerial and Policy Implications
This study provides valuable managerial and policy implications on multiple fronts. Firstly, a breakdown of the last 20 years into four phases shows that the leading companies, countries and subindustries in the ALD patent race have undergone significant changes. This finding implies that aggressive patenting and new technology development in ALD, which is a field of growing importance, are essential for existing leading companies, developed countries, and emerging companies and countries. In particular, as shown in this study, companies with various patent competencies, such as quantitative, impact, technology specialization, and international, are more likely to succeed in catching up or maintaining leadership, whether they are early or late entrants, general IT companies, or ALD-specialized companies.
Secondly, we observed that the nine leading patent powerhouses in ALD technology are positioned in the first quadrant across all four two-dimensional matrices based on the four correlated metrics of PII, RTA, FSS, and patent share. We focused on the fact that the patent impact metric, PII, has an interesting positive correlation with each of the three other patent metrics, patent share, RTA, and FSS, which implies that companies with impact (i.e., PII) ALD patent portfolios tend to simultaneously have a high patent share, RTA, and FSS in their patent portfolio. Therefore, we suggest that companies seeking to increase their competence in ALD patent portfolio creation should allocate resources toward increasing their high-impact competence in ALD patents, as measured by PII. This strategy is expected to improve not only the impact quality of their patents but also their quantitative, technology specialization, and international competencies in ALD patents.
Lastly, this study reveals that technology catch-up has notably evolved among different subindustry levels, which gives the following implications to industrial leaders and policymakers. The chipmakers initially led in the first and second phases and then competed fiercely with equipment companies in the third phase until equipment companies successfully achieved catch-up in the fourth phase. It is necessary to acknowledge that semiconductor equipment companies, as opposed to chipmakers, have recently become key players in ALD technology. Equipment companies have transcended their prior position of merely responding to chipmaker demands, and they are now leading the frontier of ALD process technology. The relative advantages held by the US and EU entities, which include leading equipment companies, play a pivotal role in the international competitive landscape. Therefore, equipment companies should aim to continue to innovate and safeguard their technological advantages. On the other hand, chip manufacturers, which have been in a dominant position in the manufacturing and financial capacities, should make targeted R&D investments to compete with or overtake equipment companies and should also consider vertical integration or promoting cooperation with leaders of small and medium-sized equipment companies, academia, and public research institutes in their value chain, along with strategies to improve the quality of patents.
5.3. Limitations
The limitations of this study are as follows. By focusing solely on inter-company competition and technology leadership, we eliminated 3406 patents that were registered by non-corporate entities such as universities and research institutions. However, the top 40 companies analyzed in this study held 5460 patents, accounting for approximately 64.2% of all 8506 patents registered during the study period. Therefore, we determined that the sole inclusion of these 40 companies would not unduly skew the patent data. Future studies could incorporate non-corporate entities; however, such entities may also emphasize cooperation or complementarity rather than competition, which is an interesting extension of the theme of this study.
Another limitation is that this study’s reliance on RTA, PII, and FSS for patent quality assessment may have constrained the full spectrum of competence insights. Future explorations could integrate indices such as the patent activity index and current impact index [51] to elucidate further the technological competencies and strategic competitive positioning of companies with influential patents.
Moreover, gaining competence through patents depends not only on patent holdings but also on patent utilization, such as product exploitation or licensing. Since companies do not consistently disclose their patent utilization externally, it would not be easy to obtain meaningful data on the scale and scope of patent utilization in the semiconductor industry or process technology sector. However, one possible approach would involve tracing the utilization of patents in regulated industries, such as the pharmaceutical industry, which consistently disclose their patent utilization externally. It would be a particularly interesting research topic to study leading companies in regulated industries and analyze data on patent utilization for new product development among patents held by regulatory agencies such as the FDA.
Author Contributions
Conceptualization, H.L.; Methodology, S.L.; Software, S.L.; Formal analysis, S.L. and H.L.; Resources, H.L.; Data curation, H.L.; Writing—original draft, S.L.; Writing—review & editing, H.L. All authors have read and agreed to the published version of the manuscript.
Funding
This research received no external funding.
Institutional Review Board Statement
Not applicable.
Informed Consent Statement
Not applicable.
Data Availability Statement
The original contributions presented in this study are included in the article. Further inquiries can be directed to the corresponding author.
Conflicts of Interest
The authors declare no conflict of interest.
References
- Kamal, K.Y. The Silicon Age: Trends in Semiconductor Devices Industry. J. Eng. Sci. Technol. Rev. 2022, 15, 110–115. [Google Scholar] [CrossRef]
- Leskelä, M.; Ritala, M. Atomic Layer Deposition (ALD): From Precursors to Thin Film Structures. Thin Solid Films 2002, 409, 138–146. [Google Scholar] [CrossRef]
- Bown, C.P. The US–China Trade War and Phase One Agreement. SSRN Electron. J. 2021. [Google Scholar] [CrossRef]
- Varas, A.; Varadarajan, R.; Goodrich, J.; Yinug, F. Government Incentives and US Competitiveness in Semiconductor Manufacturing. 2020. Available online: https://www.eusemiconductors.eu/sites/default/files/uploads/20200916_GovIncentivesUSCompinSCManufacturing.pdf (accessed on 5 January 2025).
- Li, Y. From Classic Failures to Global Competitors: Business Organization and Economic Development in the Chinese Semiconductor Industry. Available online: https://www.researchgate.net/profile/Yin-Li-9/publication/304581717_From_Classic_Failures_to_Global_Competitors_Business_Organization_and_Economic_Development_in_the_Chinese_Semiconductor_Industry/links/577c04da08ae213761cab7bc/From-Classic-Failures-to-Global-Competitors-Business-Organization-and-Economic-Development-in-the-Chinese-Semiconductor-Industry.pdf (accessed on 3 January 2025).
- Maydan, D. The Future of Equipment Development and Semiconductor Production. Mater. Sci. Eng. A 2001, 302, 1–5. [Google Scholar] [CrossRef]
- Liu, Y.-Z.; Lu, W.-M.; Tran, P.P.; Pham, T.A.K. Sustainable Energy and Semiconductors: A Bibliometric Investigation. Sustainability 2024, 16, 6548. [Google Scholar] [CrossRef]
- Duan, X.; Niu, C.; Sahi, V.; Chen, J.; Wallace Parce, J.; Empedocles, S.; Goldman, J.L. High-Performance Thin-Film Transistors Using Semiconductor Nanowires and Nanoribbons. Nature 2003, 425, 274–278. [Google Scholar] [CrossRef]
- Yuan, G.; Wang, N.; Huang, S.; Liu, J. A Brief Overview of Atomic Layer Deposition and Etching in the Semiconductor Processing. In Proceedings of the 2016 17th International Conference on Electronic Packaging Technology (ICEPT), Wuhan, China, 16–19 August 2016. [Google Scholar] [CrossRef]
- Zhang, J.; Li, Y.; Cao, K.; Chen, R. Advances in Atomic Layer Deposition. Nanomanuf. Metrol. 2022, 5, 191–208. [Google Scholar] [CrossRef]
- Chen, Y.-S.; Chang, K.-C. The Relationship between a Firm’s Patent Quality and Its Market Value—The Case of US Pharmaceutical Industry. Technol. Forecast. Soc. Change 2010, 77, 20–33. [Google Scholar] [CrossRef]
- Wang, M.; He, H.; Fang, X.; Li, H. The Development Status and Future Trends of Lubricant Additives Technology: Based on Patents Analysis. PLoS ONE 2024, 19, e0304888. [Google Scholar] [CrossRef]
- Lee, K.; Ki, J. Rise of Latecomers and Catchup Cycles in the World Steel Industry. Res. Policy 2017, 46, 365–375. [Google Scholar] [CrossRef]
- Choung, J.-Y.; Hwang, H.-R.; Choi, J.-H.; Rim, M.-H. Transition of Latecomer Firms from Technology Users to Technology Generators: Korean Semiconductor Firms. World Dev. 2000, 28, 969–982. [Google Scholar] [CrossRef]
- Landini, F.; Lee, K.; Malerba, F. A History-Friendly Model of the Successive Changes in Industrial Leadership and the Catchup by Latecomers. Res. Policy 2017, 46, 431–446. [Google Scholar] [CrossRef]
- Altenburg, T.; Schmitz, H.; Stamm, A. Breakthrough? China’s and India’s Transition from Production to Innovation. World Dev. 2008, 36, 325–344. [Google Scholar] [CrossRef]
- Lee, K.; Lim, C.; Song, W. Emerging Digital Technology as a Window of Opportunity and Technological Leapfrogging: Catchup in Digital TV by the Korean Firms. Int. J. Technol. Manag. 2005, 29, 40. [Google Scholar] [CrossRef]
- Guennif, S.; Ramani, S.V. Explaining Divergence in Catching-up in Pharma between India and Brazil Using the NSI Framework. Res. Policy 2012, 41, 430–441. [Google Scholar] [CrossRef]
- Yun, J.J.; Zhao, X.; Jeong, E.; Kim, S.; Kim, K.; Hahm, S.D. The Signal of Post Catchup in Open Innovation Dynamics. Sci. Technol. Soc. 2023, 28, 151–170. [Google Scholar] [CrossRef]
- Seol, S.; Yoon, K.; Cho, D. Successful Technological Catchup Strategy: Empirical Evidence from Telecommunication Equipment Industry. IEEE Trans. Eng. Manag. 2024, 71, 11746–11757. [Google Scholar] [CrossRef]
- Wong, C.-Y.; Yeung, H.W.; Huang, S.; Song, J.; Lee, K. Geopolitics and the Changing Landscape of Global Value Chains and Competition in the Global Semiconductor Industry: Rivalry and Catchup in Chip Manufacturing in East Asia. Technol. Forecast. Soc. Change 2024, 209, 123749. [Google Scholar] [CrossRef]
- Guo, Y.; Zheng, G. Recombinant Capabilities, R&D Collaboration, and Innovation Performance of Emerging Market Firms in High-Technology Industry. IEEE Trans. Eng. Manag. 2022, 70, 2431–2446. [Google Scholar] [CrossRef]
- Rho, S.; Lee, K.; Kim, S.H. Limited Catchup in China’s Semiconductor Industry: A Sectoral Innovation System Perspective. Millenn. Asia 2015, 6, 147–175. [Google Scholar] [CrossRef]
- Chiang, M.-H. Taiwan Semiconductor Manufacturing Company: A Key Chip in the Global Political Economy. East Asian Policy 2023, 15, 36–46. [Google Scholar] [CrossRef]
- Mathews, J.A. Catchup Strategies and the Latecomer Effect in Industrial Development. New Political Econ. 2006, 11, 313–335. [Google Scholar] [CrossRef]
- Zhang, Z.; Li, X.; Xiong, J.; Yan, J.; Xu, L.; Wang, R. A Global Race to Dominate the Internet of Things: How China Caught Up. J. Bus. Strategy 2021, 43, 199–209. [Google Scholar] [CrossRef]
- Wang, F.; Chen, J.; Wang, Y.; Lutao, N.; Vanhaverbeke, W. The Effect of R&D Novelty and Openness Decision on Firms’ Catch-up Performance: Empirical Evidence from China. Technovation 2014, 34, 21–30. [Google Scholar] [CrossRef]
- Hansen, U.E.; Ockwell, D. Learning and Technological Capability Building in Emerging Economies: The Case of the Biomass Power Equipment Industry in Malaysia. Technovation 2014, 34, 617–630. [Google Scholar] [CrossRef]
- Vernon, R. International Investment and International Trade in the Product Cycle. In International Business; Routledge: London, UK, 2017; pp. 99–116. [Google Scholar] [CrossRef]
- Christensen, C.M. EXPLORING the LIMITS of the technology s-curve. part ii: Architectural technologies. Prod. Oper. Manag. 2009, 1, 358–366. [Google Scholar] [CrossRef]
- Park, K.-H.; Lee, K. Linking the Technological Regime to the Technological Catchup: Analyzing Korea and Taiwan Using the US Patent Data. Ind. Corp. Change 2006, 15, 715–753. [Google Scholar] [CrossRef]
- Breschi, S.; Malerba, F.; Orsenigo, L. Technological Regimes and Schumpeterian Patterns of Innovation. Econ. J. 2000, 110, 388–410. [Google Scholar] [CrossRef]
- Joo, S.H.; Lee, K. Samsung’s Catchup with Sony: An Analysis Using US Patent Data. J. Asia Pac. Econ. 2010, 15, 271–287. [Google Scholar] [CrossRef]
- Prahalad, C. The Core Competence of the Corporation. In Knowledge and Strategy; Elsevier: Amsterdam, The Netherlands, 1999; pp. 41–59. [Google Scholar] [CrossRef]
- Shin, J.-S. Dynamic Catchup Strategy, Capability Expansion and Changing Windows of Opportunity in the Memory Industry. Res. Policy 2017, 46, 404–416. [Google Scholar] [CrossRef]
- Seo, E.; Choung, J.; Hwang, H. The Changing Patterns of Knowledge Production of Catchup Firms during the Forging-Ahead Period: Case Study of Samsung Electronics Co. (SEC). IEEE Trans. Eng. Manag. 2019, 66, 621–635. [Google Scholar] [CrossRef]
- Ernst, H. Patenting Strategies in the German Mechanical Engineering Industry and Their Relationship to Company Performance. Technovation 1995, 15, 225–240. [Google Scholar] [CrossRef]
- Malerba, F.; Orsenigo, L. Schumpeterian Patterns of Innovation Are Technology-Specific. Res. Policy 1996, 25, 451–478. [Google Scholar] [CrossRef]
- Korotky, S.K. Semi-Empirical Description and Projections of Internet Traffic Trends Using a Hyperbolic Compound Annual Growth Rate. Bell Labs Tech. J. 2013, 18, 5–21. [Google Scholar] [CrossRef]
- Soete, L. The Impact of Technological Innovation on International Trade Patterns: The Evidence Reconsidered. In Output Measurement in Science and Technology; Elsevier eBooks: Amsterdam, The Netherlands, 1987; pp. 47–76. [Google Scholar] [CrossRef]
- Schubert, A.; Braun, T. Relative Indicators and Relational Charts for Comparative Assessment of Publication Output and Citation Impact. Scientometrics 1986, 9, 281–291. [Google Scholar] [CrossRef]
- Lanjouw, J.; Pakes, A.; Putnam, J. How to Count Patents and Value Intellectual Property: Uses of Patent Renewal and Application Data. J. Ind. Econ. 1998, 46, 405–432. [Google Scholar] [CrossRef]
- Harhoff, D.; Scherer, F.M.; Vopel, K. Citations, Family Size, Opposition and the Value of Patent Rights. Res. Policy 2003, 32, 1343–1363. [Google Scholar] [CrossRef]
- Mullen, E.; Morris, M.A. Green Nanofabrication Opportunities in the Semiconductor Industry: A Life Cycle Perspective. Nanomaterials 2021, 11, 1085. [Google Scholar] [CrossRef]
- Godfrey, R. Strategic Management; Routledge: London, UK, 2015. [Google Scholar] [CrossRef]
- Lee, K. Making a Technological Catchup: Barriers and Opportunities. Asian J. Technol. Innov. 2005, 13, 97–131. [Google Scholar] [CrossRef]
- Lee, G.K. Understanding the Timing of “Fast-Second” Entry and the Relevance of Capabilities in Invention vs. Commercialization. Res. Policy 2009, 38, 86–95. [Google Scholar] [CrossRef]
- Shivakumar, S.; Wessner, C.; Howell, T. Japan Seeks to Revitalize Its Semiconductor Industry; Center for Strategic and International Studies (CSIS): Washington, DC, USA, 2023. [Google Scholar]
- Khramova, E.; Meissner, D.; Sagieva, G. Statistical Patent Analysis Indicators as a Means of Determining Country Technological Specialisation. SSRN Electron. J. 2013. [Google Scholar] [CrossRef]
- Danish, M.S.; Sharma, R.; Dhanora, M. Impact of Patent Quality on Firm Performance: A Case of Indian Pharmaceutical Industry. Int. J. Innov. Technol. Manag. 2020. [Google Scholar] [CrossRef]
- Chen, D.-Z.; Lin, W.-Y.C.; Huang, M.-H. Using Essential Patent Index and Essential Technological Strength to Evaluate Industrial Technological Innovation Competitiveness. Scientometrics 2007, 71, 101–116. [Google Scholar] [CrossRef]
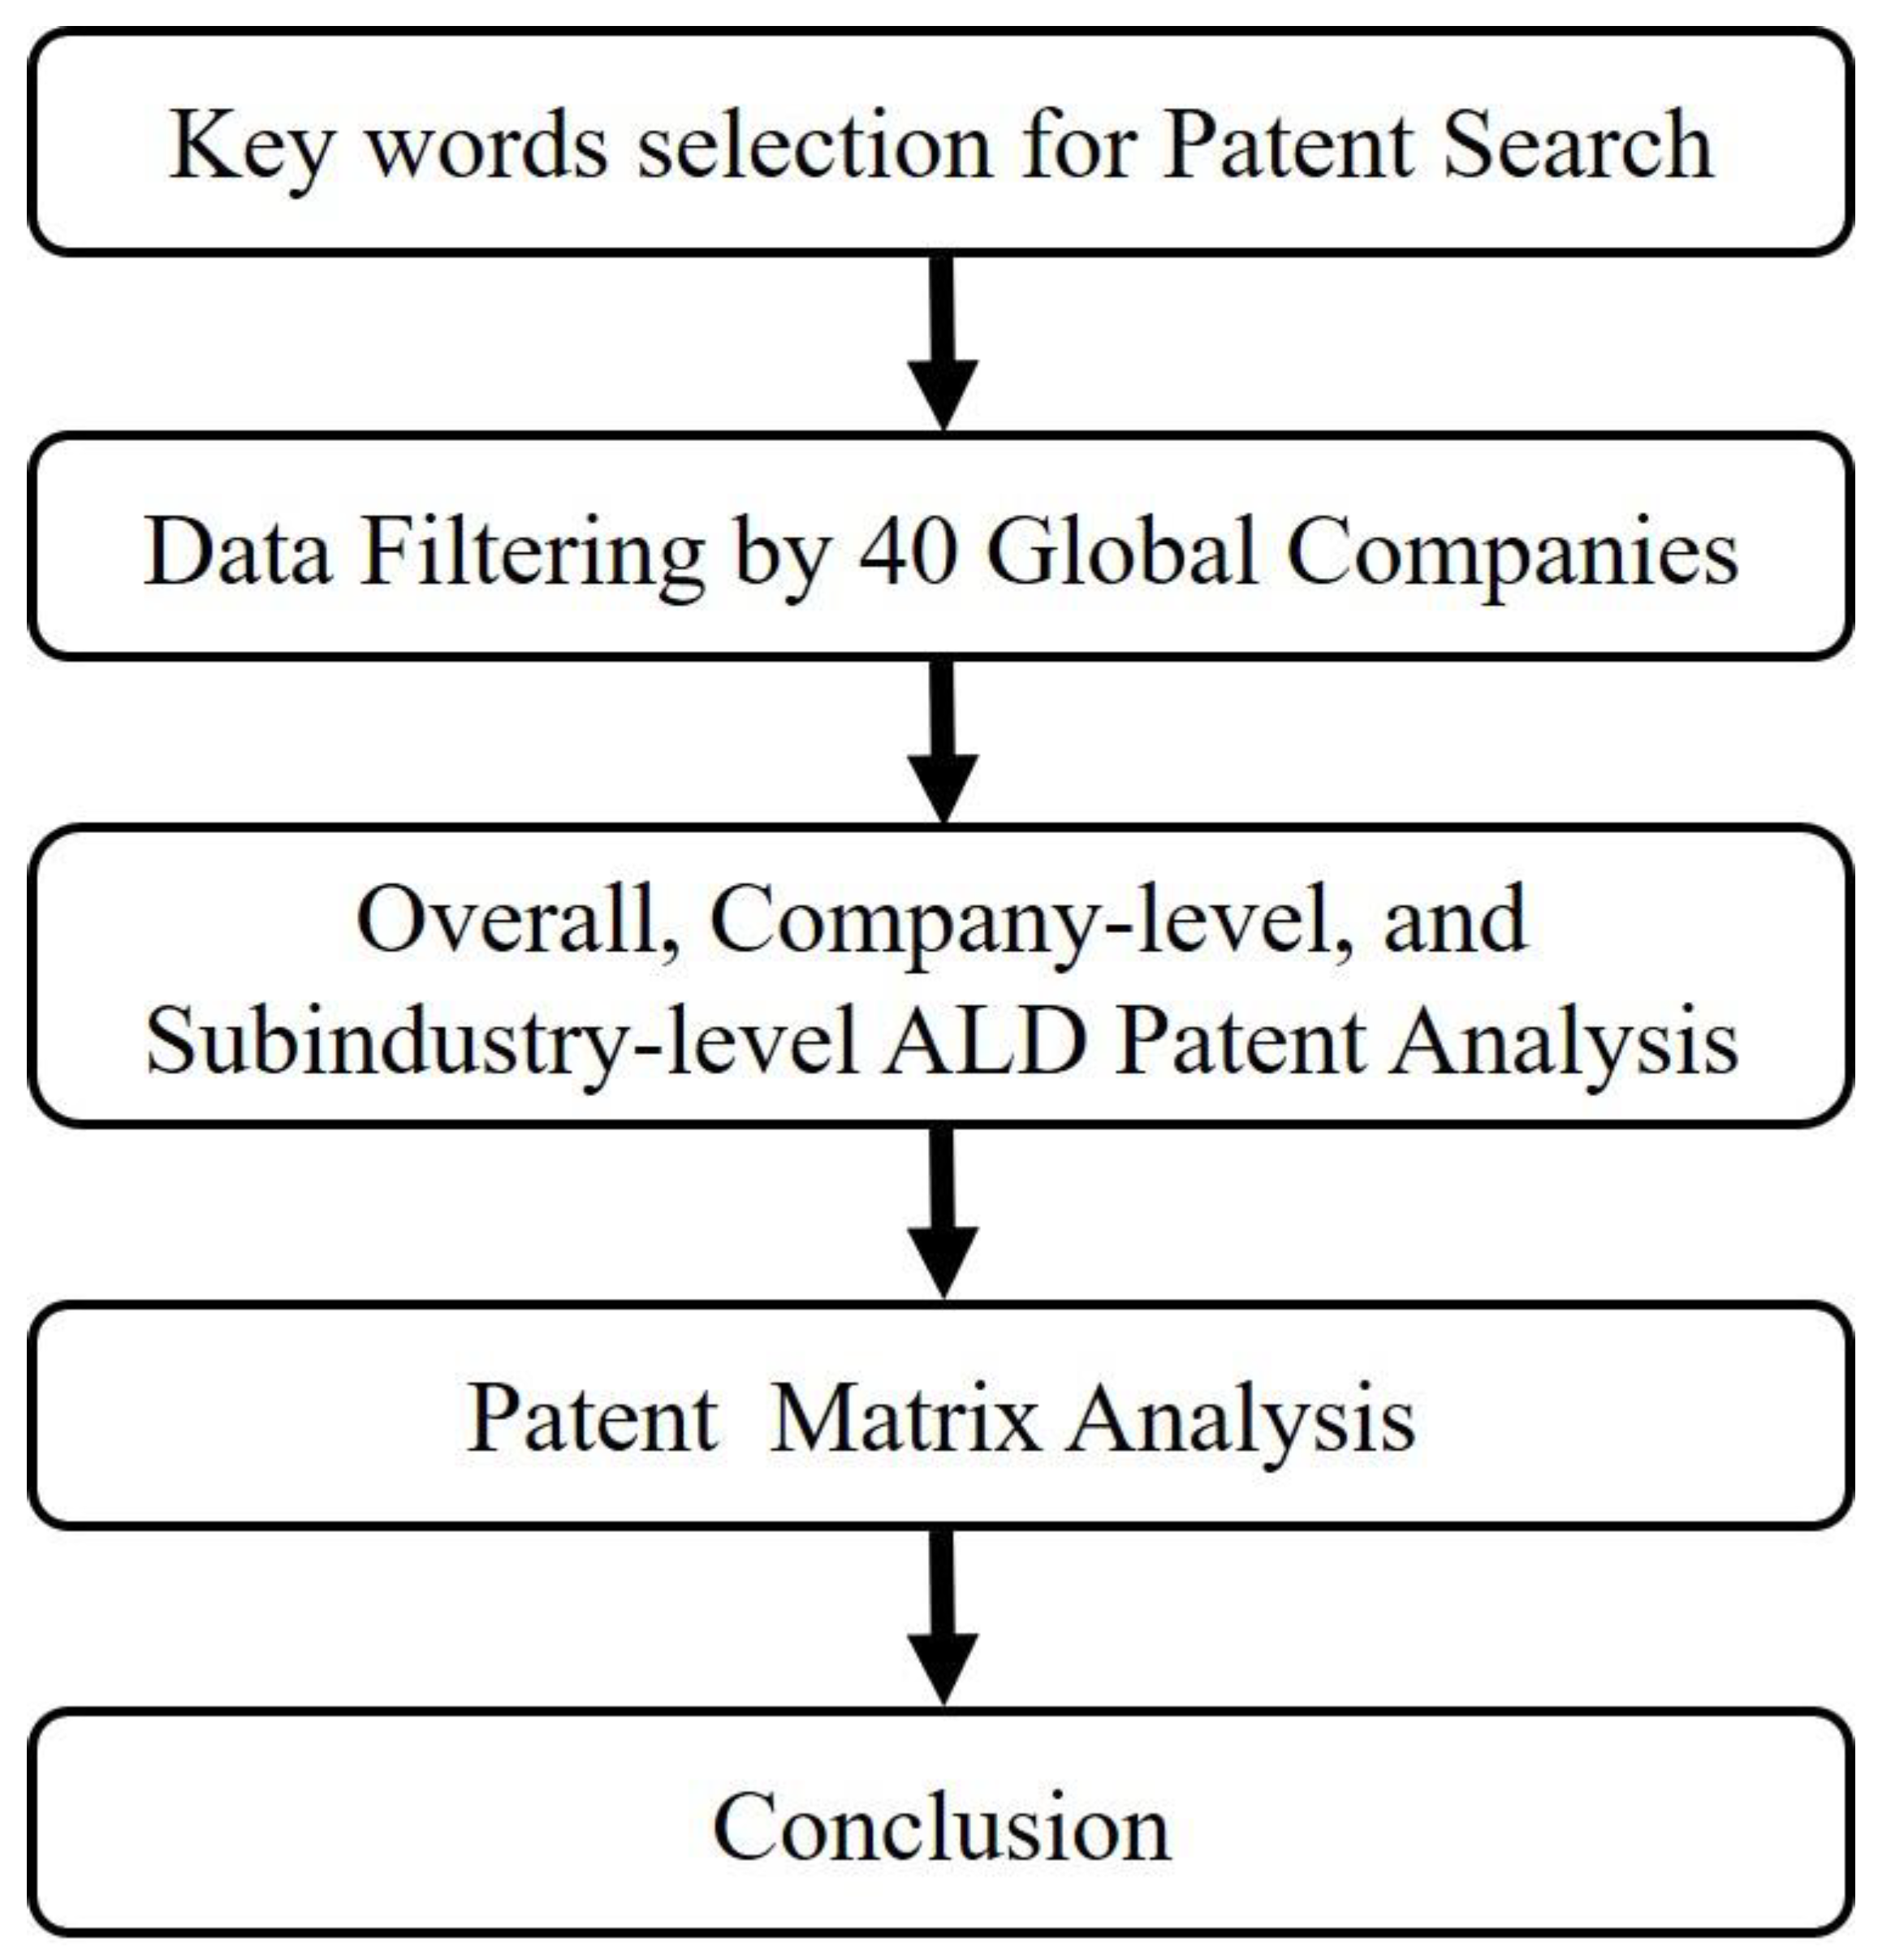

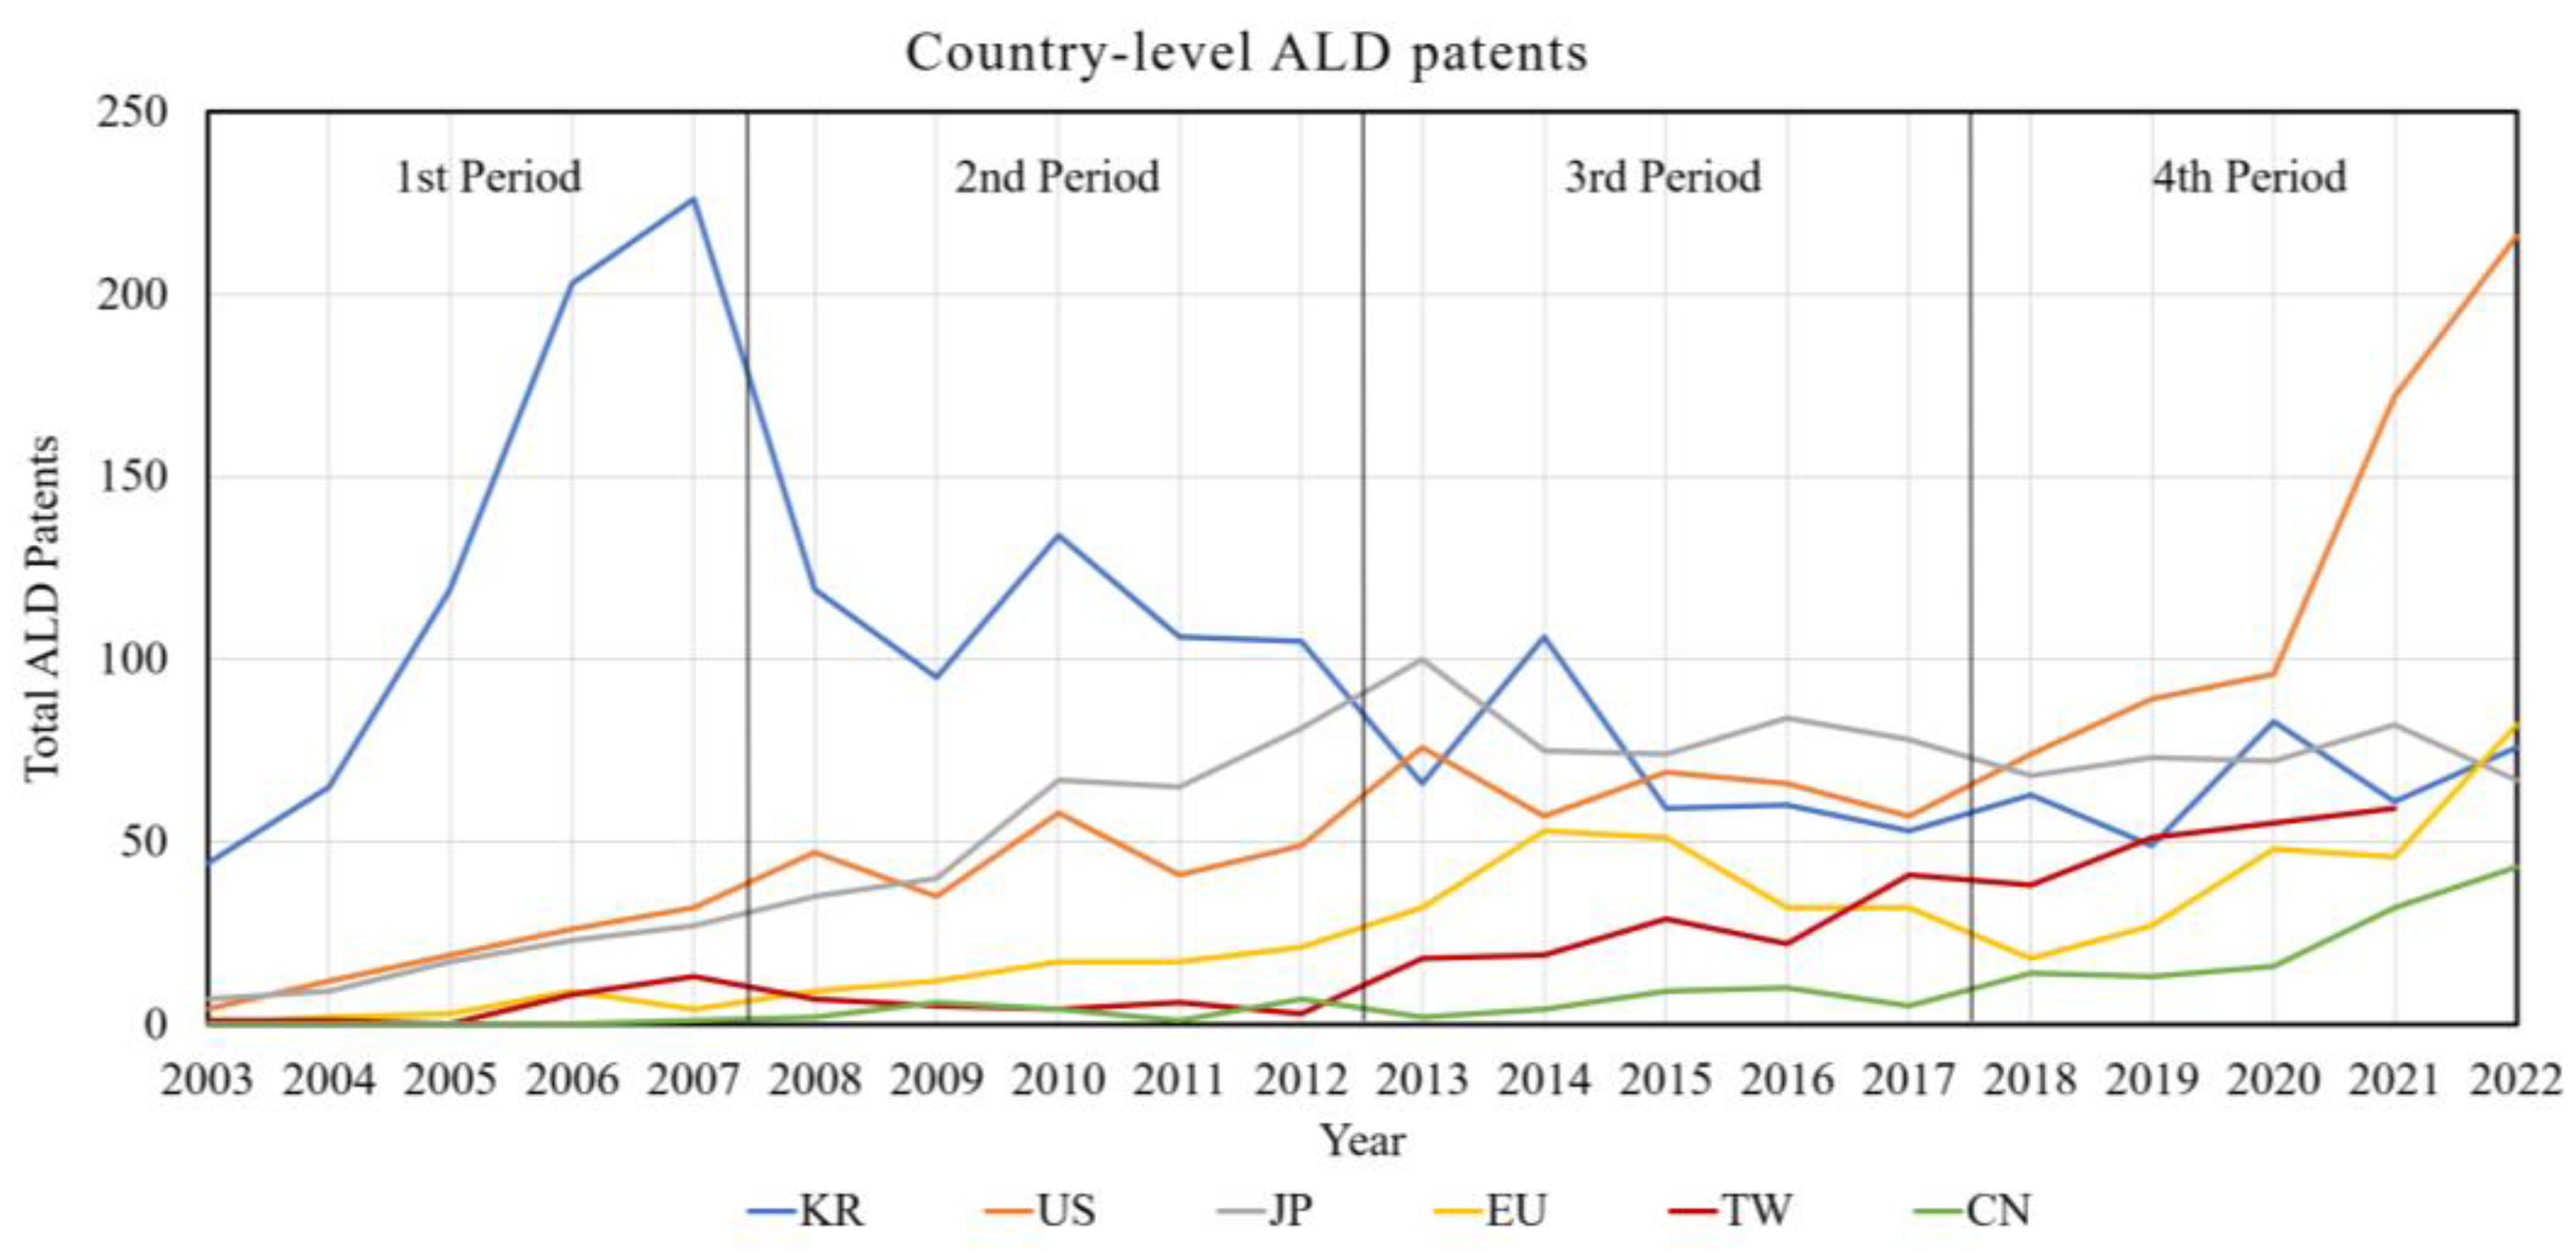

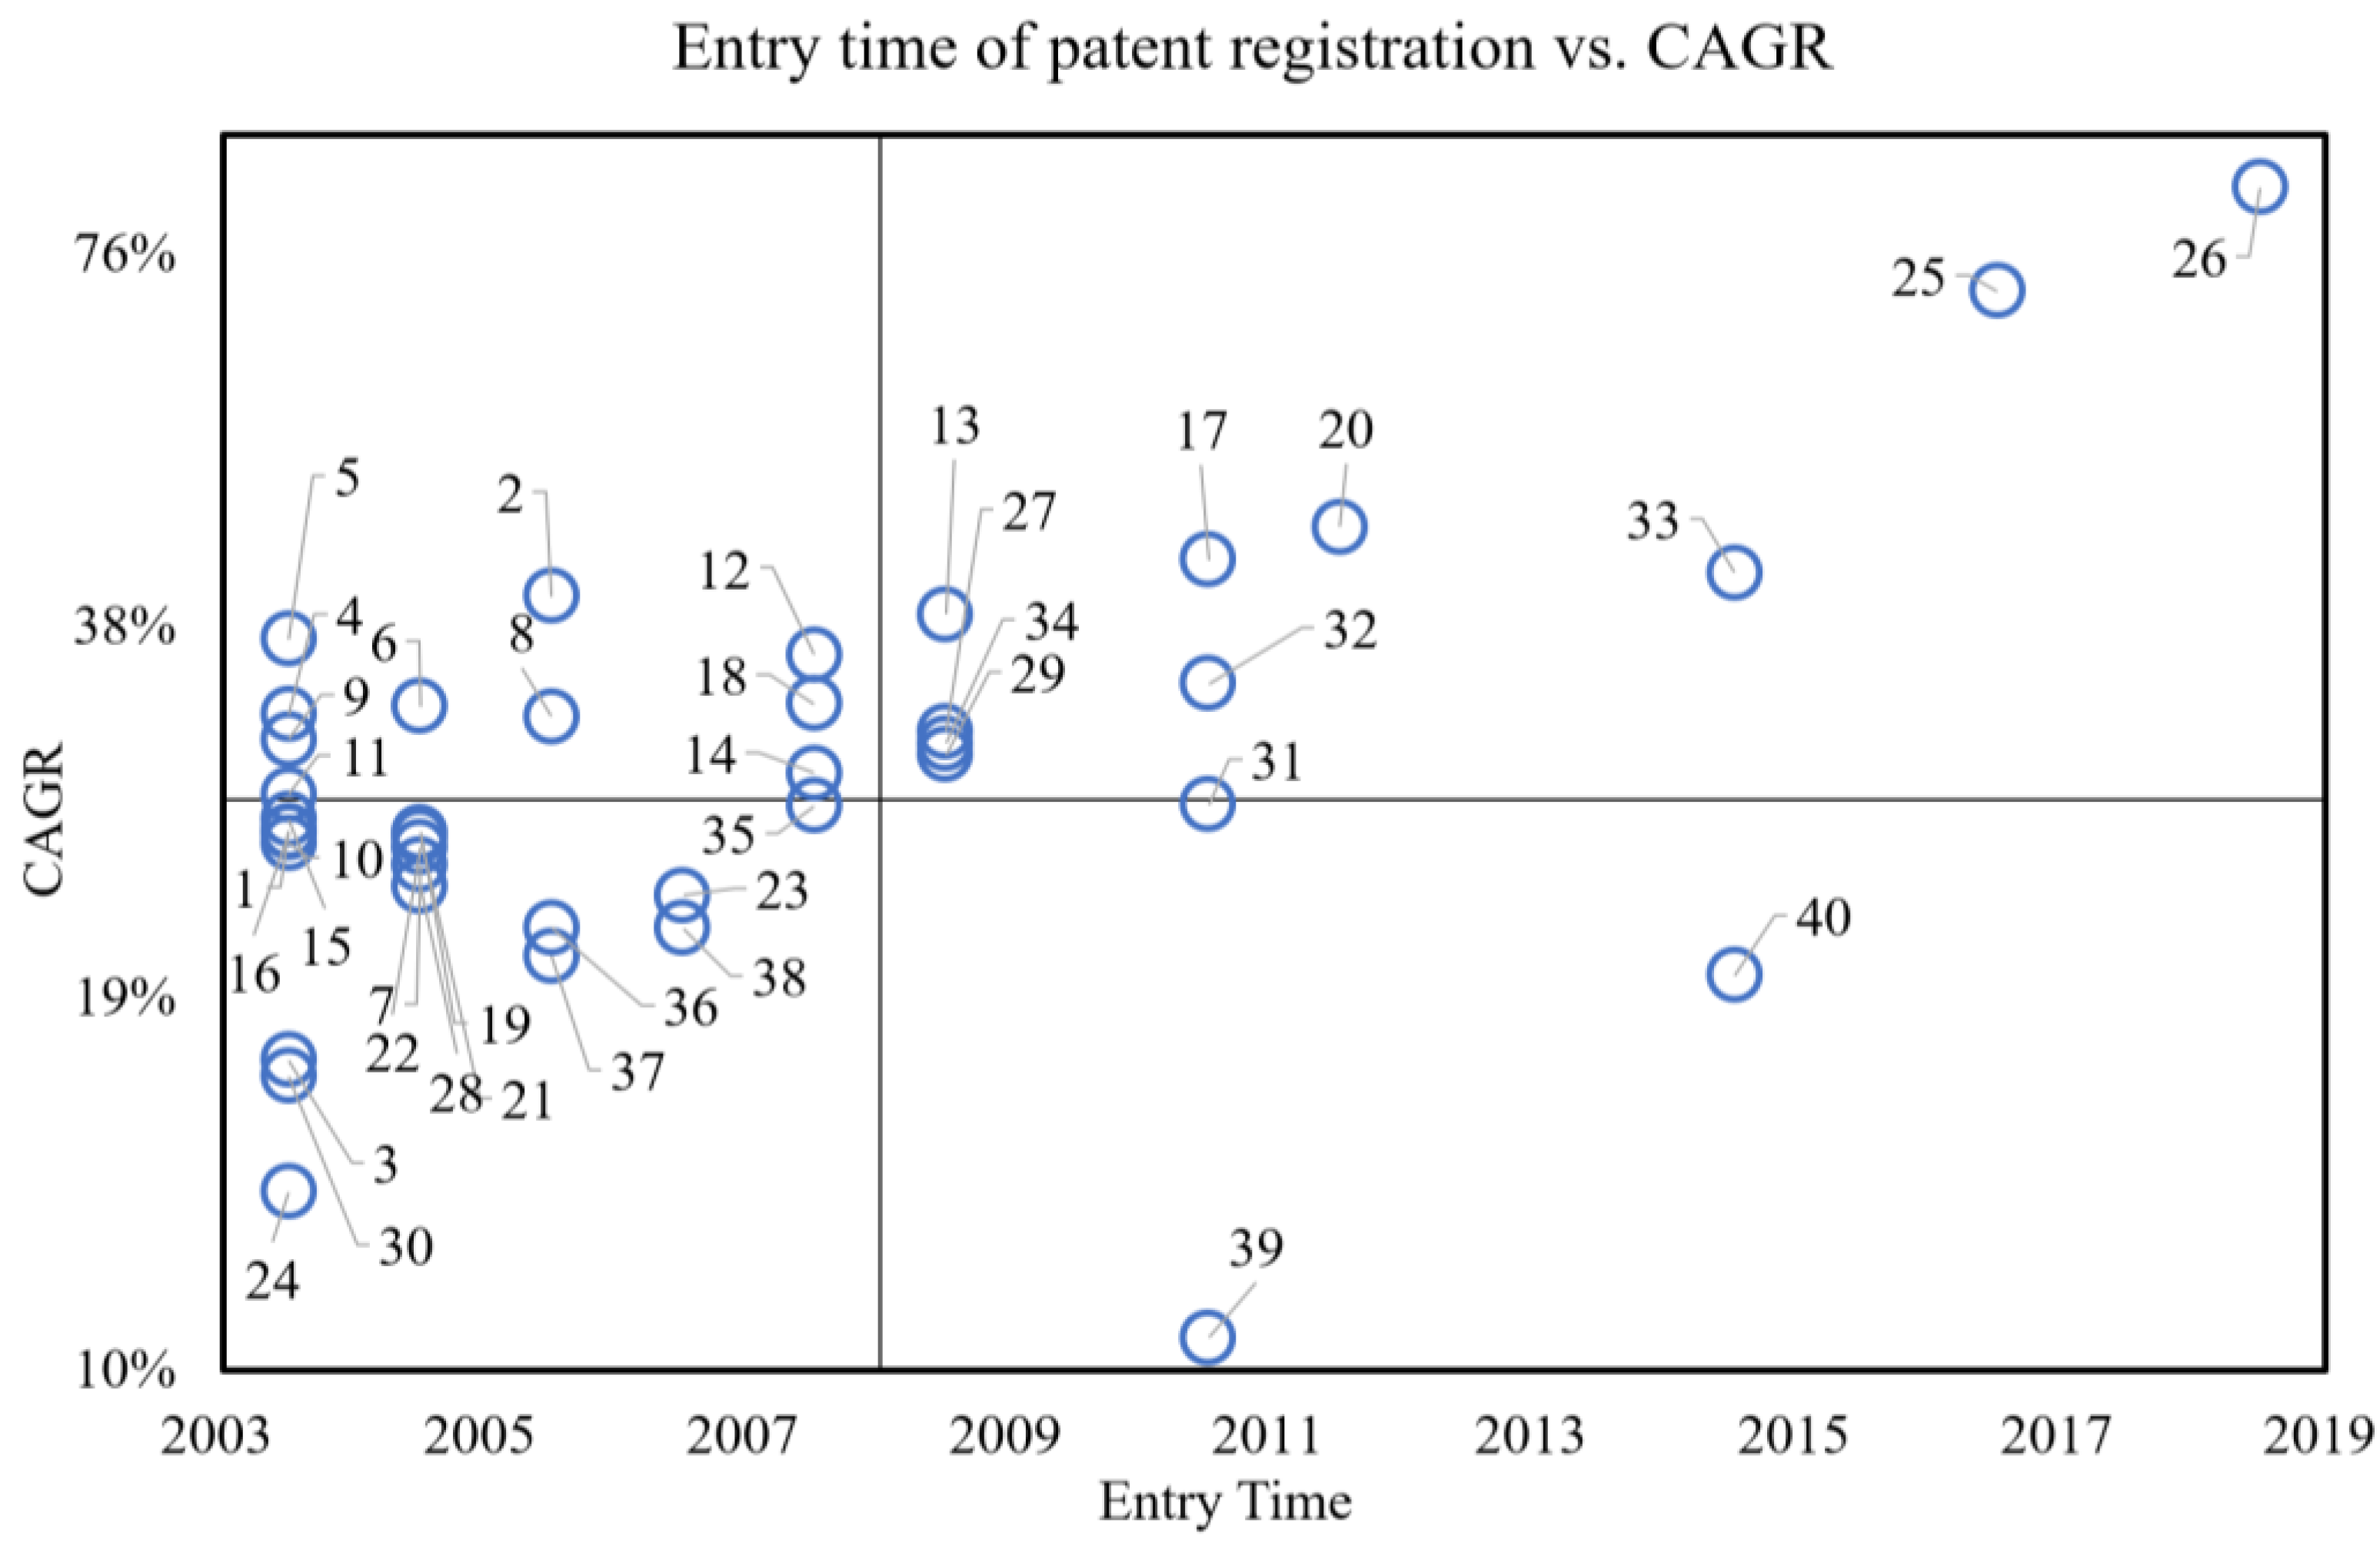


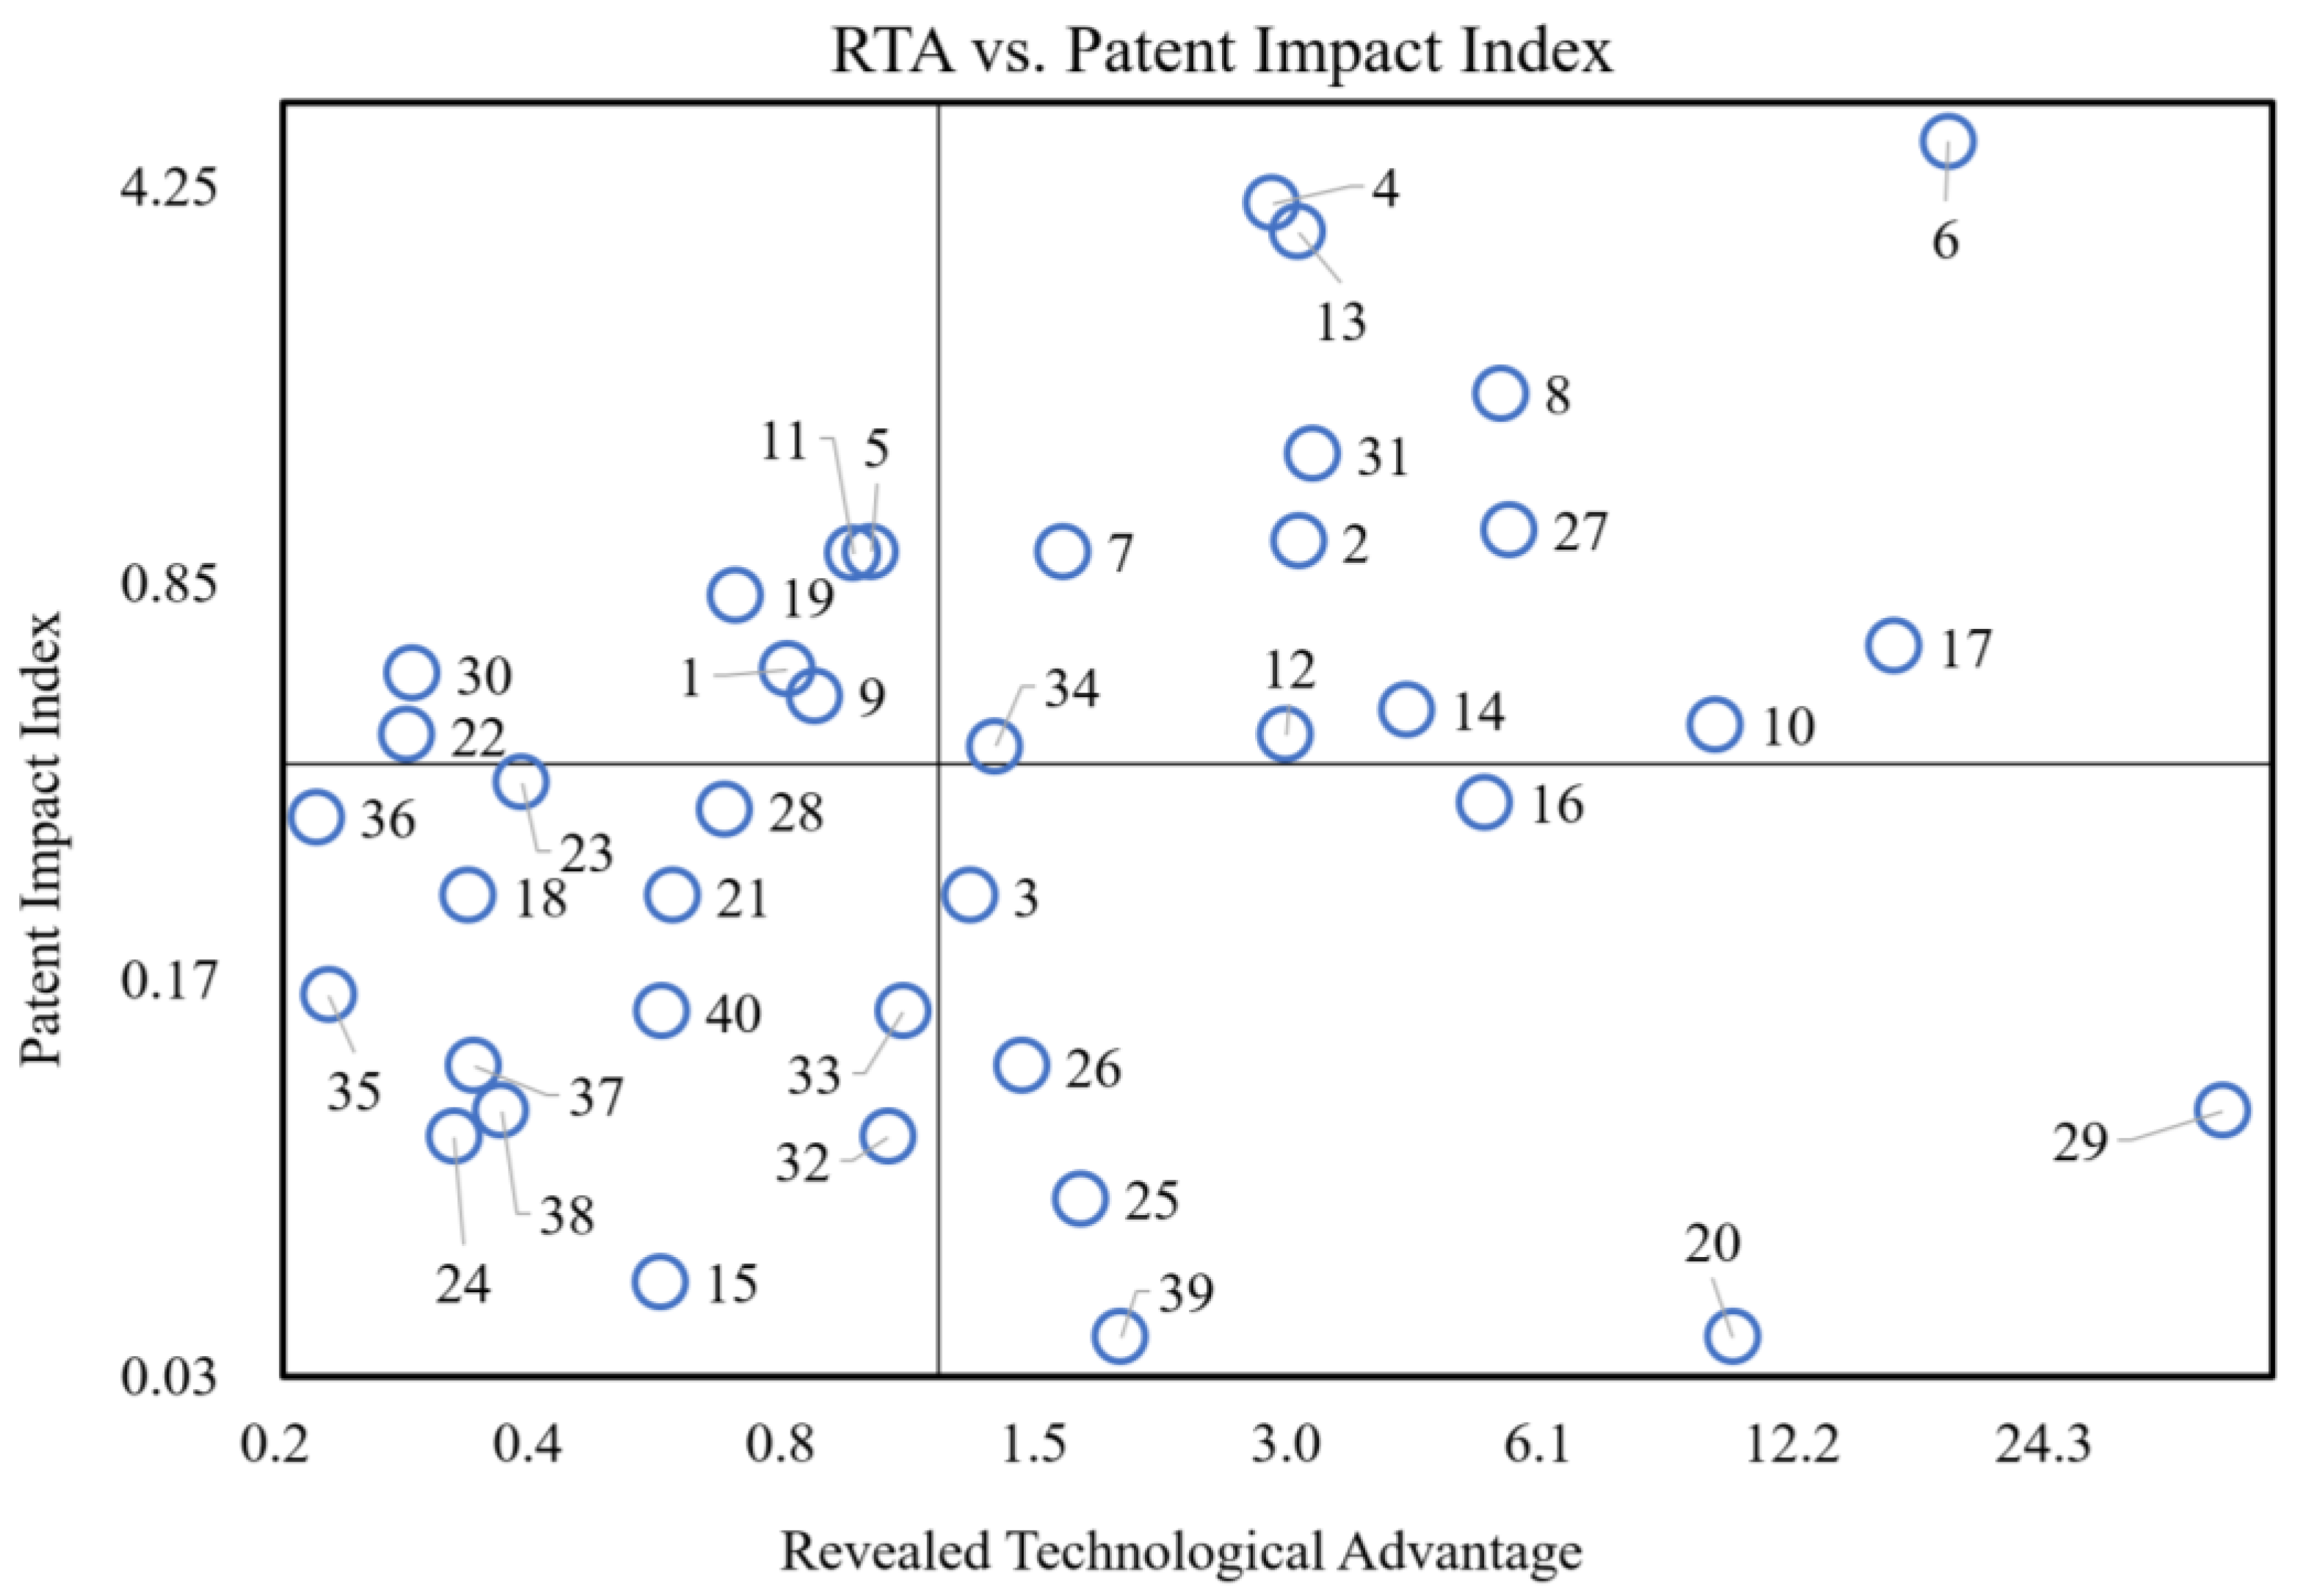


Disclaimer/Publisher’s Note: The statements, opinions and data contained in all publications are solely those of the individual author(s) and contributor(s) and not of MDPI and/or the editor(s). MDPI and/or the editor(s) disclaim responsibility for any injury to people or property resulting from any ideas, methods, instructions or products referred to in the content. |
© 2025 by the authors. Licensee MDPI, Basel, Switzerland. This article is an open access article distributed under the terms and conditions of the Creative Commons Attribution (CC BY) license (https://creativecommons.org/licenses/by/4.0/).