Abstract
This study examines how individual, organisational, and societal factors influence blockchain technology (BCT) adoption in supply chain management (SCM). Using Partial Least Squares Artificial Neural Networks (PLS-ANNs) and Necessary Condition Analysis (NCA), it identifies key determinants of sustainable BCT adoption among small- and medium-sized enterprises (SMEs). The results show that compatibility, top management support, and relative advantage are critical for adoption. This study focuses on SMEs, and further research is needed to assess whether these findings apply to larger organisations. Insights from this research provide a foundation for improving BCT adoption in high-impact sectors and inform strategic adoption practices. By analysing multi-level factors, the study enhances understanding and guides policy development for equitable and sustainable supply chain innovations. Additionally, the findings refine existing BCT adoption models by introducing and validating new determinants, contributing to both theory and practice in SCM. This comprehensive approach bridges research gaps and offers actionable insights for improving BCT adoption, supporting broader economic and social benefits.
1. Introduction
Globally, the adoption of blockchain technology (BCT) in supply chain management is increasing rapidly. According to a report by Grand View Research, the global BCT market is expected to reach USD 31.28 billion by 2024 and to grow at a compound annual growth rate (CAGR) of 90.1% from 2025 to 2030. This trend indicates the immense potential and value of BCT in optimising global supply chain management. The primary focus of the Chinese BCT market is on the implementation of BCT to enhance trade finance, cross-border payments, and supply chain transparency [1].
The market size of blockchain applications in China exceeded CNY eight billion in 2022 [2]. According to the forecasts, BCT shows considerable potential, with the market projected to surpass CNY 27 billion by 2025 and nearly CNY 69 billion by 2030. Many industries apply BCT. The most significant examples are the finance, government, and logistics industries, and so on [2]. Within the financial sector, the technology is employed for cross-border payments and digital currency pilots [3]. In the logistics industry, BCT is utilised for cargo tracking and enhancing supply chain transparency [4]. Moreover, in the agricultural sector, blockchain is employed to ensure the traceability and quality control of agricultural products [5]. These applications have been shown to enhance the efficiency and transparency of supply chains, thereby fostering consumer trust in products.
Despite the employment of various theoretical frameworks, including UTAUT, DOI and TOE, to examine technology adoption, there has been a paucity of attention devoted to integrating these frameworks in order to provide a comprehensive analysis of the influence on the adoption of BCT in SMEs [6,7].
According to Duan et al. [8] and Dudczyk et al. [9], the potential difficulties, risks, challenges, barriers, and constraints related to BCT adoption in SCM by Chinese SMEs affecting behavioural intention (BI) include the following:
Complexity of Measuring Relative Advantage: Assessing the relative advantage of BCT regarding security is complex. Quantifying how enhanced security leads to tangible benefits is challenging due to the multifaceted nature of security and its indirect impact on performance [10].
High Initial Costs and Ongoing Expenses: The initial implementation costs of BCT are substantial, and ongoing maintenance expenses contribute to the financial burden. These costs may discourage organisations from investing in blockchain despite its potential security advantages [11].
Balancing Security Investments and Cost Constraints: Balancing security investments with cost management presents a significant challenge. High security investments may strain financial resources, especially for SMEs, diminishing the perceived relative advantage of blockchain and hindering its adoption [12].
Resource Allocation and Prioritisation: Allocating adequate resources to support both security measures and other business priorities poses challenges. Top management must prioritise blockchain investments with other strategic initiatives, potentially causing conflicts and reducing support for security enhancements [13].
Gaining Top Management Support: Securing strong top management support for BCT adoption is essential. Without their endorsement, obtaining necessary resources and achieving strategic alignment becomes challenging. Top management often requires clear evidence of the relative advantage and cost-effectiveness of blockchain security investments [13].
Perceived ROI of Security Investments: Demonstrating the return on investment (ROI) for security enhancements in blockchain solutions presents a significant challenge. The benefits of enhanced security are often long-term and indirect, making it challenging to convince stakeholders of its immediate value and relative advantage [14].
Organisational Resistance to Change: Resistance to change within organisations can hinder BCT adoption. Employees and management may be unwilling to modify existing processes and systems, even when the relative advantage of enhanced security is evident. Overcoming this resistance requires well-implemented change management strategies [15].
Effective Communication of Technical Benefits: Conveying the technical benefits of blockchain to top management can be challenging because of its complexity. Well-developed communication strategies are crucial for articulating potential advantages and securing top management support [15].
Risk of Technological Failure: The inherent complexity of BCT elevates the risk of failure during implementation. This risk may cause top management to hesitate in supporting blockchain projects due to concerns about potential disruptions and financial losses [16].
Integration with Existing Systems: Integrating BCT with existing SCM systems poses significant technical challenges. Ensuring compatibility and interoperability with legacy systems demands substantial effort and resources, affecting the perceived relative advantage [10].
Legal and Regulatory Compliance: Navigating the legal and regulatory framework for BCT is often complex. Achieving compliance with multiple regulations, especially those concerning data security and privacy, necessitates significant investment and may impact the perceived relative advantage [11].
Scalability Concerns: Scalability remains a major concern for BCT within SCM. Ensuring that the system manages high transaction volumes without compromising security or performance presents significant challenges and costs [12].
Stakeholder Collaboration: Effective blockchain implementation necessitates collaboration among various stakeholders, including suppliers, manufacturers, and logistics providers. Achieving alignment and cooperation among these parties proves challenging, impacting perceived relative advantage and top management support [13].
Data Privacy and Confidentiality: Ensuring data privacy and confidentiality is essential for BCT within SCM. Organisations need to implement robust security measures to safeguard sensitive information, which may be costly and technically demanding [14].
Adaptation to Technological Changes: Adapting to rapid technological advancements in blockchain necessitates continuous investment in research and development. The need for ongoing adaptation may strain financial resources and influence top management support [15].
User Training and Skill Development: Sufficient training and skill development are vital for employees to efficiently utilise BCT. Investment in comprehensive training programs may be costly and time-consuming, influencing the perceived relative advantage [16].
As per Ahed et al. [17] and Bigi et al. [18], in the modern business model, company innovation is largely technology-driven and depends on information systems.
Large enterprises frequently realise the importance of implementing new technology to improve their financial sustainability, but SMEs recognise the need to use such technologies expressly to accomplish sustainability goals [19].
Additionally, according to media reports, the sustainable adoption of BCT has become a trend due to the COVID-19 pandemic in the early 2020s [20].
Exploring the factors influencing the sustainability of technology adoption and providing guidance to SMEs is crucial for ensuring financial and environmental sustainability [21,22].
According to Al-Ashmori et al. [6], the factors identified and categorised for the sustainable adoption of BCT include Security, Relative Advantage, Complexity, Regulatory Support, Top Management Support, Behavioural Intention, and Behavioural Expectation.
According to Agi and Jha [23], implementing BCT involves an additional cost variable distinct from the total cost of ownership, which also includes implementation expenses.
According to Wong et al. [24], the influence of comparative advantage on cost and top management support is moderate, with cost partially mediating the relationship between complexity and BI, as well as between comparative advantage and BI. This highlights that SMEs often face resource limitations for BCT adoption and suggests a feasible path for their sustainable development, potentially transforming SMEs’ capabilities.
This study builds on and extends the sustainable adoption factors of BCT proposed by Al-Ashmori et al. [6]. Thus, this research adds to the corpus of information about the factors that influence long-term BCT adoption.
Despite the adoption of BCT across various industries [25,26], Sharabati and Jreisat [27] suggest that no research has been conducted on the factors affecting the sustainable adoption of BCT by SMEs in SCM in China, specifically in industries such as agriculture, mining, manufacturing, energy, telecommunications, IT services, scientific research, culture, healthcare, and finance [8,9]. Therefore, this paper investigates the factors influencing the sustainable adoption of BCT by SMEs in China in these industries, making a new contribution to the relevant body of knowledge.
The relationship between relative advantage and complexity variables, and SME users’ intentions to sustainably adopt BCT, is mediated by top-level management support and cost variables [24]. In the use of BCT by SMEs in SCM, the link between intent and security is mediated by relative advantage [28]. This study, therefore, investigated a serial multiple mediation model drawn from prior findings. The study aimed to investigate the relationships between security, compatibility, relative advantage, cost, top management support, and behavioural expectations of Chinese SMEs planning to adopt BCT in a sustainable manner, with a focus on the serial multiple mediation effect between security, compatibility, and adoption intention in SCM.
Despite numerous studies on BCT adoption [27], focusing solely on one dimension or combining only two dimensions seems insufficient for ensuring sustainable adoption [29,30,31]. To date, no studies have been identified that integrate individual-level, organisational-level, and societal-level perspectives on factors influencing sustainable adoption in the SCM of Chinese SMEs. Therefore, this paper integrates individual-level, organisational-level, and societal-level perspectives to contribute new insights into the factors influencing the sustainable adoption of BCT.
According to Al-Ashmori et al. [6], the use of sustainable adoption factors—such as Security, Relative Advantage, Top Management Support, Complexity, Regulatory Support, Behavioural Intention, and Behavioural Expectation—can help create a new model that facilitates BCT adoption for research in software development, media, public healthcare, finance, logistics, and the public sector.
As a result, the current study combines the TOE framework, DOI theory, and the UTAUT model. TOE is an organisational-level framework for studying technology adoption; DOI is Everett Rogers’ societal-level theory explaining innovation diffusion; and UTAUT is an individual-level theory for understanding and forecasting technology acceptance. Merging these three ideas could overcome the challenges hindering Chinese SMEs’ long-term adoption of BCT in SCM.
The focal point of this research endeavour is the sustainable adoption of BCT in the context of SCM by SMEs in China. The selection of this research context is of paramount practical significance, as SMEs, despite their pivotal role in economic development, frequently encounter challenges such as constrained resources and technological adoption. The objective of this research is to furnish SMEs with precise guidance to facilitate a more profound comprehension and implementation of BCT.
This study’s research objectives are as follows:
- To investigate the key determinants of sustainable BCT adoption in SCM from individual, organisational, and societal perspectives.
- To evaluate the interrelationships among these factors, particularly the mediating and moderating effects.
- To develop and validate a comprehensive theoretical framework to guide the sustainable adoption of BCT in SCM.
- To propose actionable strategies based on empirical findings to help SMEs implement BCT more effectively.
- To explore the application differences of BCT across various industries and provide targeted policy recommendations.
There is a large study gap in the simultaneous analysis of BCT’s unsustainable adoption data utilising methodologies such as PLS-SEM, IPMA, NCA, and ANNs [32]. NCA is a data analysis approach that identifies required (but not sufficient) conditions in datasets. It augments standard regression-based techniques, such as partial least squares structural equation modeling (PLS-SEM) and qualitative comparative analysis (QCA) [33,34].
There is a considerable lack in research on non-compensatory and nonlinear correlations in BCT adoption for SCM [35,36]. The majority of existing research employs approaches like Structural Equation Modeling (SEM), Partial Least Squares Structural Equation Modeling (PLS-SEM), and Multiple Linear Regression (MLR), which assume linear, compensating connections without evaluating the linearity assumption [37,38]. These methods frequently oversimplify the intricacies of decision-making processes [39]. For instance, a decision to adopt BCT may become non-compensatory if the cost outweighs its comparative advantages [40,41]. To address these limitations, we utilised Artificial Neural Networks (ANNs) with Multilayer Perceptrons (MLP), which are more capable of capturing nonlinear and non-compensatory decision making, thereby overcoming the shortcomings of traditional statistical analyses and avoiding potential false correlations associated with p-values [42]. As a result, our research looks at both linear compensatory and nonlinear, non-compensatory interactions in regard to the long-term adoption of BCT.
The remainder of this paper is organised as follows: Section 2 examines the current literature and outlines the study’s hypotheses. Section 3 covers the study methodologies employed, while Section 4 discusses the findings. Section 5 examines the findings and their consequences, while Section 6 ends the research by identifying limits and proposing future approaches.
2. Theoretical Background
The TOE framework elucidates the impact of factors at the technology, organisation, and environment levels on technology adoption [7]. The UTAUT model examines people’s intentions to accept and use technology at the individual level [43]. DOI theory focuses on the characteristics of innovation and how it spreads in organisations [23].
The integration of UTAUT and TOE, TAM and DOI, and TOE and DOI has been demonstrated. Empirical evidence has been provided to support the assertion that TOE, DOI, and UTAUT are able to interact, and a clear explanation of how they are interrelated has been provided. Some factors across frameworks (such as compatibility and complexity, etc.) have been empirically validated, thereby providing a more robust foundation for the adoption of BCT. Empirical studies confirm compatibility and complexity as critical transdisciplinary factors. Compatibility (TOE/DOI’s factor) serves as a bridge across frameworks by ensuring resource flexibility, congruence with existing workflows, and reduced cognitive load. Conversely, complexity has been shown to inhibit adoption through dual mechanisms: technological complexity (TOE/DOI’s factor) escalates implementation risks and learning costs, while perceived complexity diminishes effort expectancy (UTAUT’s factors), particularly among non-technical users [7].
We emphasise that UTAUT constructs—namely, performance expectancy, effort expectancy, social influence, and facilitating conditions—have a significant impact on user attitudes and sustainable BCT adoption. TOE factors, such as technological maturity, organisational readiness, and policy support, directly influence adoption by mitigating structural barriers. Furthermore, the relative advantage of blockchain (TOE’s factor) enhances its perceived usefulness (UTAUT’s factor), particularly when integrated within a digitally mature organisational infrastructure (TOE’s factor) [44].
We extend prior models by integrating TAM, DOI, and TOE, identifying six key drivers of BCT adoption in Indian SMEs. The enhancement of perceived usefulness is attributed to the relative advantage of blockchain, particularly in scenarios where it leads to enhanced supply chain transparency. However, the necessity of technology compatibility with existing IT systems and workflow practices is also highlighted. The role of top management support in facilitating the transformation of technological readiness into concrete adoption strategies is also emphasised. However, technological complexity (TOE/DOI’s factors) and cost concerns (TOE’s environmental dimension) act as barriers, particularly for resource-limited SMEs [45].
The present study focuses not only on the short-term adoption of BCT, but also explores in depth the factors that contribute to its sustainable long-term adoption. The study combines the TOE framework, DOI theory, and the UTAUT model to propose a comprehensive theoretical framework that includes factors at the individual, organisational, and societal levels. This multi-level analysis provides a more comprehensive perspective for understanding the long-term impact of BCT.
2.1. Adoption of Blockchain Technology
Adoption of BCT will bring about significant changes in SMEs’ intra-organisational impact profiles, social impact profiles, and individual use profiles [46]. As a result, the adoption of BCT by SMEs in SCM to solve and deal with business problems in various industries has attracted a great deal of interest from researchers [47].
2.2. Organisational Level
For example, examining BCT adoption in SCM reveals the importance of organisational readiness and leadership support [48]. Potential applications and benefits in supply chain management emphasise the need for organisational commitment and resource allocation [49]. Factors driving BCT in the Indian manufacturing sector highlight the necessity of organisational infrastructure and capability [50]. Corporate adoption of BCT is influenced by technological advantages and organisational support, stressing top management support and technological readiness [51]. Blockchain applications in logistics and transportation focus on efficiency and security improvements, necessitating investment in blockchain infrastructure by logistics companies [52]. In fintech, BCT enhances security and efficiency in financial transactions, stressing the importance of organisational readiness and technological infrastructure [53]. Financial services applications of blockchain focus on transaction transparency and security, emphasising the importance of organisational investment [54]. BCT applications across industries enhance efficiency and security, highlighting broad organisational benefits [55].
2.3. Societal Level
Examining BCT in the financial services industry reveals societal benefits such as enhanced trust and security in financial transactions due to increased transparency and security [56]. In agricultural supply chains, blockchain improves traceability, leading to better food safety and transparency [57]. Real estate applications of blockchain focus on land registration and transaction security, ensuring secure and transparent real estate transactions with societal benefits [58]. In education, blockchain enhances credential verification and student record management, providing societal benefits of secure and verifiable educational credentials [59]. Public sector applications of blockchain improve data management and transparency, increasing government transparency and efficiency [60]. Retail applications of blockchain focus on supply chain transparency and customer trust, resulting in societal impacts such as increased trust and transparency in the retail supply chain [61]. These analyses collectively underscore the broad societal benefits of BCT adoption across various industries, emphasising the enhancement of transparency, security, and trust [62].
2.4. Individual Level
Blockchain applications in healthcare focus on enhancing patient data security and privacy, addressing concerns about data protection [63,64]. In e-commerce, blockchain impacts payment systems and data security, emphasising the importance of consumer trust and data protection [65,66,67]. These analyses highlight how BCT can alleviate individual concerns about data security and privacy across different sectors [68,69].
During this literature study, we discovered that the variables influencing BCT adoption may be classified into three categories: TOE, DOI, and UTAUT. Table 1 summarises the factors discussed in the available literature on BCT adoption [6].

Table 1.
Factors affecting the organisational and societal and individual perspective adoption of BCT [6].
As a result, the TOE framework extension’s organisational cost factors may be used to analyse the variables impacting the long-term adoption of BCT in supply chain management. Table 2 shows the TOE organisational dimension cost components utilised in this investigation.
Table 2.
Research model cost variable and sources.
3. Research Model and Hypotheses
3.1. TOE Framework
From the different possibilities accessible in the IS literature, we picked the Technology-Organisation-Environment (TOE) framework [103] as a foundational hypothesis for studying BCT adoption. According to the TOE paradigm, three contextual elements impact an organisation’s desire to embrace new technology: technology, organisation, and environment, as seen in Figure 1.

Figure 1.
The TOE framework [104].
The technological context encompasses the qualities of technology that impact the adoption process. The organisational context refers to the impact of an organisation’s characteristics and resources on innovation adoption decisions. The environmental context describes the impact of an organisation’s external and inter-organisational environment on how it conducts business [104].
This study evaluated three primary constructs: technology factors (security), organisational factors (top management support), and environmental variables (regulatory support) [6]. Extensions to sustainable organisational elements include the addition of cost variables, which have a direct link with purpose [24].
3.2. DOI (Diffusion of Innovations) Theory
E. M. Rogers proposed the Diffusion of Innovations idea [105]. It has received significant empirical support for characterising user adoption across a variety of fields, particularly e-learning. An invention is an entity or body of knowledge that a person adopts. According to Diffusion of Innovations theory, prospective users make judgments to adopt or reject information technologies depending on their impressions of the technology [80]. Tornatzky and Klein’s previous meta-analysis of 75 diffusion studies found that only relative advantage, compatibility, and complexity were consistently connected to the adoption of technological breakthroughs [106,107]. The primary constructs addressed for this study were relative advantage, compatibility, and complexity [6]. The constructs are further discussed in the next section.
3.3. UTAUT (Unified Theory of Acceptance and Use of Technology)
The Unified Theory of Acceptance and Use of Technology (UTAUT) was proposed [108] as a combination of eight models from previous acceptance work. While behavioural intention (BI) contains questions linked with the desire to embrace blockchain, behavioural expectation (BEXP) is concerned with questions that demonstrate the subjective probability of supply chain professionals adopting a behaviour in favour of BCT adoption [71]. Our approach uses behavioural intention (BI) as a predictor of behavioural expectations (BEXP) [109,110]. According to Venkatesh et al. [110], “Behavioural expectation […] reflects the strength of the focal behavioural intention over other (competing) behavioural intentions [… and that] this further reinforces the idea that BEXP reflects both internal and external factors in predicting behavior” [109]. Figure 1 points out the research model.
The expanded version incorporates the TOE, DOI, and UTAUT frameworks, which are designed to ensure the long-term acceptance of BCT in SCM. The results of this investigation are shown in Figure 2. The following sections describe the factors and relevant hypotheses developed for this study, which are organised into the TOE framework’s technological, organisational, and environmental contexts, as well as factors from the Diffusion of Innovations Theory (DOI) and the Unified Theory of Acceptance and Use of Technology (UTAUT).
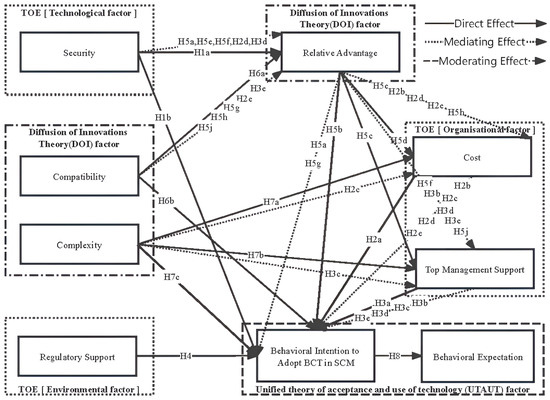
Figure 2.
Conceptual framework.
3.4. Technology Context of the TOE Framework
Security
Security is described as “the capacity to safeguard stakeholders’ information and transaction data throughout transmission” [111]. Through distinguishing features, such as a secure database [112], with a privacy-preserving design, BCT allows for a high degree of IS [113], allowing people to complete transactions anonymously. The literature cites information security threats as a factor that influences technology adoption [114,115]. Confirmation of the relative gain through security was statistically significant [28]. Therefore, it can be hypothesised that
H1a:
Security has a positive influence on Relative Advantage.
H1b:
Security has a positive influence on Behavioural intention (BI) to Adopt BCT in SCM.
3.5. Organisational Context of the TOE Framework
3.5.1. Cost
Cost refers to the expenditures incurred when purchasing and implementing a technological breakthrough [24]. Implementing BCT entails the expenditures connected with procuring new hardware and software, as well as an increase in the expenses linked to maintaining and managing the system [116]. Furthermore, organisations must invest resources, both in terms of time and cash, to offer training for their employees in the use of technology [117].
In the context of BCT, cost emerges as a pivotal factor, particularly among SMEs. The TOE framework underscores the significance of cost as a crucial element at the organisational level, directly impacting the organisation’s propensity to embrace and implement novel technologies. The impact of cost is multifaceted, exerting a direct influence on behavioural intention (BI) and, in an indirect manner, on BI through the mediating factors of complexity and relative advantage. Specifically, when costs are high, organisations may be more cautious about adopting BCT, especially when resources are limited [24]. Therefore, the present study is exploring the relationship between cost and other variables to understand cost’s role in BCT adoption more fully.
Cost concerns are one of the most common causes for adoption reluctance. The cost of deploying blockchain is uncertain, which may impede the support and commitment of the management team [118]. Implementation costs can vary depending on a number of crucial aspects, including hardware, software, recruiting, and in-house training, and can involve both opportunity and accounting expenses. Blockchain is regarded as a technology with significant up-front investment costs, yet it delivers advantages in cost reduction [119]. Intention to implement BCT correlates with relative benefit and complexity, with top management support and cost factors modulating the effect [24]. Data show that relative advantage mediates the association between security and readiness to embrace BCT [28]. “From a theoretical perspective, the conclusion is drawn that Relative Advantage may be predicting various levels of Acceptance, while Compatibility may be a predictor of a more dichotomous variable of Adoption” [120]. Therefore, we propose the following hypotheses:
H2a:
Cost has a positive influence on BI to Adopt BCT in SCM.
H2b:
Cost mediates the relationship between relative advantage and BI to Adopt BCT in SCM.
H2c:
Cost mediates the relationship between complexity and BI to Adopt BCT in SCM.
H2d:
Serial multiple mediation relative advantage and cost mediate the relationship between Security and BI to Adopt BCT in SCM.
H2e:
Serial multiple mediation relative advantage and cost mediate the relationship between Compatibility and BI to Adopt BCT in SCM.
3.5.2. Top Management Support
The authors in [121] define top management support as the extent to which top management recognises the strategic value of information systems and participates in information system operations [122]: “while firms will be less likely to adopt this new technology if it is complex and incompatible with existing processes, Despite the advantages, blockchain implementation is considered risky due to its complexity, uncertainty, privacy and security concerns as well as lack of knowledge. Hence, higher cost is usually involved during the implementation of a complicated technology, for example, a lot of training may need to be provided to the end-users before they can get themselves familiarise with the new and yet complicated technology like blockchain” [123].
Senior management’s support generates a compelling vision that allows a corporation to overcome any hurdle and cultivate a culture of devotion and innovation [123]. Therefore, it can be hypothesised that
H3a:
Top management support has a positive influence on BI to Adopt BCT in SCM.
H3b:
Top management support mediates the relationship between relative advantage and BI to Adopt BCT in SCM.
H3c:
Top management support mediates the relationship between complexity and BI to Adopt BCT in SCM.
H3d:
Serial multiple mediation relative advantage and top management support mediate the relationship between security and BI to Adopt BCT in SCM.
H3e:
Serial multiple mediation relative advantage and top management support mediate the relationship between Compatibility and BI to Adopt BCT in SCM.
3.6. Environment Context of the TOE Framework
Regulatory Support
“Regulatory framework and government assistance refer to regulatory frameworks established by the government to oversee and guarantee that both technology service providers and consumers adhere to their commitments and prevent infractions” [6]. Government regulation and legislation are crucial for e-commerce and service quality monitoring, as well as approving and implementing new technologies within a nation’s rule of law [124].
The Chinese government promotes the adoption of BCT in SCM by SMEs through legal support and related policies [125,126].
These regulations have been adopted to ensure that all SMEs adopting BCT in SCM to handle business processes across industries run smoothly and fairly [31,127].
When it comes to users’ intentions to adopt BCT, regulations are needed to minimise or mitigate any uncertainty that arises [29,62].
H4:
Regulatory support has a positive influence on BI to Adopt BCT in SCM.
3.7. DOI Theory Context
3.7.1. Relative Advantage
The term “relative advantage” refers to “the degree to which an invention is judged to be superior to the concept it replaces” [105]. The relative advantage increases the possibility of adopting novel technologies [128]. Compared to other technologies, blockchain allows the highest degree of traceability and provenance through the usage of reliable data [123].
When properly implemented, SMEs who use blockchain for SCM may reap several benefits, including increased transparency and security for better supply chain traceability. Furthermore, SMEs will benefit from increased operational efficiency and speed thanks to improved business procedures [24].
Previous research has also demonstrated high relationships between characteristics of functional utility and adoption intention, implying that the degree of ease or complexity in utilising a given technology impacts technology adoption [129,130]. Furthermore, an individual’s attitude toward technology is heavily influenced by the idea that technology is complex [131].
Relative advantage might increase SME users’ readiness to embrace BCT since it shows the prospective advantages of the new technology in terms of increased security, efficiency, and other crucial business KPIs [132].
BCT, with its distributed ledger and immutable nature, provides a better level of security than traditional systems, which is evident in the reduced risk of fraud and data tampering [133,134].
The relative advantage can persuade senior management to invest in and support the implementation of BCT because it can demonstrate how the technology can bring strategic competitive advantage and managerial simplicity [135,136].
While there may be expenses associated with the initial adoption of BCT, in the long run, relative advantage can lower total operating costs by minimising middlemen, enhancing transparency, and automating processes [137].
BCT’s interoperability with current business processes and systems makes integration smoother, minimises switching costs, and enhances the possibility of adoption [138].
Relative advantage as a medium that reinforces the relationship between security, cost savings, and support from senior management illustrates the importance of knowing and acknowledging this benefit for organisational adoption decisions [139].
Thus, relative advantage not only directly impacts organisation-wide acceptability of BCT [14], it indirectly helpsthe widespread acceptance of BCT in supply chain management by affecting other essential aspects such as security, cost savings, and management support [140].
H5a:
Relative advantage mediates the relationship between Security and BI to Adopt BCT in SCM.
H5b:
Relative Advantage has a positive influence on BI to Adopt BCT in SCM.
H5c:
Relative Advantage has a positive influence on top management support.
H5d:
Relative Advantage has a positive influence on cost.
H5e:
Relative Advantage mediates the relationship between Security and cost.
H5f:
Relative Advantage mediates the relationship between Security and top management support.
H5g:
Relative Advantage mediates the relationship between Compatibility and BI to Adopt BCT in SCM.
H5h:
Relative Advantage mediates the relationship between Compatibility and cost.
H5j:
Relative Advantage mediates the relationship between Compatibility and top management support.
3.7.2. Compatibility
Compatibility is “the extent to which an innovation fits with the existing values, previous practices and current needs of potential adopters” [141]. SMEs’ consumers prefer to adopt innovative technologies if they feel it will meet their present demands, tasks, and business procedures [28]. On the contrary, if the adoption of a new technology necessitates extra human resource changes, significant training, and additional equipment investment, SMEs will be deterred from adopting the new technology due to its diminishing relative benefits.
H6a:
Compatibility has a positive influence on Relative Advantage.
H6b:
Compatibility has a positive influence on BI to Adopt BCT in SCM.
3.7.3. Complexity
In the context of organisational processes and technology adoption, complexity refers to the degree of difficulty or sophistication involved in managing all parts of a system or programme [142]. It can manifest itself in different forms, such as technical complexity, operational complexity, or organisational complexity [7].
Higher complexity can have a positive impact on costs [143]. This means that when operational or supply chain management (SCM) tasks are more complex, they usually require more resources, time, and effort to perform, which in turn leads to increased costs. Complexity leads to additional training needs, expertise, and potential inefficiencies, all of which lead to increased costs [24].
Complexity also has a positive impact on senior management support. In complex environments, senior leadership involvement and support becomes more important for successful implementation and meeting challenges [144]. Higher levels of complexity often require clear guidance, decision making, and resource allocation from senior management to coordinate efforts and effectively overcome obstacles [24].
Complexity positively influences BI to Adopt BCT in SCM [145]. This suggests that organisations facing higher levels of complexity may be more inclined to adopt innovative solutions such as BCT, as they see these technologies as potential tools to streamline processes, increase transparency, and reduce uncertainty [146]. BCT can assist in reducing the effect of complexity by offering automated, safe, and transparent procedures for transaction and data management [67].
In conclusion, complexity is crucial in determining the cost effect, the amount of senior management support required, and the readiness to embrace new technologies such as BCT in SCM [147]. Organisations need to carefully consider and manage complexity to ensure successful operations and technology integration [148]. Therefore, it can be hypothesised that
H7a:
Complexity has a positive influence on Cost.
H7b:
Complexity has a positive influence on Top management support.
H7c:
Complexity has a positive influence on BI to Adopt BCT in SCM.
3.8. UTAUT Framework Context
3.8.1. Behavioural Intention to Adopt BCT in SCM
Behavioural intention (BI) is defined as “the degree to which a person has formulated conscious plans to perform or not perform some specified future behaviour” [149]. In this study, BI refers to an employee’s capacity to undertake a behaviour related to blockchain use. BI has a direct impact on the utilisation of technologies [108,150,151]. As a result, our study contends that BI predicts behavioural expectation (BEXP), which is defined as an employee’s assessment of the likelihood of engaging in a specific activity linked with the usage of blockchain in the future. Previous UTAUT investigations found that the BI construct has an influence on the BEXP construct [109,110]. In this perspective, Venkatesh et al. [110] argue that “The motivational drive to perform a target behavior stems from an individual’s internal evaluation of the behavior”. Thus, the individual BI is associated with his or her internal evaluation. Consequently, BI precedes BEXP, that is, “BEXP, therefore, reflects the strength of the focal BI over other (competing) behavioral intentions” [110]. In line with previous studies reporting BI in technology usage [109,110], we propose the following hypothesis:
H8:
BI positively affects BEXP for BCT adoption.
3.8.2. Behavioural Expectation
Previously published UTAUT research has demonstrated that the BI construct influences the BEXP construct [109]. In this perspective, [152] argues that “The motivational drive to perform a target behavior stems from an individual’s internal evaluation of the behavior”. Therefore, the behavioural purpose of an individual is related to his or her internal appraisal. Thus, BI precedes BEXP. That is, “BEXP, therefore, reflects the strength of the focal BI over other (competing) behavioral intentions” [152].
4. Research Methodology
The study collects and analyses research data using a positivist research strategy and quantitative technique.
In this study, we employed a combined PLS-ANN (Partial Least Squares Artificial Neural Network) and NCA (Necessary Conditions Analysis) approach, a methodology that has not been widely adopted in the field of BCT adoption research. This combined approach has the capacity to more comprehensively capture the complex relationships between variables, especially nonlinear and non-compensatory relationships. This methodological innovation provides new insights into understanding the sustainable adoption of BCT in supply chain management.
4.1. Research Method
We used an online structured questionnaire (https://www.wjx.cn) to collect data from SME managers in the Chinese cities of Beijing, Shanghai, Guangzhou, Shenzhen, Hangzhou, Tianjin, and Chongqing, and then developed and tested a potential cross-sectional model of the factors influencing the sustainable adoption of BCT by Chinese SMEs.
4.2. Unit of Analysis and Unit of Observation
In this study, the unit of analysis is the organisation of SMEs in China, and the units of observation are Junior Managers, Middle Managers, Senior Managers, R&D Specialists, Supply Chain Managers, Marketing Managers, Senior Managers, IT Managers, Finance Managers, CEOs/VPs, Chairpersons, Directors, Executive Directors, Secretaries, and Deputy Secretaries. Screening is not included in the target population, Appendix A: Demographic Items Null and blockchain awareness is ‘none’. (Appendix A: Demographics Item 1 equals 4), No experience with blockchain technology. (Appendix A: Demographics Item 2 equals 7), I am not involved in technology procurement. (Appendix A: Demographics Item 3 equals 5), Zero knowledge of blockchain technology. (Appendix A: Demographics Item 4 equals 4), Blockchain will not have an impact on the work of the firm’s surveyors. (Appendix A: Demographics item 5 equals 1), and zero work experience. (Appendix A: Demographics item 9 equals 8), Respondent’s current position level is not manager or specialist. (Appendix A: Demographics item 11 equals 15), Industry is Other Services. (Appendix A: Demographics item 18 equals 31).
4.3. Target Population and Sampling
The data were collected from 516 professionals via the www.wjx.cn online platform. The final survey instrument was distributed to 516 supply chain professionals, and the survey URL is listed on the www.wjx.cn platform. The data collected from these sources yielded a total of 516 organisations from diverse industries, surveyed between November 2023 and May 2024. This ensured the diversity of the target population. Eighteen samples were removed from the data processing step owing to incomplete replies. Only 498 samples were used in the data analysis process. The samples were obtained using purposive sampling, a non-probability sampling approach in which IT/IS managers are picked based on their availability and desire [153]. In this study, we use structural equation modeling (SEM) and artificial neural networks (ANNs) to analyse data. A sample size of 498 is considered sufficient for accurate and robust analysis [154].
4.4. Questionnaire Designing
We used the existing peer-reviewed research literature on information systems to validate measures of security, compatibility, complexity, relative advantage, cost, top management support, regulatory support, intention, and BEXP, as presented in Table 3.
Table 3.
Factors, measurement items, and sources.
4.5. Measurement Scale
All constructs were evaluated on a five-point Likert scale ranging from 1 (strongly disagree) to 5 (strongly agree).
4.6. Data Collection Process
The survey link, which included the study goals, was delivered to the target organisations via WeChat. To acquire reliable data, each organisation was required to send the survey to the CEO or top IT people, such as the CTO and IT Director/Manager, who should have experience and knowledge of BCT. A code of ethics was followed throughout the data collection period.
4.7. Data Analysis Technique
The PLS-SEM approach from SmartPLS 4.1.0.0 software was utilised to analyse survey data in this study. The PLS-SEM technique analyses data using measurement and structural models. Measurement methods assess latent variables, whereas structural models measure hypotheses based on path analysis.
5. Data Analysis and Results
Table 4 shows the respondents’ demographic profile.
Table 4.
Demographic profile (n = 498).
5.1. Preliminary Data Analysis
Table 5 shows the dispersion of industry sectors. Among the 498 responders, the largest proportion (36.14%, 180 individuals) indicated that they are employed in the software and IT services industry. The financial sector accounts for 19.68% (98 individuals), while the information transmission industry represents 11.04% (55 individuals). Other sectorsinclude public health (2.21%, 11 people), agriculture (2.01%, 10 people), and scientific research (3.01%, 15 people). The sector of residential services is the least represented, with a mere 0.20% (one individual) of respondents.
Table 5.
Demographic information of Industry.
Table 6 presents the respondents’ work experience. The majority of respondents (25.10%) have between 15 and 20 years of experience. The smallest segments are those with one to three years (6.63%) and three to five years (6.63%) of experience.
Table 6.
Demographic information of Work Experience.
Table 4 presents the findings regarding awareness and experience of BCT.
- (1)
- Awareness: The results indicate that 46.39% of respondents demonstrated basic awareness, 27.31% exhibited medium awareness, 13.86% displayed high awareness, and 12.45% lacked any awareness of blockchain.
- (2)
- Experience: The results indicate that 28.92% have between one and two years of experience, 10.24% have between two and three years, 8.43% have between three and four years, 8.03% have between four and five years, 4.02% have between five and six years, 6.02% have more than six years, and 34.34% have no experience of blockchain.
- (3)
- Role in technology adoption:
- Decision making: The results indicate that 13.86% are involved in decision making, 22.69% in recommendation, and 15.26% in both. In addition, 48.19% of respondents indicated that they are not involved in this process.
- Current understanding: The results indicate that 41.37% of respondents are engaged in learning about BCT, while 10.84% are testing it, 22.29% are implementing it, and 25.50% have no current understanding of it.
- (4)
- Demographics and company characteristics:
- Gender: The respondents were predominantly male (78.92%), with female respondents accounting for 21.08%.
- Respondents current position level: The majority of respondents (20.88%) were in junior management, while 25.30% were in middle management, 14.06% were in senior management, 6.43% were R&D experts, 9.04% were IT managers, and 14.06% were in other positions. A total of 39.56% of respondents reported annual revenues in excess of CNY 100 million. It is notable that smaller revenue ranges are less common.
- Firm age: Of all of the firms, 18.27% are 6–10 years old, 17.87% are 11–20 years old, 14.46% are 20–30 years old, and 11.65% are under 3 years old. A smaller proportion of enterprises have 11–50 employees (12.85%) or less than 10 employees (6.22%).
- Geographical distribution: The respondents were primarily from Beijing (38.96%), followed by Shanghai (11.85%), Shenzhen (6.43%), and other regions (34.94%).
5.2. Preliminary Analyses
We performed a preliminary analysis of the multivariate statistical test requirements, which included data normality, linearity, homoscedasticity, and multicollinearity. The one-sample KolmogorovSmirnov test (Table 7) revealed non-normality, with all two-tailed asymptotic significance values < 0.05. Linearity between constructs was next investigated, and Table 8 indicates linear connections with p-values less than 0.05. However, nonlinear components were found in all relationships except those between BEXP, top management support, and BI to Adopt BCT in SCM, when the p-value exceeds 0.05.
Table 7.
Shows the one-sample Kolmogorov–Smirnov test to determine distribution normality.
Table 8.
ANOVA test for linearity.
Common methodological biases can occur when respondents answer questions incorrectly or when an individual represents a company [96]. According to Hair et al. [154], to achieve an acceptable outcome, the VIF value should be less than 5. Due to the possibility of common bias in the model, a test of covariance was done, and Table 9 reveals that all factor VIF values were below 10, ensuring that all the data studied did not exhibit methodological bias [24,155,156]. External loadings larger than 0.70 are generally regarded as strong, showing that the indicator accurately represents the hidden variable.
Table 9.
Measuring Items outing loading and VIF.
To assess homoscedasticity, we examined scatterplots of the regression standardised residuals. Homoscedasticity, the homogeneity of variance, is proven when the residuals are uniformly distributed along a straight line, demonstrating consistent variance. The distribution of residuals along a straight diagonal line supports the homoscedasticity assumption.
5.3. Common Method Bias (CMB)
Given that the data for the exogenous and endogenous constructions were obtained from a single source, there is a risk of common technique bias. To resolve this issue, we used both procedural and statistical solutions [157]. During the data collection process, respondents were assured of anonymity and were informed that there were no correct or incorrect responses. A statistical test was performed using the Harman one-factor technique, and the results showed that it accounted for 55.563 percent of the total variance. Because this value surpasses fifty percent, the Harman one-factor test is insufficient for discovering common technique variation [158]. In order to address the potential for common method bias, the latent method factor approach proposed by Liang et al. [159] was adopted in this study, resulting in the construction of a dual-factor model that incorporated both substantive factors and a method factor [159]. The analysis yielded three critical findings, as demonstrated in Appendix B Table A1, Common method bias analysis: Firstly, all items demonstrated significant substantive loadings (R1) on the principal constructs, whereas the majority of their method factor loadings (R2) were found to be insignificant, with absolute values ranging from 0.001 to 1.000, indicating negligible systematic bias introduced by measurement methods. Secondly, the ratio of variance explained by substantive factors to method factors reached 213:1, significantly exceeding the conservative 100:1 threshold recommended for confirming CMV’s minimal influence [160]. Thirdly, comparative analysis of structural paths showed stable coefficients (Δβ < 0.02) between models with and without the method factor, demonstrating robustness against method-induced distortions. These findings are consistent with Podsakoff et al. (2012)’s assertion that CMV becomes inconsequential when substantive variance overwhelmingly dominates method variance [161]. Furthermore, the outcomes of all constructs utilising PLS-CFA are deemed satisfactory. This validates the conclusion of this study, demonstrating that common method bias does not critically threaten its validity.
5.4. Measurement Model
The average variance extracted (AVE) was used to verify convergent validity, and it produced a value larger than 0.50. (Table 10). In contrast, construct reliability was confirmed based on the values of Cronbach’s alpha and composite reliability, which surpassed 0.70 [162].
Table 10.
Reliability of conceptions and measurement items.
Several methodologies were used to assess discriminant validity. First, the standard Fornell–Larcker criteria were used, which demonstrated that the square root of the AVE is bigger than the correlation coefficients (Table 11). Subsequently, the cross-loadings were investigated, and Table 12 shows that all loadings had a significant correlation with the corresponding construct and a weak one with irrelevant ones. Finally, the recently developed HTMT criteria were used, and Table 13 shows that all HTMT ratios are less than the threshold of 0.90 [163]. The measurement model has an SRMR (Standardised Root Mean Square Residual) index of 0.036 (Table 14), which is lower than the criterion of 0.08 [164]. Thus, the model fits the data well.
Table 11.
Discriminant validity—Fornel–Larcker criterion.
Table 12.
Cross-loadings.
Table 13.
Discriminant validity—heterotrait–monotrait (HTMT) ratio.
Table 14.
Model fit.
The measurement model is responsible for 40.2 percent of the variance in BEXP, 69.5 percent of the variance in BI to Adopt BCT in SCM, 48.3 percent of the variance in cost, 65.1 percent of the variance in relative advantage, and 57.5 percent of the variance in top management support (Table 15). Because the percentages in question surpass 10%, it may be argued that the measurement model has both substantial and adequate predictive potential [165].
Table 15.
Predictive power.
According to the criteria established by Wassertheil and Cohen [166], an f2 larger than 0.02, 0.15, or 0.35 is thought to signify a minor, medium, or large impact size, respectively. Table 16 demonstrates that Compatibility has a considerable effect on Relative Advantage. Relative advantage has a large impact on top management support. The relative benefit has a modest effect size on cost and BI when using BCT in SCM. Complexity has a medium impact on cost and top management support. The remaining exogenous components provide rather minor effects. The remaining exogenous components provide rather minor effects.
Table 16.
Effect size (f2).
In terms of predictive relevance, the StoneGeisser Q2 (Table 17) yields positive and significant values, indicating that the exogenous constructions are highly relevant to the endogenous constructs. Table 18 presents the predictive results, which show strong predictive capabilities across all constructs, with Q²predict values greater than 0.35. The construct of relative advantage shows the highest predictive relevance, with a Q²predict value of 0.645. The Q²predict values for the exogenous constructs of top management support, cost, BEXP and BI, which are 0.606, 0.451, 0.375 and 0.53, respectively, indicate good predictive power for BI to Adopt BCT in SCM. It is noteworthy that the Relative Advantage construct has the smallest errors (RMSE = 0.598 MAE = 0.418), indicating a high degree of predictive accuracy. In contrast, the Cost and BEXP constructs have higher errors, with RMSE values of 0.744 and 0.794, and MAE values of 0.552 and 0.613, respectively. In general, the model shows considerable predictive ability, particularly in relation to the Relative Advantage and Top Management Support constructs.
Table 17.
Cross-validated Communality Stone-Q² Geisser’s value [167,168].
Table 18.
PLSprdict prediction summary.
5.5. Structural Model
According to the structural model analysis (Figure 3), 9 of the 14 routes evaluated are statistically significant, resulting in a significance rate of 64.3%. Table 19 shows that Relative Advantage significantly impacts both BI (β = 0.533, p < 0.000) and Top Management Support (β = 0.303, p < 0.001), emphasising its importance in BCT adoption. In addition, security significantly increases relative advantage (β = 0.219, p < 0.000); however, its direct effect on BI is negative and statistically insignificant (β = −0.074, p = 0.094). This suggests that while security contributes to perceived relative advantage, it is not sufficient on its own to significantly influence BI.
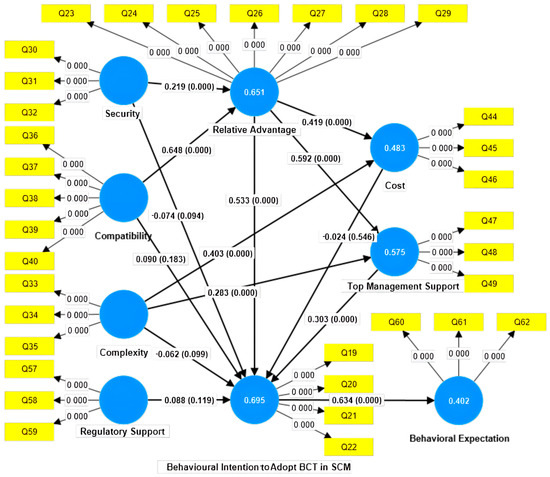
Figure 3.
Graphical representation of bootstrapping path coefficients.
Table 19.
Path coefficients (direct effects).
In contrast, the consequences of cost and complexity are more subtle. While cost has no significant influence on BI (β = −0.024, p = 0.546), complexity has a substantial effect on both cost (β = 0.403, p < 0.000) and top management support (β = 0.283, p < 0.000), but not on BI (β = −0.062, p = 0.099). This conclusion implies that, while complexity might raise operational issues and costs, its impact on BI is mostly mediated by other variables. Additionally, BI is a significant predictor of BEXP (β = 0.634, p < 0.000), emphasising its importance in fostering BI adoption.
Regarding the relationship between Regulatory Support and BI, the path coefficient is positive but weak (β = 0.088) and lacks statistical significance (p = 0.119), suggesting that although regulatory support has some influence on BI, its impact is relatively limited. This suggests that in practice, regulatory support may act as a secondary facilitator rather than a primary driver.
Further mediation analysis (Table 20) demonstrates the critical importance of top management support and relative advantage in the adoption of BCT. Security’s impact on BI is considerably mediated by relative advantage (β = 0.117, p < 0.000) and compatibility (β = 0.039, p < 0.002). Top management support is crucial in mediating the relationship between relative advantage (β = 0.180, p < 0.000) and complexity (β = 0.086, p < 0.000) and BI. The security and compatibility routes, mediated by relative advantage and top management backing, have consistently large indirect impacts, emphasising their relevance in the adoption process.
Table 20.
Specific indirect effects.
In contrast, cost has no significant mediating impact, indicating that it does not successfully mediate the link between these components and BI. This conclusion emphasises the need of enhancing the perceived relative value of the technology and winning top management support, rather than focusing just on cost considerations.
In conclusion, our structural model study (Figure 3) demonstrates the importance of relative advantage as a direct and indirect driver of BI. Cost has a greater impact on top management support than on BI itself. Top management support is recognised as a crucial mediator that improves adoption by reinforcing BCT’s perceived advantages. The serial mediation routes demonstrate the complexity and interdependence of these constructs, offering a thorough knowledge of the decision-making process for BCT adoption in SCM.
5.6. Importance Performance Map Analysis (IPMA)
According to Ringle and Sarstedt [169], the Importance–Performance Map Analysis (IPMA) is a useful technique for evaluating the performance of latent and manifest variables, providing information on their significance to target constructs. The IPMA helps to identify underperforming variables that require management intervention and to analyse critical activities to improve dependent variables [170].
Figure 4 shows the Importance–Performance Map Analysis (IPMA) for BEXP across different constructs. Relative Advantage (blue) and BI to Adopt BCT in SCM (red) are shown to have high importance and relatively strong performance. These constructs are critical in influencing BEXP in the context of adopting BCT in supply chain management (SCM). These findings are consistent with previous literature highlighting the importance of perceived benefits in driving adoption decisions [77,171]. Compatibility (cyan) shows moderate importance but strong performance, suggesting that although its contribution to BEXP is moderate, it is well managed in the current context. Cost, Complexity, and Security show low importance and moderate performance, suggesting that these areas may not be immediate priorities for improvement. However, further investigation may reveal their potential indirect role. This figure highlights the importance of focusing on high-performing, high-importance constructs such as Relative Advantage and BI, which are likely to have the greatest impact on shaping BEXP.
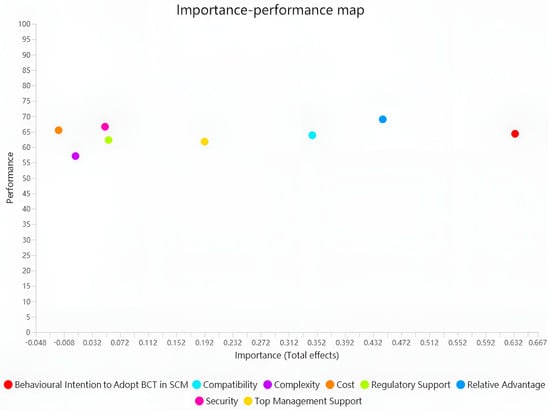
Figure 4.
IPMA for Behavioural Expectation (constructs).
Table 21 shows that Relative Advantage has the highest performance score (69.018), followed by cost (65.483) and security (66.611). These variables have shown strong performance in influencing BEXP, supporting the argument that perceived benefits, financial viability, and security are important for adoption. BI to Adopt BCT in SCM (64.332) also reflects a solid performance, consistent with its high importance observed in the IPMA map (Figure 4). Complexity (57.098) has the lowest score, suggesting room for improvement, especially as higher complexity may hinder adoption by introducing challenges in system implementation and use [172]. This table highlights the need to address the lower-performing constructs, particularly complexity, to ensure smoother technology integration.
Table 21.
Latent variable performance on constructs.
Figure 5 presents an IPMA at the indicator level, showing the importance and performance of individual indicators across different constructs. Q48, Q49, Q57, Q58, and Q59 have high importance and performance, indicating their critical role in influencing BEXP. These indicators are likely to represent key aspects of top management support and regulatory support, given their high positioning on the map. Q19 to Q22 show relatively lower performance and importance, suggesting that they may not be immediate areas of focus, but could benefit from improvement in the future. Indicators related to cost and complexity show moderate performance and lower importance, reinforcing the previous finding that these factors are less critical in the immediate context. This map helps to identify specific indicators that need attention and resource allocation to improve adoption outcomes.
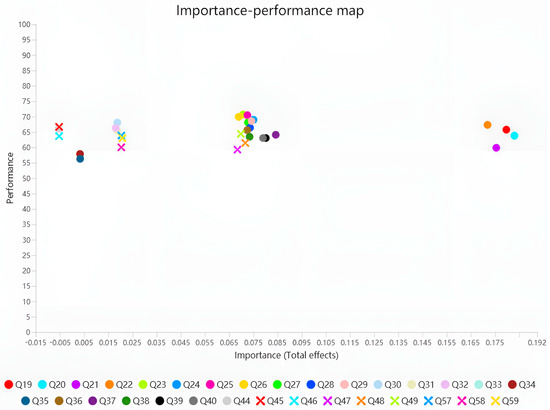
Figure 5.
IPMA for Behavioural Expectation (indicators).
Table 22 shows the total effect of the different constructs on BEXP, illustrating their importance and performance. BI to Adopt BCT in SCM (0.634) has the highest total effect on BEXP, confirming its central role in adoption. The relationship between intention and expectation is well established in technology adoption research [110]. Relative Advantage (0.446) also has a strong overall effect, highlighting the importance of presenting the perceived benefits of BCT to potential adopters.
Table 22.
Importance–performance Total effect.
Cost (−0.015) shows a negative, albeit insignificant, effect, suggesting that cost concerns may not significantly deter adoption, especially if perceived benefits outweigh financial concerns [98]. Regulatory support (0.056) has a relatively small overall effect, but remains significant. This is consistent with previous findings that regulatory support plays a facilitating role rather than acting as a primary driver of adoption [173,174].
The mix of visual and tabular analytics gives a thorough knowledge of the elements that influence BEXP’s adoption of BCT for SCM. The findings indicate that BI, Relative Advantage, and Top Management Support are the most impactful constructs, with strong performance in both constructions and indicators.
At the same time, factors such as cost and complexity show lower importance and performance, suggesting that they are not immediate barriers to adoption but require attention for smoother implementation. Regulatory support, while not a primary driver, continues to act as a facilitator, highlighting the need for supportive policies and frameworks to drive BCT adoption.
The study highlights the importance of addressing both high-impact variables and potential inhibitors, such as complexity, and provides practical insights for organisations and policy makers looking to promote BCT adoption in supply chains. By focusing on Relative Advantage, Top Management Support, and BI, stakeholders can develop strategies to ensure successful and sustainable adoption in SMEs.
5.7. Necessary Condition Analysis (NCA)
The Necessary Condition Analysis (NCA) conducted using SmartPLS 4.1.0.0 provides key insights into the adoption of BCT in SCM. The results in Table 23, Table 24, Table 25 and Table 26 shed light on how different constructs influence BEXP and BI, respectively, highlighting the crucial importance of compatibility, regulatory support, and top management support. These results highlight the importance of understanding the relationships between these factors for successful BCT adoption in SCM.
Table 23.
NCAPERM ceilingline effect size overview for BEXP.
Table 24.
NCA ceilingline effect size overview for Behavioural Expectation.
Table 25.
NCAPERM ceilingline effect size overview for Behavioural Intention to Adopt BCT in SCM.
Table 26.
NCA ceilingline effect size overview for Behavioural Intention to Adopt BCT in SCM.
Table 23 analyses the ceiling effect sizes for the different constructs on BEXP. Compatibility emerges as the most critical construct, with effect sizes of 0.128 (CE-FDH) and 0.064 (CR-FDH), indicating that the compatibility of blockchain with existing systems is a key determinant in shaping firms’ BEXP. This finding suggests that the more compatible BCT is with a firm’s operational processes, the more likely it is that the expected benefits of BCT implementation will be realised.
Another construct, regulatory support, shows a significant effect size of 0.084 (CE-FDH), further highlighting the importance of an enabling regulatory environment. Firms operating in the SCM sector expect BCT adoption to be more successful when government regulations are clear, supportive, and conducive to innovation. Without such a framework, adoption would be slow and fraught with compliance challenges.
On the other hand, complexity, cost, security, and top management support have negligible effect sizes, indicating that they may influence other aspects of BCT adoption but are not direct determinants of BEXP. These factors may act more as moderators that influence other key constructs, such as compatibility or regulatory support.
Table 24 adds further depth by assessing the inefficiencies within these constructs. Behavioural Intention shows a high Outcome Inefficiency score of 87.574 (CE-FDH), suggesting that while organisations may have the intention to adopt blockchain, inefficiencies remain in aligning these intentions with tangible behavioural expectations. This suggests a gap between organisational desire and execution, likely due to uncertainties about the long-term benefits of the technology or perceived complexity.
In Table 25, the overview of the maximum effect sizes for BI to Adopt BCT shows that Compatibility again plays a dominant role, with significant effect sizes of 0.099 (CE-FDH) and 0.091 (CR-FDH). This emphasises the importance of compatibility in influencing an organisation’s decision to embrace blockchain, and it also implies that organisations emphasise ease of connection with present systems when determining their adoption intentions.
Similarly, regulatory support remains critical, with effect sizes of 0.064 (CE-FDH) and 0.048 (CR-FDH), confirming that a clear regulatory framework is necessary for organisations to move beyond mere intention to actual adoption. Top management support also plays a critical role, with a significant effect size of 0.075 (CE-FDH), illustrating the importance of leadership in facilitating the adoption process. Top management involvement ensures proper allocation of resources and strategic oversight, which are critical for successful BCT adoption.
The analysis from Table 26 mirrors the findings from Table 25, but introduces measures of accuracy and inefficiency. Compatibility exhibits high accuracy in both models (100% in CE-FDH), but the inefficiency measures suggest that organisations may not be fully exploiting the compatibility potential of BCT. Regulatory support also maintains high accuracy, but inefficiencies (74.994 in CE-FDH) suggest that there is room for improvement in leveraging the regulatory environment to further drive adoption.
The NCA analysis shows that Compatibility and Regulatory Support are the most influential drivers of both BEXP and BI to Adopt BCT in SCM. Compatibility remains the most important requirement for successful BCT adoption, highlighting the need for BCT solutions that seamlessly integrate with existing organisational processes. Meanwhile, regulatory support is essential to ensure that legal and compliance frameworks are aligned with organisational objectives. Top management support also proves to be important, as leadership commitment is essential for overcoming adoption hurdles.
In contrast, constructs such as complexity, cost, and security appear to have less direct impact on adoption intentions or expectations, suggesting that they may serve as secondary factors. For organisations to maximise their BCT adoption efforts, they should focus on optimising compatibility and ensuring they operate in a regulatory environment that is conducive to BCT innovation. In addition, leadership engagement should be strengthened to minimise inefficiencies and thus drive more effective adoption strategies.
In summary, the NCA’s findings highlight the complex interplay of factors required to ensure the successful adoption of BCT in SCM, with a particular focus on the key role of compatibility and regulatory support.
5.8. Artificial Neural Network Analysis
Multiple Regression Analysis (MRA) and structural equation modeling are examples of traditional linear models (SEM) that are often insufficient for effectively capturing the complex, nonlinear characteristics inherent in human decision-making processes. These models are primarily concerned with discovering linear connections and work under the idea that a drop in one component may be countered by an increase in another, based on a linear equation linking exogenous and endogenous structures [175,176]. However, this study covers non-compensatory exogenous constructs, such as the decline in top management support, which cannot be compensated by an increase in regulatory support due to the unique character of each construct’s definition and conceptualisation [24,157].
To address these restrictions, this study uses artificial neural networks (ANNs) in combination with partial least squares structural equation modeling (PLS-SEM). ANNs can capture both linear and nonlinear interactions in non-compensatory models [42]. Moreover, ANNs demonstrate robustness against various sources of error, including noise, distribution non-normality, homoscedasticity, nonlinearity, and multicollinearity. This capability renders ANNs superior in predictive accuracy compared to traditional statistical methods such as MRA and SEM [177]. Despite their advantages, ANN models’ “black-box” structure restricts their capacity to establish the significance levels of causal linkages [178]. To capitalise on the benefits of both approaches, this work combines SEM and ANNs by employing important predictors discovered in PLS-SEM as input neurons in the ANN models [179].
This study’s ANN design consists of three layers: input, hidden, and output. A feed-forward back-propagation technique using multilayer perceptrons is used to determine the root mean square errors (RMSE) and the normalised significance of the input neurons [36]. To counteract overfitting, a ten-fold cross-validation strategy is adopted, in which 10% of the data is used for testing, while the remaining 90% is used for training the neural networks [180]. The sigmoid function is used as the activation function for both the hidden and output layers.
Reveals significant insights into the adoption of BCT in SCM through an artificial neural network (ANN) approach. The ANN models show how key factors such as relative advantage, top management support, complexity, cost, and regulatory support interact to influence BI and BEXP towards BCT adoption (Figure 6, Figure 7, Figure 8, Figure 9 and Figure 10 and Table 27, Table 28, Table 29, Table 30 and Table 31).
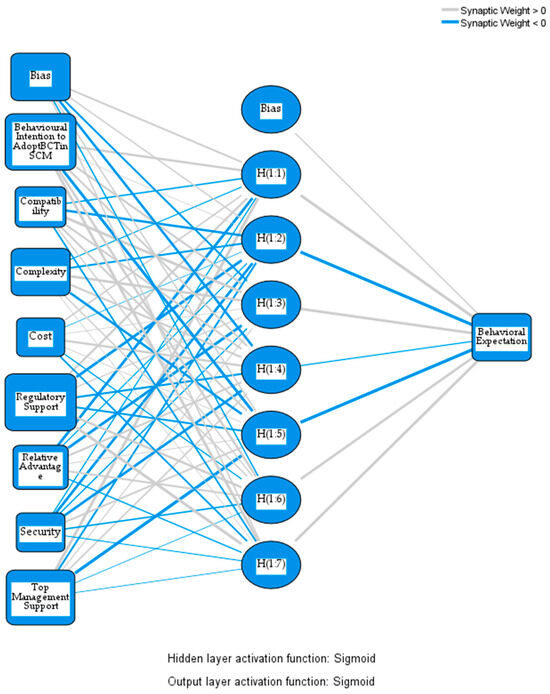
Figure 6.
Neural network model 1.
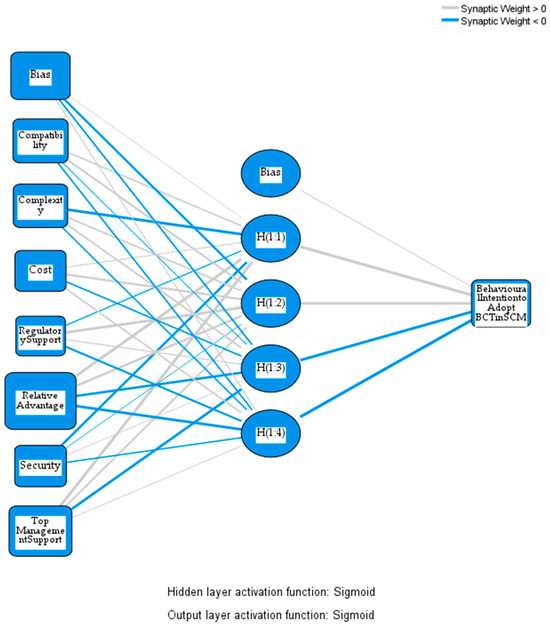
Figure 7.
Neural network model 2.
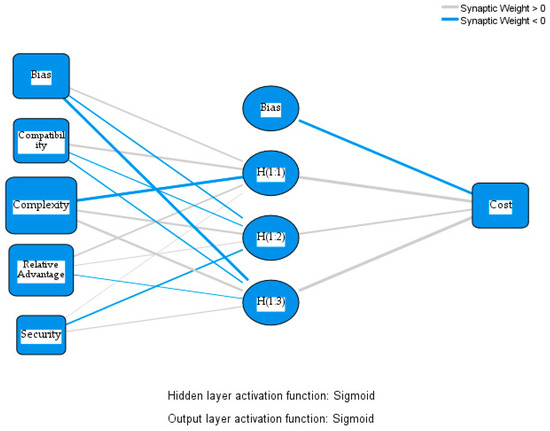
Figure 8.
Neural network model 3.
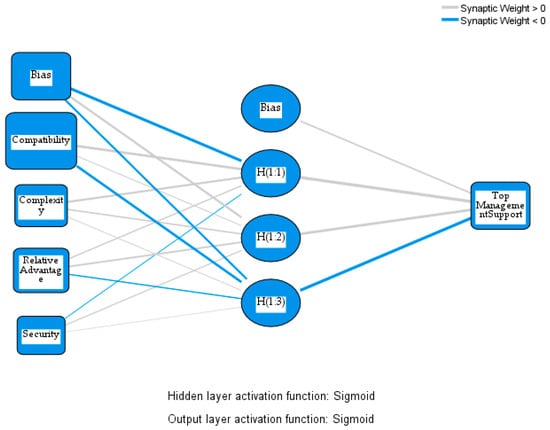
Figure 9.
Neural network model 4.

Figure 10.
Neural network model 5.
Table 27.
MLP independent variable importance for Behavioural expectation.
Table 28.
MLP independent variable importance for Behavioural Intention to Adopt BCT in SCM.
Table 29.
MLP independent variable importance for Cost.
Table 30.
MLP independent variable importance for Top Management Support.
Table 31.
MLP independent variable importance for Relative Advantage.
Relative Advantage is consistently the most influential variable across all models, as demonstrated in Figure 6 and Figure 7 and Figure 10. This conclusion emphasises the significance of anticipated benefits, such as greater efficiency, transparency, and dependability, in influencing the choice to use BCT. For example, in Table 23, Relative Advantage has a normalised importance of 100% in predicting behavioural intention to adopt BCT in SCM.
Organisations see BCT as a disruptive technology that provides considerable benefits over existing systems, increasing the chance of adoption. This is in line with the larger research, which emphasises the importance of perceived advantages in technology adoption decisions.
Top management support plays a critical function in determining BCT adoption, as illustrated in Figure 9 and Table 30. The analysis shows that compatibility and relative advantage are closely related to top management support, indicating that leadership is more likely to support blockchain initiatives when the technology is perceived as beneficial and integrates well with existing systems. This emphasises the role of leadership in fostering BCT adoption, since senior management offers strategic direction and the resources required for execution.
Complexity and cost, examined in Figure 8 and Table 29, have a more nuanced impact. Complexity significantly increases cost, suggesting that more complex BCT systems require greater financial and operational resources. However, the direct effect of complexity on BI is less pronounced, suggesting that while complex systems may be more expensive, this does not necessarily inhibit adoption. Instead, the choice to implement BCT is affected by anticipated benefits and management support rather than the obstacles provided by complexity and expense.
Regulatory support, shown in Figure 6 and Table 27, is also a key factor, particularly in influencing BEXP. Organisations are more likely to adopt BCT when there is a clear and supportive regulatory framework. This finding highlights the importance of government and regulatory bodies in creating an environment that facilitates BCT adoption, by reducing uncertainty and potential risks.
Finally, while security is not the most dominant factor, it still plays a role in influencing relative advantage and compatibility, as shown in Figure 6 and Figure 10. Ensuring robust security within BCT systems increases the perceived benefits of the technology, further encouraging adoption.
In conclusion, the ANN analysis emphasises the crucial role of relative advantage, top management support, and compatibility in promoting BCT adoption in SCM. While cost and complexity pose operational challenges, their influence is secondary to perceived benefits and top management support. Regulatory support also can facilitate adoption. The study highlights the need for organisations to focus on aligning BCT adoption strategies with clear leadership, system integration, and regulatory clarity to maximise successful implementation.
6. Discussion
This section gives a complete study of the elements that influence BI’s decision to use BCT in SCM. We investigate the multifaceted relationships between critical variables such as compatibility, complexity, cost, regulatory support, relative advantage, security, and BEXP using a variety of theoretical frameworks and methodological approaches, including the Technology–Organisation–Environment (TOE) framework, the Unified Theory of Acceptance and Use of Technology (UTAUT), and Diffusion of Innovations (DOI), as well as NCA and PLS-ANN methods.
6.1. Theoretical Implications
The results derived from the NCA and PLS-ANN models highlight the complexity of BCT adoption in SCM, particularly the interrelationships between individual, organizational, and societal factors. Compatibility consistently emerges as a key determinant of BCT adoption, with high effect sizes in Table 25 and Table 26. This underlines the DOI framework’s emphasis on compatibility as a critical aspect in innovation decision making. The major significance of compatibility confirms earlier studies in this area, implying that technologies that fit well with established organisational processes are more likely to be adopted [181].
Cost, which is frequently cited as a barrier to adoption, showed small or negligible effect sizes in this study, suggesting that cost considerations may no longer be a major deterrent, especially when the perceived benefits of BCT surpass the related expenses. This validates the conclusions of prior investigations [90], indicating that organisations are willing to invest in BCT when they perceive long-term benefits.
The serial multiple mediation models also revealed that regulatory support and top management support play a pivotal role in shaping both BI and BEXP. This reinforces the need to integrate a multi-level analysis that includes societal perspectives on the adoption process, as seen in the TOE framework. In addition, the results from Table 25 and Table 26 suggest that although complexity is traditionally considered a barrier [108], it does not significantly inhibit the intention or expectation to adopt BCTs in this context.
The integration of PLS-ANN methods offers new perspectives by revealing nonlinear relationships that are not captured by traditional methods. This supports the view that technology adoption is a complex, non-compensatory process where improvements in one area (e.g., top management support, compatibility) cannot simply compensate for deficiencies in another (e.g., regulatory support). This challenges previous research that treats technology adoption as a linear, compensatory process [182].
6.2. Practical Implications
The findings offer various practical insights for managers and policy makers looking to encourage the use of BCT in SCM, particularly among SMEs. First, the importance of compatibility emphasises the need for BCT providers to focus on providing solutions that connect seamlessly with current systems. Organisations may need to evaluate their current infrastructure to ensure that it is conducive to BCT adoption, a point supported by the high effect sizes for Compatibility in Table 25 and Table 26.
Regulatory support also emerges as a key enabler, suggesting that governments should work to establish a clearer regulatory framework that encourages innovation while addressing compliance concerns. This aligns with the TOE framework’s emphasis on environmental variables as crucial to technology adoption [103]. In addition, the high accuracy and inefficiency scores for regulatory support suggest that although firms perceive regulatory support as critical, inefficiencies in current regulations may hinder faster adoption. Policy makers should aim to streamline regulatory processes to remove these inefficiencies.
The insignificant role of cost suggests that firms will not be deterred by the financial investment required to adopt BCT, as long as they perceive sufficient long-term benefits (i.e., relative advantage). This presents an opportunity for blockchain solution providers to highlight the long-term value proposition of their technologies. Furthermore, senior management support is vital, implying that company decision makers must actively participate in BCT implementation plans. This is particularly relevant for SMEs, where top management involvement is often crucial for technology-related decisions [183,184].
7. Conclusions
This study contributes to the advancement of understanding of BCT adoption in SCM through the utilisation of a methodological triad comprising PLS-ANN-NCA. Table 32 shows the comparative analysis of data analysis methods and results, thereby resolving the so-called “linearity–complexity paradox” that is pervasive in technology adoption research. The study’s key innovations are as follows:
Table 32.
Comparative analysis of data analysis methods and results.
- (1)
- Methodological Innovations:
NCA validated necessity thresholds (e.g., compatibility NCA’s ceilingline effect size overview for BEXP and BI (CE-FDH Original effect size = 0.128, CE-FDH Original effect size = 0.099)), demonstrating that compatibility is a non-negotiable baseline for adoption [33,185]. This methodology extends Richter et al.’s (2020) PLS-SEM-NCA integration [33] by incorporating ANNs for nonlinear dynamics, thus offering a novel paradigm for technology adoption under resource constraints [186,187], with PLS-SEM providing validation of sufficiency paths (e.g., relative advantage β = 0.533, p < 0.001, as determined by PLS-SEM). Additionally, ANNs have been employed to resolve nonlinear dynamics. Should a substantial discrepancy be observed, this may be indicative of a threshold effect: for instance, the top management support’s endorsement of PLS is evidenced by a beta value of 0.303. However, a higher degree of significance is attributed to top management support, as indicated by a standardised importance rating of 65.2%.
- (2)
- Cross-Industry and International Applicability:
In the manufacturing sector, the high readiness level can be attributed to the advanced state of ERP integration maturity (with 65% of companies adopting SAP S/4HANA compared to 28% in the agricultural sector) [188,189]. In the healthcare industry, regulatory necessity thresholds are 37% higher (NC = 0.52) compared to manufacturing (NC = 0.38), reflecting the more stringent data governance requirements characteristic of this sector [190,191,192]. With regard to global adaptation [193], The proposed formula enables scaling to emerging economies (e.g., India’s adjusted NC = 0.25) [185,194]. This finding is in accordance with the conclusions of Wu et al. (2024) regarding the application of blockchain traceability models in EU–China supply chains [186,187,195]. The implementation of interoperability standards resulted in a 62% reduction in grey markets [196].
- (3)
- Actionable Stakeholder Recommendations (Table 33):
Table 33. Actionable stakeholder recommendations.
- (4)
- Theoretical-Practical Synergy:
Dynamic Capabilities: BCT enhances supply chain trust through transparency (e.g., 62% reduction in gray markets via traceability) [195,201].
Policy Relevance: This initiative aligns with China’s “14th Five-Year Plan” blockchain initiatives and the European Blockchain Services Infrastructure (EBSI) of the European Union for cross-border compliance [185,202,203].
In future research, the framework should be tested in Association of Southeast Asian Nations (ASEAN) manufacturing hubs using threshold-adjusted NCA (NC × 0.7 for low-GDP contexts). In addition, the ANN architecture should be expanded to incorporate geospatial variables (e.g., port proximity effects on logistics BCT adoption) [185].
Author Contributions
Conceptualization, X.H.; Methodology, X.H.; Software, X.H.; Validation, L.-M.G. and X.H.; Formal analysis, X.H.; Investigation, X.H.; Resources, X.H.; Data curation, X.H.; Writing – original draft, X.H.; Writing – review & editing, X.H.; Visualization, X.H.; Supervision, L.-M.G. and X.H; Project administration, X.H.; Funding acquisition, X.H.; All authors have read and agreed to the published version of the manuscript.
Funding
This research received no external funding.
Institutional Review Board Statement
Not applicable.
Informed Consent Statement
Informed consent was obtained from all subjects involved in the study.
Data Availability Statement
The data that support the findings of this study are available from the corresponding author, X.H., upon reasonable request.
Conflicts of Interest
The authors declare no conflicts of interest.
Appendix A
Screening Questions
Q1. How would you rate your awareness of blockchain?
- ▪
- Basic
- ▪
- Medium
- ▪
- High
- ▪
- None
Q2. How would you rate your experience with blockchain technology?
- ▪
- 1–2 years
- ▪
- 2–3 years
- ▪
- 3–4 years
- ▪
- 4–5 years
- ▪
- 5–6 years
- ▪
- >6 years
- ▪
- None
Q3. Which of the following best describe your role with regards to technology purchase?
- ▪
- I am involved in decision making
- ▪
- I am involved in recommending
- ▪
- I am involved in both recommendation and decision making
- ▪
- I am not involved
- ▪
- Others
Q4. Which of the following best describe your present level of understanding on blockchain technology?
- ▪
- Learning the technology
- ▪
- Testing technology
- ▪
- Implementing technology
- ▪
- None
- ▪
- Others
Q5. Do you feel that blockchain will have an impact on the work that your company is doing?
- ▪
- No, it will not
- ▪
- Unsure
- ▪
- Yes, in the next 12 months
- ▪
- Yes, in the near future
- ▪
- We are already using it
Q6. Gender:
- ▪
- Male
- ▪
- Female
Q9. Work Experience (year):
- ▪
- >1 ≤ 3 years
- ▪
- >3 ≤ 5 years
- ▪
- >5 ≤ 10 years
- ▪
- >10 ≤ 15 years
- ▪
- >15 ≤ 20 years
- ▪
- >20 ≤ 25 years
- ▪
- >25 years
- ▪
- None
Q11. Respondents Current position level:
- ▪
- Junior management
- ▪
- Middle management
- ▪
- Senior management
- ▪
- Research and Development Experts
- ▪
- Supply chain managers
- ▪
- Marketing managers Top executive
- ▪
- IT managers
- ▪
- Finance manager
- ▪
- CEO/Vice-president
- ▪
- Chairman
- ▪
- Director
- ▪
- Executive Director
- ▪
- Secretary
- ▪
- Deputy Secretary
- ▪
- Other
Q12. Areas:
- ▪
- Beijing
- ▪
- Shanghai
- ▪
- Guangzhou.
- ▪
- Shenzhen
- ▪
- Hangzhou
- ▪
- Tianjin
- ▪
- Chongqing
- ▪
- Other
Q14. Firm Sales turnover (year):
- ▪
- Less than CNY 500,000
- ▪
- Between CNY 600,000–CNY 1,000,000
- ▪
- Between CNY 1,000,000–CNY 2,000,000
- ▪
- Between CNY 2,000,000–CNY 3,000,000
- ▪
- Between CNY 3,000,000–CNY 10,000,000
- ▪
- Between CNY 10,000,000–CNY 50,000,000
- ▪
- Between CNY 50 Million–CNY 100 Million
- ▪
- More than CNY 100 Million
Q15. Firm age:
- ▪
- Less than 3 years
- ▪
- 6 to 10 years
- ▪
- 6 to 10 years
- ▪
- 10 to 15 years
- ▪
- 15–20 years
- ▪
- 20–30 years
- ▪
- 30–40 years
- ▪
- Above 40 years
Q16. Firm size (No. of employees):
- ▪
- <10
- ▪
- 11–50
- ▪
- 51–100
- ▪
- 101–200
- ▪
- 201–300
- ▪
- 301–500
- ▪
- 501–1000
- ▪
- 1001–2000
- ▪
- >2000
Q18. Industry:
- ▪
- Agriculture
- ▪
- Forestry
- ▪
- Pastoralism
- ▪
- Fishing
- ▪
- Industry (including mining, manufacturing, electricity, heat, gas, and water production and supply)
- ▪
- Construction
- ▪
- Wholesale
- ▪
- Retail trade
- ▪
- Transportation (excluding railroad transportation)
- ▪
- Warehousing
- ▪
- Postal Industry
- ▪
- Accommodation
- ▪
- Catering
- ▪
- Information Transmission Industry (including telecommunications, Internet, and related services)
- ▪
- Software and Information Technology Services
- ▪
- Real Estate Development and Operation
- ▪
- Property Management
- ▪
- Leasing and Business Services
- ▪
- Scientific Research and Technology Services
- ▪
- Water Conservancy
- ▪
- Environment and Public Facilities Management
- ▪
- Residential Services
- ▪
- Repair and Other Services
- ▪
- Social Work
- ▪
- Culture
- ▪
- Sports and Recreation
- ▪
- Logistics and Distribution
- ▪
- Public Healthcare
- ▪
- Media
- ▪
- Finance
- ▪
- Other service areas
Appendix B
Table A1.
Common method bias analysis.
Table A1.
Common method bias analysis.
| Construct | Indicator | Substantive Factor loading(R1) | R12 | Method Factor Loading(R2) | R22 |
|---|---|---|---|---|---|
| Behavioural Intention to Adopt BCT in SCM | Q19 | 0.900 *** | 0.810000 | 0.045 | 0.002025 |
| Q20 | 0.929 *** | 0.863041 | −0.030 | 0.000900 | |
| Q21 | 0.889 *** | 0.790321 | −0.041 | 0.001681 | |
| Q22 | 0.858 *** | 0.736164 | 0.026 | 0.000676 | |
| Relative Advantage | Q23 | 0.841 *** | 0.707281 | −0.047 | 0.002209 |
| Q24 | 0.888 *** | 0.788544 | 0.061 | 0.003721 | |
| Q25 | 0.890 *** | 0.792100 | −0.052 | 0.002704 | |
| Q26 | 0.865 *** | 0.748225 | −0.091 | 0.008281 | |
| Q27 | 0.893 *** | 0.797449 | 0.026 | 0.000676 | |
| Q28 | 0.883 *** | 0.779689 | 0.097 | 0.009409 | |
| Q29 | 0.904 *** | 0.817216 | 0.000 | 0.000000 | |
| Security | Q30 | 0.921 *** | 0.848241 | −0.005 | 0.000025 |
| Q31 | 0.935 *** | 0.874225 | 0.032 | 0.001024 | |
| Q32 | 0.920 *** | 0.846400 | −0.027 | 0.000729 | |
| Complexity | Q33 | 0.916 *** | 0.839056 | 0.080 | 0.006400 *** |
| Q34 | 0.921 *** | 0.848241 | −0.031 | 0.000961 | |
| Q35 | 0.925 *** | 0.855625 | −0.049 | 0.002401 * | |
| Compatibility | Q36 | 0.846 *** | 0.715716 | −0.043 | 0.001849 |
| Q37 | 0.906 *** | 0.820836 | 0.093 | 0.008649 | |
| Q38 | 0.899 *** | 0.808201 | −0.195 | 0.038025 * | |
| Q39 | 0.903 *** | 0.815409 | 0.022 | 0.000484 | |
| Q40 | 0.894 *** | 0.799236 | 0.116 | 0.013456 | |
| Cost | Q44 | 0.906 *** | 0.820836 | 0.033 | 0.001089 |
| Q45 | 0.914 *** | 0.835396 | −0.073 | 0.005329 * | |
| Q46 | 0.867 *** | 0.751689 | 0.042 | 0.001764 | |
| Top Management Support | Q47 | 0.926 *** | 0.857476 | −0.060 | 0.003600 |
| Q48 | 0.937 *** | 0.877969 | −0.009 | 0.000081 | |
| Q49 | 0.895 *** | 0.801025 | 0.071 | 0.005041 | |
| Regulatory Support | Q57 | 0.901 *** | 0.811801 | 0.053 | 0.002809 |
| Q58 | 0.927 *** | 0.859329 | −0.061 | 0.003721 | |
| Q59 | 0.922 *** | 0.850084 | 0.009 | 0.000081 | |
| Behavioural Expectation | Q60 | 0.937 *** | 0.877969 | 0.014 | 0.000196 |
| Q61 | 0.961 *** | 0.923521 | −0.019 | 0.000361 | |
| Q62 | 0.943 *** | 0.889249 | 0.006 | 0.000036 |
*** p ≤ 0.001; * 0.01 < p ≤ 0.05.
References
- Grand View Research, Blockchain Technology Market Size|Industry Report, 2030. [Online]. Available online: https://www.grandviewresearch.com/industry-analysis/blockchain-technology-market (accessed on 23 February 2025).
- Statista, China: Blockchain Market Size 2022|Statista. [Online]. Available online: https://www.statista.com/statistics/1285636/china-blockchain-market-size/ (accessed on 30 May 2024).
- Green, G. Blockchain in China, Stimson Center. [Online]. Available online: https://www.stimson.org/2021/blockchain-in-china/?utm_source=chatgpt.com (accessed on 23 February 2025).
- Jiao, Z. Applications and Prospects of Blockchain Technology in China’s Logistics Industry. In Contemporary Logistics in China; Springer: Berlin/Heidelberg, Germany, 2021; pp. 239–262. [Google Scholar] [CrossRef]
- Yao, Q.; Zhang, H. Improving Agricultural Product Traceability Using Blockchain. Sensors 2022, 22, 3388. [Google Scholar] [CrossRef] [PubMed]
- AL-Ashmori, A.; Basri, S.B.; Dominic, P.D.D.; Capretz, L.F.; Muneer, A.; Balogun, A.O.; Gilal, A.R.; Ali, R.F. Classifications of Sustainable Factors in Blockchain Adoption: A Literature Review and Bibliometric Analysis. Sustainability 2022, 14, 5176. [Google Scholar] [CrossRef]
- Wong, S.; Yeung, J.K.W.; Lau, Y.-Y.; Kawasaki, T.; Kwong, R. A Critical Literature Review on Blockchain Technology Adoption in Supply Chains. Sustainability 2024, 16, 5174. [Google Scholar] [CrossRef]
- Duan, K.; Pang, G.; Lin, Y. Exploring the current status and future opportunities of blockchain technology adoption and application in supply chain management. J. Digit. Econ. 2024, 2, 244–288. [Google Scholar] [CrossRef]
- Dudczyk, P.; Dunston, J.K.; Crosby, G.V. Blockchain Technology for Global Supply Chain Management: A Survey of Applications, Challenges, Opportunities and Implications. IEEE Access 2024, 12, 70065–70088. [Google Scholar] [CrossRef]
- Chang, S.E.; Chen, Y.C.; Lu, M.F.; Luo, H.L. Development and evaluation of a smart contract–Enabled blockchain system for home care service innovation: Mixed methods study. JMIR Med. Inform. 2020, 8, e15472. [Google Scholar] [CrossRef]
- Hasan, H.R.; Salah, K. Combating Deepfake Videos Using Blockchain and Smart Contracts. IEEE Access 2019, 7, 41596–41606. [Google Scholar] [CrossRef]
- Kouhizadeh, M.; Sarkis, J. Blockchain Practices, Potentials, and Perspectives in Greening Supply Chains. Sustainability 2018, 10, 3652. [Google Scholar] [CrossRef]
- Wang, Y.; Kogan, A. Designing confidentiality-preserving Blockchain-based transaction processing systems. Int. J. Account. Inf. Syst. 2018, 30, 1–18. [Google Scholar] [CrossRef]
- Kamble, S.; Gunasekaran, A.; Arha, H. Understanding the Blockchain technology adoption in supply chains-Indian con-text. Int. J. Prod. Res. 2019, 57, 2009–2033. [Google Scholar] [CrossRef]
- Makhdoom, I.; Abolhasan, M.; Abbas, H.; Ni, W. Blockchain’s adoption in IoT: The challenges, and a way forward. J. Netw. Comput. Appl. 2019, 125, 251–279. [Google Scholar] [CrossRef]
- Queiroz, M.M.; Telles, R.; Bonilla, S.H. Blockchain and supply chain management integration: A systematic review of the literature. Supply Chain Manag. 2020, 25, 241–254. [Google Scholar] [CrossRef]
- Ahmed, F.; Qin, Y.J.; Martínez, L. Sustainable Change Management through Employee Readiness: Decision Support System Adoption in Technology-Intensive British E-Businesses. Sustainability 2019, 11, 2998. [Google Scholar] [CrossRef]
- Bigi, M.; Greenan, N.; Hamon-Cholet, S.; Lanfranchi, J. The Human Sustainability of ICT and Management Changes: Ev-idence for the French Public and Private Sectors. Sustainability 2018, 10, 3570. [Google Scholar] [CrossRef]
- Rahman, R.U.; Ali Shah, S.M.; El-Gohary, H.; Abbas, M.; Haider Khalil, S.; Al Altheeb, S.; Sultan, F. Social Media Adoption and Financial Sustainability: Learned Lessons from Developing Countries. Sustainability 2020, 12, 10616. [Google Scholar] [CrossRef]
- Hasan, M.R.; Deng, S.; Sultana, N.; Hossain, M.Z. The applicability of blockchain technology in healthcare contexts to contain COVID-19 challenges. Libr. High Technol. 2021, 39, 814–833. [Google Scholar] [CrossRef]
- Paradza, D.; Daramola, O. Business Intelligence and Business Value in Organisations: A Systematic Literature Review. Sustainability 2021, 13, 11382. [Google Scholar] [CrossRef]
- Chauhan, V.; Yadav, R.; Choudhary, V. Analyzing the impact of consumer innovativeness and perceived risk in internet banking adoption. Int. J. Bank Mark. 2019, 37, 323–339. [Google Scholar] [CrossRef]
- Agi, M.A.N.; Jha, A.K. Blockchain technology in the supply chain: An integrated theoretical perspective of organizational adoption. Int. J. Prod. Econ. 2022, 247, 108458. [Google Scholar] [CrossRef]
- Wong, L.-W.; Leong, L.-Y.; Hew, J.-J.; Tan, G.W.-H.; Ooi, K.-B. Time to seize the digital evolution: Adoption of blockchain in operations and supply chain management among Malaysian SMEs. Int. J. Inf. Manag. 2020, 52, 101997. [Google Scholar] [CrossRef]
- Zhang, X.; Zheng, H.; Zheng, X. Impact of government fund policy and blockchain technology on closed-loop supply chains in textile and apparel industry. J. Clean. Prod. 2024, 434, 140037. [Google Scholar] [CrossRef]
- Zhu, J.; Feng, T.; Lu, Y.; Jiang, W. Using blockchain or not? A focal firm’s blockchain strategy in the context of carbon emission reduction technology innovation. Bus. Strategy Environ. 2024, 33, 3505–3531. [Google Scholar] [CrossRef]
- Sharabati, A.-A.A.; Jreisat, E.R. Blockchain Technology Implementation in Supply Chain Management: A Literature Review. Sustainability 2024, 16, 2823. [Google Scholar] [CrossRef]
- Nath, S.D.; Khayer, A.; Majumder, J.; Barua, S. Factors affecting blockchain adoption in apparel supply chains: Does sustainability-oriented supplier development play a moderating role? Ind. Manag. Data Syst. 2022, 122, 1183–1214. [Google Scholar] [CrossRef]
- Chen, X.; Ashley, D.L. Understanding the challenges of blockchain technology adoption: Evidence from China’s developing carbon markets. Inf. Technol. People, 2024; ahead-of-printing. [Google Scholar] [CrossRef]
- Mishra, N.K.; Raj, A.; Jeyaraj, A.; Gupta, R. Antecedents and Outcomes of Blockchain Technology Adoption: Meta-Analysis. J. Comput. Inf. Syst. 2024, 64, 342–359. [Google Scholar] [CrossRef]
- Rakshit, S.; Jeyaraj, A.; Paul, T. SME Performance Through Blockchain Technologies. J. Comput. Inf. Syst. 2024, 64, 204–218. [Google Scholar] [CrossRef]
- Shafayet, M.; Rahman, S.M.; Jana, L.-H.B. Purchase spillovers from the metaverse to the real world: The roles of social presence, trialability, and customer experience. J. Consum. Behav. 2024, 23, 1–52. [Google Scholar] [CrossRef]
- Richter, N.F.; Schubring, S.; Hauff, S.; Ringle, C.M.; Sarstedt, M. When predictors of outcomes are necessary: Guidelines for the combined use of PLS-SEM and NCA. Ind. Manag. Data Syst. 2020, 120, 2243–2267. [Google Scholar] [CrossRef]
- Dul, J. Necessary Condition Analysis (NCA). Organ. Res. Methods 2016, 19, 10–52. [Google Scholar] [CrossRef]
- Wong, L.-W.; Tan, G.W.-H.; Ooi, K.-B.; Chan, H.K. Blockchains for SMEs: A Fit-Viability perspective moderated by or-ganizational innovation diffusion for supply chain performance. Transp. Res. Part E Logist. Transp. Rev. 2024, 182, 103396. [Google Scholar] [CrossRef]
- Alnoor, A.; Atiyah, A.G.; Abbas, S. Blockchain Adoption Strategy from the Perspective of Organization, Technology and Environment Theory: A Hybrid SEM and ANN Approach. Global Bus. Rev. 2024. [Google Scholar] [CrossRef]
- Leong, L.-Y.; Hew, T.-S.; Ooi, K.-B.; Tan, G.W.-H.; Koohang, A. An SEM-ANN Approach—Guidelines in Information Systems Research. J. Comput. Inf. Syst. 2024; advance online publication. [Google Scholar] [CrossRef]
- Leong, L.-Y.; Hew, J.-J.; Lee, V.-H.; Tan, G.W.-H.; Ooi, K.-B.; Rana, N.P. An SEM-ANN analysis of the impacts of Blockchain on competitive advantage. Ind. Manag. Data Syst. 2023, 123, 967–1004. [Google Scholar] [CrossRef]
- Venkatesh, V.; Goyal, S. Expectation disconfirmation and technology adoption: Polynomial modeling and response surface analysis. MIS Q. 2010, 34, 281–303. [Google Scholar] [CrossRef]
- Zhou, Y.; Gao, X.; Nie, J. Value of blockchain-enabled supply chain traceability under competition. Int. Trans. Oper. Res. 2024, 31, 3669–3703. [Google Scholar] [CrossRef]
- Shen, D.; Liu, Q.; Cudjoe, D. Competing Manufacturers Adopt Blockchain for Tracing Power Batteries: Is There a Win-Win Zone? Energies 2024, 17, 2868. [Google Scholar] [CrossRef]
- Singh, A.K.; Liébana-Cabanillas, F. An SEM-Neural Network Approach for Predicting Antecedents of Online Grocery Shopping Acceptance. Int. J. Hum. Comput. Interact. 2024, 40, 1723–1745. [Google Scholar] [CrossRef]
- Shabnam, F.; Chan, K.; Lee, C.; Jeon, M.; Son, H.; Rudnik, J.; Coughlin, J. User Adoption of Intelligent Environments: A Review of Technology Adoption Models, Challenges, and Prospects. Int. J. Hum. Comput. Interact. 2024, 40, 986–998. [Google Scholar] [CrossRef]
- Park, K.O. A Study on Sustainable Usage Intention of Blockchain in the Big Data Era: Logistics and Supply Chain Management Companies. Sustainability 2020, 12, 10670. [Google Scholar] [CrossRef]
- Bhardwaj, A.K.; Garg, A.; Gajpal, Y. Determinants of Blockchain Technology Adoption in Supply Chains by Small and Medium Enterprises (SMEs) in India. Math. Probl. Eng. 2021, 2021, 1–14. [Google Scholar] [CrossRef]
- Balci, G.; Ali, S.I. The relationship between information processing capabilities, Net-Zero capability and supply chain performance. Supply Chain Manag. 2024, 29, 351–370. [Google Scholar] [CrossRef]
- Han, Y.; Fang, X. Systematic review of adopting blockchain in supply chain management: Bibliometric analysis and theme discussion. Int. J. Prod. Res. 2024, 62, 991–1016. [Google Scholar] [CrossRef]
- Shahzad, K.; Zhang, Q.; Ashfaq, M.; Zafar, A.U.; Ahmad, B. Pre- to post-adoption of blockchain technology in supply chain management: Influencing factors and the role of firm size. Technol. Forecast. Soc. Change 2024, 198, 122989. [Google Scholar] [CrossRef]
- Rashid, A.; Ali, S.B.; Rasheed, R.; Amirah, N.A.; Ngah, A.H. A paradigm of blockchain and supply chain performance: A mediated model using structural equation modeling. Kybernetes 2023, 52, 6163–6178. [Google Scholar] [CrossRef]
- Kaur, J.; Kumar, S.; Narkhede, B.E.; Dabić, M.; Rathore, A.P.S.; Joshi, R. Barriers to blockchain adoption for supply chain finance: The case of Indian SMEs. Electron. Commer. Res. 2024, 24, 303–340. [Google Scholar] [CrossRef]
- Antsipava, D.; Strycharz, J.; van Reijmersdal, E.A.; van Noort, G. What drives blockchain technology adoption in the online advertising ecosystem? An interview study into stakeholders’ perspectives. J. Bus. Res. 2024, 171, 114381. [Google Scholar] [CrossRef]
- Surucu-Balci, E.; Iris, Ç.; Balci, G. Digital information in maritime supply chains with blockchain and cloud platforms: Supply chain capabilities, barriers, and research opportunities. Technol. Forecast. Soc. Change 2024, 198, 122978. [Google Scholar] [CrossRef]
- Hamidi, S.M.M.; Hoseini, S.F.; Gholami, H.; Kananizadeh-Bahmani, M. A three-stage digital maturity model to assess readiness for blockchain implementation in the maritime logistics industry. J. Ind. Inf. Integr. 2024, 41, 100643. [Google Scholar] [CrossRef]
- Chen, H.; Wei, N.; Wang, L.; Mobarak, W.F.M.; Albahar, M.A.; Shaikh, Z.A. The Role of Blockchain in Finance Beyond Cryptocurrency: Trust, Data Management, and Automation. IEEE Access 2024, 12, 64861–64885. [Google Scholar] [CrossRef]
- Jaradat, Z.; Al-Hawamleh, A.; Shbail, M.O.A.; Hamdan, A. Does the adoption of blockchain technology add intangible benefits to the industrial sector? Evidence from Jordan. J. Financ. Report. Account. 2024, 22, 327–349. [Google Scholar] [CrossRef]
- Gan, Q.; Lau, R.Y.K. Trust in a ‘trust-free’ system: Blockchain acceptance in the banking and finance sector. Technol. Forecast. Soc. Change 2024, 199, 123050. [Google Scholar] [CrossRef]
- Gupta, R.; Shankar, R. Managing food security using blockchain-enabled traceability system. Benchmarking 2024, 31, 53–74. [Google Scholar] [CrossRef]
- Jreisat, A.; Mili, M. Blockchain Technology in Real Estate: Potential Future and Challenges. In Blockchain in Real Estate: Theoretical Advances and New Empirical Applications; Jreisat, A.B., Mili, M., Eds.; Springer Nature: Singapore; Palgrave Macmillan: London, UK, 2024; pp. 1–13, [Online]; Available online: https://link.springer.com/chapter/10.1007/978-981-99-8533-3_1 (accessed on 23 February 2025).
- Cuya, K.C.; Palaoag, T.D. Blockchain in Higher Education: Advancing Security, Verification, and Trust in Academic Credentials. Nanotechnol. Percept. 2024, 20, 373–386. [Google Scholar]
- Wamba, S.F.; Wamba-Taguimdje, S.-L.; Lu, Q.; Queiroz, M.M. How emerging technologies can solve critical issues in organizational operations: An analysis of blockchain-driven projects in the public sector. Gov. Inf. Q. 2024, 41, 101912. [Google Scholar] [CrossRef]
- Lu, Q.; Liao, C.; Chen, X. The blockchain adoption strategies of online retailer in a dual-channel supply chain. Int. J. Prod. Econ. 2024, 274C, 109322. [Google Scholar] [CrossRef]
- Akanfe, O.; Lawong, D.; Rao, H.R. Blockchain technology and privacy regulation: Reviewing frictions and synthesizing opportunities. Int. J. Inf. Manag. 2024, 76, 102753. [Google Scholar] [CrossRef]
- Lee, S.; Kim, Y.; Cho, S. Searchable Blockchain-Based Healthcare Information Exchange System to Enhance Privacy Pre-serving and Data Usability. Sensors 2024, 24, 1582. [Google Scholar] [CrossRef]
- Ma, S.; Zhang, X. Integrating blockchain and ZK-ROLLUP for efficient healthcare data privacy protection system via IPFS. Sci. Rep. 2024, 14, 11746. [Google Scholar] [CrossRef]
- Daah, C.; Qureshi, A.; Awan, I.; Konur, S. Enhancing Zero Trust Models in the Financial Industry through Blockchain Integration: A Proposed Framework. Electronics 2024, 13, 865. [Google Scholar] [CrossRef]
- Roszko-Wójtowicz, E.; Deep Sharma, G.; Dańska-Borsiak, B.; Grzelak, M.M. Innovation-Driven E-Commerce Growth in the EU: An Empirical Study of the Propensity for Online Purchases and Sustainable Consumption. Sustainability 2024, 16, 1563. [Google Scholar] [CrossRef]
- Albshaier, L.; Almarri, S.; Rahman, M.M.H. A Review of Blockchain’s Role in E-Commerce Transactions: Open Challenges, and Future Research Directions. Computers 2024, 13, 27. [Google Scholar] [CrossRef]
- Faraji, A.; Arya, S.H.; Ghasemi, E.; Rahnamayiezekavat, P.; Perera, S. Building Information Modeling (BIM), Blockchain, and LiDAR Applications in Construction Lifecycle: Bibliometric, and Network Analysis. Buildings 2024, 14, 919. [Google Scholar] [CrossRef]
- Vionis, P.; Kotsilieris, T. The Potential of Blockchain Technology and Smart Contracts in the Energy Sector: A Review. Appl. Sci. 2024, 14, 253. [Google Scholar] [CrossRef]
- Nazim, N.F.; Razis, N.M.; Hatta, M.F.M. Behavioural intention to adopt blockchain technology among bankers in islamic financial system: Perspectives in Malaysia. Rev. Română Informatică Și Autom. 2021, 31, 11–28. [Google Scholar] [CrossRef]
- Queiroz, M.M.; Wamba, S.F. Blockchain adoption challenges in supply chain: An empirical investigation of the main drivers in India and the USA. Int. J. Inf. Manag. 2019, 46, 70–82. [Google Scholar] [CrossRef]
- Albayati, H.; Kim, S.K.; Rho, J.J. Accepting financial transactions using blockchain technology and cryptocurrency: A customer perspective approach. Technol. Soc. 2020, 62, 101320. [Google Scholar] [CrossRef]
- Palos-Sanchez, P.; Saura, J.R.; Ayestaran, R. An Exploratory Approach to the Adoption Process of Bitcoin by Business Executives. Mathematics 2021, 9, 355. [Google Scholar] [CrossRef]
- Ferri, L.; Spanò, R.; Ginesti, G.; Theodosopoulos, G. Ascertaining auditors’ intentions to use blockchain technology: Evidence from the Big 4 accountancy firms in Italy. Meditari Account. Res. 2020, 29, 1063–1087. [Google Scholar] [CrossRef]
- Shrestha, A.K.; Vassileva, J.; Joshi, S.; Just, J. Augmenting the technology acceptance model with trust model for the initial adoption of a blockchain-based system. PeerJ Comput. Sci. 2021, 7, e502. [Google Scholar] [CrossRef]
- Kabir, M.R. Behavioural intention to adopt blockchain for a transparent and effective taxing system. J. Global Oper. Strateg. Sourc. 2020, 14, 170–201. [Google Scholar] [CrossRef]
- Queiroz, M.M.; Wamba, S.F.; de Bourmont, M.; Telles, R. Blockchain adoption in operations and supply chain man-agement: Empirical evidence from an emerging economy. Int. J. Prod. Res. 2021, 59, 6087–6103. [Google Scholar] [CrossRef]
- Jain, G.; Singh, H.; Chaturvedi, K.R.; Rakesh, S. Blockchain in logistics industry: In fizz customer trust or not. J. Enterp. Inf. Manag. 2020, 33, 541–558. [Google Scholar] [CrossRef]
- Nuryyev, G.; Wang, Y.-P.; Achyldurdyyeva, J.; Jaw, B.-S.; Yeh, Y.-S.; Lin, H.-T.; Wu, L.-F. Blockchain Technology Adoption Behavior and Sustainability of the Business in Tourism and Hospitality SMEs: An Empirical Study. Sustainability 2020, 12, 1256. [Google Scholar] [CrossRef]
- Ullah, N.; Al-Rahmi, W.M.; Alzahrani, A.I.; Alfarraj, O.; Alblehai, F.M. Blockchain Technology Adoption in Smart Learning Environments. Sustainability 2021, 13, 1801. [Google Scholar] [CrossRef]
- Alazab, M.; Alhyari, S.; Awajan, A.; Abdallah, A.B. Blockchain technology in supply chain management: An empirical study of the factors affecting user adoption/acceptance. Clust. Comput. 2021, 24, 83–101. [Google Scholar] [CrossRef]
- Tran, L.T.T.; Nguyen, P.T. Co-creating blockchain adoption: Theory, practice and impact on usage behavior. Asia Pacific J. Mark. Logist. 2021, 33, 1667–1684. [Google Scholar] [CrossRef]
- Lin, X.; Chang, S.-C.; Chou, T.-H.; Chen, S.-C.; Ruangkanjanases, A. Consumers’ Intention to Adopt Blockchain Food Traceability Technology towards Organic Food Products. Int. J. Environ. Res. Public Health 2021, 18, 912. [Google Scholar] [CrossRef]
- Muhamad, W.N.W.; Afiza, N.; Wook, M.; Khalil, K.; Mohd, N.; Asiakin, N.; Ramli, S. Evaluation of Blockchain-based Data Sharing Acceptance among Intelligence Community. Int. J. Adv. Comput. Sci. Appl. 2020, 11, 597–606. [Google Scholar] [CrossRef]
- Khazaei, H. Integrating Cognitive Antecedents to UTAUT Model to Explain Adoption of Blockchain Technology Among Malaysian SMEs. JOIV Int. J. Inform. Vis. 2020, 4, 85–90. [Google Scholar] [CrossRef]
- Ullah, N.; Alnumay, W.S.; Al-rahmi, W.M.; Alzahrani, A.I.; Al-Samarraie, H. Modeling Cost Saving and Innovativeness for Blockchain Technology Adoption by Energy Management. Energies 2020, 13, 4783. [Google Scholar] [CrossRef]
- Chillakuri, B.; Attili, V.S.P. Role of blockchain in HR’s response to new-normal. Int. J. Org. Anal. 2022, 30, 1359–1378. [Google Scholar] [CrossRef]
- Razali, N.A.M.; Muhamad, W.N.W.; Ishak, K.K.; Saad, N.J.A.M.; Wook, M.; Ramli, S. Secure Blockchain-Based Data-Sharing Model and Adoption among Intelligence Communities. IAENG Int. J. Comput. Sci. 2021, 48, IJCS_48_1_03, [Online]. Available online: https://www.researchgate.net/profile/Wan-Nurhidayat-Wan-Muhamad/publication/350089738_Secure_Blockchain-Based_Data-Sharing_Model_and_Adoption_among_Intelligence_Communities/links/605067a992851cd8ce445470/Secure-Blockchain-Based-Data-Sharing-Model-and-Adoption-among-Intelligence-Communities.pdf (accessed on 23 February 2025).
- Badi, S.; Ochieng, E.; Nasaj, M.; Papadaki, M. Technological, organisational and environmental determinants of smart contracts adoption: UK construction sector viewpoint. Constr. Manag. Econ. 2021, 39, 36–54. [Google Scholar] [CrossRef]
- Wong, L.-W.; Tan, G.W.-H.; Lee, V.-H.; Ooi, K.-B.; Sohal, A. Unearthing the determinants of Blockchain adoption in supply chain management. Int. J. Prod. Res. 2020, 58, 2100–2123. [Google Scholar] [CrossRef]
- Clohessy, T.; Acton, T. Investigating the influence of organizational factors on blockchain adoption. Ind. Manag. Data Syst. 2019, 119, 1457–1491. [Google Scholar] [CrossRef]
- Kamble, S.S.; Gunasekaran, A.; Kumar, V.; Belhadi, A.; Foropon, C. A machine learning based approach for predicting blockchain adoption in supply Chain. Technol. Forecast. Soc. Change 2021, 163, 120465. [Google Scholar] [CrossRef]
- Chittipaka, V.; Kumar, S.; Sivarajah, U.; Bowden, J.L.-H.; Baral, M.M. Blockchain Technology for Supply Chains operating in emerging markets: An empirical examination of technology-organization-environment (TOE) framework. Ann. Oper. Res. 2022, 53, 102118. [Google Scholar] [CrossRef]
- Orji, I.J.; Kusi-Sarpong, S.; Huang, S.; Vazquez-Brust, D. Evaluating the factors that influence blockchain adoption in the freight logistics industry. Transp. Res. Part E Logist. Transp. Rev. 2020, 141, 102025. [Google Scholar] [CrossRef]
- Gökalp, E.; Gökalp, M.O.; Çoban, S. Blockchain-Based Supply Chain Management: Understanding the Determinants of Adoption in the Context of Organizations. Inf. Syst. Manag. 2022, 39, 100–121. [Google Scholar] [CrossRef]
- Fernando, Y.; Rozuar, N.H.M.; Mergeresa, F. The blockchain-enabled technology and carbon performance: Insights from early adopters. Technol. Soc. 2021, 64, 101507. [Google Scholar] [CrossRef]
- Guan, W.; Ding, W.; Zhang, B.; Verny, J. The role of supply chain alignment in coping with resource dependency in blockchain adoption: Empirical evidence from China. J. Enterp. Inform. Manag. 2023, 14, 396. [Google Scholar] [CrossRef]
- Choi, D.; Chung, C.Y.; Seyha, T.; Young, J. Factors Affecting Organizations’ Resistance to the Adoption of Blockchain Technology in Supply Networks. Sustainability 2020, 12, 8882. [Google Scholar] [CrossRef]
- AL-Ashmori, A.; Dominic, P.D.D.; Singh, N.S.S. Items and Constructs of Blockchain Adoption in Software Development Industry: Experts Perspective. Sustainability 2022, 14, 10406. [Google Scholar] [CrossRef]
- Kulkarni, M.; Patil, K. Block Chain technology adoption using TOE framework. Int. J. Sci. Technol. Res. 2020, 9, 1109. [Google Scholar]
- Callinan, C.; Vega, A.; Clohessy, T.; Heaslip, G. Blockchain Adoption Factors, Enablers and Barriers in Fisheries Supply Chain: Preliminary Findings from a Systematic Literature Review. J. Br. Blockchain Assoc. 2022, 5, 32–37. [Google Scholar] [CrossRef]
- Lin, H.-F. Understanding the determinants of electronic supply chain management system adoption: Using the technology–organization–environment framework. Technol. Forecast. Soc. Change 2014, 86, 80–92. [Google Scholar] [CrossRef]
- Tornatzky, L.G.; Fleischer, M. The Processes of Technological Innovation; Lexington Books: Lanham, MD, USA, 1990. [Google Scholar]
- Baker, J. The Technology–Organization–Environment Framework. In Integrated Series in Information Systems, Information Systems Theory; Dwivedi, Y.K., Wade, M.R., Schneberger, S.L., Eds.; Springer: New York, NY, USA, 2012; pp. 231–245. [Google Scholar]
- Rogers, E.M. Diffusion of Innovations; The Free Press: London, UK, 1995; [Online]; Available online: http://www.lamolina.edu.pe/postgrado/pmdas/cursos/innovacion/lecturas/Obligatoria/17%20-%20Rogers%201995%20cap%206.pdf (accessed on 10 May 2024).
- Tornatzky, L.G.; Klein, K.J. Innovation characteristics and innovation adoption-implementation: A meta-analysis of findings. IEEE Trans. Eng. Manag. 1982, EM-29, 28–45. [Google Scholar] [CrossRef]
- Lou, A.; Li, E. Integrating Innovation Diffusion Theory and the Technology Acceptance Model: The Adoption of Blockchain Technology from Business Managers’ Perspective. In Proceedings of the 17th International Conference on Electronic Business ICEB, Dubai, United Arab Emirates, 4–8 December 2017; [Online]. Available online: https://aisel.aisnet.org/iceb2017/44 (accessed on 18 May 2024).
- Venkatesh, V.; Morris, M.G.; Davis, G.B.; Davis, F.D. User Acceptance of Information Technology: Toward a Unified View. MIS Q. 2003, 27, 425. [Google Scholar] [CrossRef]
- Maruping, L.M.; Bala, H.; Venkatesh, V.; Brown, S.A. Going beyond intention: Integrating behavioral expectation into the unified theory of acceptance and use of technology. J. Assoc. Inf. Sci. Technol. 2017, 68, 623–637. [Google Scholar] [CrossRef]
- Venkatesh, V.; Brown, S.A.; Maruping, L.M.; Bala, H. Predicting Different Conceptualizations of System Use: The Competing Roles of Behavioral Intention, Facilitating Conditions, and Behavioral Expectation. MIS Q. 2008, 32, 483. [Google Scholar] [CrossRef]
- Hua, Y.; Jiang, H.; Zhu, Y.; Feng, D.; Tian, L. SmartStore: A new metadata organization paradigm with semantic-awareness for next-generation file systems. In Proceedings of the 7th USENIX Conference on File and Storage Technologies (FAST-09) Work-in-Progress Report, Portland, Oregon, USA, 14–20 November 2009; pp. 1–12. [Google Scholar]
- Huckle, S.; Bhattacharya, R.; White, M.; Beloff, N. Internet of Things, Blockchain and Shared Economy Applications. Procedia Comput. Sci. 2016, 98, 461–466. [Google Scholar] [CrossRef]
- Ouaddah, A.; Elkalam, A.A.; Ouahman, A.A. Towards a novel privacy-preserving access control model based on blockchain technology in IoT. In Europe and MENA Cooperation Advances in Information and Communication Technologies. Advances in Intelligent Systems and Computing; Springer: Cham, Switzerland, 2017; p. 523, [Online]; Available online: https://link.springer.com/chapter/10.1007/978-3-319-46568-5_53 (accessed on 6 November 2024). [CrossRef]
- Ali, R.F.; Dominic, P.D.D.; Ali, S.E.A.; Rehman, M.; Sohail, A. Information Security Behavior and Information Security Policy Compliance: A Systematic Literature Review for Identifying the Transformation Process from Noncompliance to Compliance. Appl. Sci. 2021, 11, 3383. [Google Scholar] [CrossRef]
- Belkhamza, Z.; Wafa, S.A. The effect of perceived risk on the intention to use e-commerce: The case of Algeria. J. Internet Bank. Commer. 1970, 14, 1, [Online]. Available online: https://www.researchgate.net/profile/Zakariya-Belkhamza/publication/242199053_The_Effect_of_Perceived_Risk_on_the_Intention_to_Use_E-commerce_The_Case_of_Algeria/links/5403e94a0cf2bba34c1c2aa0/The-Effect-of-Perceived-Risk-on-the-Intention-to-Use-E-commerce-The-Case-of-Algeria.pdf (accessed on 8 November 2024).
- Hughes, L.; Dwivedi, Y.K.; Misra, S.K.; Rana, N.P.; Raghavan, V.; Akella, V. Blockchain research, practice and policy: Applications, benefits, limitations, emerging research themes and research agenda. Int. J. Inf. Man-Agement 2019, 49, 114–129. [Google Scholar] [CrossRef]
- Bhattacharya, M.; Wamba, S.F. A Conceptual Framework of RFID Adoption in Retail Using TOE Framework. In Technology Adoption and Social Issues, Technology Adoption and Social Issues: Concepts, Methodologies, Tools, and Applications; Ali, O., Soar, J., Eds.; IGI Global: New York, NY, USA, 2018; pp. 69–102, [Online]; Available online: https://www.igi-global.com/chapter/a-conceptual-framework-of-rfid-adoption-in-retail-using-toe-framework/196673 (accessed on 10 November 2024).
- Govindan, K.; Hasanagic, M. A systematic review on drivers, barriers, and practices towards circular economy: A supply chain perspective. Int. J. Prod. Res. 2018, 56, 278–311. [Google Scholar] [CrossRef]
- Schatsky, D.; Arora, A.; Dongre, A. Blockchain and The Five Vectors of Progress. 2018. [Online]. Available online: https://www.ottimositoweb.it/wp-content/uploads/2021/08/DI_Blockchain-five-vectors.-Ottimo-Academy.pdf (accessed on 10 November 2024).
- Miller, M.D.; Rainer, R.K., Jr.; Harper, J. The Unidimensionality, Validity, and Reliability of Moore and Benbasat’s Relative Advantage and Compatibility Scales. J. Comput. Inf. Syst. 1997, 38, 38–46. [Google Scholar] [CrossRef]
- Raghunathan, B.; Raghunathan, T.S. Impact of top management support on IS planning. J. Inf. Syst. 1988, 2, 15, [Online]. Available online: https://search.ebscohost.com/login.aspx?direct=true&profile=ehost&scope=site&authtype=crawler&jrnl=08887985&AN=4786352&h=Y88XkIvUWL%2FsTjxEHcNOs9a%2BIebh%2B1E9%2B9KsfvQ41JANHyXL5njGi96pEXHNP%2FNCLhy2gnlOiMnuYpySNkj2jQ%3D%3D&crl=c (accessed on 11 November 2024).
- Ghaleb, E.A.A.; Dominic, P.D.D.; Fati, S.M.; Muneer, A.; Ali, R.F. The Assessment of Big Data Adoption Readiness with a Technology–Organization–Environment Framework: A Perspective towards Healthcare Employees. Sustainability 2021, 13, 8379. [Google Scholar] [CrossRef]
- Wang, Y.; Han, J.H.; Beynon-Davies, P. Understanding blockchain technology for future supply chains: A systematic literature review and research agenda. Supply Chain Manag. 2019, 24, 62–84. [Google Scholar] [CrossRef]
- Peters, G.W.; Panayi, E.; Chapelle, A. Trends in cryptocurrencies and blockchain technologies: A monetary theory and regulation perspective. J. Financ. Perspect. 2015, 3, 30, [Online]. Available online: https://arxiv.org/abs/1508.04364 (accessed on 11 November 2024).
- Nisar, U.; Zhang, Z.; Wood, B.P.; Ahmad, S.; Ellahi, E.; Ul Haq, S.I.; Alnafissa, M.; Fathi Abd-Allah, E. Unlocking the potential of blockchain technology in enhancing the fisheries supply chain: An exploration of critical adoption barriers in China. Sci. Rep. 2024, 14, 1–19. [Google Scholar] [CrossRef]
- Dong, X.; Hao, X.; Cai, C.; Li, X.; Wang, K.; Zhang, J. The impact of blockchain adoption in supply chain systems on corporate performance: A technology–organization–environment framework. Prod. Plan. Control, 2024; advance online publication. [Google Scholar] [CrossRef]
- Liu, J.; Jiang, P.; Zhang, J. A blockchain-enabled and event-driven tracking framework for SMEs to improve cooperation transparency in manufacturing supply chain. Comput. Ind. Eng. 2024, 191, 110150. [Google Scholar] [CrossRef]
- Gangwar, H.; Date, H.; Ramaswamy, R. Understanding determinants of cloud computing adoption using an integrated TAM-TOE model. J. Enterp. Inf. Manag. 2015, 28, 107–130. [Google Scholar] [CrossRef]
- Alalwan, A.A.; Dwivedi, Y.K.; Rana, N.P. Factors influencing adoption of mobile banking by Jordanian bank customers: Extending UTAUT2 with trust. Int. J. Inf. Manag. 2017, 37, 99–110. [Google Scholar] [CrossRef]
- Dwivedi, Y.K.; Rana, N.P.; Jeyaraj, A.; Clement, M.; Williams, M.D. Re-examining the Unified Theory of Acceptance and Use of Technology (UTAUT): Towards a Revised Theoretical Model. Inf. Syst. Front. 2019, 21, 719–734. [Google Scholar] [CrossRef]
- Zumofen, G.; Stadelmann-Steffen, I.; Sträter, R. The influence of information format and framing on acceptance of energy storage technologies. Renewable and Sustainable Energy Reviews 2025, 210, 115209. [Google Scholar] [CrossRef]
- Deng, N.; Shi, Y.; Wang, J.; Gaur, J. Testing the adoption of Blockchain Technology in Supply Chain Management among MSMEs in China. Ann. Oper. Res. 2022; advance online publication. [Google Scholar] [CrossRef]
- Berenjestanaki, M.H.; Barzegar, H.R.; El Ioini, N.; Pahl, C. Blockchain-Based E-Voting Systems: A Technology Review. Electronics 2024, 13, 17. [Google Scholar] [CrossRef]
- Wang, T.; Chen, K.; Zheng, Z.; Guo, J.; Zhao, X.; Zhang, S. PrivShieldROS: An Extended Robot Operating System Integrating Ethereum and Interplanetary File System for Enhanced Sensor Data Privacy. Sensors 2024, 24, 3241. [Google Scholar] [CrossRef]
- Leng, J.; Ruan, G.; Jiang, P.; Xu, K.; Liu, Q.; Zhou, X.; Liu, C. Blockchain-empowered sustainable manufacturing and product lifecycle management in industry 4.0: A survey. Renew. Sustain. Energy Rev. 2020, 132, 110112. [Google Scholar] [CrossRef]
- Taofeeq, D.M.; Rotimi, J.O.B.; Wajiha, S. Sustainability principles in infrastructure project delivery: Establishing the broader implementation strategies for decision-making. Constr. Innov. 2023; ahead-of-printing. [Google Scholar] [CrossRef]
- Beisafar, M.H. Supply Chain Built on Blockchain Technology. Ph.D. Thesis, University of Louisiana, Lafayette, LA, USA, 2024. [Online]. Available online: https://www.proquest.com/dissertations-theses/supply-chain-built-on-blockchain-technology/docview/3072947411/se-2?accountid=50955 (accessed on 10 November 2024).
- Salam, F.M.A. Blockchain Revolutionizing Healthcare Industry: A Systematic Review of Blockchain Technology Benefits and Threats. Perspect. Health Inf. Manag. 2023, 20, 1–19, [Online]. Available online: https://www.proquest.com/scholarly-journals/blockchain-revolutionizing-healthcare-industry/docview/2934179222/se-2?accountid=50955 (accessed on 10 November 2024).
- Kaka, S. Relationships Between Determinants and Intent to Adopt Blockchain in the Nigerian Public Sector. D.I.T, Walden University, Washington, MN, USA. 2023. [Online]. Available online: https://www.proquest.com/dissertations-theses/relationships-between-determinants-intent-adopt/docview/2907074694/se-2?accountid=50955 (accessed on 10 November 2024).
- Kouhizadeh, M.; Saberi, S.; Sarkis, J. Blockchain technology and the sustainable supply chain: Theoretically exploring adoption barriers. Int. J. Prod. Econ. 2021, 231, 107831. [Google Scholar] [CrossRef]
- Rogers, E.M. Diffusion of Innovations, 4th ed.; Simon and Schuster: New York, NY, USA, 2010; ISBN 9781451602470. [Google Scholar]
- Sonnenwald, D.H.; Maglaughlin, K.L.; Whitton, M.C. Using innovation diffusion theory to guide collaboration technology evaluation: Work in progress. In Proceedings of the 10th IEEE International Workshop on Enabling Technologies: Infrastructure for Collaborative Enterprises. WET ICE 2001, Cambridge, MA, USA, 20–22 June 2001; Staff, I.C.S., Ed.; IEEE Computer Society Press: Los Alamitos, CA, USA, 2001; pp. 114–119, ISBN 0-7695-1269-0. [Google Scholar]
- Zhang, G.; Chen, S.C.-I.; Yue, X. Blockchain Technology in Carbon Trading Markets: Impacts, Benefits, and Challenges—A Case Study of the Shanghai Environment and Energy Exchange. Energies 2024, 17, 3296. [Google Scholar] [CrossRef]
- Riedel, T. Addressing Challenges: Adopting Blockchain Technology in the Pharmaceutical Industry for Enhanced Sustaina-bility. Sustainability 2024, 16, 3102. [Google Scholar] [CrossRef]
- Maniam, P.S.G.; Acharya, N.; Sassenberg, A.-M.; Soar, J. Determinants of Blockchain Technology Adoption in the Australian Agricultural Supply Chain: A Systematic Literature Review. Sustainability 2024, 16, 5806. [Google Scholar] [CrossRef]
- Zhang, Z.; Feng, H.; Wang, L.; Yang, L. How to achieve high-quality development of SRDI enterprises—A study of the TOE framework-based configuration. PLoS ONE 2024, 19, e0304688. [Google Scholar] [CrossRef]
- Kafeel, H.; Kumar, V.; Duong, L. Blockchain in Supply Chain Management: A Synthesis of Barriers and Enablers for Managers. Int. J. Math. Eng. Manag. Sci. 2023, 8, 15–42. [Google Scholar] [CrossRef]
- Nazir, H.; Fan, J. Revolutionizing Retail: Examining the Influence of Blockchain-Enabled IoT Capabilities on Sustainable Firm Performance. Sustainability 2024, 16, 3534. [Google Scholar] [CrossRef]
- Warshaw, P.R.; Davis, F.D. Disentangling behavioral intention and behavioral expectation. J. Exp. Soc. Psychol. 1985, 21, 213–228. [Google Scholar] [CrossRef]
- Ajzen, I. The theory of planned behavior. Organ. Behav. Hum. Decis. Process. 1991, 50, 179–211. [Google Scholar] [CrossRef]
- Weerakkody, V.; El-Haddadeh, R.; Al-Sobhi, F.; Shareef, M.A.; Dwivedi, Y.K. Examining the influence of intermediaries in facilitating e-government adoption: An empirical investigation. Int. J. Inf. Manag. 2013, 33, 716–725. [Google Scholar] [CrossRef]
- Venkatesh, V.; Thong, J.Y.L.; Xu, X. Consumer Acceptance and Use of Information Technology: Extending the Unified Theory of Acceptance and Use of Technology. MIS Q. 2012, 36, 157. [Google Scholar] [CrossRef]
- Khayer, A.; Bao, Y.; Nguyen, B. Understanding cloud computing success and its impact on firm performance: An integrated approach. Ind. Manag. Data Syst. 2020, 120, 963–985. [Google Scholar] [CrossRef]
- Hair, J.F.; Hult, G.T.M.; Ringle, C.M.; Sarstedt, M. A Primer on Partial Least Squares Structural Equation Modeling (PLS-SEM); Sage: Los Angeles, CA, USA, 2017; [Online]; Available online: https://www.amazon.com/-/zh/dp/1544396406/ref=zg-te-pba_d_sccl_1_2/132-3549657-0796655?pd_rd_w=4wrD3&content-id=amzn1.sym.081392b0-c07f-4fc2-8965-84d15d431f0d&pf_rd_p=081392b0-c07f-4fc2-8965-84d15d431f0d&pf_rd_r=KZCBVXWQDZ15V3M7J2CP&pd_rd_wg=3w4kw&pd_rd_r=bac85222-061a-490f-bed7-7204f2f9406b&pd_rd_i=1544396406&psc=1 (accessed on 2 December 2024).
- Chen, X.; Miraz, M.H.; Gazi, M.A.I.; Rahaman, M.A.; Habib, M.M.; Hossain, A.I. Factors affecting cryptocurrency adoption in digital business transactions: The mediating role of customer satisfaction. Technol. Soc. 2022, 70, 102059. [Google Scholar] [CrossRef]
- Deng, N.; Gong, Y.; Wang, J. Promoting blockchain technology in low-carbon management to achieve firm performance from a socio-economic perspective: Empirical evidence from China. J. Clean. Prod. 2024, 448, 141686. [Google Scholar] [CrossRef]
- Wang, L.; Zhu, H.; Li, X.; Zhao, Y. Formation mechanism of user stickiness in live e-commerce: The hybrid PLS-SEM and ANN approach. Ind. Manag. Data Syst. 2024, 124, 1234–1262. [Google Scholar] [CrossRef]
- Podsakoff, P.M.; MacKenzie, S.B.; Lee, J.-Y.; Podsakoff, N.P. Common method biases in behavioral research: A critical review of the literature and recommended remedies. J. Appl. Psychol. 2003, 88, 879–903. [Google Scholar] [CrossRef] [PubMed]
- Liang, H.; Saraf, N.; Hu, Q.; Xue, Y. Assimilation of Enterprise Systems: The Effect of Institutional Pressures and the Mediating Role of Top Management. MIS Q. 2007, 31, 59. [Google Scholar] [CrossRef]
- Fuller, C.M.; Simmering, M.J.; Atinc, G.; Atinc, Y.; Babin, B.J. Common methods variance detection in business research. J. Bus. Res. 2016, 69, 3192–3198. [Google Scholar] [CrossRef]
- Podsakoff, P.M.; MacKenzie, S.B.; Podsakoff, N.P. Sources of Method Bias in Social Science Research and Recommenda-tions on How to Control It. Annu. Rev. Psychol. 2012, 63, 539–569. [Google Scholar] [CrossRef]
- Teo, A.-C.; Tan, G.W.-H.; Ooi, K.-B.; Hew, T.-S.; Yew, K.-T. The effects of convenience and speed in m-payment. Ind. Manag. Data Syst. 2015, 115, 311–331. [Google Scholar] [CrossRef]
- Henseler, J.; Ringle, C.M.; Sarstedt, M. A new criterion for assessing discriminant validity in variance-based structural equation modeling. J. Acad. Mark. Sci. 2015, 43, 115–135. [Google Scholar] [CrossRef]
- Bentler, P.M.; Huang, W. On Components, Latent Variables, PLS and Simple Methods: Reactions to Rigdon’s Rethinking of PLS. Long Range Plan. 2014, 47, 138–145. [Google Scholar] [CrossRef]
- Eom, S.B.; Wen, H.J.; Ashill, N. The Determinants of Students’ Perceived Learning Outcomes and Satisfaction in University Online Education: An Empirical Investigation*. Decis. Sci. J. Innov. Educ. 2006, 4, 215–235. [Google Scholar] [CrossRef]
- Wassertheil, S.; Cohen, J. Statistical Power Analysis for the Behavioral Sciences. Biometrics 1970, 26, 588. [Google Scholar] [CrossRef]
- Geisser, S. The Predictive Sample Reuse Method with Applications. J. Am. Stat. Assoc. 1975, 70, 320–328. [Google Scholar] [CrossRef]
- Stone, M. Cross-validatory choice and assessment of statistical predictions. J. R. Stat. Soc. 1974, 36, 111. [Google Scholar] [CrossRef]
- Ringle, C.M.; Sarstedt, M. Gain more insight from your PLS-SEM results. Ind. Manag. Data Syst. 2016, 116, 1865–1886. [Google Scholar] [CrossRef]
- Ooi, K.-B.; Hew, J.-J.; Lee, V.-H. Could the mobile and social perspectives of mobile social learning platforms motivate learners to learn continuously? Comput. Educ. 2018, 120, 127–145. [Google Scholar] [CrossRef]
- Fang, C.; Ullah, N.; Batumalay, M.; Al-Rahmi, W.M.; Alblehai, F. Blockchain technology and its impact on sustainable supply chain management in SMEs. PeerJ Comput. Sci. 2025, 11, e2466. [Google Scholar] [CrossRef]
- Jeanine, K.-K.; Morschheuser, B.; Sicevic, N.; Xi, N.; von Korflesch, H.F.O.; Hamari, J. Challenges in the adoption of sus-tainability information systems: A study on green IS in organizations. Int. J. Inf. Manag. 2024, 77, 102754. [Google Scholar] [CrossRef]
- Janssen, M.; Weerakkody, V.; Ismagilova, E.; Sivarajah, U.; Irani, Z. A framework for analysing blockchain technology adoption: Integrating institutional, market and technical factors. Int. J. Inf. Manag. 2020, 50, 302–309. [Google Scholar] [CrossRef]
- Li, C.; Zhang, Y.; Xu, Y. Factors Influencing the Adoption of Blockchain in the Construction Industry: A Hybrid Approach Using PLS-SEM and fsQCA. Buildings 2022, 12, 1349. [Google Scholar] [CrossRef]
- Crompton, H.; Burke, D. Artificial intelligence in higher education: The state of the field. Int. J. Educ. Technol. High. Educ. 2023, 20, 1–22. [Google Scholar] [CrossRef]
- Malek, M.S.; Bhatt, V. Investigating the effect of risk reduction strategies on the construction of mega infrastructure project (MIP) success: A SEM-ANN approach. ECAM Eng. Constr. Archit. Manag. 2024, 31, 3575–3598. Available online: https://www.emerald.com/insight/content/doi/10.1108/ecam-12-2022-1166/full/html (accessed on 1 December 2024). [CrossRef]
- Lee, V.-H.; Foo, A.T.-L.; Leong, L.-Y.; Ooi, K.-B. Can competitive advantage be achieved through knowledge management? A case study on SMEs. Expert Syst. Appl. 2016, 65, 136–151. [Google Scholar] [CrossRef]
- Hassija, V.; Chamola, V.; Mahapatra, A.; Singal, A.; Goel, D.; Huang, K.; Scardapane, S.; Spinelli, I.; Mahmud, M.; Hussain, A. Interpreting Black-Box Models: A Review on Explainable Artificial Intelligence. Cogn. Comput. 2024, 16, 45–74. [Google Scholar] [CrossRef]
- Soliman, M.; Ali, R.A.; Khalid, J.; Mahmud, I.; Ali, W.B. Modelling continuous intention to use generative artificial in-telligence as an educational tool among university students: Findings from PLS-SEM and ANN. J. Comput. Educ, 2024; advance online publication. [Google Scholar] [CrossRef]
- Leong, L.-Y.; Hew, T.-S.; Ooi, K.-B.; Lin, B. Do Electronic Word-of-Mouth and Elaboration Likelihood Model Influence Hotel Booking? J. Comput. Inf. Syst. 2017, 59, 146–160. [Google Scholar] [CrossRef]
- Rogers, E. Diffusion of Innovations, 5th ed.; The Free Press: London, UK, 2003; ISBN 0-7432-5823-1. [Google Scholar]
- Liébana-Cabanillas, F.; Marinkovic, V.; de Luna, I.R.; Kalinic, Z. Predicting the determinants of mobile payment acceptance: A hybrid SEM-neural network approach. Technol. Forecast. Soc. Change 2018, 129, 117–130. [Google Scholar] [CrossRef]
- Maduku, D.K.; Mpinganjira, M.; Duh, H. Understanding mobile marketing adoption intention by South African SMEs: A multi-perspective framework. Int. J. Inf. Manag. 2016, 36, 711–723. [Google Scholar] [CrossRef]
- Jiang, M.; Jia, F.; Chen, L.; Xing, X. Technology adoption in socially sustainable supply chain management: Towards an integrated conceptual framework. Technol. Forecast. Soc. Change 2024, 206, 123537. [Google Scholar] [CrossRef]
- Tiwari, S.; Sharma, P.; Choi, T.-M.; Lim, A. Blockchain and third-party logistics for global supply chain operations: Stakeholders? perspectives and decision roadmap*. Transp. Res. Part E Logist. Transp. Rev. 2023, 170, 103012. [Google Scholar] [CrossRef]
- Wu, J.; Wang, X.; Chen, L.; He, Y. Blockchain adoption to eliminate dispute in platform-supplier cooperative delivery. Comput. Ind. Eng. 2024, 192, 110227. [Google Scholar] [CrossRef]
- Wu, J.; Wang, X.; He, Y. Design of Blockchain and Strategic Financing Service under the Platform Economy. Omega 2025, 131, 103200. [Google Scholar] [CrossRef]
- Grand View Research, Industrial Software Market Size, Share, Growth Report, 2030. [Online]. Available online: https://www.grandviewresearch.com/industry-analysis/industrial-software-market-report (accessed on 28 February 2025).
- Grand View Research, Data Classification Market Size & Outlook, 2030. [Online]. Available online: https://www.grandviewresearch.com/horizon/outlook/data-classification-market-size/global (accessed on 28 February 2025).
- SAP. Insight into Transformation Trends, Creating a Smart Future—New Kind of Chinese Enterprise White Paper. [Online]. Available online: https://www.sap.com/latinamerica/documents/2022/09/66cf8265-407e-0010-bca6-c68f7e60039b.html (accessed on 28 February 2025).
- SAP. SAP Integrated Report 2024. [Online]. Available online: https://www.sap.com/integrated-reports/2024/en.html (accessed on 28 February 2025).
- Deghati, S. Impact of Data Governance on Data Quality in Healthcare Institutions. Am. J. Data Inf. Knowl. Manag. 2024, 5, 39–48. [Google Scholar] [CrossRef]
- World Bank. Home|Worldwide Governance Indicators. [Online]. Available online: https://www.worldbank.org/en/publication/worldwide-governance-indicators (accessed on 28 February 2025).
- Gillpatrick, T.; Boğa, S.; Aldanmaz, O. How can blockchain contribute to developing country economies? A literature review on application areas. Econ.-Innov. Econ. Res. J. 2022, 10, 105–128, [Online]. Available online: https://intapi.sciendo.com/pdf/10.2478/eoik-2022-0009 (accessed on 28 February 2025). [CrossRef]
- Wu, J.; Cheng, H.; Li, L. Blockchain-enabled downward traceability to combat gray market. Int. J. Prod. Econ. 2024, 278, 109415. [Google Scholar] [CrossRef]
- Ølnes, S.; Ubacht, J.; Janssen, M. Blockchain in government: Benefits and implications of distributed ledger technology for information sharing. Gov. Inf. Q. 2017, 34, 355–364. [Google Scholar] [CrossRef]
- ISO. ISO/TC 307—Blockchain and Distributed Ledger Technologies. [Online]. Available online: https://www.iso.org/committee/6266604.html (accessed on 26 February 2025).
- Ritter, M.; Schilling, H.; Brüggemann, H.; Fröhlich, T.; Goldmann, D.; Henze, R.; Kuhlmann, M.; Mennenga, M.; Mrotzek-Blöß, A.; Niemeyer, J.F.; et al. Towards achieving the sustainable development goals: A collaborative action plan leveraging the circular economy potentials. Gr. Interakt. Org. 2024, 55, 175–187. [Google Scholar] [CrossRef]
- Wan, P.K.F.; Jiang, S. Enabling a dynamic information flow in digital product passports during product use phase: A literature review and proposed framework. Sustain. Prod. Consum. 2025, 54, 362–374. [Google Scholar] [CrossRef]
- Guo, X.; Zhang, G.; Zhang, Y. A Comprehensive Review of Blockchain Technology-Enabled Smart Manufacturing: A Framework, Challenges and Future Research Directions. Sensors 2022, 23, 10155. [Google Scholar] [CrossRef]
- Pattanayak, S.; Ramkumar, M.; Goswami, M.; Rana, N.P. Blockchain technology and supply chain performance: The role of trust and relational capabilities. Int. J. Prod. Econ. 2024, 271, 109198. [Google Scholar] [CrossRef]
- Gao, X.; Yuan, Y.; Wang, Y.; Yang, T.; Chen, T. Prediction of Construction Waste Generation in China Based on Grey Model and Management Recommendations. Sustainability 2025, 17, 1711. [Google Scholar] [CrossRef]
- Ungson, G.R.; Soorapanth, S. The ASEAN blockchain roadmap. Asia Global Econ. 2022, 2, 100047. [Google Scholar] [CrossRef]
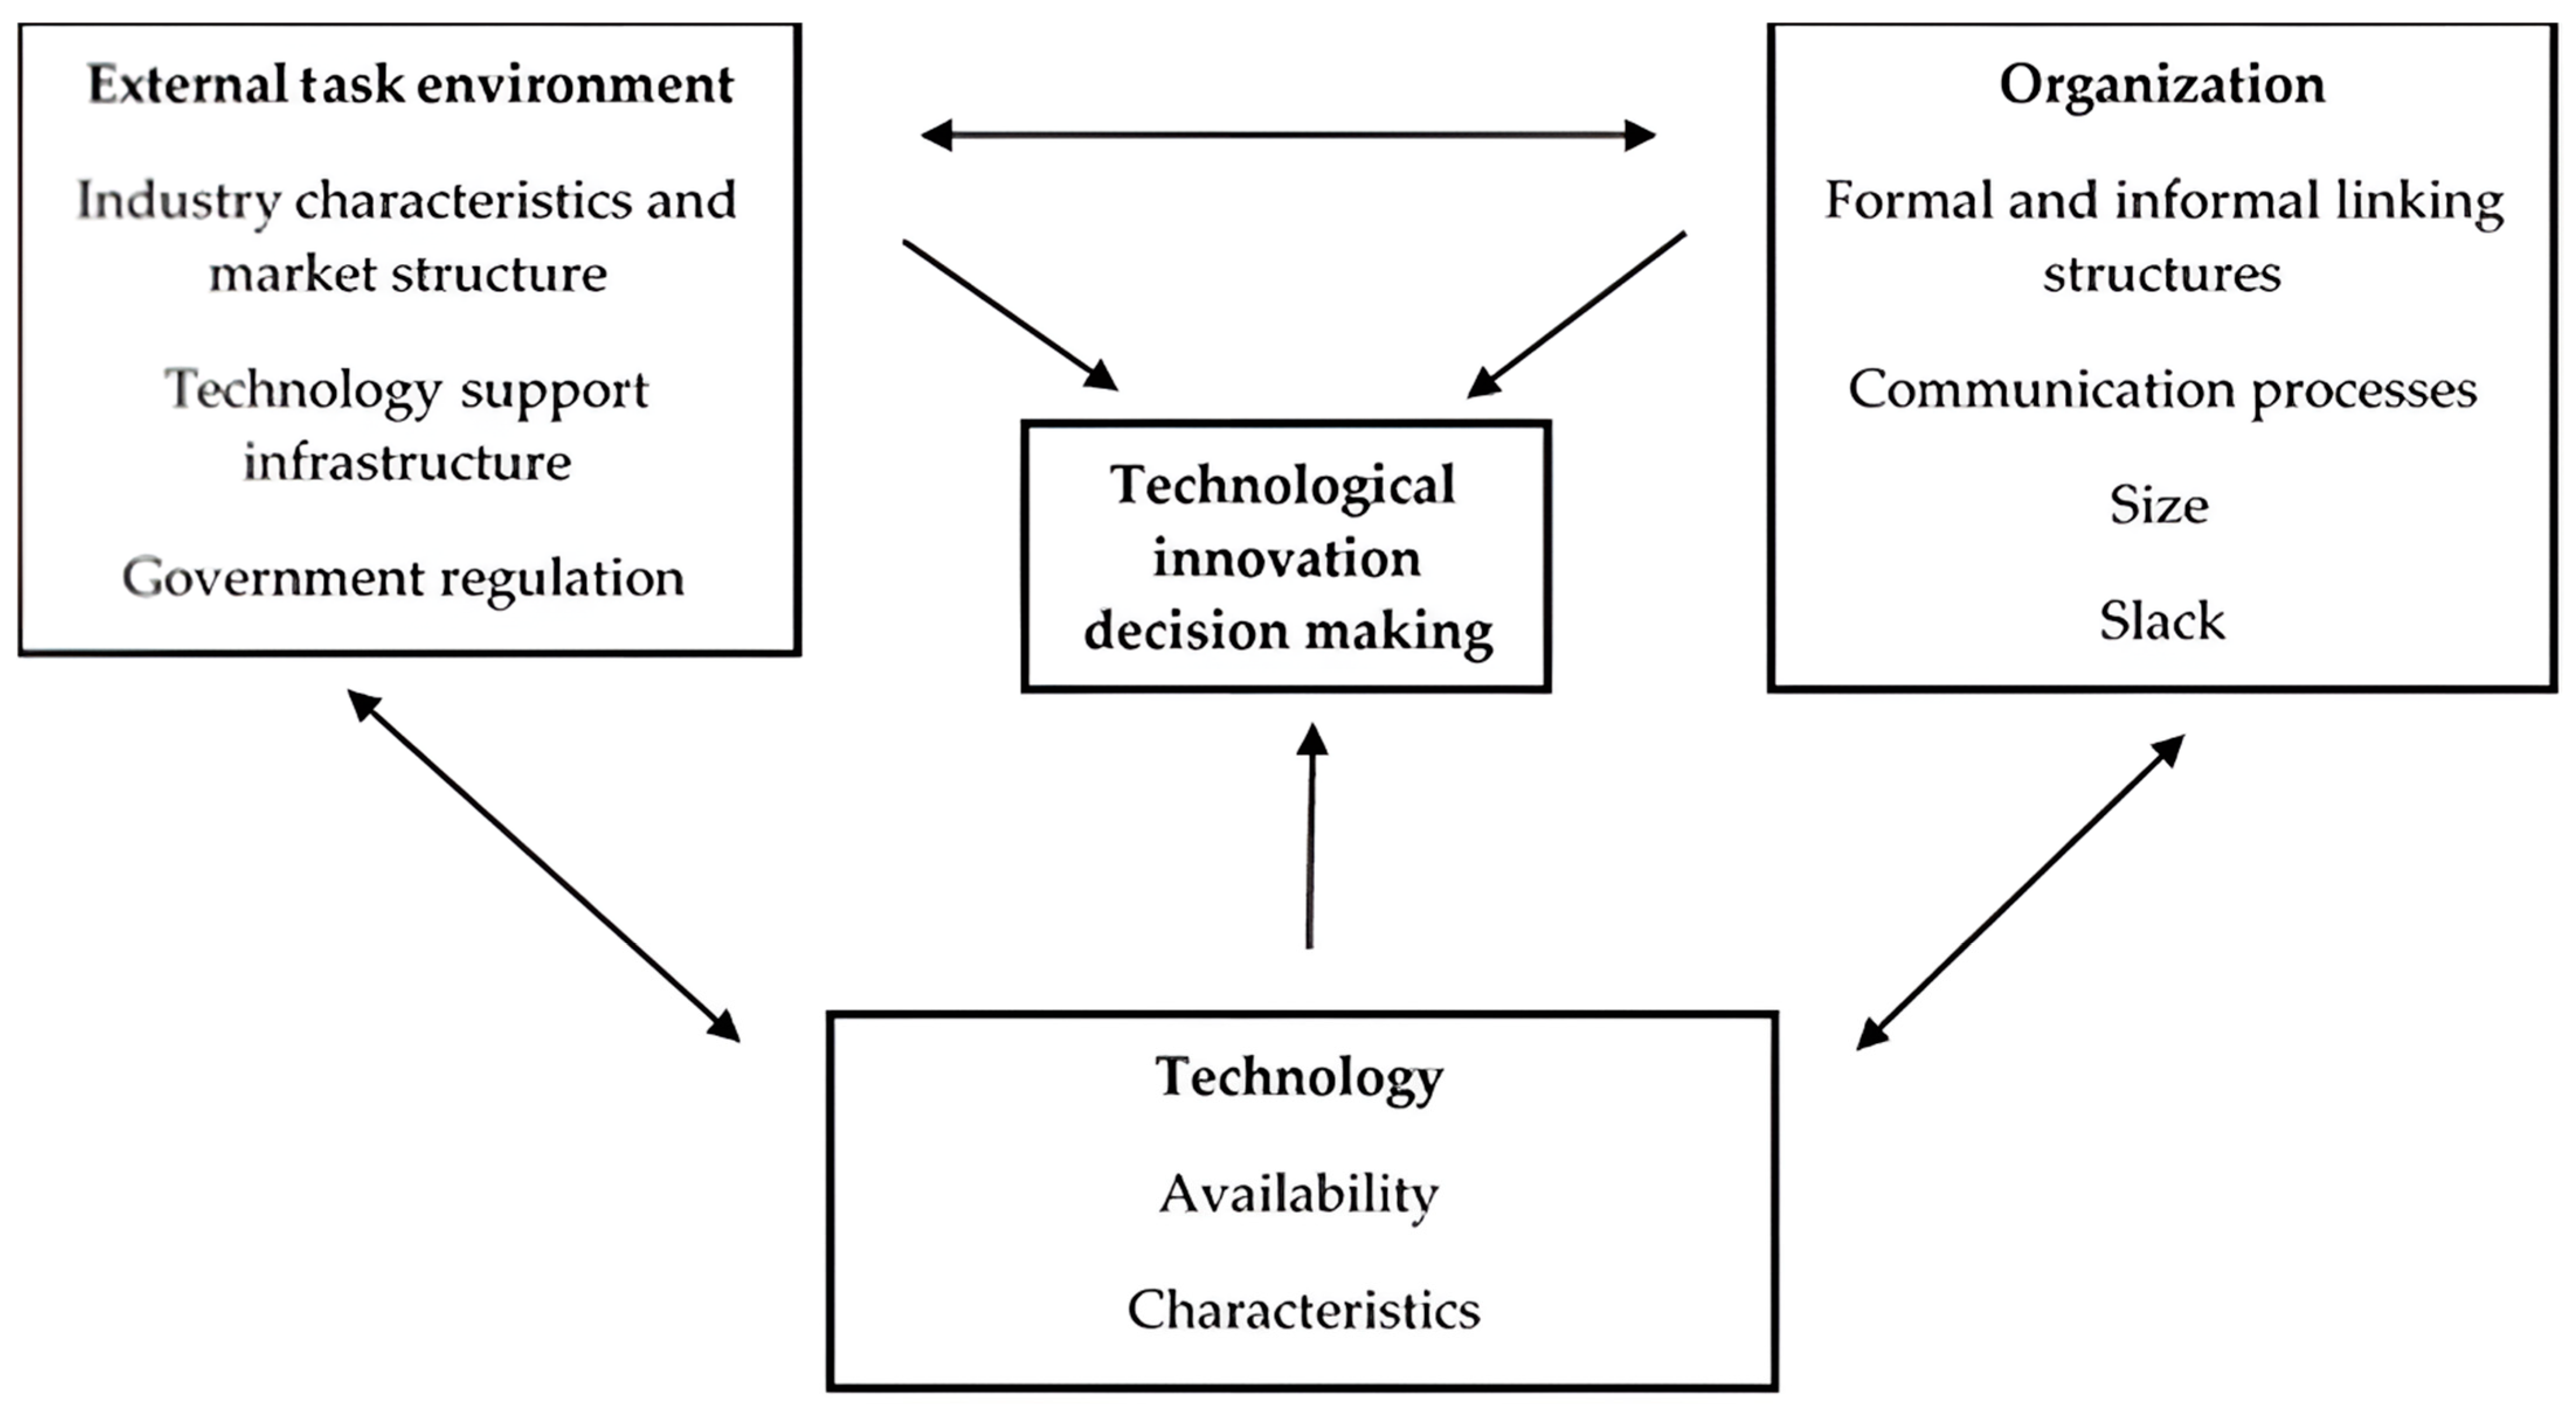
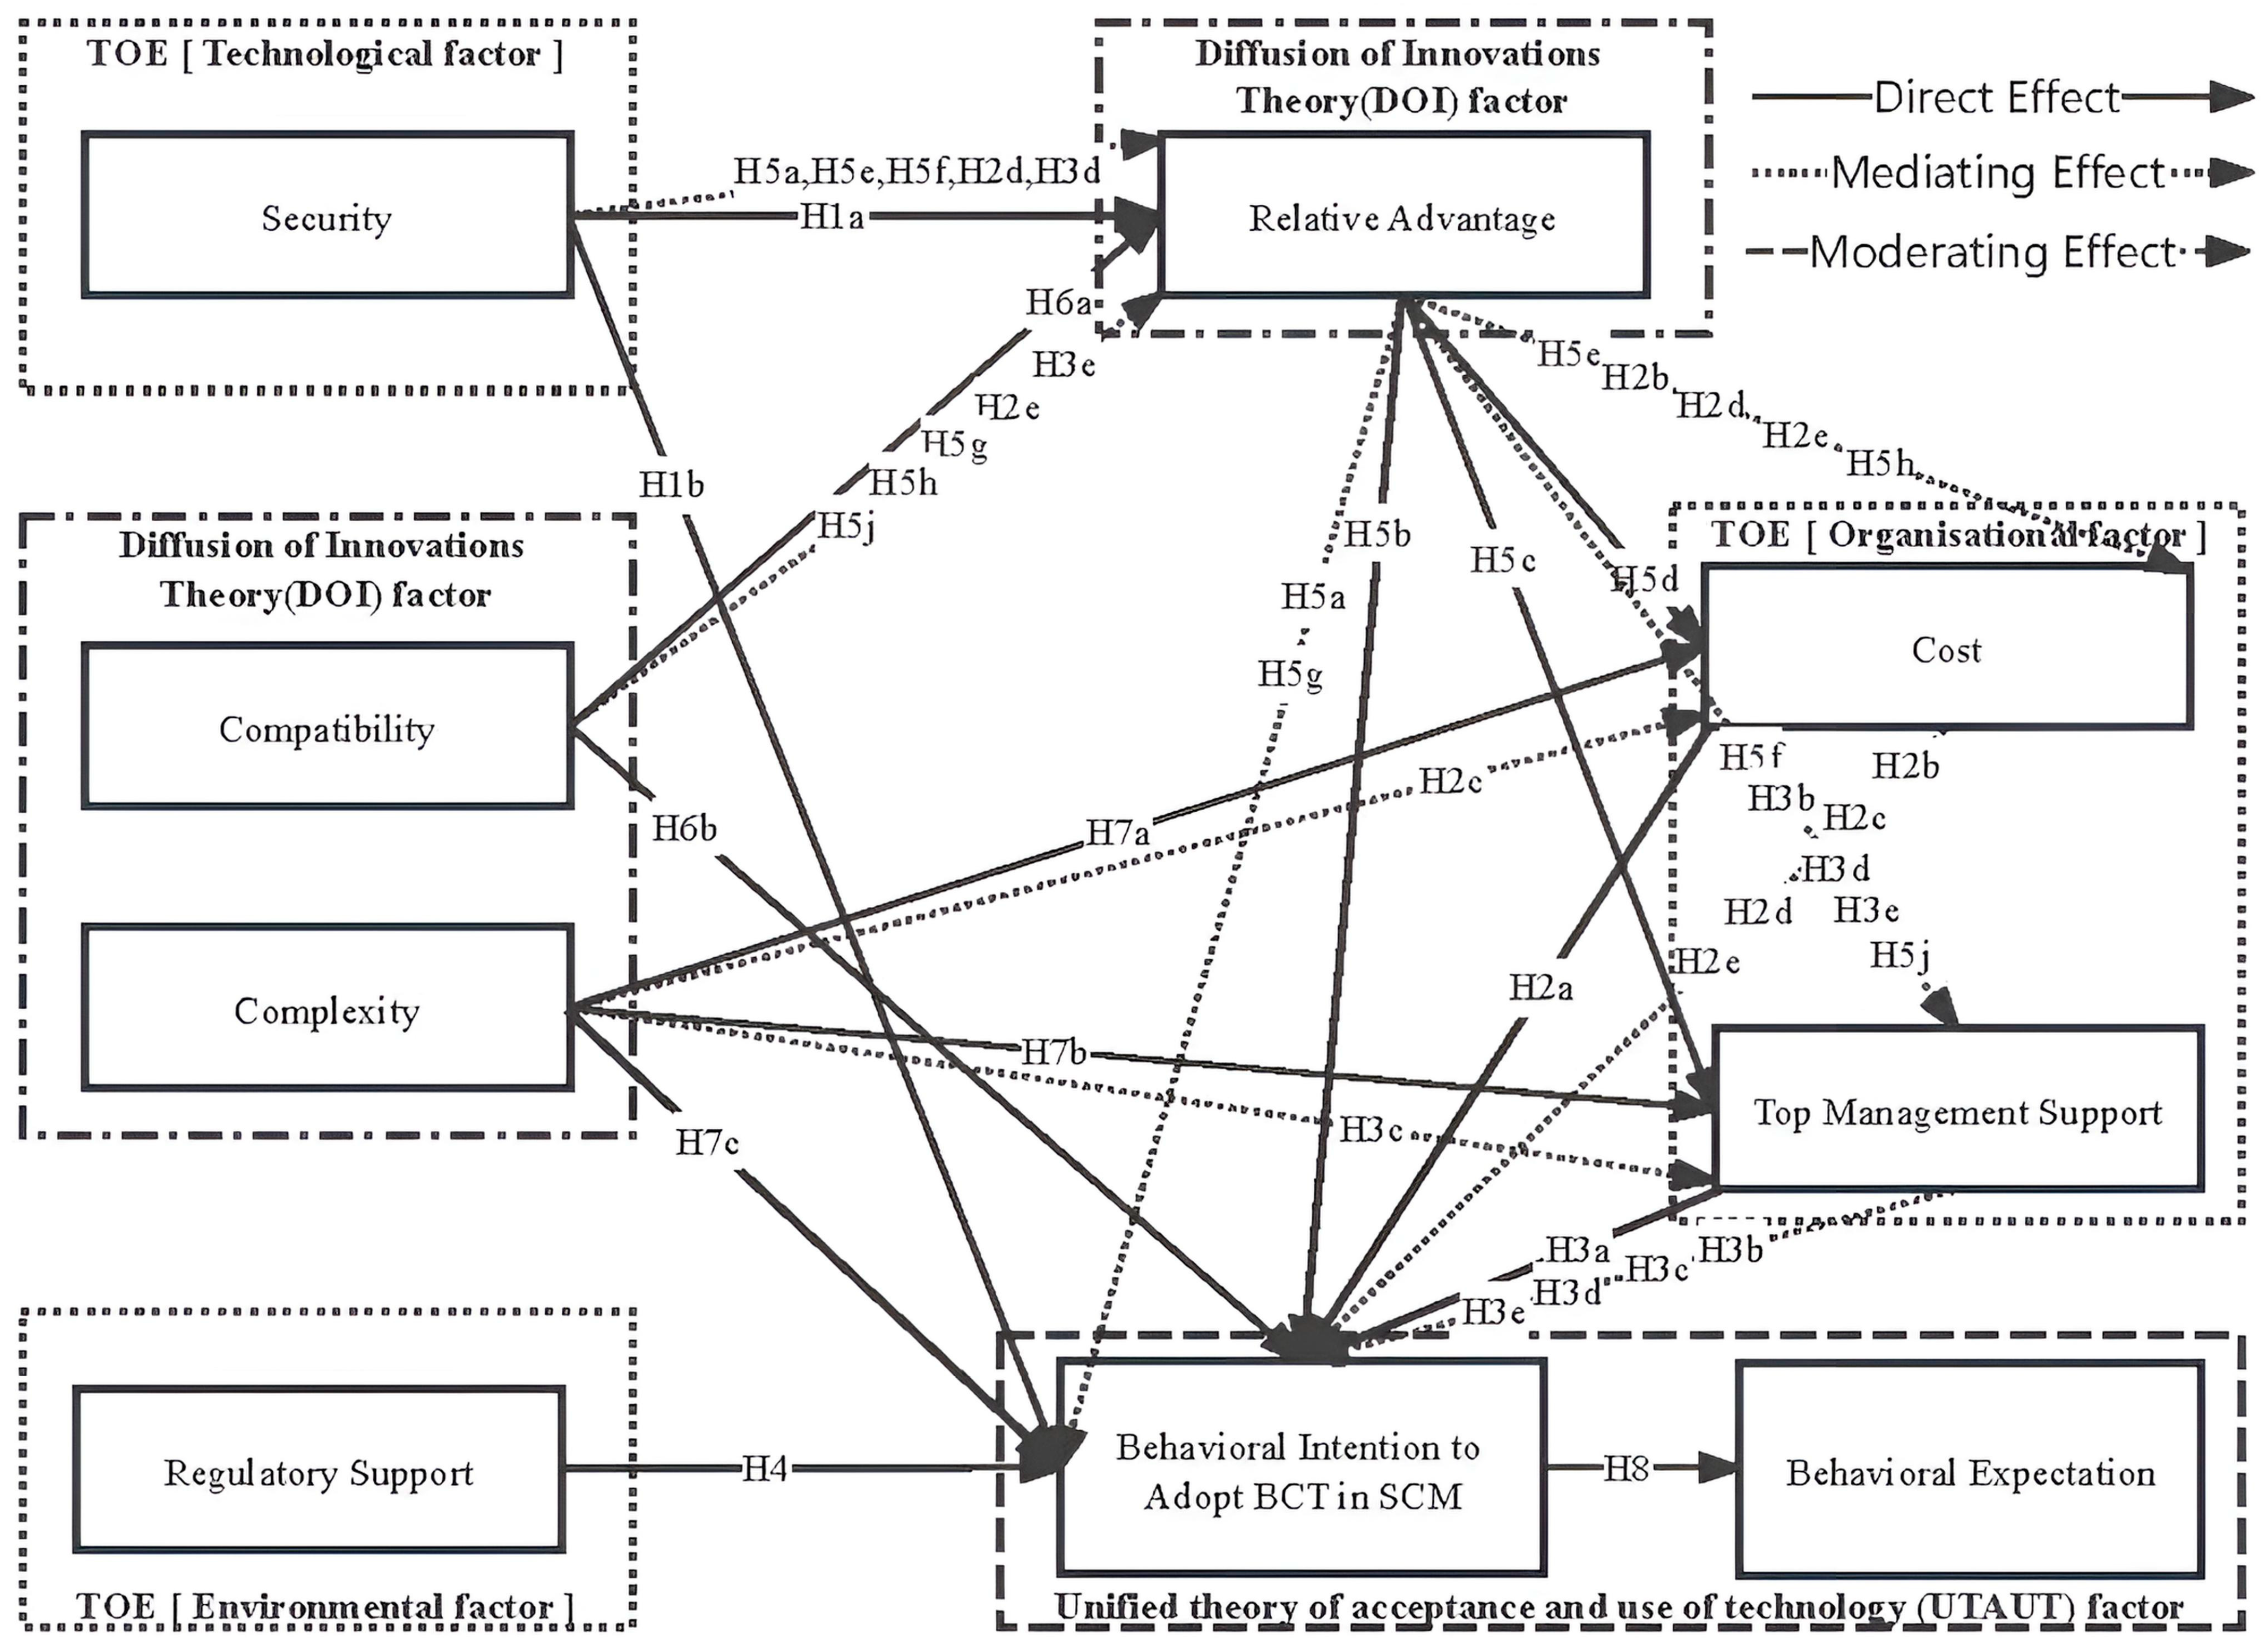
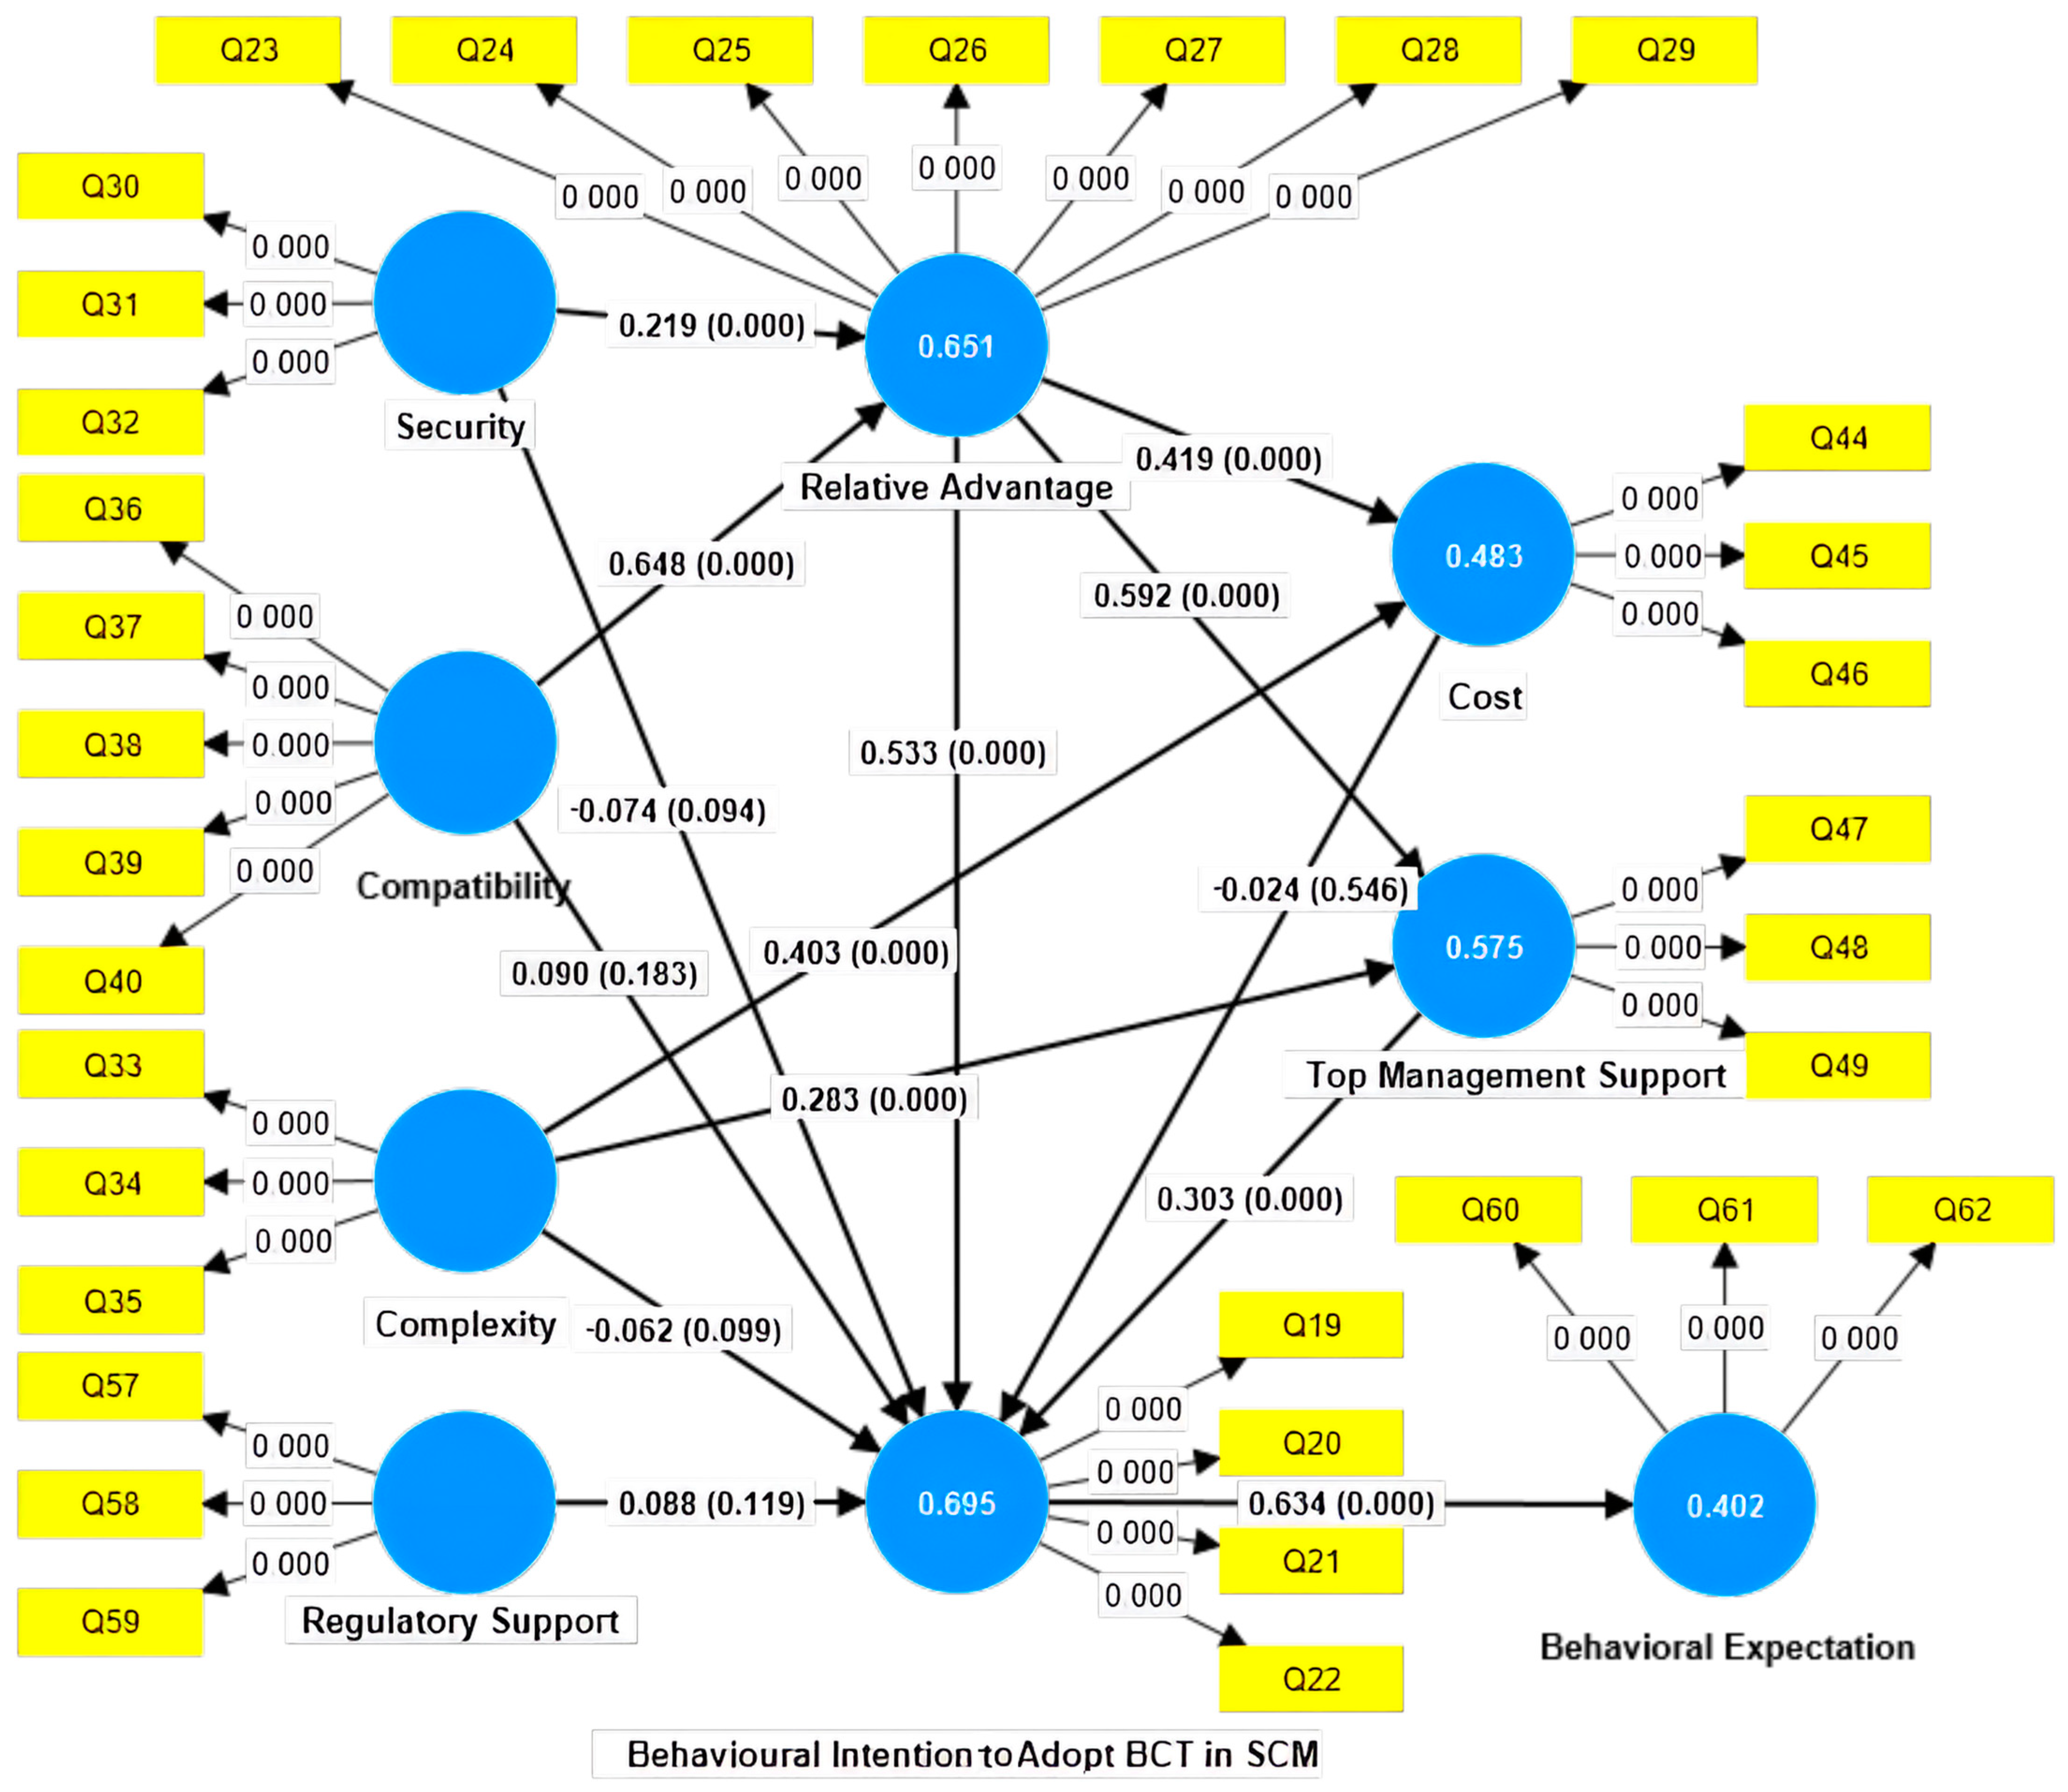
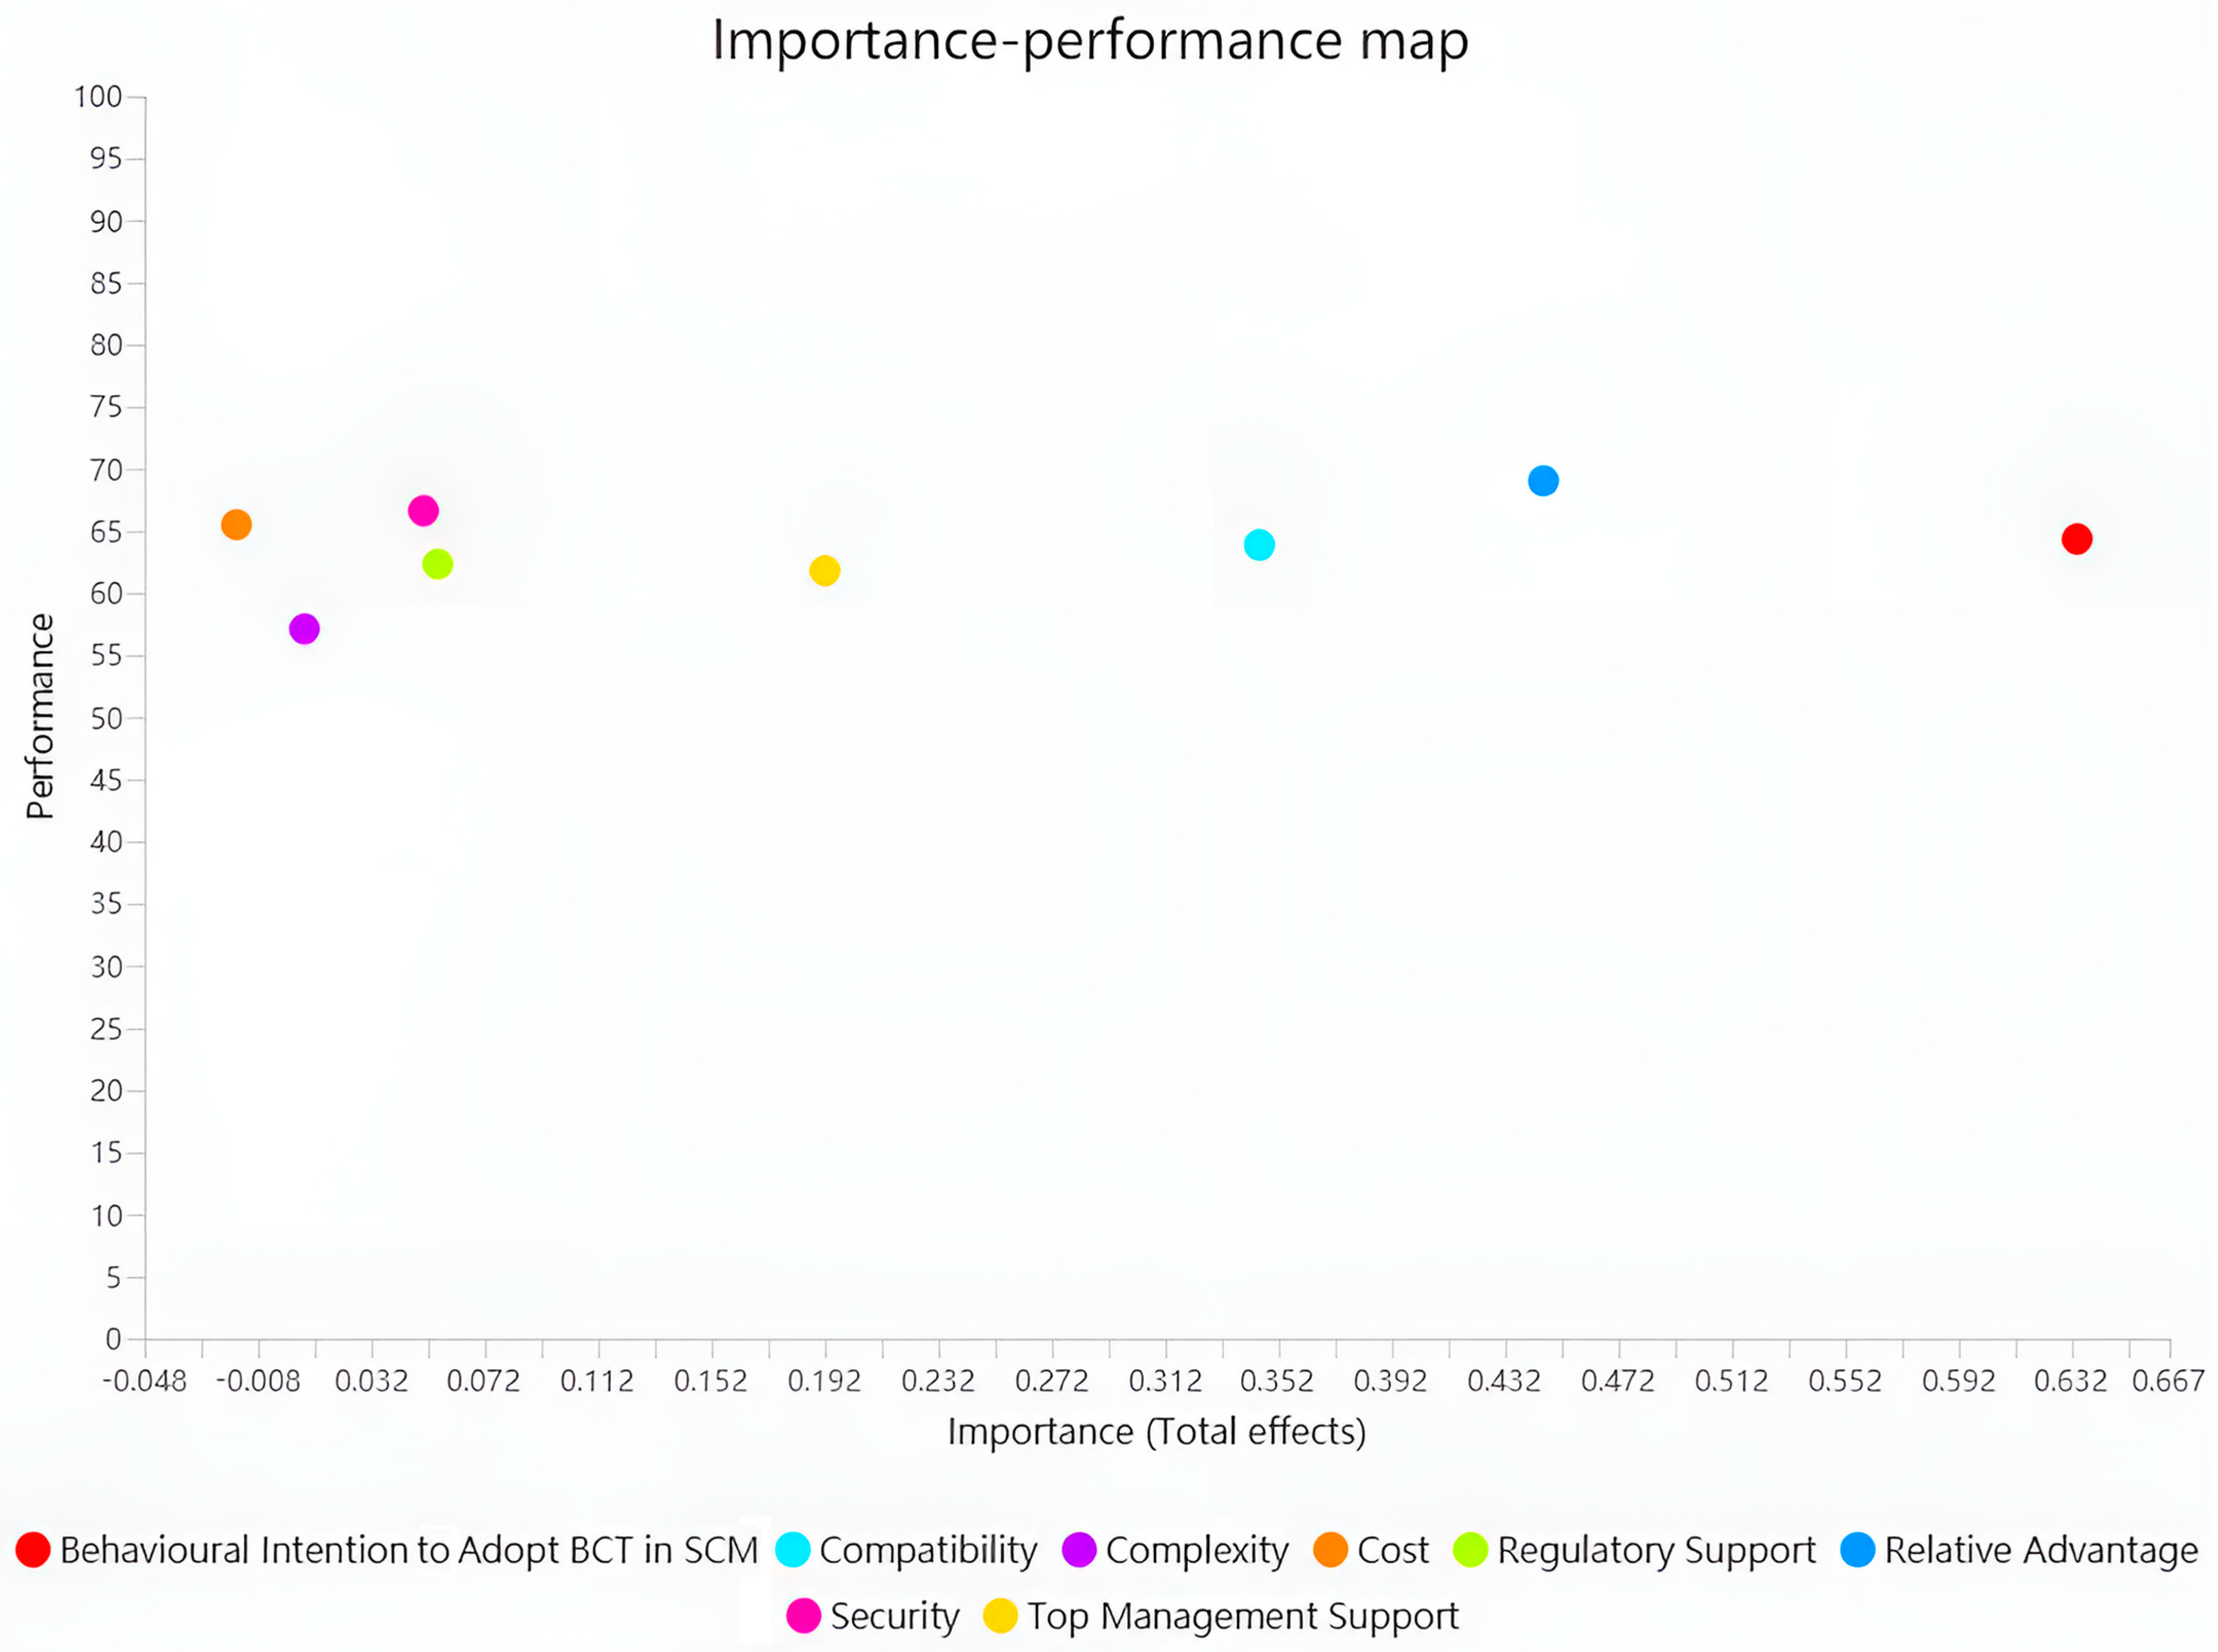
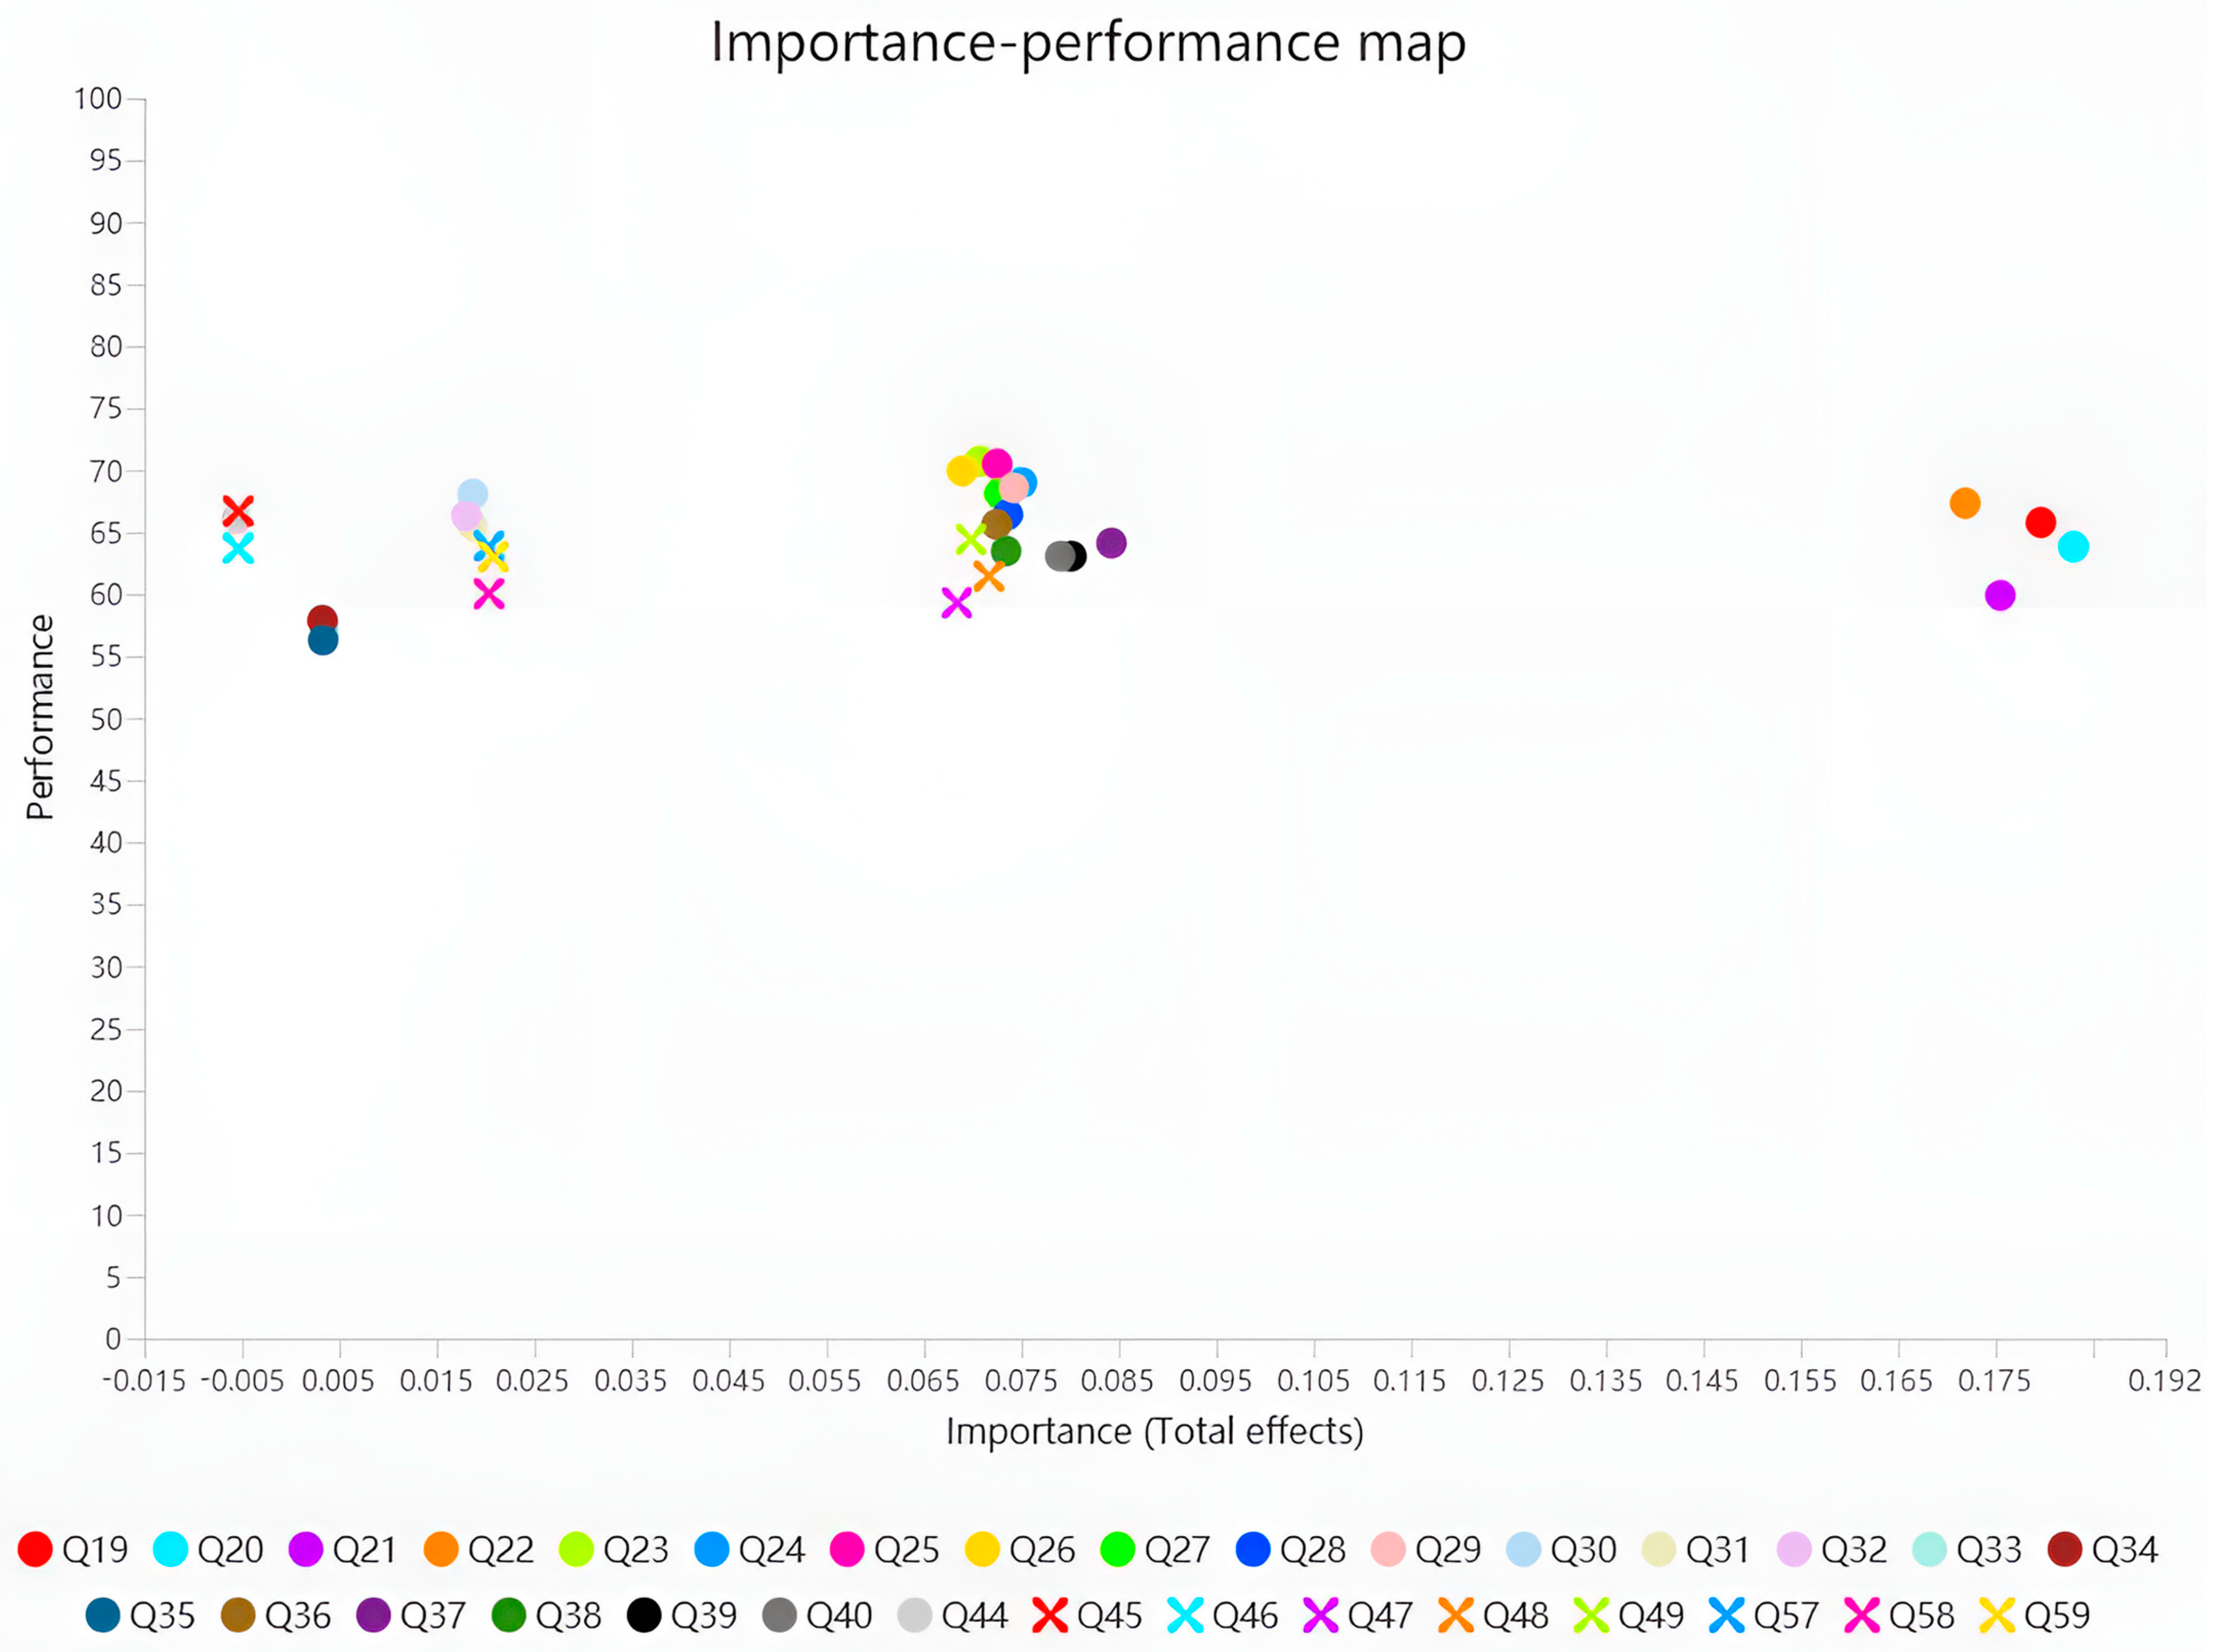
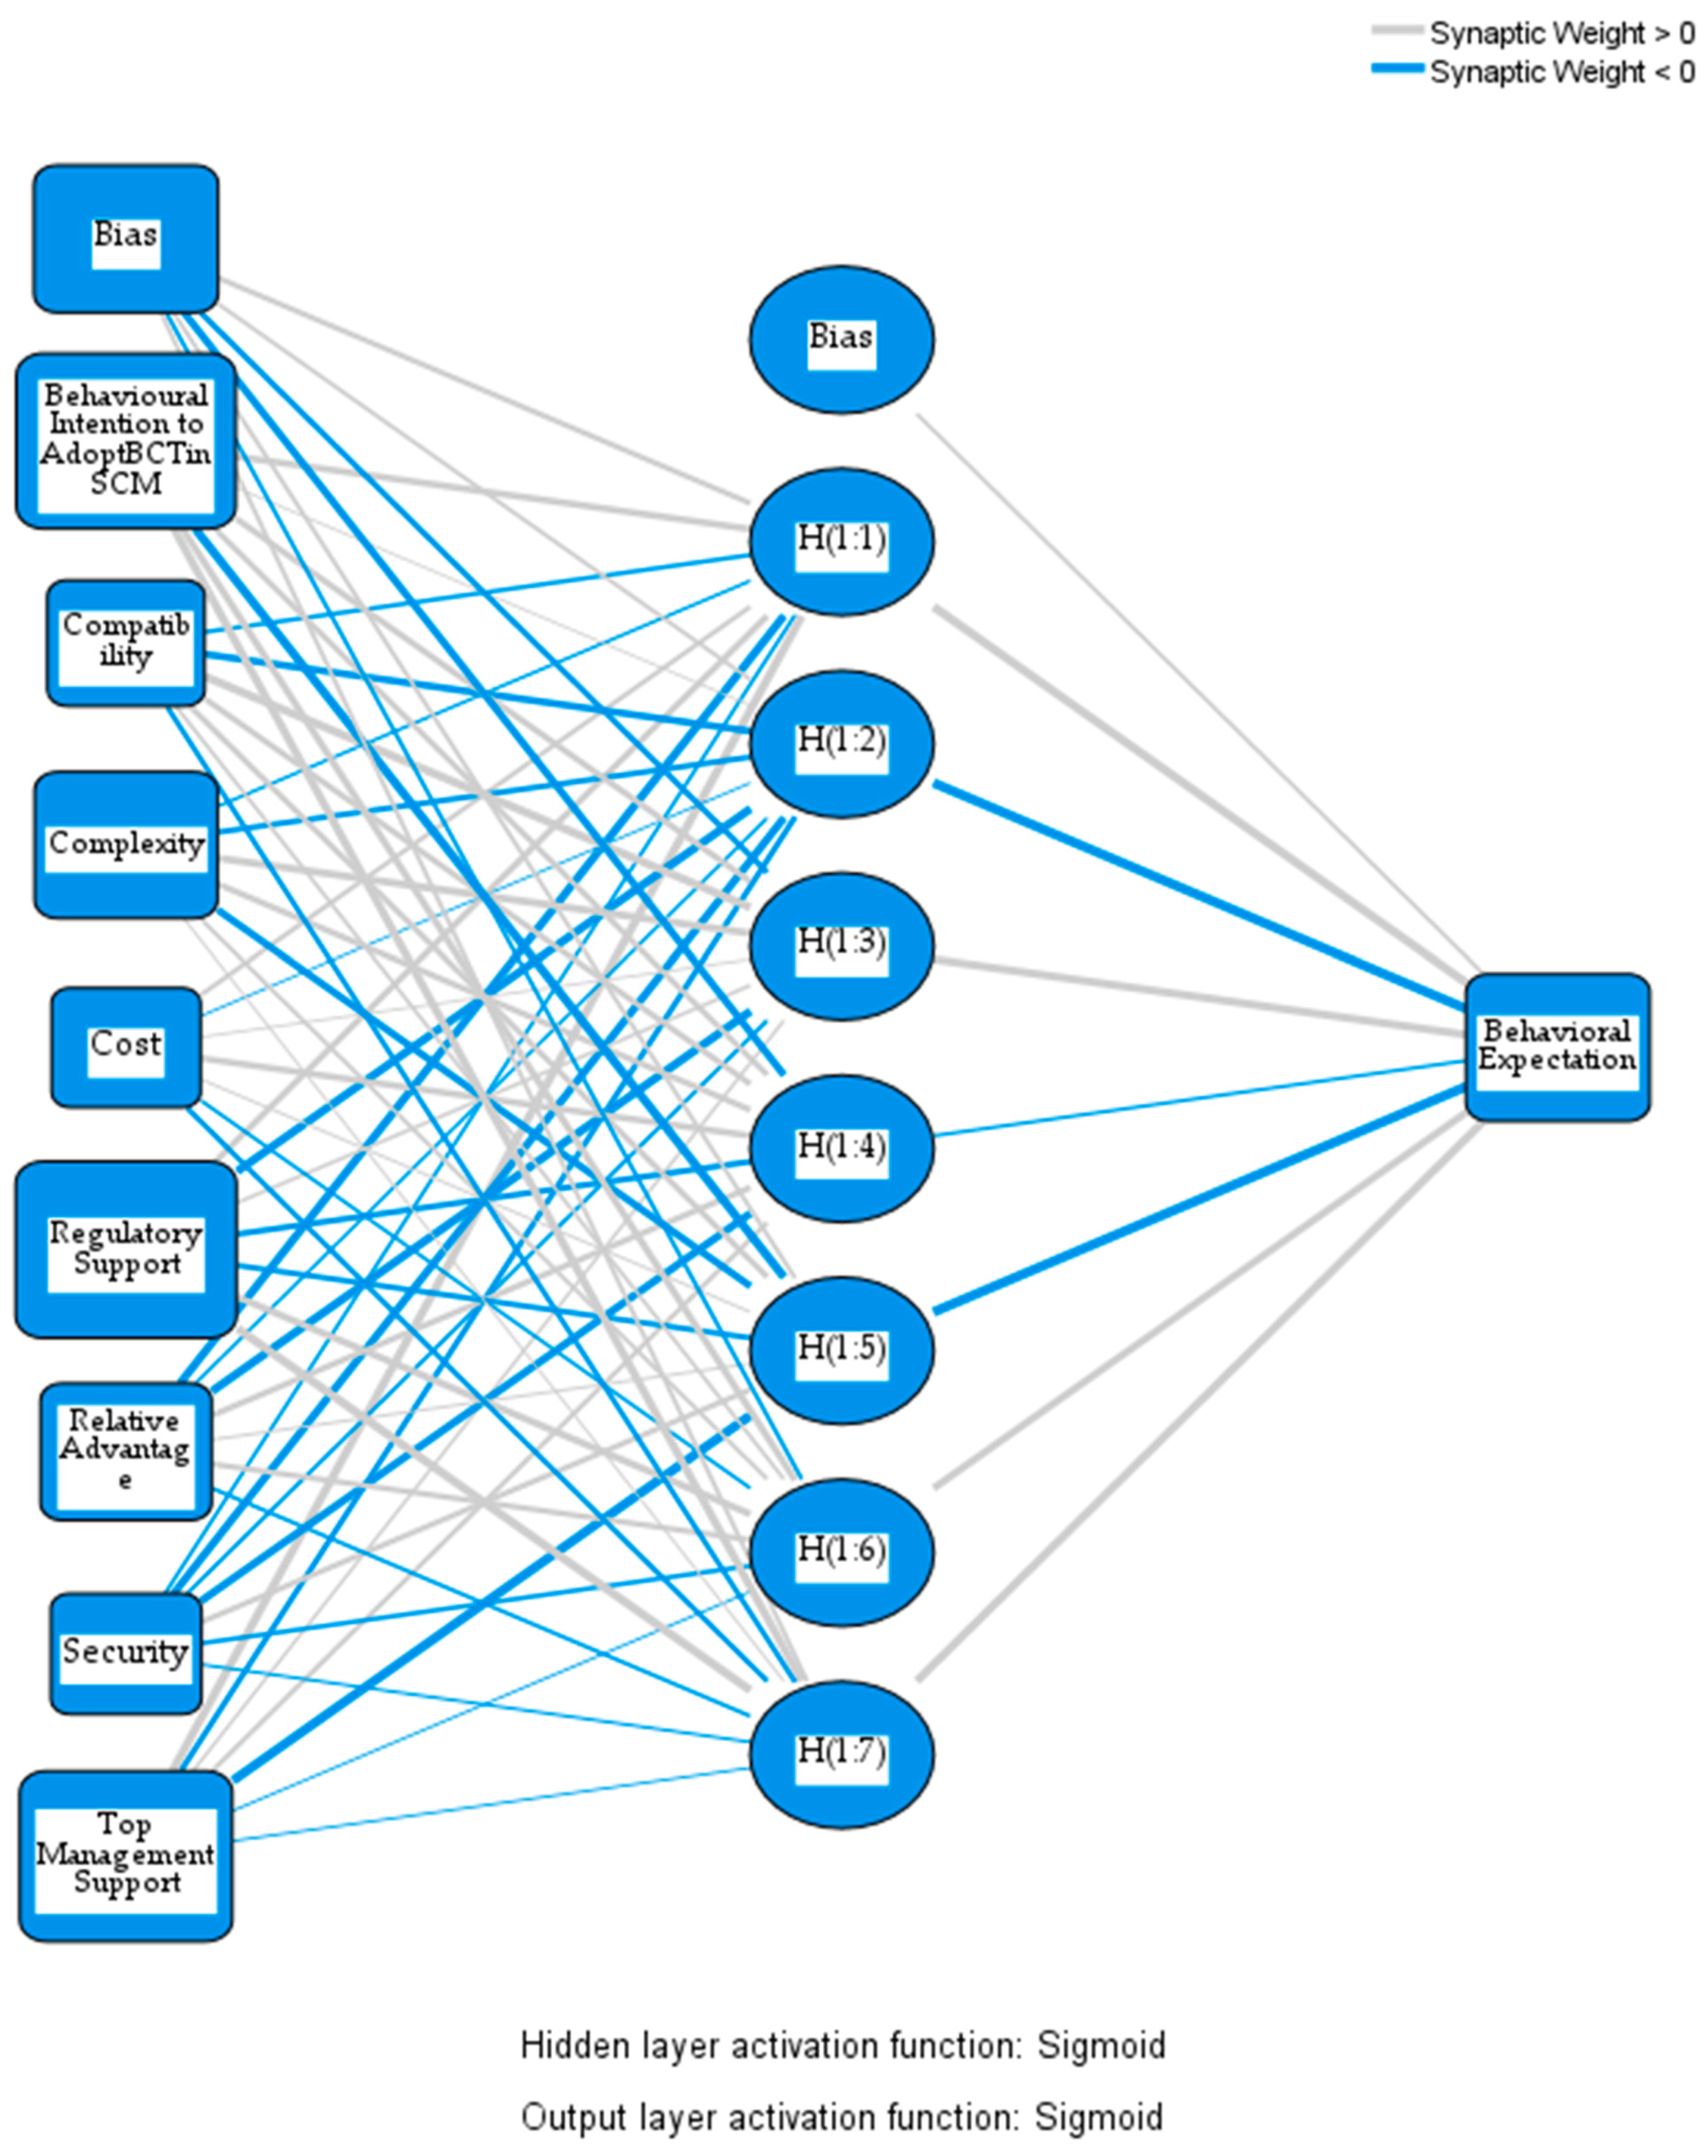
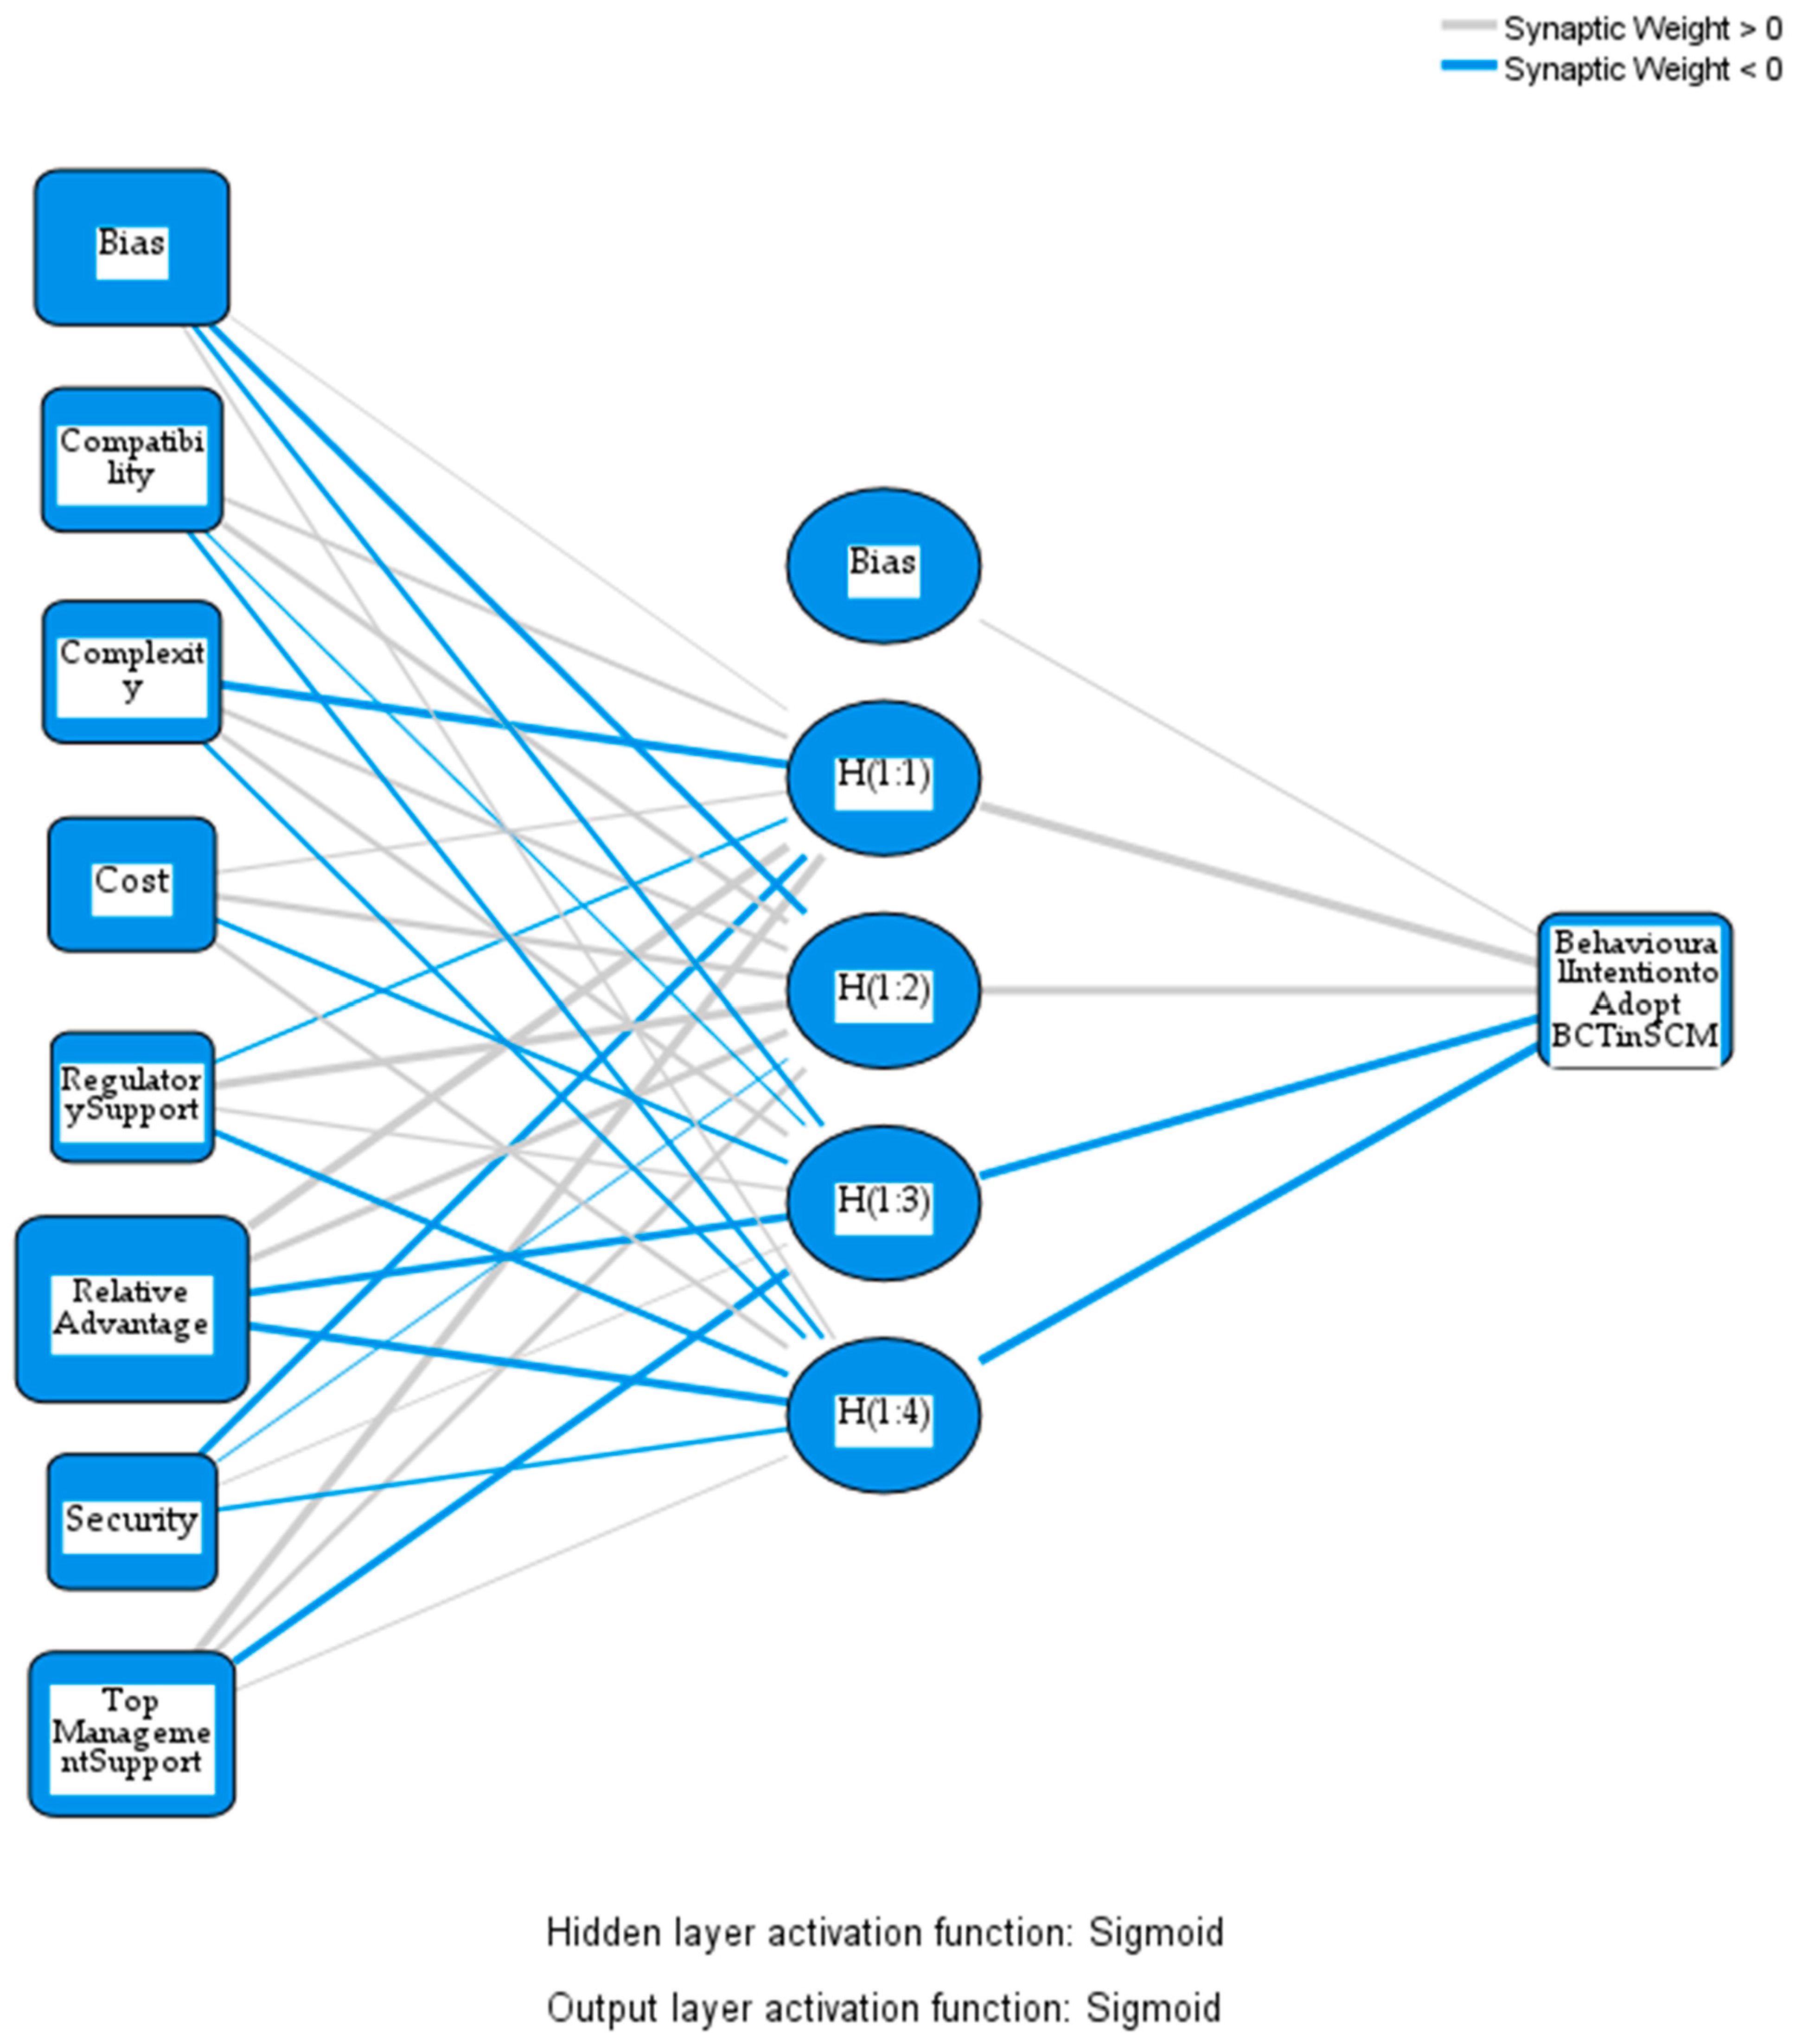
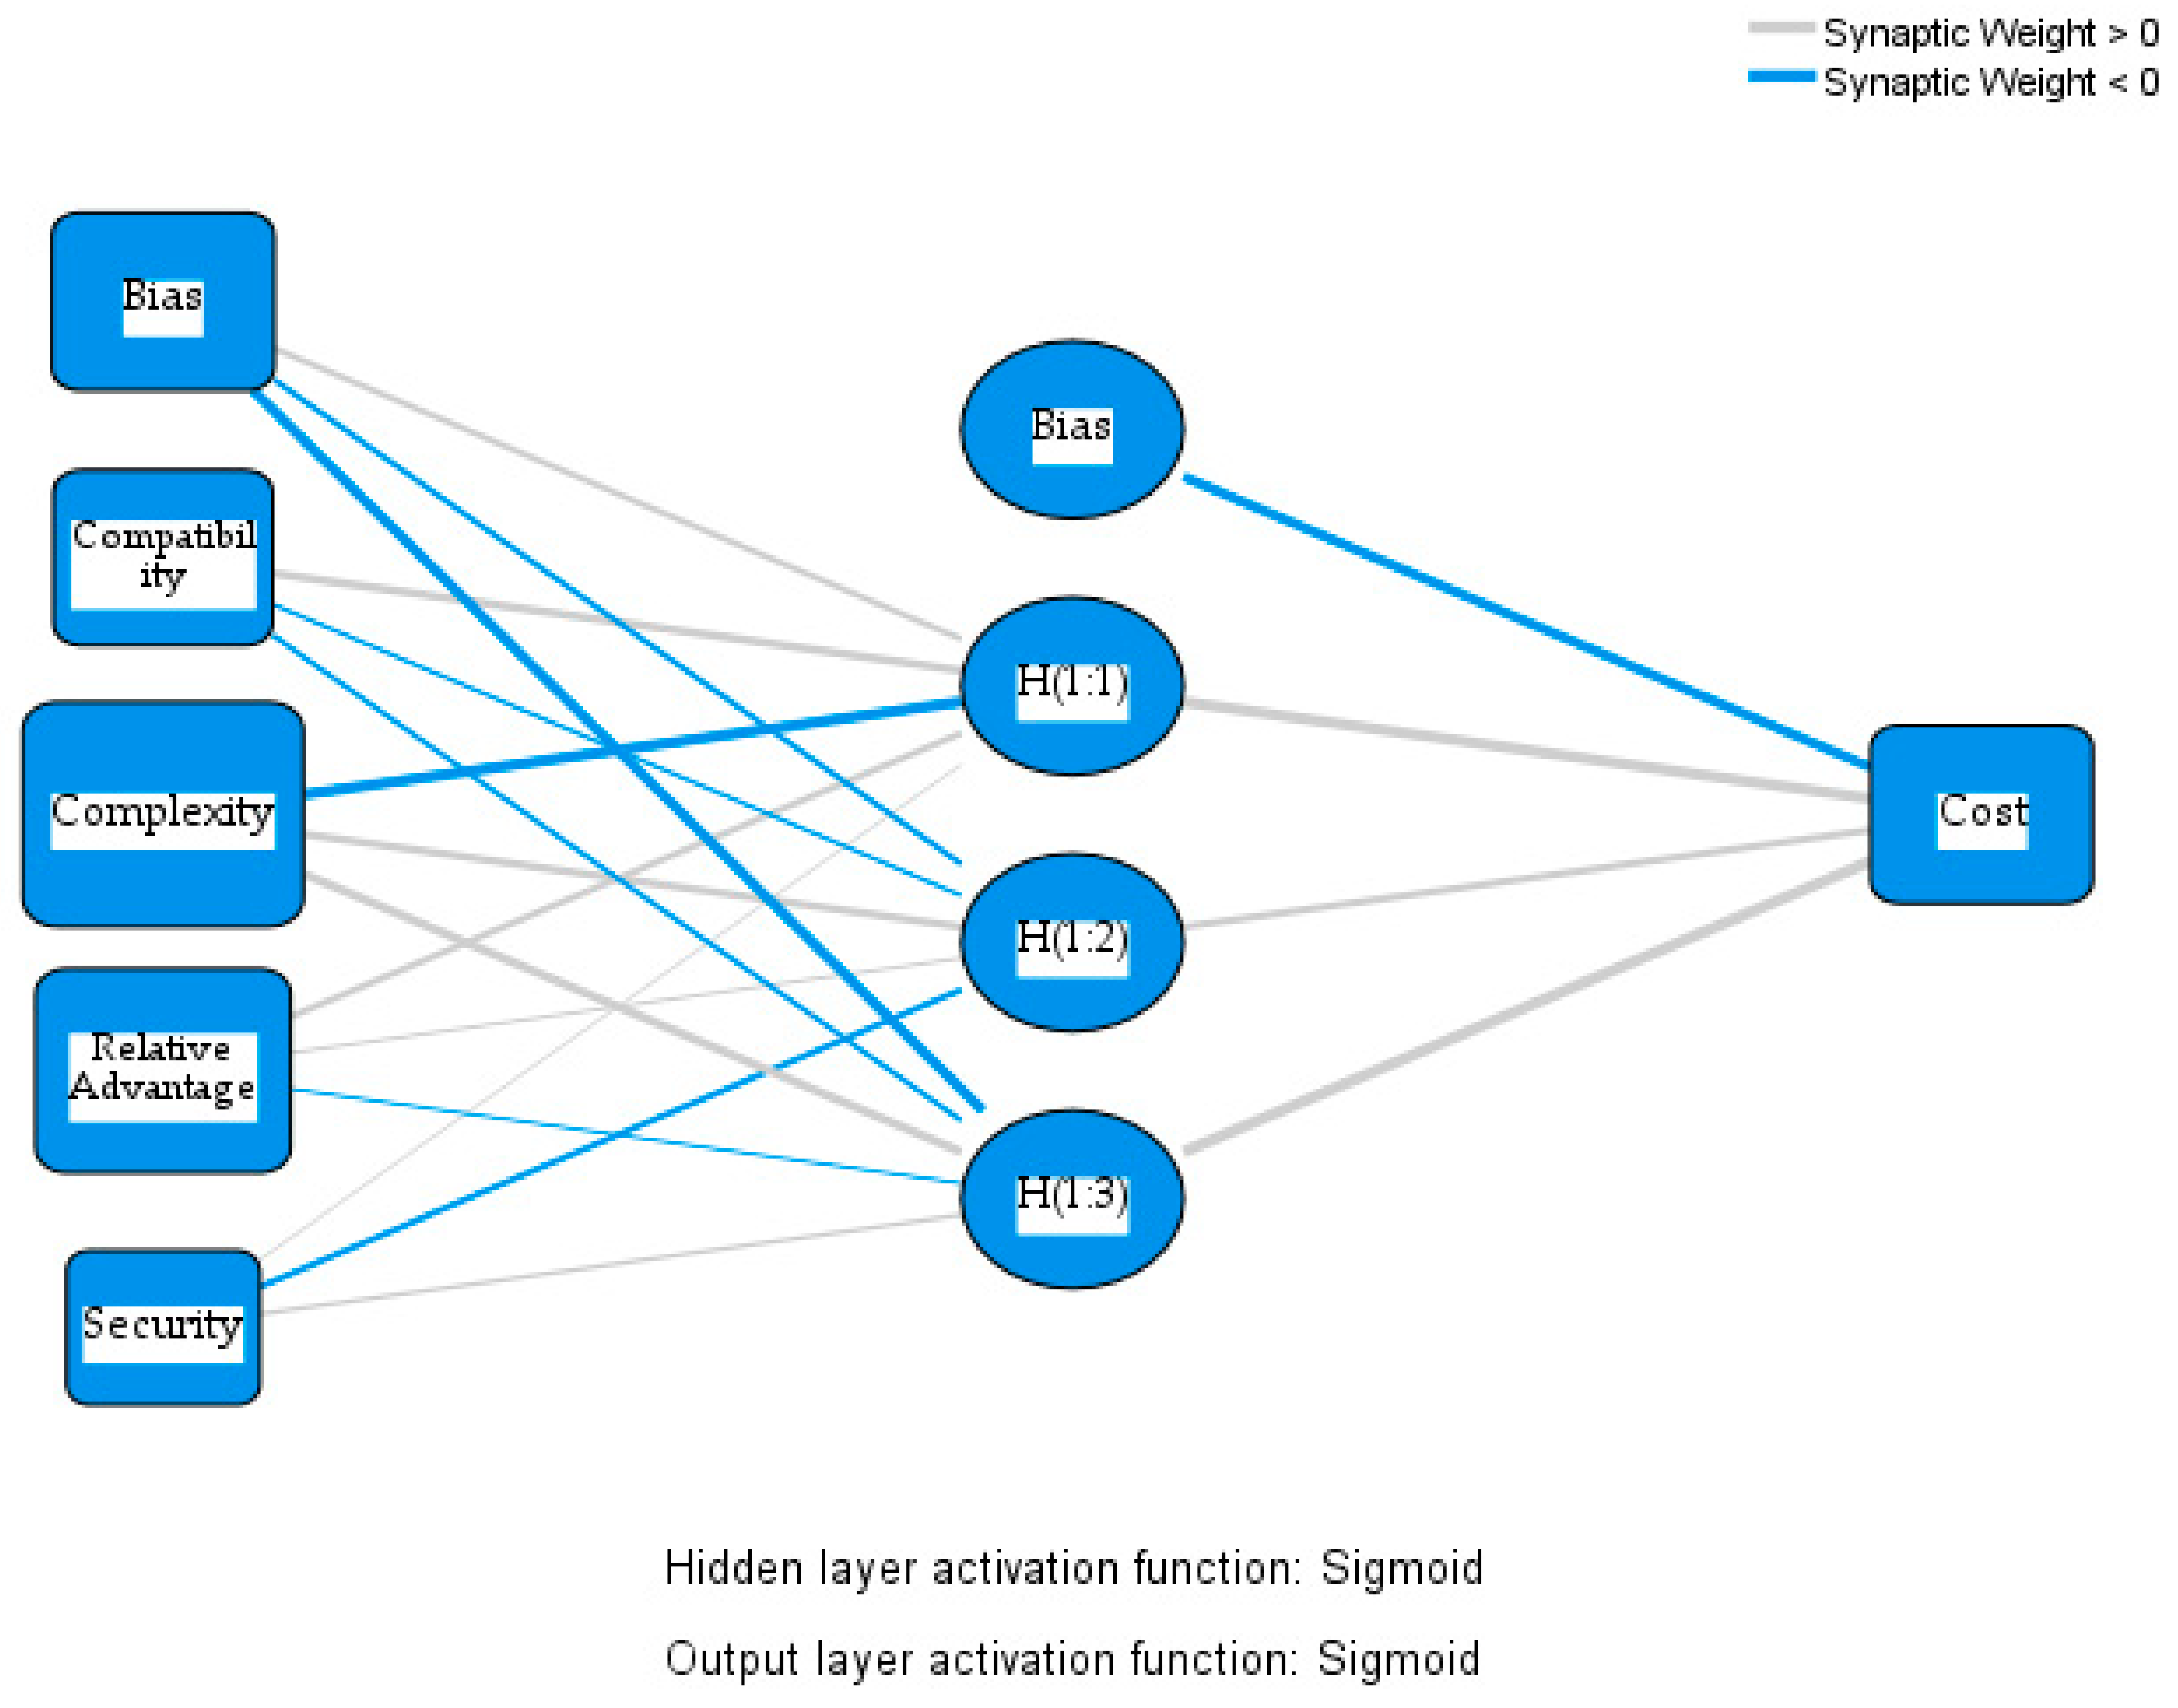
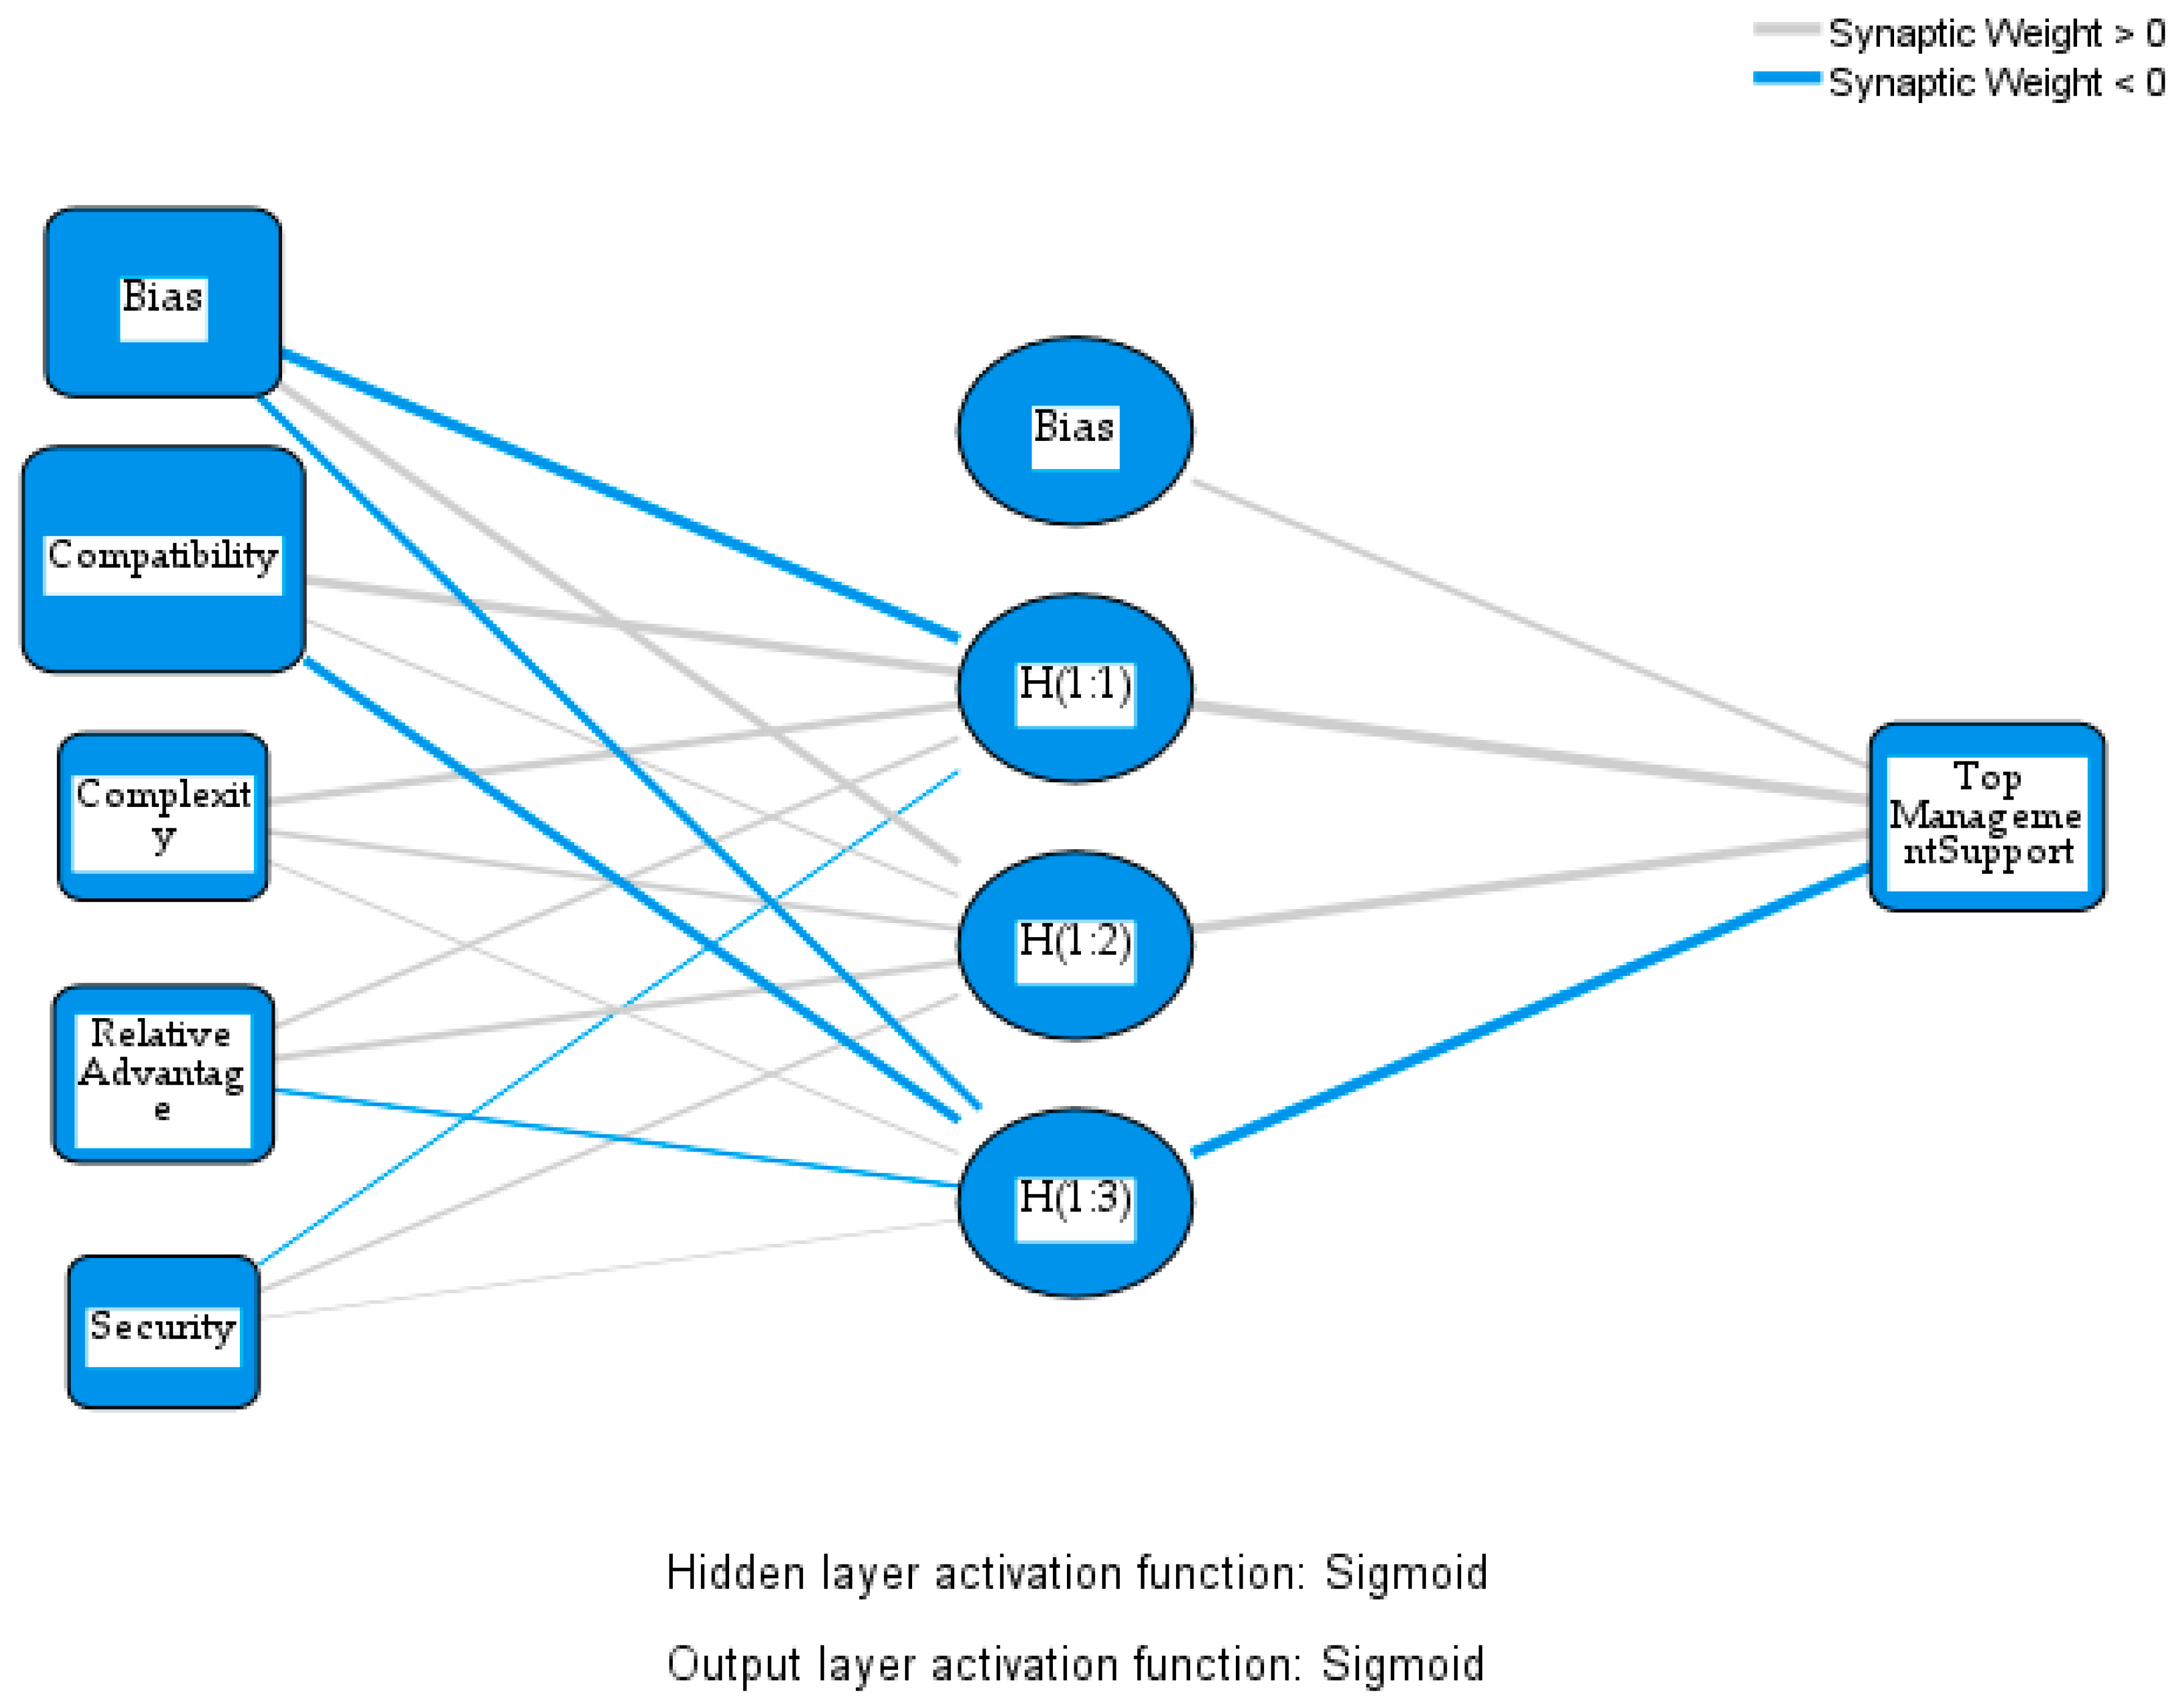
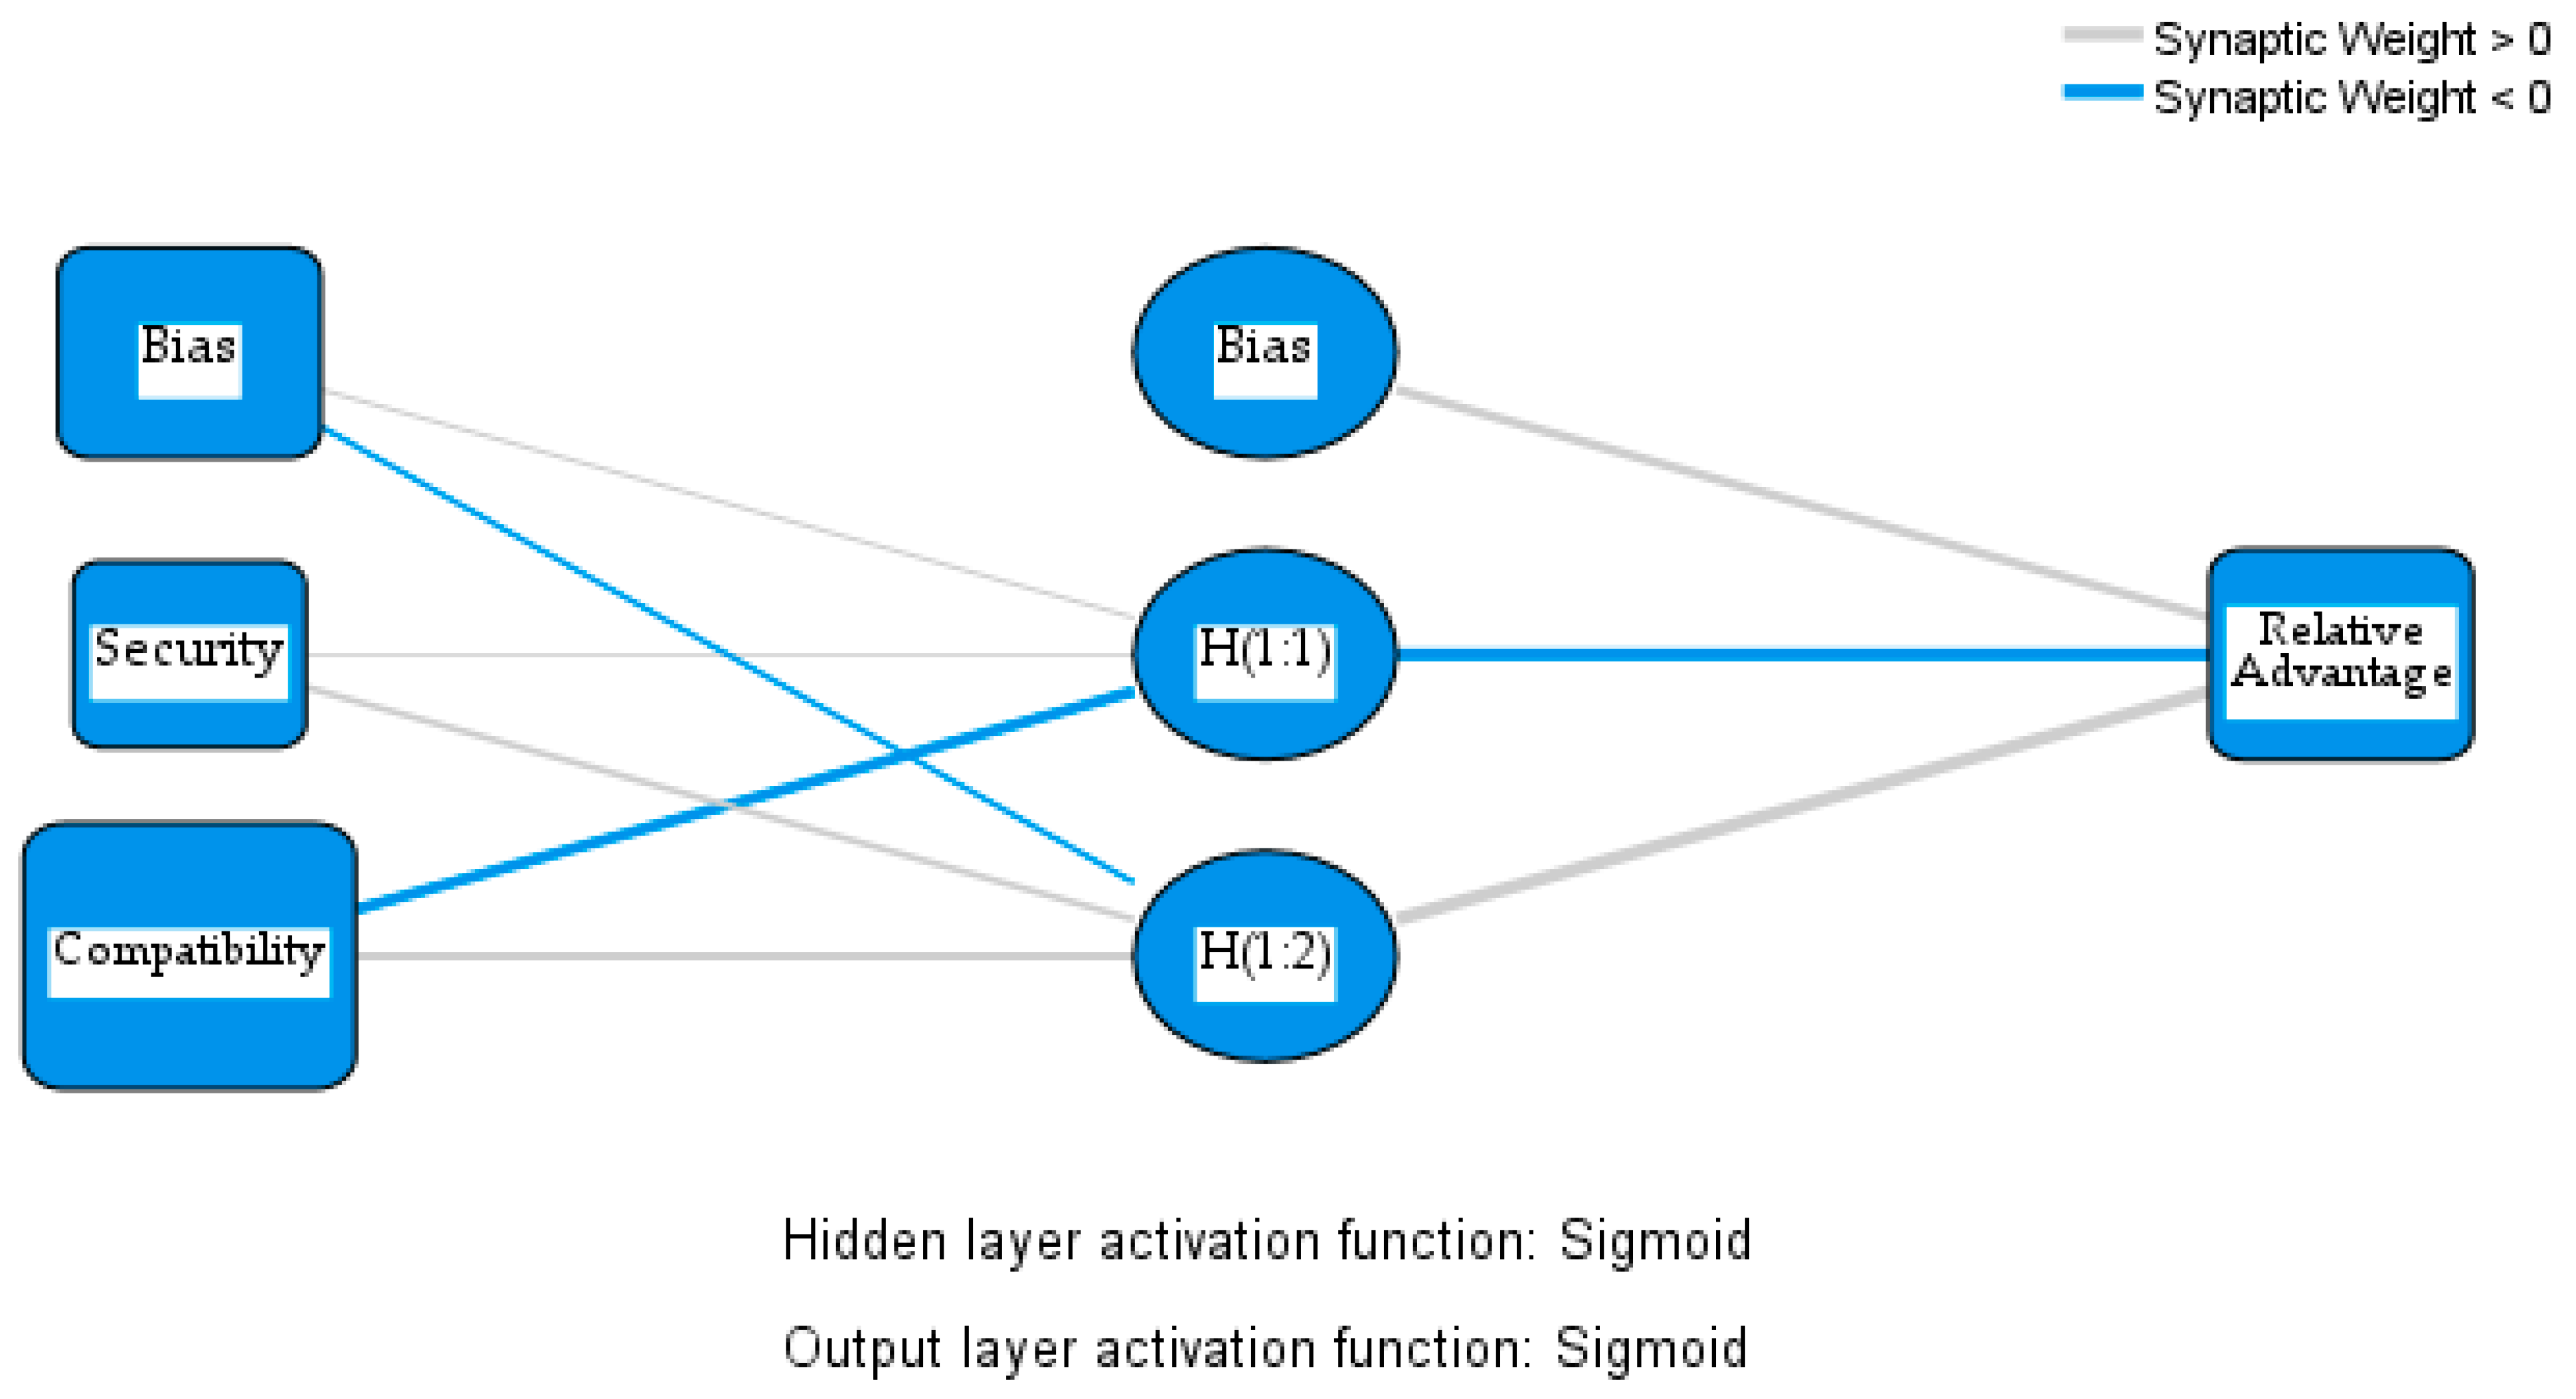
Disclaimer/Publisher’s Note: The statements, opinions and data contained in all publications are solely those of the individual author(s) and contributor(s) and not of MDPI and/or the editor(s). MDPI and/or the editor(s) disclaim responsibility for any injury to people or property resulting from any ideas, methods, instructions or products referred to in the content. |
© 2025 by the authors. Licensee MDPI, Basel, Switzerland. This article is an open access article distributed under the terms and conditions of the Creative Commons Attribution (CC BY) license (https://creativecommons.org/licenses/by/4.0/).