Abstract
The classification of agricultural products is of great importance for quality control, optimized marketing, efficient logistics, research progress, consumer satisfaction, and sustainability. Dragon fruit has many varieties that need to be identified quickly and accurately for packaging and marketing. Considering the increasing demand for dragon fruit, it is obvious that an automated classification system has significant commercial and scientific value by increasing sorting efficiency and reducing manual labor costs. This study aimed to classify four commonly produced dragon fruit varieties according to their color, mechanical, and physical properties using machine learning models. Data were collected from 224 dragon fruits (53 American beauty, 57 Dark star, 65 Vietnamese white, and 49 Pepino dulce variety). Classification was performed using measurable physical and mechanical properties obtained through digital image processing, colorimetry, electronic weighing, and stress–strain testing. These methods provided objective and reproducible data collection for the models. Three models—Random Forest, Gradient Boosting, and Support Vector Classification—were implemented and their performances were evaluated using accuracy, precision, recall, Matthews’s correlation coefficient, Cohen’s Kappa, and F1-Score. The Random Forest model showed the highest performance in all metrics, achieving 98.66% accuracy, while the Support Vector Classification model had the lowest success. The superior performance of the Random Forest model can be attributed to its ability to handle complex, nonlinear relationships among multiple variables while preventing overfitting through ensemble learning. However, potential challenges in dragon fruit classification include variations due to environmental factors, genetic variation, and hybridization. Future research can focus on incorporating biochemical or genetic markers and improving real-time classification for industrial applications.
1. Introduction
The dragon fruit, also referred to as pitaya or pitahaya, is a common tropical and subtropical fruit that comes from a perennial plant in the genus Hylocereus of the Cactaceae family that originated in Central America [1,2]. It is classified into three species within the genus Hylocereus: Hylocereus guatemalensis (Hg), Hylocereus polyrhizus (Hp), and Hylocereus undatus (Hu), which is a pink peel and purple pulp; additionally, there is a yellow peel and white pulp species within Selenicereus, which is Selenicereus megalanthus (Sm). The distribution of pitaya cultivation in Europe is still limited but these species are widely grown in Singapore, Turkey, Malaysia, China, and Spain [3,4,5]. Spain is currently the largest producer of pitaya in Europe, but Turkey has seen a huge increase in pitaya production in recent years and exports a significant amount to European countries [6].
As more areas are used for cultivating dragon fruit, more dragon fruit is exported to other nations. However, the quality of agricultural products will decide the price and market for that sort of agricultural product to be able to export the agricultural products, notably dragon fruit. There is not enough research on the biological diversity of the Selenicereus genus worldwide. Determining the species and varieties in growing countries is very important because serious problems occur due to inconsistencies in the characteristics of many fruits such as sweetness, size, shape, color and number of bracts [7,8]. This heterogeneity makes it difficult to increase quality standards for the export market [7]. Nowadays, it is not easy to distinguish species and varieties of dragon fruit due to high intra- and interspecific hybridization, which causes some taxonomic confusion [8]. Almost every nation has its own varieties, so before the dragon fruit is packaged and exported, it must be classified according to its varieties in accordance with the established norms [9]. The main problem is that dragon fruit species and varieties are not well known, and their promotional characteristics are not determined. Most people are only aware of the dragon fruit’s peel and pulp colors. However, because of the research, it has been determined that there are differences in dragon fruit characteristics in shape and shell color, number of bracts, width of the middle bract, length of the apical bract, shape of the apical cavity and flesh color [10]. Producers who can identify different species of dragon fruit will be able to control the fruit’s production, handle it both before and after harvesting, and organize transportation in packing houses to best suit each species’ unique morphology. This will impact the price at which it is sold as well as help preserve fruit species [11]. However, morphology-based species identification necessitates a high level of skill and knowledge.
To solve the above problems, we need a classification system that can effectively and efficiently identify the type of dragon fruit without damaging the dragon fruit [12]. Currently, dragon fruit export companies rely on manual grading based on visual inspection, which is a time-consuming and labor-intensive process. Additionally, this method incurs high operational costs and is prone to human error, resulting in relatively low classification accuracy. The automatic dragon fruit classification system is essential and necessary for existing dragon fruit packaging and grading plants, utilizing color, optical, and mechanical assessment methods for accurate sorting [13]. In conclusion, classifying dragon fruit by variety is crucial for optimizing agricultural practices, ensuring food quality, and maximizing economic benefits throughout the supply chain. It underpins research in various academic disciplines and contributes to the sustainable development of the dragon fruit industry. Optimization algorithms have also been applied to tasks such as fruit identification and precision defect identification in retail and wholesale markets. Computer vision is one of the most widely used technological tools in the agricultural sector. It is used in fruit sorting machines, retail fruit screening, and automatic fruit harvesting [14,15,16,17,18].
As science and technology have advanced, numerous studies on the automatic categorization of agricultural products—such as fruit classification systems and the classification of lemons, grapes, tomatoes, lychees, oranges, pomegranates, mangoes, and green apples—have been presented and put into reality [19,20,21,22,23,24]. There is a lack of research on automatic dragon fruit classification systems. This is likely due to the variations in climate and environment around the world, which affect the fruit’s characteristics. Additionally, the high import and export volume of different dragon fruit varieties complicates the development of a universal classification system. Developing an automatic dragon fruit classification system is highly important. Several studies have been conducted on dragon fruit, including a quality classification system for white flesh dragon fruit [12] that utilizes the backpropagation method with image processing to categorize dragon fruit. This study employed an experimental model with a white background, achieving an accuracy of 86.67%. Other research has focused on identifying ripeness [25] and detecting stem diseases [26]. Zhang et al. (2022) [18] proposed the use of an easy DAM V2 model as a better data labeling technique for fruit detection that can identify various fruit types and shapes, while Trieu and Thinh (2021) [9] used a convolutional neural network for image processing in the classification of dragon fruits and a machine learning model to identify the external features of dragon fruits. In three other studies using artificial intelligence techniques to classify dragon fruit (Hylocereus costaricensis), Wulanningrum and Lelitavistara (2015) [27] achieved an accuracy of 80% using the Discrete Cosine Transform (DCT) method. Bimantaka (2017) [28] achieved a system accuracy of 96.67% in a subsequent study using back propagation technique for maturity detection.
The classification of pitahaya (dragon fruit) is of great importance in the agricultural industry, especially to facilitate quality control, standardization, and export processes. As the global demand for dragon fruit continues to increase, consistent classification will become crucial to maintain market competitiveness and comply with international trade regulations [29]. However, the taxonomic complexity and genetic variability of pitahaya pose significant challenges to its commercialization. The high level of intraspecific and interspecific hybridization makes it difficult to accurately distinguish between species and cultivars, making quality assessment and market pricing extremely difficult [30]. These genetic variations can affect key commercial attributes such as sweetness, size, shape, and structure, leading to inconsistencies that may affect consumer preferences and export logistics [31]. Addressing these challenges with advanced classification methods, such as molecular markers and machine learning-based classification systems, can improve postharvest management, increase supply chain efficiency, and support the sustainable development of the pitahaya industry.
This study significantly contributes to sustainability by promoting precision agriculture through advanced machine learning techniques for fruit classification. By automating the sorting and classification of dragon fruit varieties, the proposed methodology reduces manual labor, minimizes human error, and optimizes post-harvest handling, thereby decreasing food waste and improving supply chain efficiency. Furthermore, accurate classification ensures better market standardization, enhancing economic sustainability for farmers and exporters. The implementation of AI-driven classification not only supports sustainable agricultural practices but also encourages the development of scalable, eco-friendly solutions applicable to a wide range of horticultural products, aligning with global sustainability goals.
This study investigates the feasibility of using Random Forest, Support Vector Machine, and Gradient Boosting machine learning methods to classify four different dragon fruit varieties by exploiting some characteristics of dragon fruit (color, physical, and mechanical properties). Models were interpreted with the confusion matrix, metrics and plots used in the evaluation and interpretation of multiple classification problems, and comparisons were made between models.
2. Materials and Methods
Four different varieties of dragon fruit (Pepino dulce, American beauty, Dark star, Vietnamese white) were harvested from the greenhouses of local producers in Manavgat district of Antalya province. American Beauty is a hybrid of Hylocereus guatemalensis and Hylocereus undatus and is usually distinguished by its red flesh. Dark Star is known as a variety close to Hylocereus guatemalensis. Vietnamese White is one of the most common dragon fruit varieties commercially and belongs to the Hylocereus undatus species with its white flesh and pink rind. Although the exact species information for Pepino Dulce is not fully clear, it is generally classified as Hylocereus undatus or as a hybrid of different Hylocereus species. These varieties offer an important variety both commercially and agriculturally, differing in their physical and taste characteristics. In the harvest season of 2024, a total of 224 dragon fruits (53 American beauty, 57 Dark star, 65 Vietnamese white and 49 Pepino dulce variety) were meticulously chosen at the stage of commercial ripeness and transported to the laboratory using chilled polythene bags to minimize dehydration during transit (Figure 1). All experiments were carried out in the laboratories of Akdeniz University, Vocational School of Technical Sciences, Department of Mechanical, Manavgat Vocational School Department of Organic Farming, and Department of Informatics.
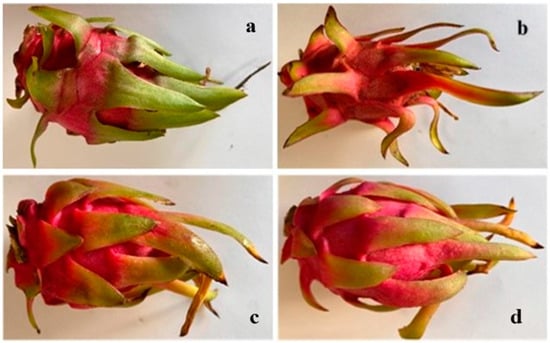
Figure 1.
Dragon fruit varieties: (a) American beauty; (b) Dark star; (c) Pepino dulce; and (d) Vietnamese white.
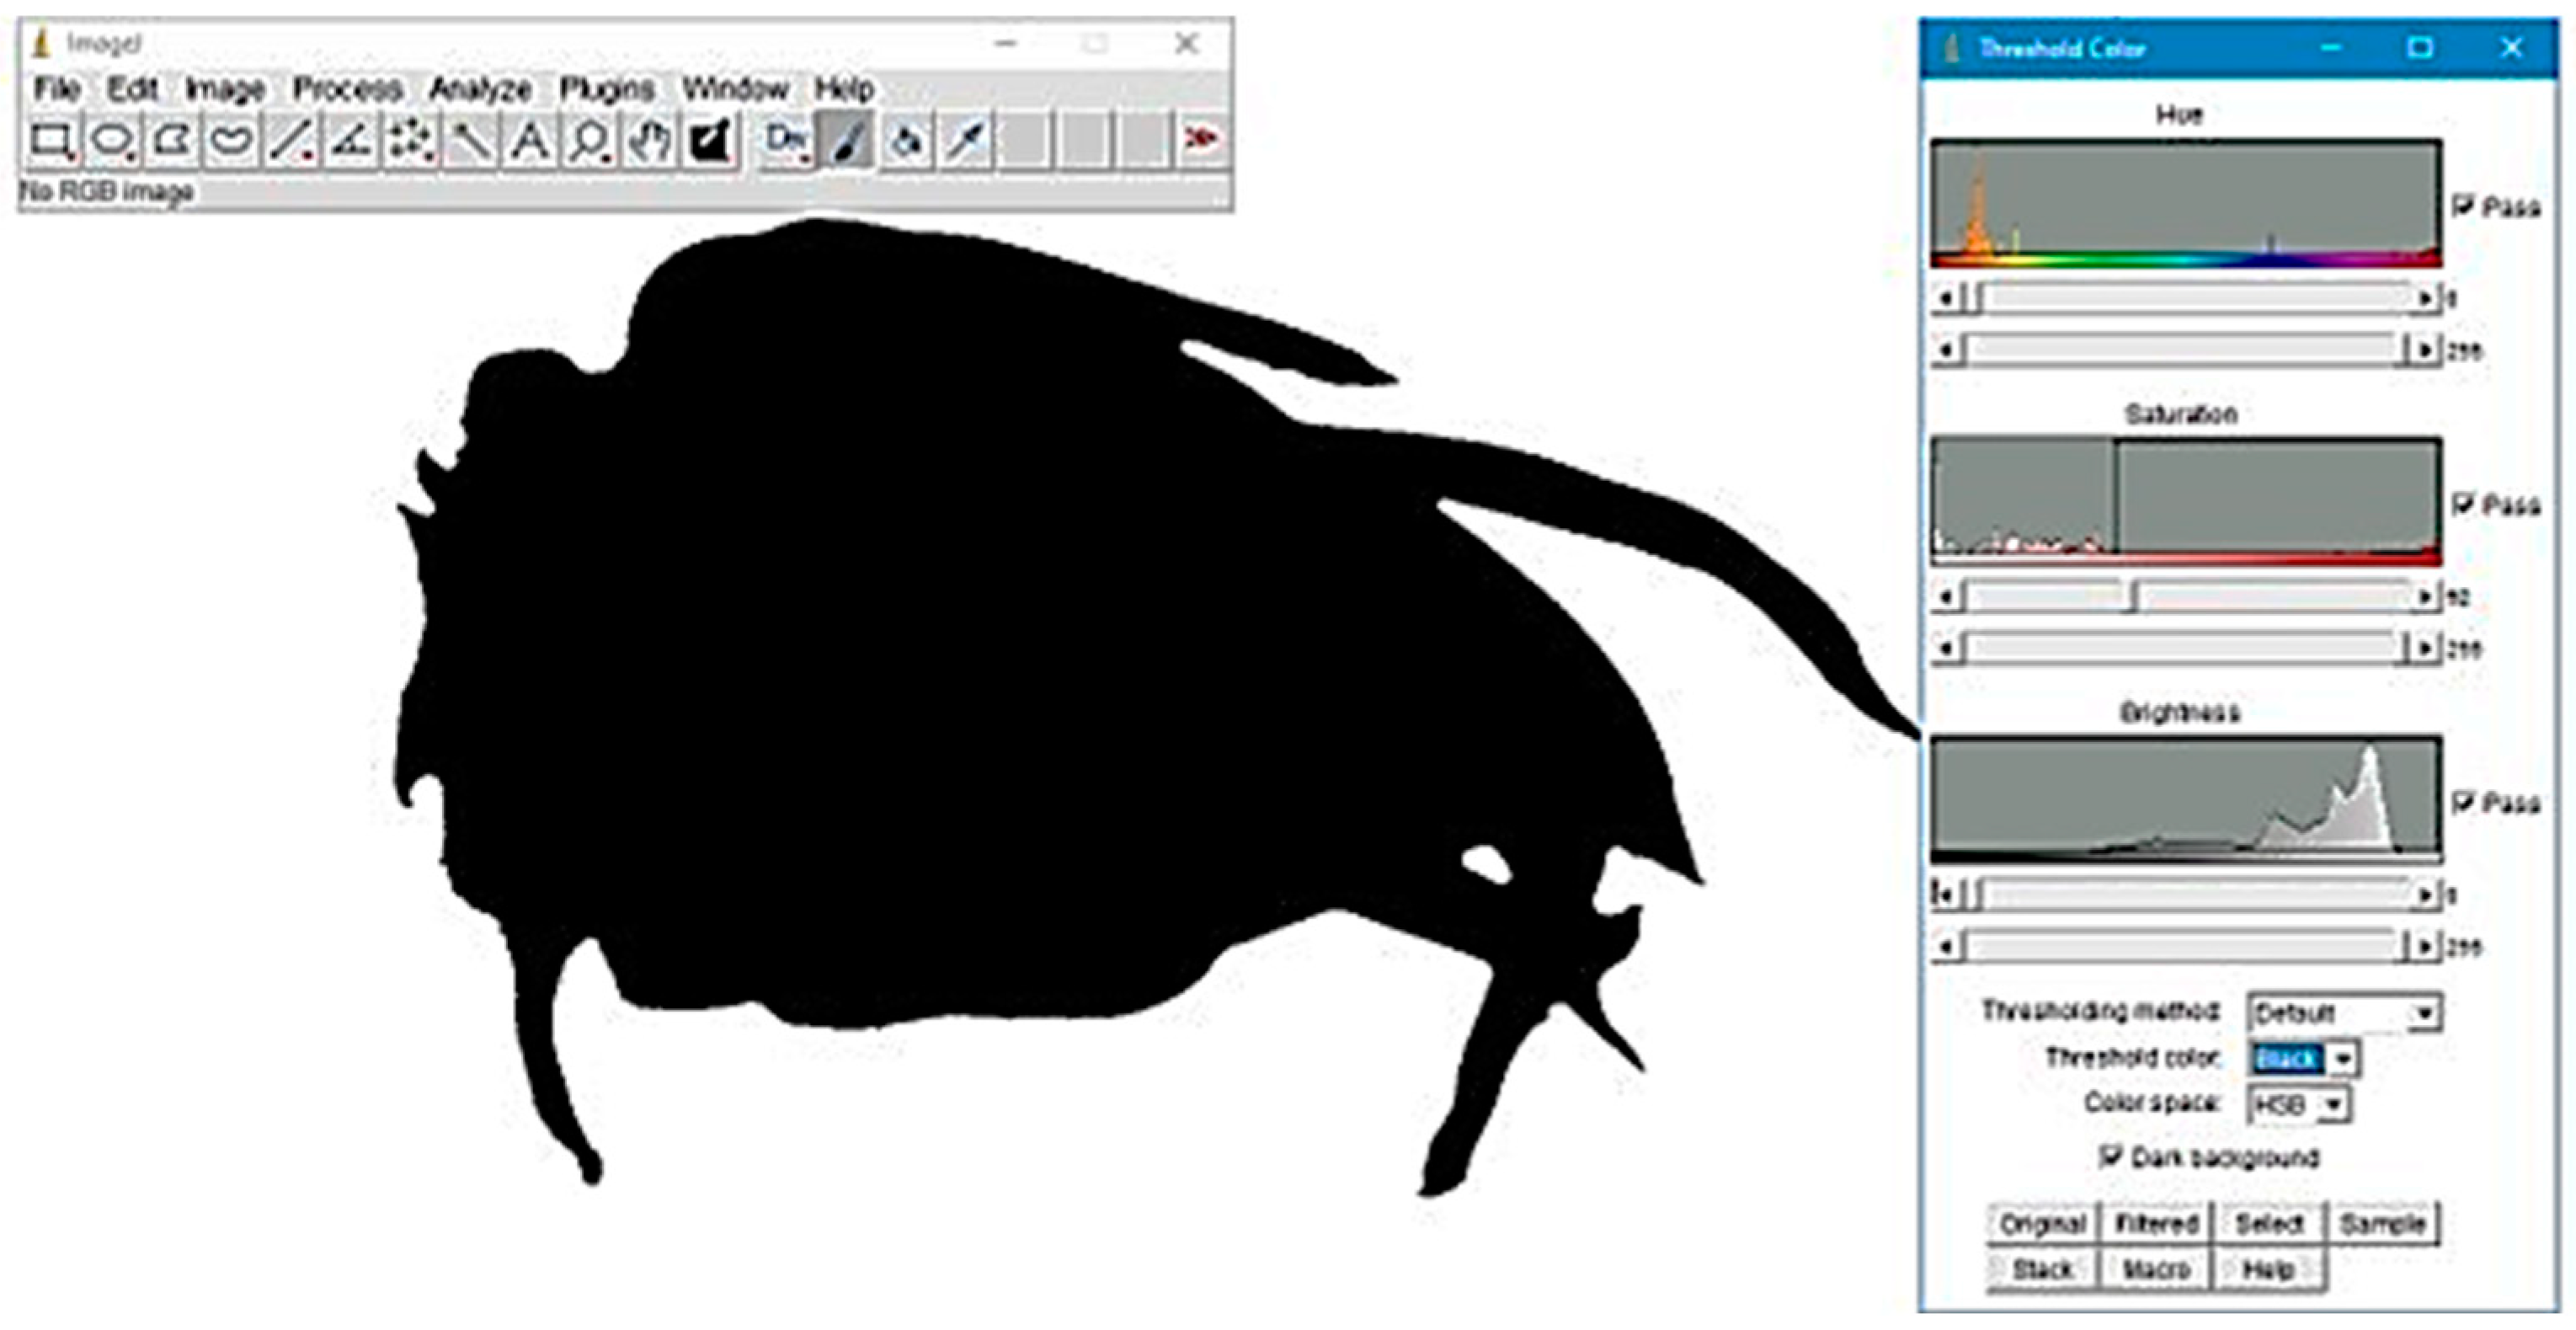
The major and minor diagonal diameter (mm), sphericity (%), perimeter (mm), area (mm2) and volume (mm3) were determined using imageJ 1.53 image processing and analysis software in Java 8 (Figure 2).

Figure 2.
Enhanced contrast and noise-reduced image of dragon fruit (Hylocereus spp.) for texture analysis using imageJ v1.53 software: preprocessing steps including thresholding and Gaussian filtering.
The visible color properties (L, a, b, c, h) of dragon fruit varieties were determined by using a digital colorimeter (NR110 Precision Colorimeter, Shenzhen 3NH Technology Co., Ltd., Shenzhen, China) (Figure 3).
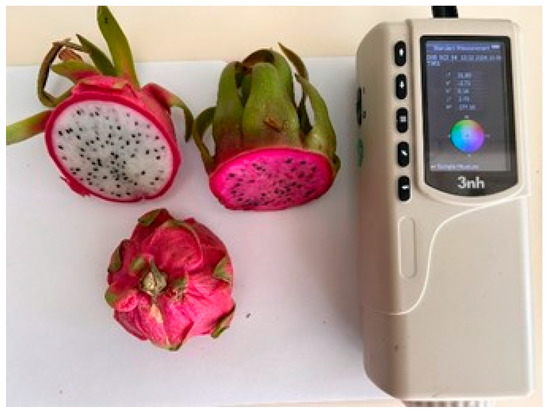
Figure 3.
Digital colorimeter used to measure the outer color of dragon fruit.
Dragon fruit weight (W, g) was determined by electronic balance with a sensitivity of 0.01 g (Model GX-4000, A&D Co. Ltd., Tokyo, Japan) [32].
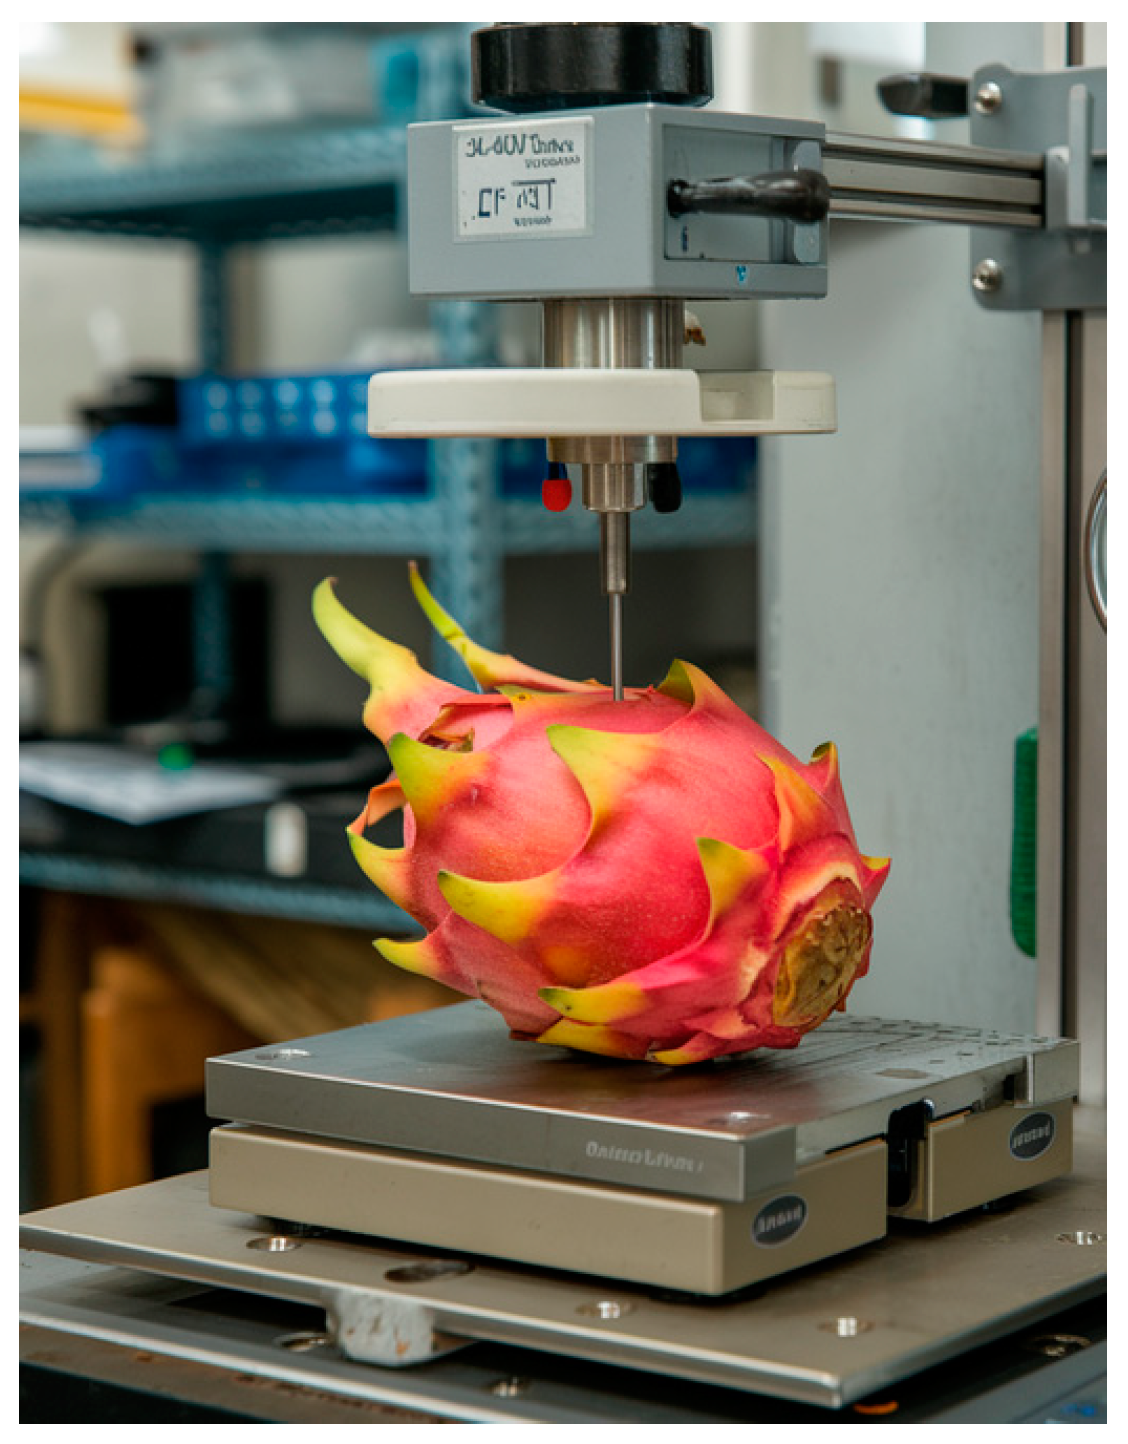
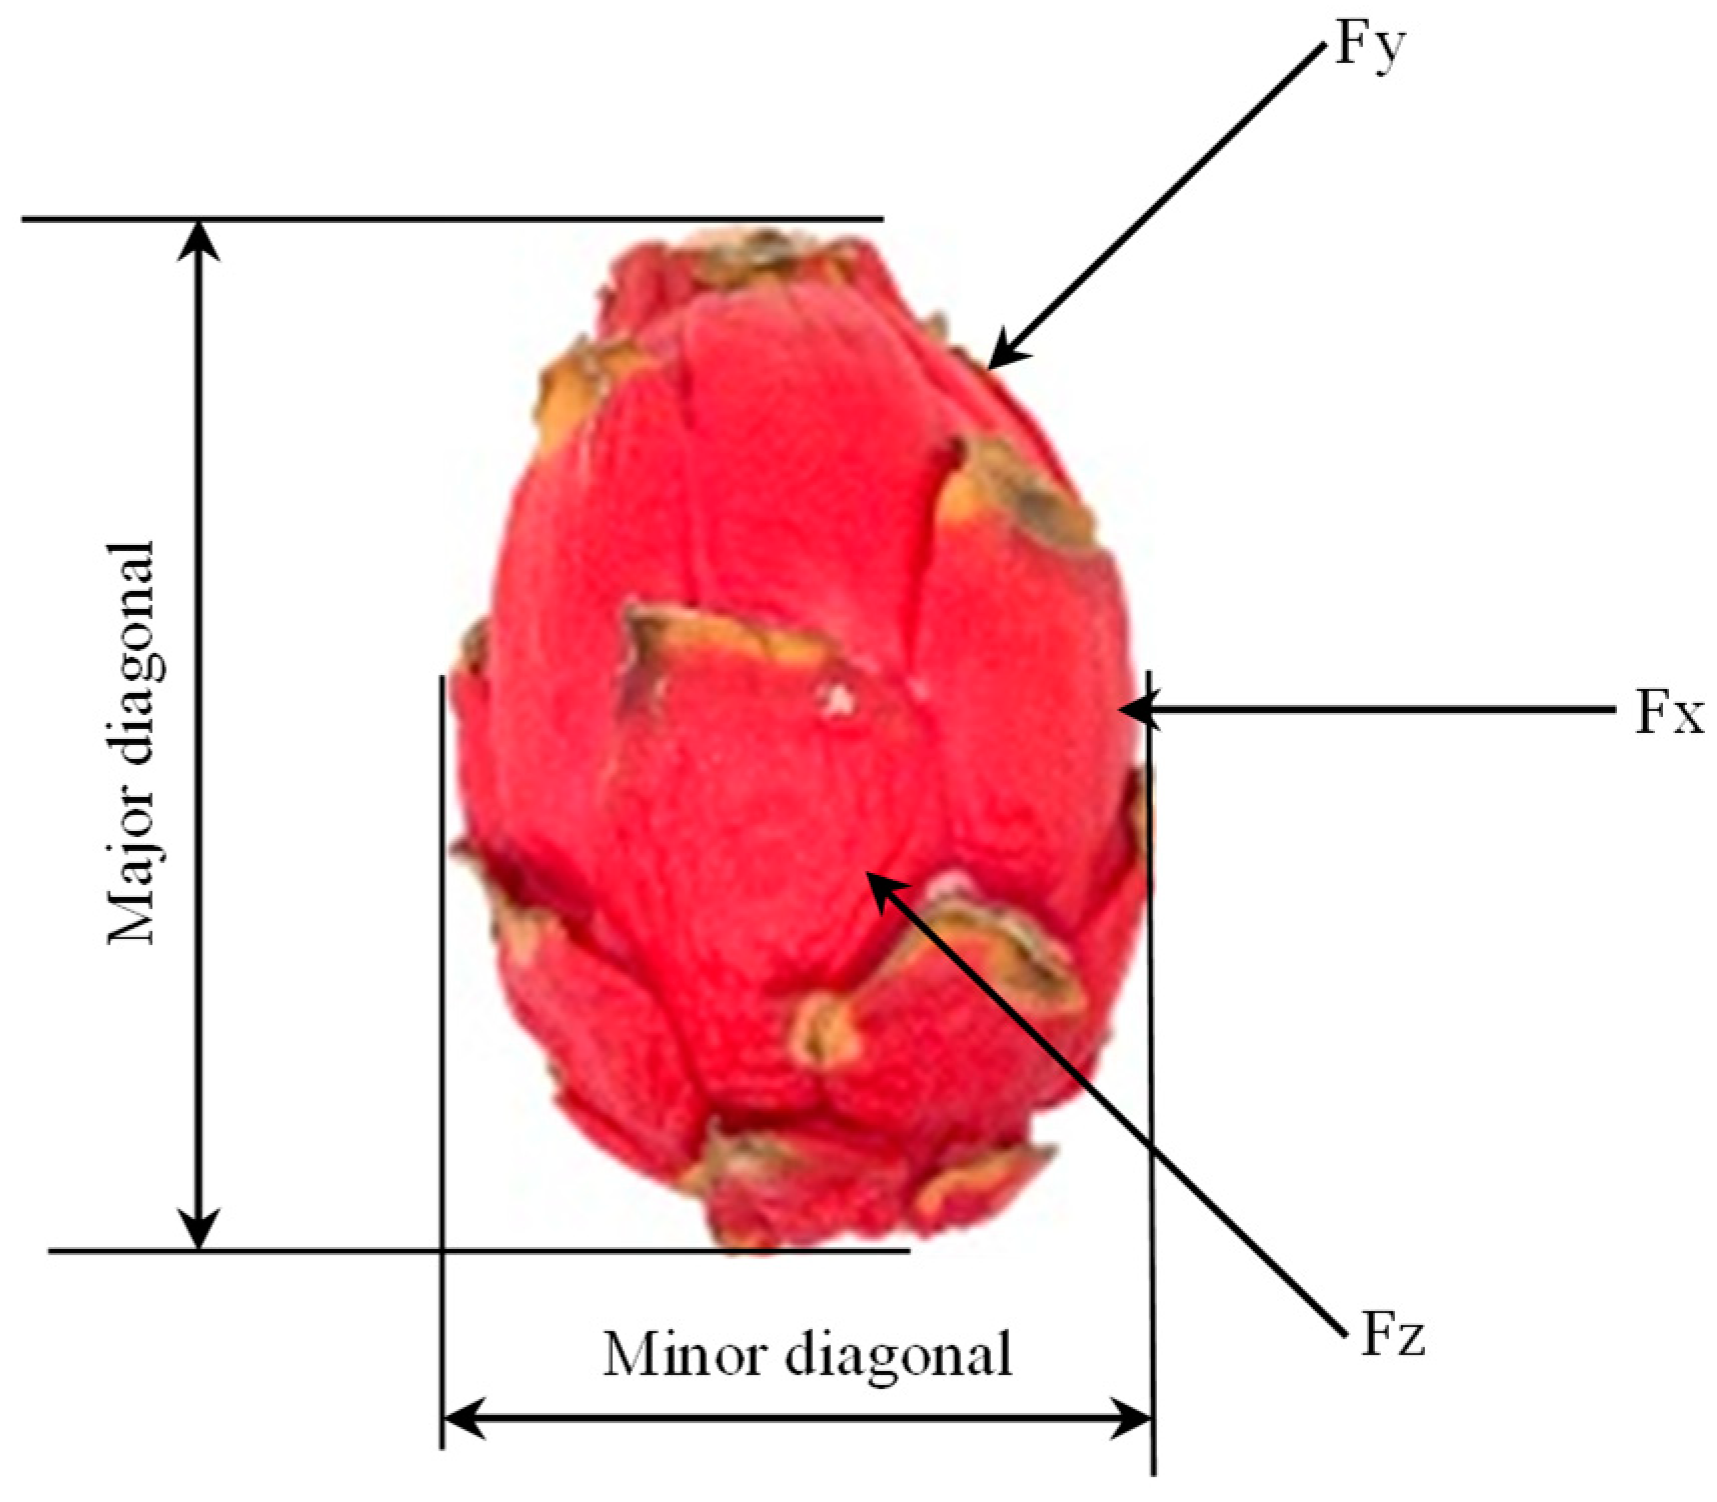
Using a universal stress–strain machine (Lloyd Instruments, LF Plus, West Sussex, UK) running at a steady speed of 20 mm min−1, the rupture force (stiffness skin) and deformation values of the dragon fruit were determined (Figure 4). The experiments were carried out from three different points of the fruit using an 8 mm probe with three repetitions for each fruit (Figure 5).
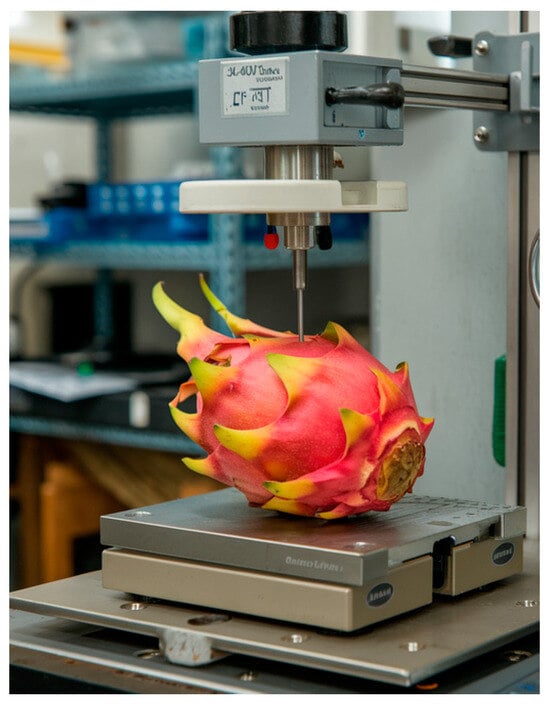
Figure 4.
Biological material testing device used to determine the mechanical properties of dragon fruit.
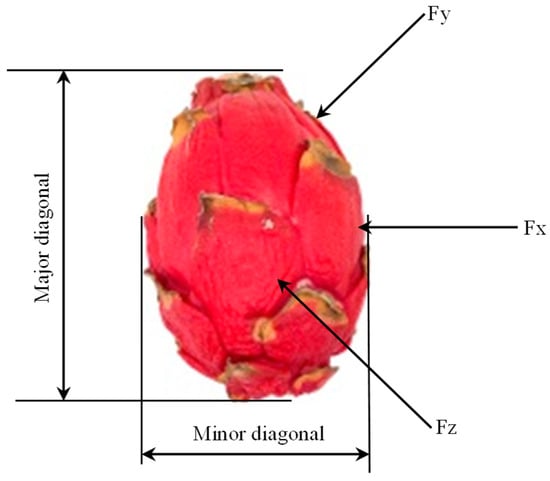
Figure 5.
Schematic drawing of orthogonal axes designated for dragon fruit compression tests showing the location of force applied.
Firmness (H, N mm−1) was calculated as follows by dividing the rupture force (F) by the deformation at rupture (ΔD) [33,34]:
The biochemical characteristics examined encompassed the total soluble solids (brix). Each dragon fruit was processed individually through blending to extract juice, which was subsequently filtered for the assessment of chemical attributes. The quantification of soluble solids was conducted utilizing a digital refractometer (PAL-α ATAGO, Tokyo, Japan) (Figure 4) [35].
2.1. Machine Learning
The aim of the conducted study is to perform the classification process via Machine Learning (ML) techniques using selected Color (L, a, b, c, h), physical (mass, sphericity, volume, area, perimeter, TSS, major and minor diagonal diameter) and mechanical properties (stiffness skin, deformation, and firmness) of dragon fruit. These properties were preferred because they are the factors that best represent the fruit for accurate and reliable classification and because these features can be obtained with objective and repeatable measurements. K-fold cross (k = 10) validation was used to ensure the robustness and generalization of the model.
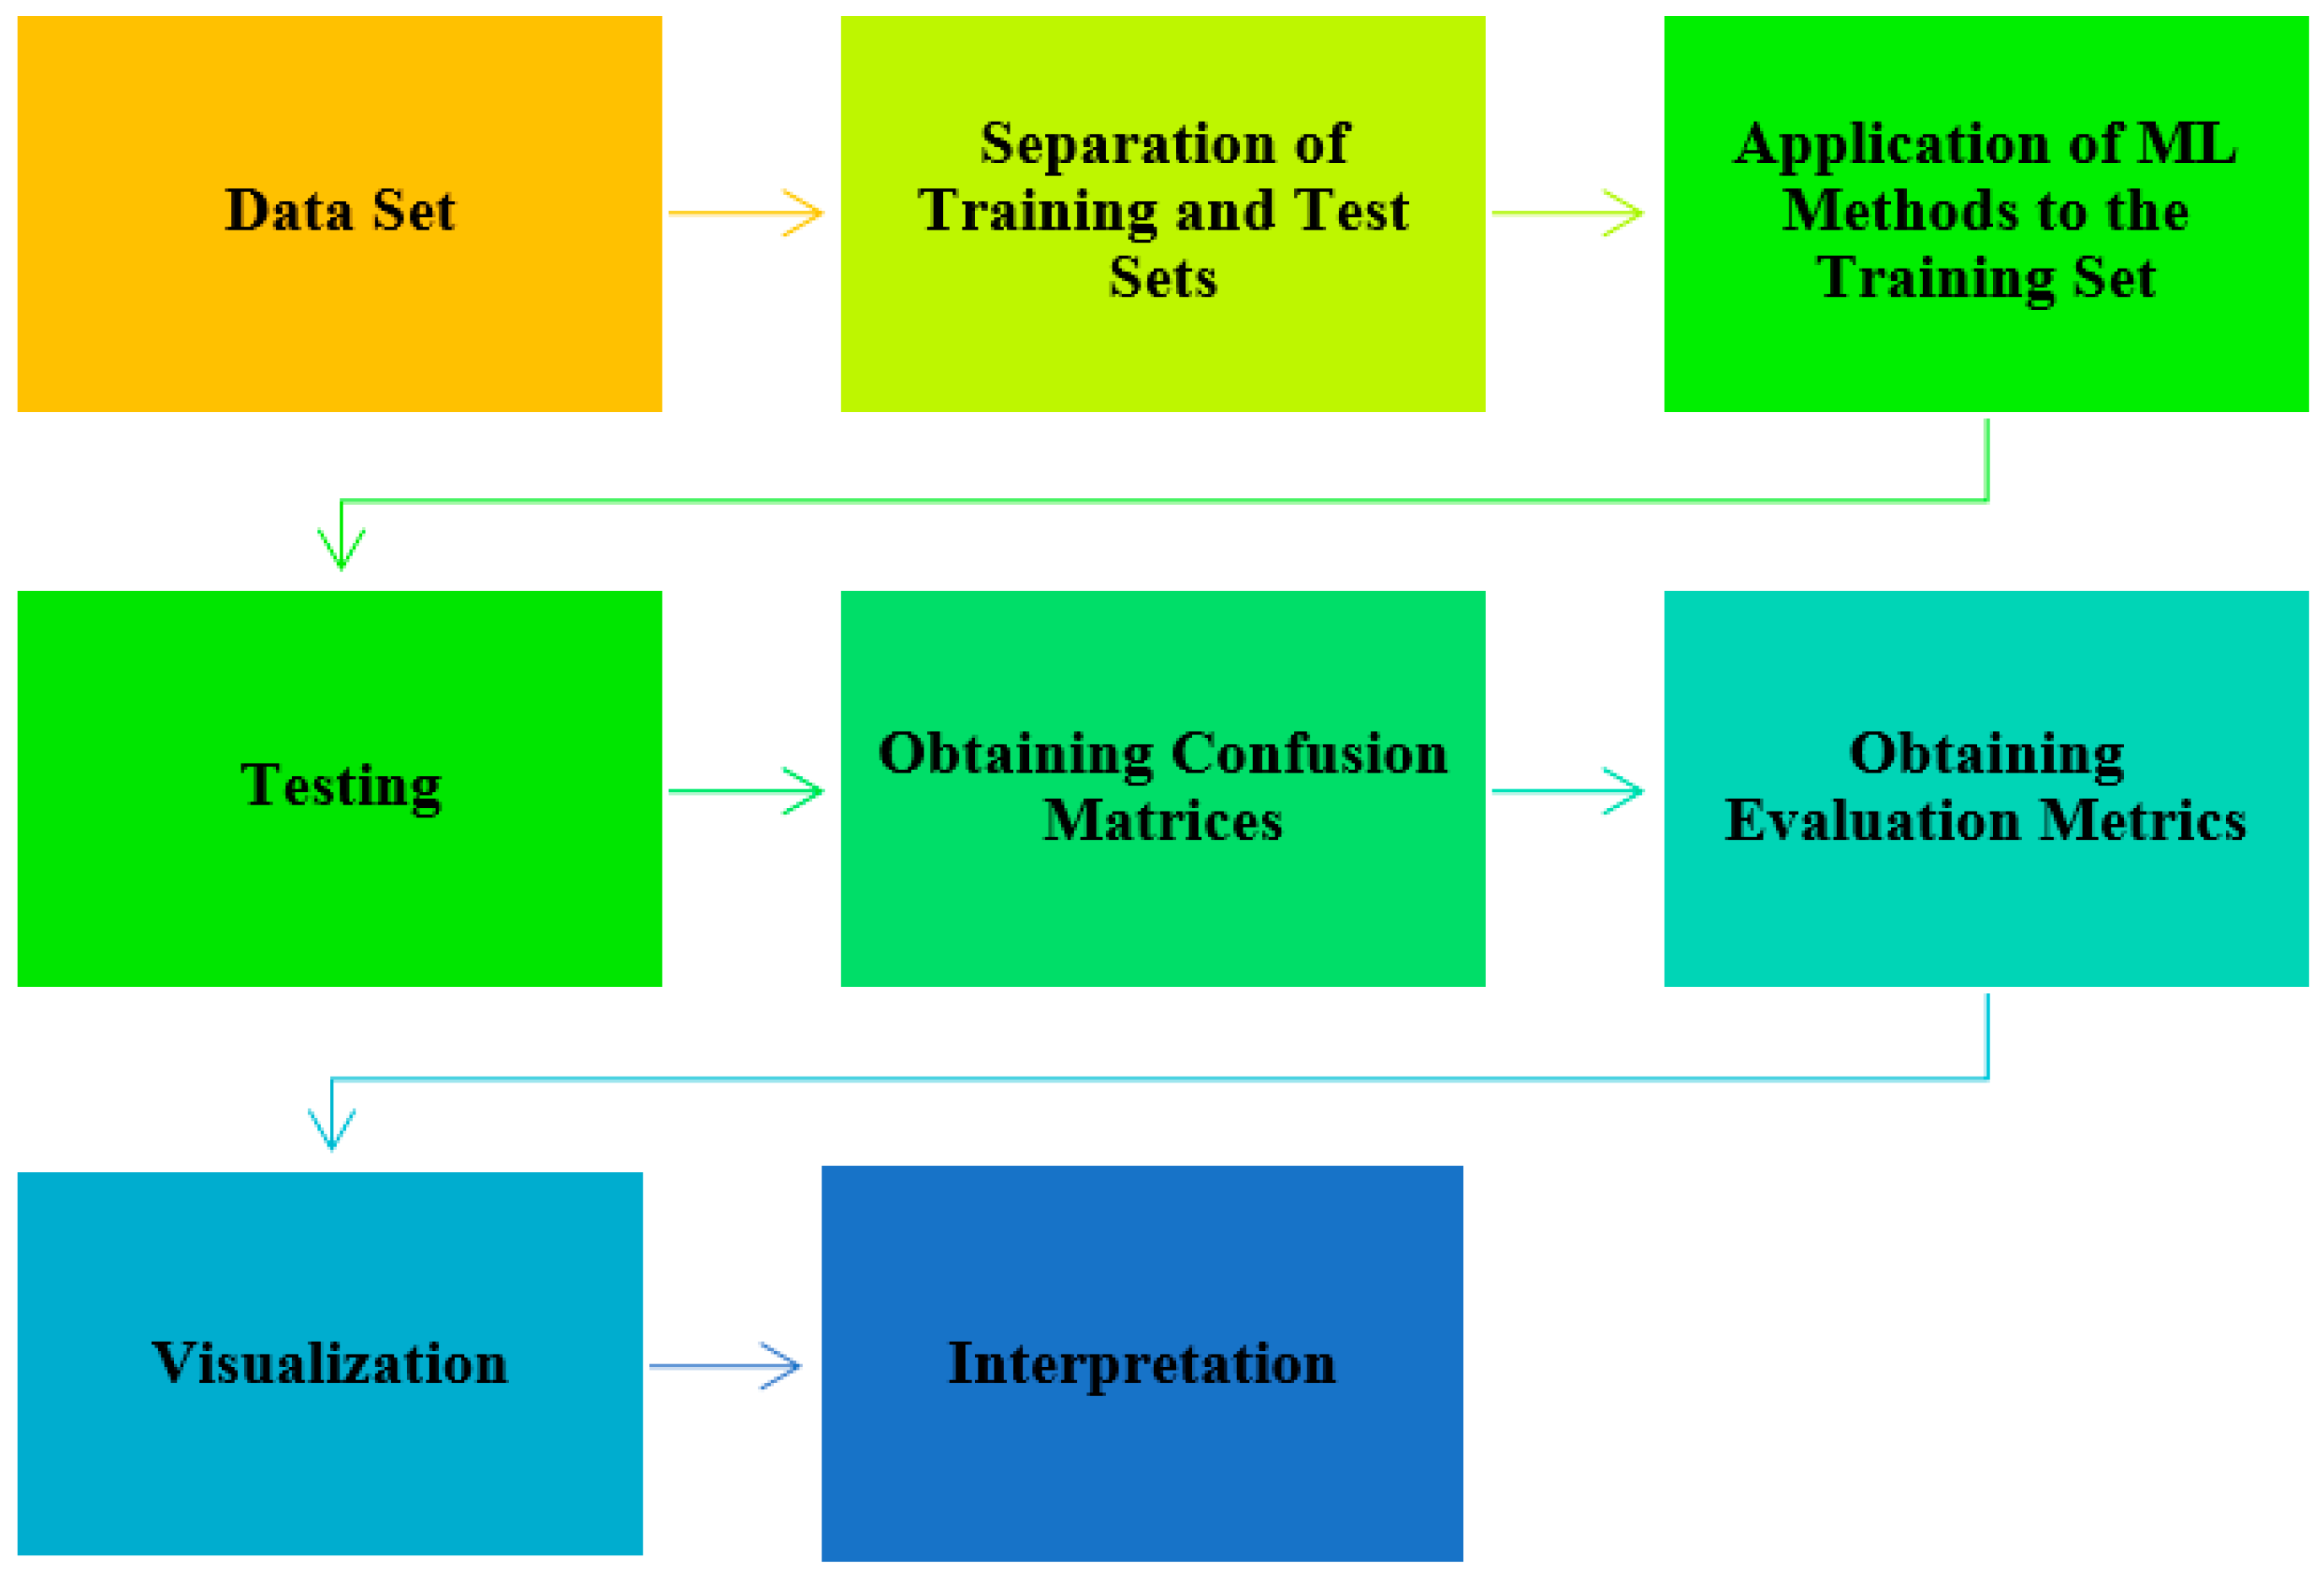
Machine learning (ML) involves computer algorithms designed to model data by leveraging the known characteristics of a dataset to make predictions. Extracting knowledge from data is an iterative and interactive process. The flowchart of the work carried out is as follows and can be seen Figure 6.
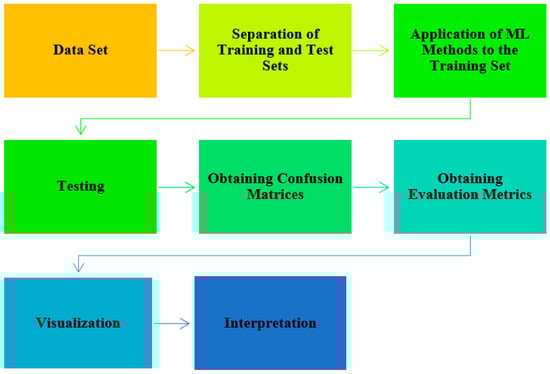
Figure 6.
Steps followed in the process of the discovery of knowledge from data.
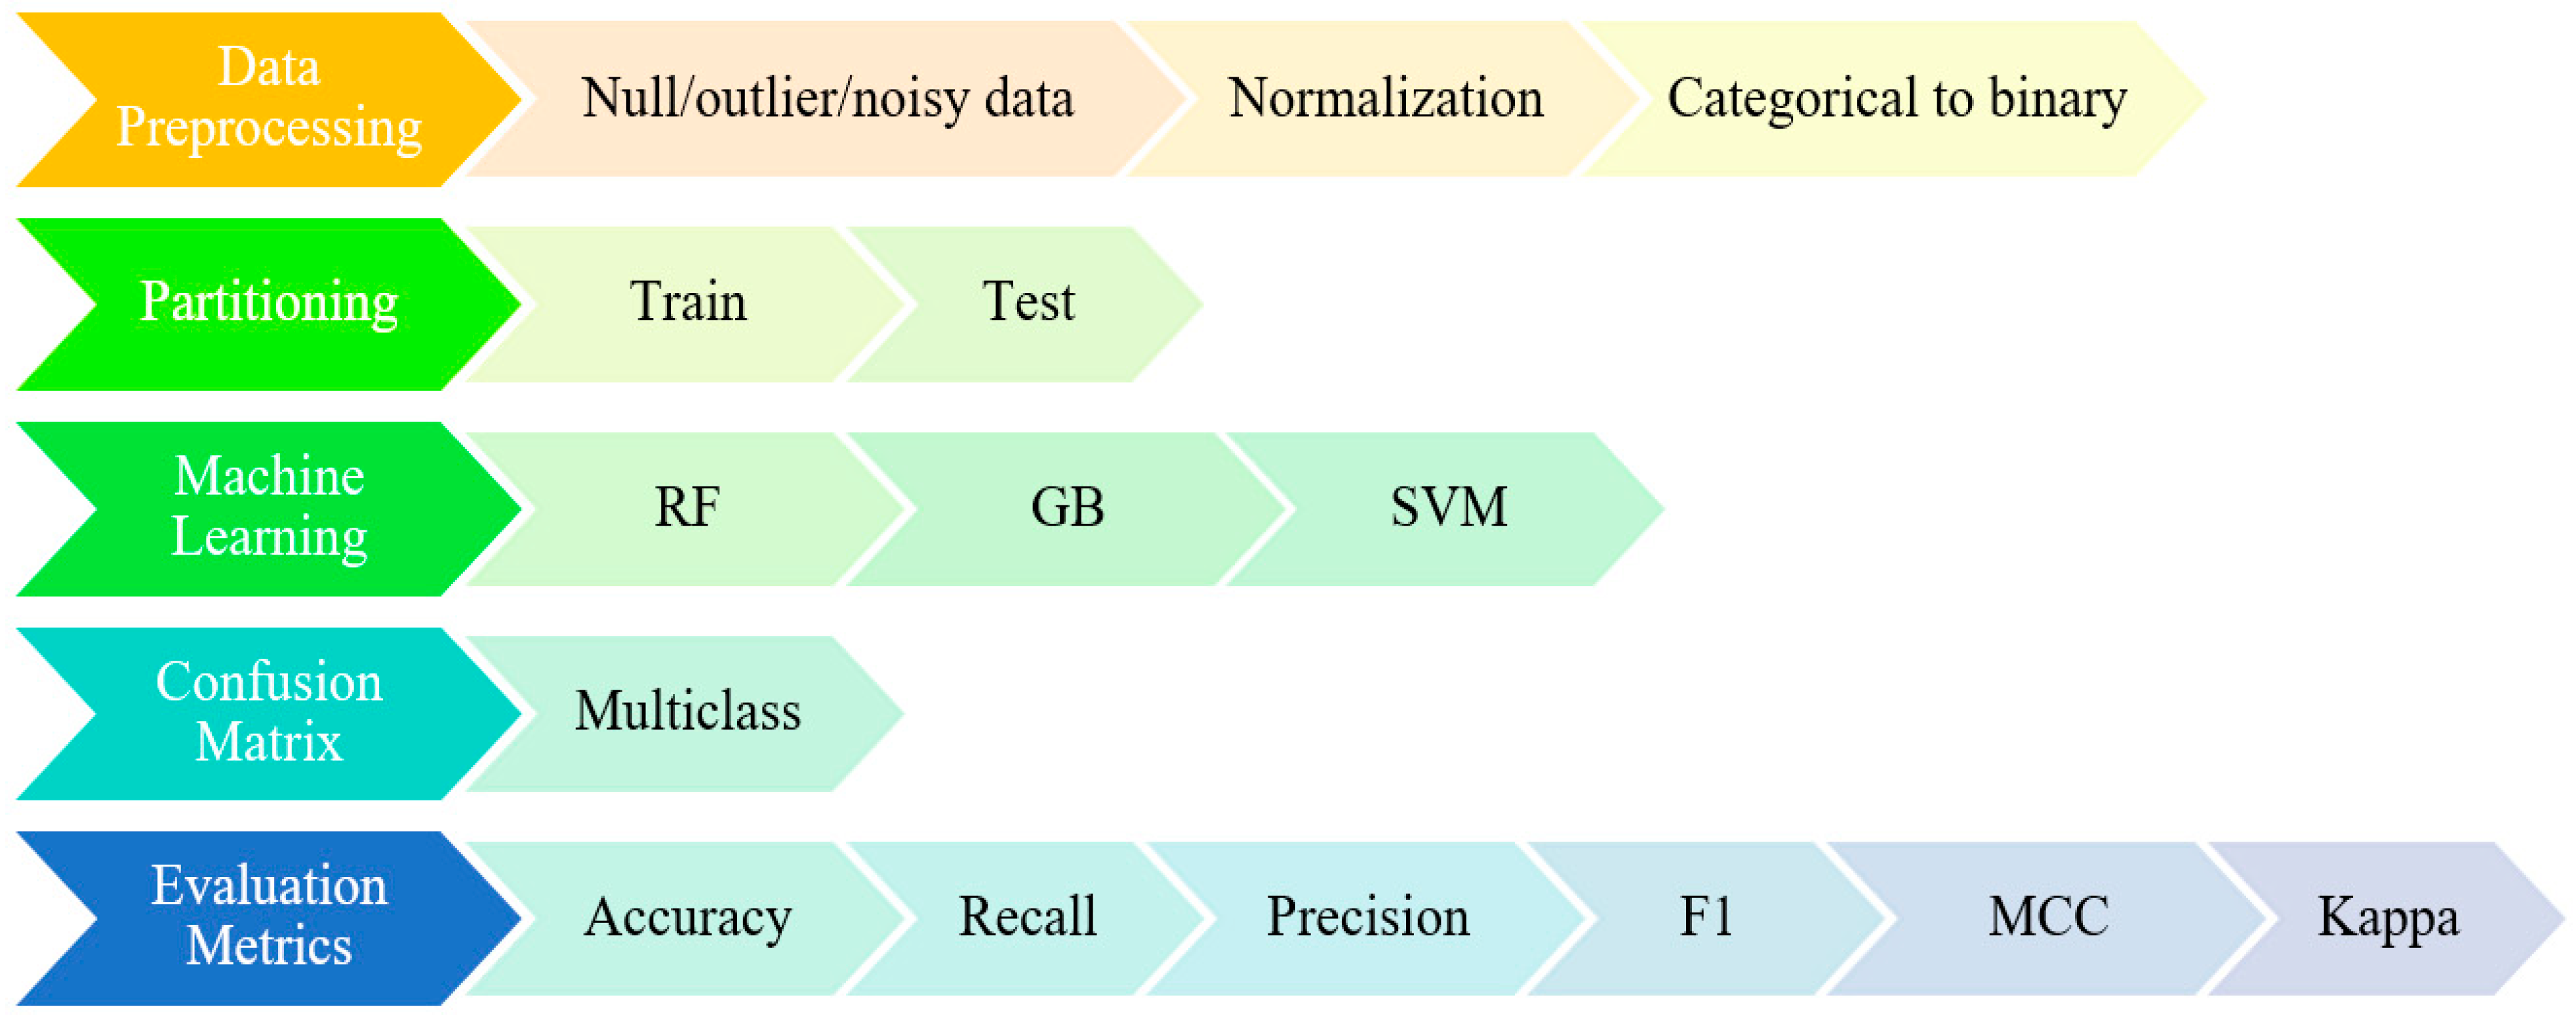
In the first step, the study begins with selecting the appropriate dataset according to the purpose of the problem. Then, the dataset is preprocessed. At this stage, the normalization and binary coding of categorical variables, if any, are also performed. The dataset is then divided into training and testing. The training dataset is balanced to make the model give better results. The next step is the modeling step and involves applying machine learning algorithms. The trained model is tested on the test dataset. The process ends with obtaining the confusion matrix, evaluation metrics, visualization, and interpretation stages. Details regarding the operations performed in the study while reaching knowledge from data are shown in Figure 7.
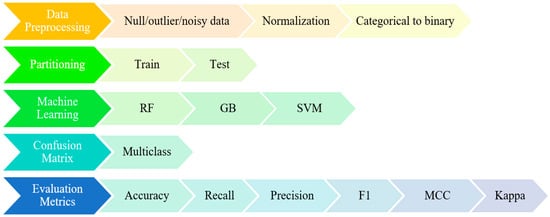
Figure 7.
Stages and details on the way from data to knowledge.
If the deep learning and ANN methods are preferred in solving classification problems, the number of observations should be large. For this reason, classical machine learning methods were used in the study, which are random forests, gradients, and support vector machines. The Random Forest (RF) method is an ensemble learning technique that combines multiple unpruned decision trees. This approach helps prevent overfitting, enhances accuracy, and ensures more stable predictions. By constructing each tree using random subsets of attributes, since small datasets are often sensitive to noise, utilizing multiple trees helps mitigate this issue. Similarly, the Support Vector Machine (SVM) method is prone to overfitting. The SVM method usually performs effectively on small but high sized dataset. Additionally, the kernel functions used in this method offer a significant advantage by capturing nonlinear relationships in small datasets. Gradient boosting (GB) is favored for its high accuracy, low error rate, and strong generalization, particularly in small datasets with complex relationships. Hyper parameter settings have been made for the models to work better. The parameters used in these transactions were obtained by trying to give the best results from a certain range, numbers, and criteria. Information about hyper parameters that give the best results is given in the method section separately.
The hardware features of the computer where the modeling is made; Intel i9 13900HX, RTX4070 GeForce, 32 GB DDR5 RAM.
2.1.1. Random Forests
RFs are actually a collection of Decision Trees randomly generated from a dataset [36]. An RF ensemble uses multiple, single, unpruned decision trees created by randomizing the split at each node of the decision tree. Any tree is likely to be less accurate than a tree created by strict splits. On the other hand, in RF, the aim is to increase accuracy by combining several approximate trees into an ensemble. This often works better than a single tree with precise divisions [37]. It can be defined as a versatile, intelligent machine learning method that can be used in both classification and regression problems. RF, which is an effective technique in terms of dimensional reduction, processing datasets with outliers or missing data [38], working with continuous and categorical data [39], fast processing on large datasets, and computationally, is an expert method that can be used in many problems [40]. When classifying using the Random Forest method, the result of each decision tree is looked at to determine the class of a variable. Once the results of all decision trees are received, the final decision of the forest is determined. The class with the most votes shows the result of the Random Forest model. The parameters used for the RF model that gives the best results are n_estimators = 200, criterion = ‘entropy’, max_depth = 9, min_samples_split = 2, and min_samples_leaf = 1.
2.1.2. Gradient Boosting
GB method is a technique that can be used in classification and regression problems, and it uses decision trees, just like the RF method. The aim of GB, developed by Frieadman (2001) [41], is to gradually transform weak estimators into stronger estimators through iterations in order to obtain a stronger estimator [42]. The main idea behind this algorithm is to create new base learners in such a way that they are maximally correlated with the negative gradient of an arbitrarily chosen loss function associated with the whole ensemble [43]. The GB model that gives the best results are loss = ‘log_loss’, learning_rate = 0.3, n_estimators = 200, subsample = 1.0, and criterion = ‘squared_error’.
2.1.3. Support Vector Classification
SVM is a machine learning method built on statistical learning theory [44,45]. The aim of SVM is to obtain the optimal separation hyperplane that will separate the classes from each other. In other words, it is to maximize the distance between support vectors belonging to different classes. Adopting the principle of structural risk minimization, SVM is divided into two parts: linear and nonlinear [46]. Linear Support Vector Machines are a variant of SVM that applies only to distinguishable linear data. In practice, very few datasets can be separated linearly. What makes SVM so remarkable and important is that the basic linear framework can be easily extended to the situation where the dataset is not linearly separable [47]. In cases where given classes cannot be linearly separated in the original input space, SVM first (nonlinearly) transforms the original input space into a higher-dimensional feature space. This process is carried out using nonlinear kernel functions such as sigmoidal, polynomial, and RBF (radial basis function) [48]. The SVC model that gives the best results is as follows: C = 2.0, kernel = ‘poly’, degree = 5, and gamma = ‘scale’.
3. Results and Discussion
3.1. Statistical Analysis
The descriptive statistical analysis results of the data used in the study are shown in Table 1. The data for the study were compiled by The Department of Organic Farming, Manavgat Vocational School at the Akdeniz University. The target variable is Variety, which is a categorical variable that takes four different values. This variant takes the values Dark Star, Pepino Dulce, Vietnam White, and American Beauty and its frequencies are 57, 49, 65, and 53, respectively.

Table 1.
Descriptive statistics of the data.
The skewness and kurtosis in the data showing normal distribution are expected to be between −2 and +2. Accordingly, it can be said that all other variables except the variable L are normally distributed.
3.2. Evaluation Metrics
In classification analysis, the success of a classifier is determined by the accuracy metric. In addition, precision and recall metrics are also used to evaluate the success of the classifier [49,50]. MCC (Matthews correlation coefficient), Cohen’s Kappa (kappa), and F1 criteria are other metrics used to evaluate the performance of models in datasets [51].
In this study, multiple classifications were made according to the mechanical properties of dragon fruit. In the evaluation of multi-class models, accuracy, weighted accuracy, precision (macro and weighted), recall (macro and weighted), Matthews correlation coefficient for multiclass classification, Cohen’s Kappa for multi-class cases, and F1-Score (macro and weighted) criteria were used [52]. In this study, a total of three models were established. The testing partition results for all models are shown in Table 2.
Table 2.
Metrics results for testing partition.
According to Table 1 and Table 2, when interpretations were made on the basis of machine learning methods and metric, the following conclusions were reached.
3.2.1. Based on Machine Learning Method
When compared to ML methods, the most successful results were obtained from the models established with RF, GB, and SVC methods, respectively. When all metrics are considered, the model established with the RF method is the most successful model.
3.2.2. Based on Evaluation Metrics
The accuracy metric is an important metric because it shows how successfully a classifier predicts the classification process. Due to its structure, this metric is calculated by dividing the number of correctly classified samples obtained because of the classification by the total number of samples. This makes it important because it shows the general classification ability and success of the model. According to the Accuracy metric, the performance of all models varies between approximately 97% and 99%. The RF model has the best accuracy value, and the success of this model is 98.66%.
Balanced Accuracy metric, another metric used in multi-class classification problems, is obtained by considering the frequency of each class. According to the Balanced Accuracy metric, the performance of all models varies between approximately 97% and 99%. The RF model has the best Weighted Accuracy value, and the success of this model is 98.91%.
The Recall Macro metric has the same formula as Balanced Accuracy, so they obtain the same values. The Recall Macro value is obtained by dividing the sum of the Recall values of each class by the number of classes. Since it does not take into account the frequency of the classes, it shows a balanced performance among the classes [53]. How much of the truth does the model predict correctly? Interpretations can be made on a class basis with the class-based Recall value. In other words, Recall measures the model’s ability to identify all instances of the relevant class. The Recall Macro value, which has a value between 0 and 1, is close to 1, indicating that the model performs well for all classes, and the true positive rate for each class is high, while the false negative rate is low. According to the Recall Macro metric, the performance of all models varies between approximately 0.97 and 0.99. The RF model has the best Recall Macro value, and this is 0.9891. Balanced Accuracy and Macro Recall in multiple classification problems have the same value.
The Weighted Recall value is a metric calculated by considering the frequency of each class. This metric has a value between 0 and 1, and values close to 1 indicate that the model performs well for all classes and that high-frequency classes are classified correctly. Since it is calculated based on class frequencies, classes with low frequencies do not affect the performance of the model. According to the Weighted Macro metric, the performance of all models varies between approximately 0.97 and 0.99. The RF model has the best Weighted Macro value, and this is 0.9866%. Accordingly, it can be said that the classes with high frequency have a high true positive rate.
The Precision Macro metric is calculated by taking the arithmetic average of the Precision values calculated separately for each class. It can be defined as the rate of correct prediction of the class predicted by the model or how much of what the model predicts is true. According to the Precision Macro metric, the performance of all models varies between approximately 0.96 and 0.98. The RF model has the best Precision Macro value, and this is 0.9823.
The Weighted Precision value is a metric calculated by considering the frequency of each class Precision value. Low-frequency classes do not strongly affect the overall performance of the model. According to the Weighted Precision metric, the performance of all models varies between approximately 0.98 and 0.99. According to these results, it can be said that all models predict the classes correctly (especially classes with large frequencies). The RF model has the best Weighted Macro value and this is 0.9897.
F1-Score Macro metric is obtained by the harmonic average of Macro Recall and Macro Precision values. Since class weights are given equal importance, the effect of high-frequency classes is the same as the effect of low-frequency classes. This metric has values in the [0, 1] range and values close to 1 indicate that the model has a good performance on all classes. According to the F1-Score Macro metric, the performance of all models varies between approximately 0.97 and 0.99. The RF model has the best F1-Score Macro value, and this is 0.9870.
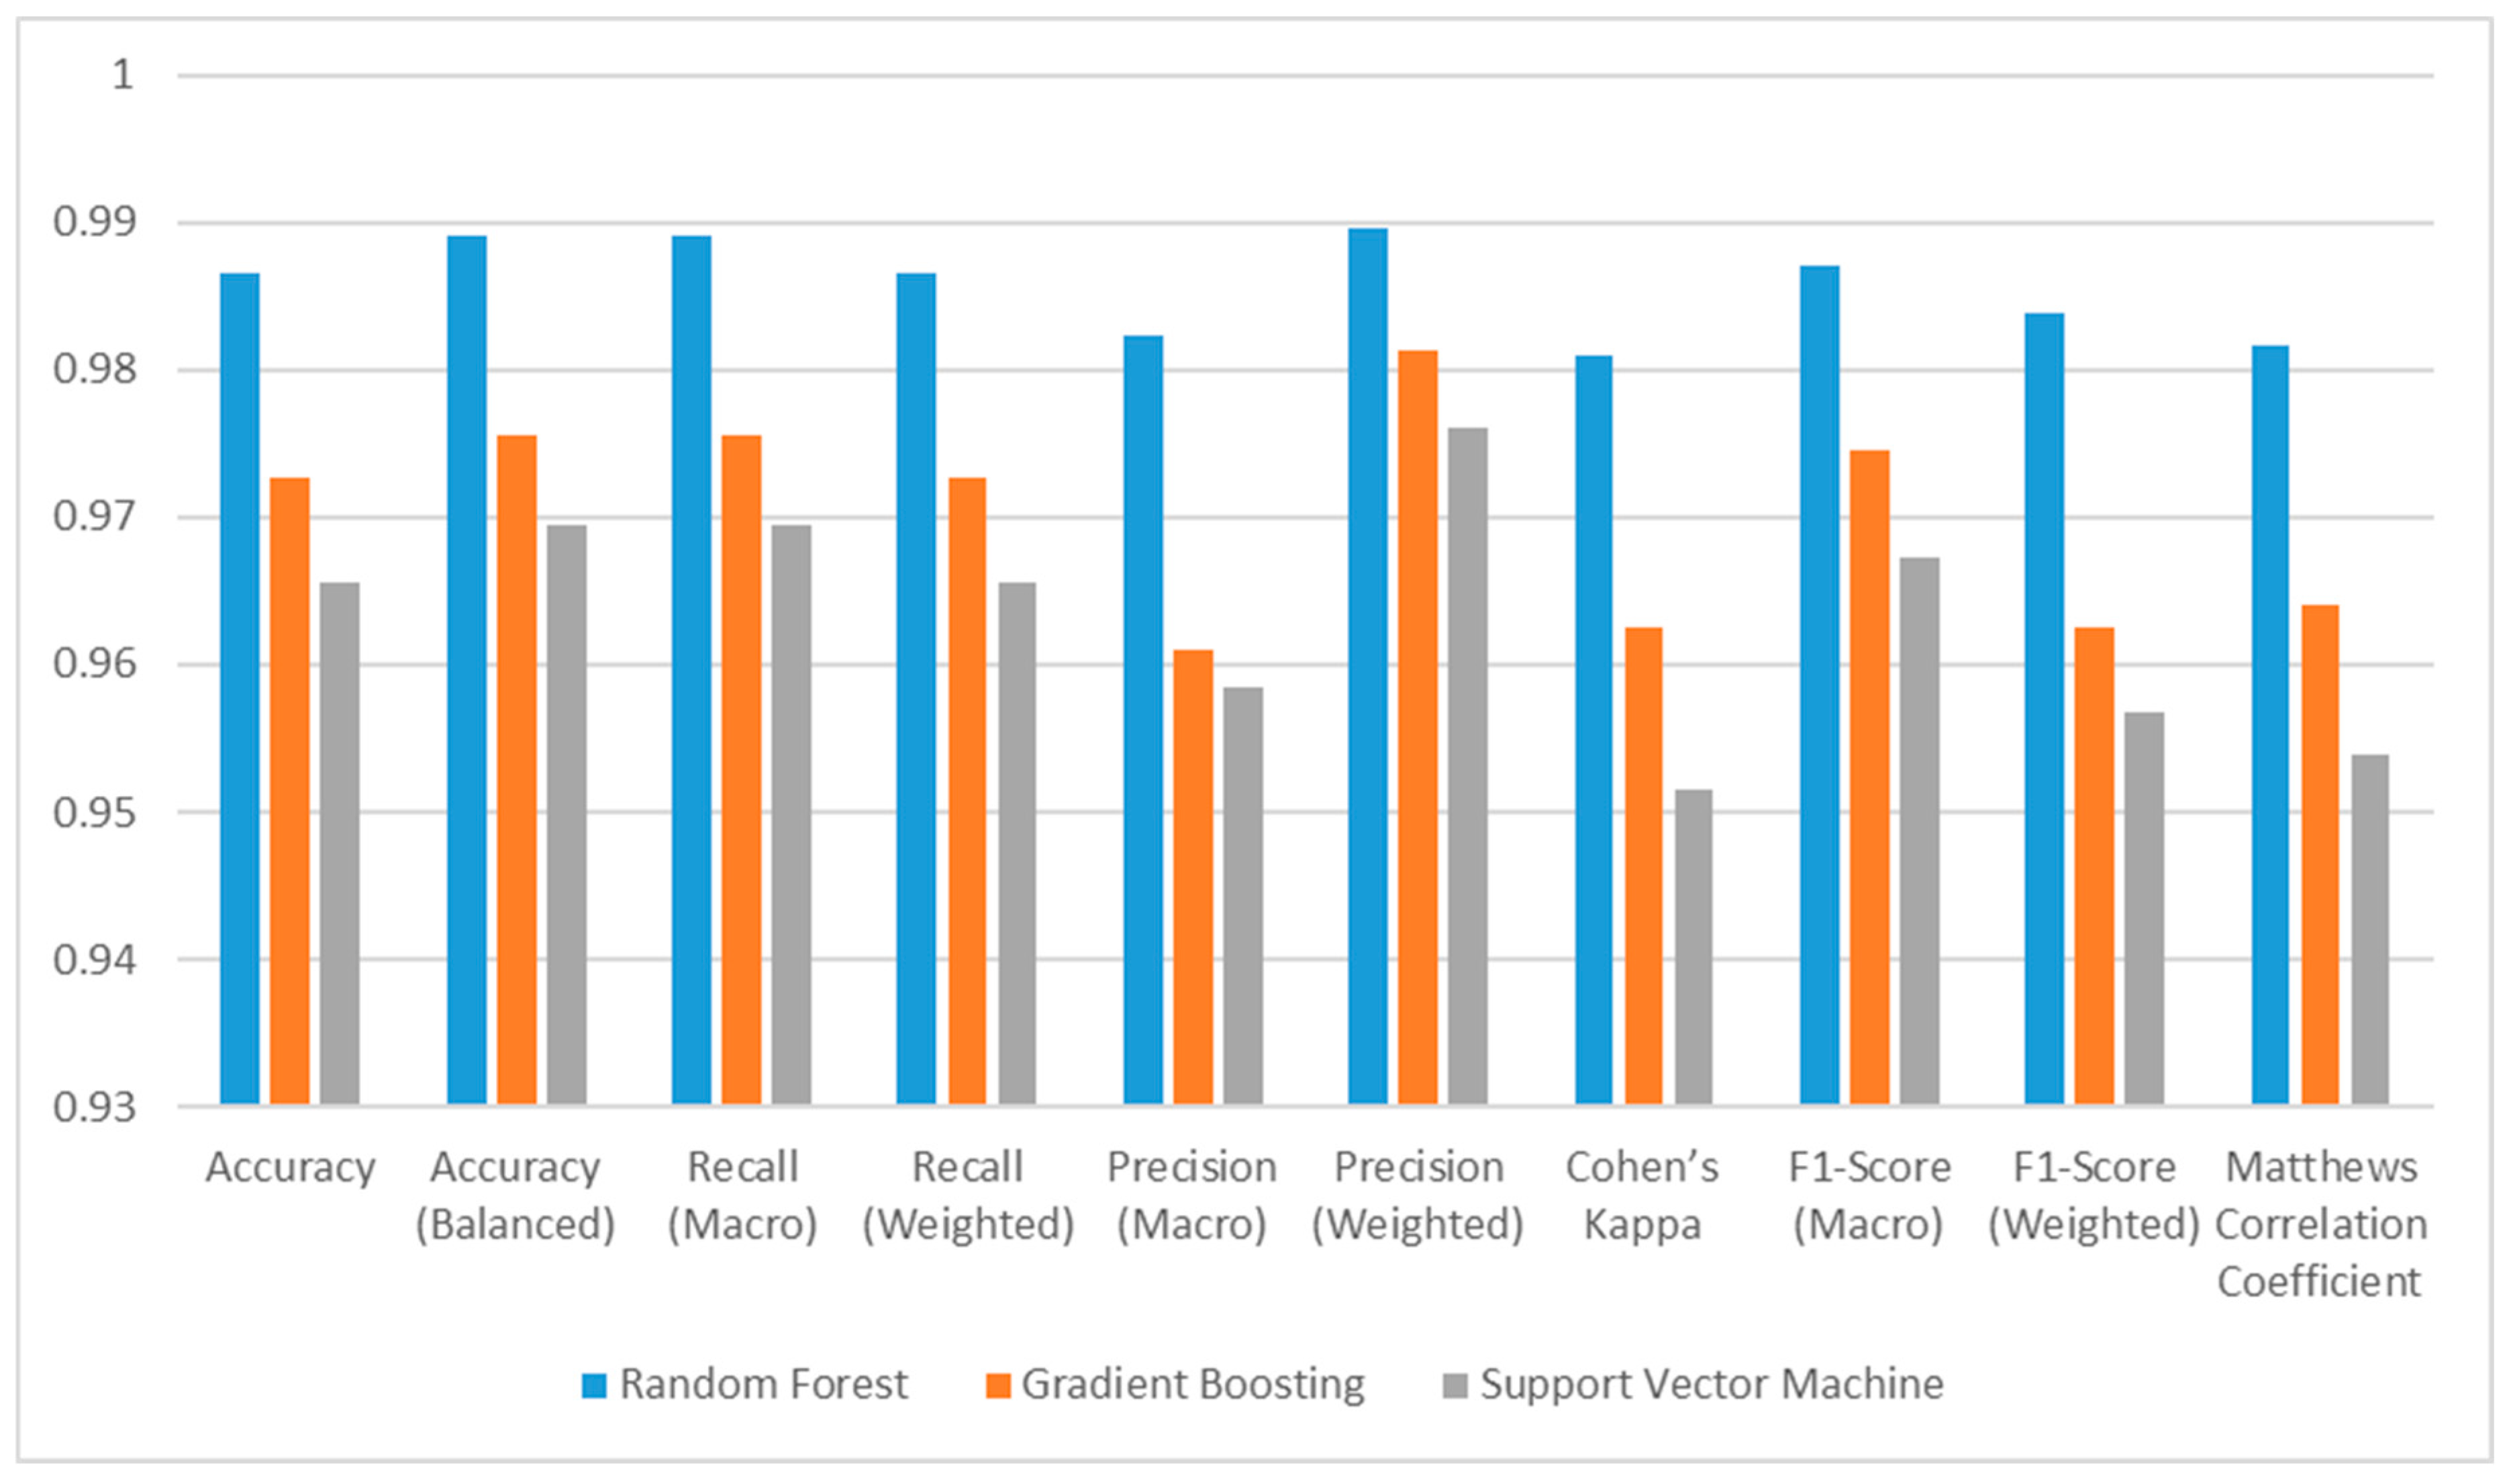
F1-Score Weighted metric is obtained by the harmonic average of Weighted Recall and Weighted Precision values. Since class weights are given equal importance, the effect of high-frequency classes is the same as the effect of low-frequency classes. This metric has values in the [0, 1] range and values close to 1 indicate that the model has a good performance on all classes. According to the F1-Score Weighted metric, the performance of all models varies between approximately 0.96 and 0.98. The RF model has the best F1-Score Weighted value, and this is 0.9839. Bar plots of the metric results are shown in Figure 8.
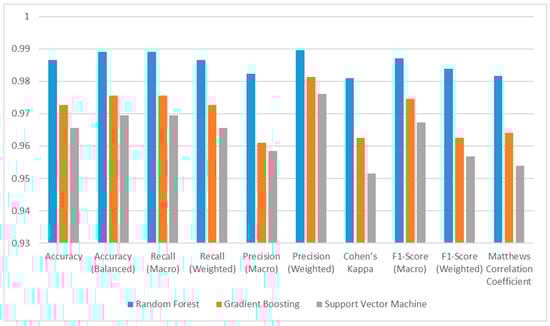
Figure 8.
Results of the Random Forest, Support Vector Machines, and Gradient Boosting models.
Matthews Correlation Coefficient, or MCC for short, is a powerful metric used to evaluate model performance. It takes a value in the range [−1, 1] and measures the accuracy and consistency of model predictions [54]. The fact that the MCC value is close to 1 indicates that the class predictions made by the model are consistent, that is, the model classifies correctly. According to the MCC metric, the performance of all models varies between approximately 0.95 and 0.98. The RF model has the best MCC value and this is 0.9817. Due to the mathematical structure of the MCC metric, the number of correctly classified elements has a great impact on the result of the metric. Therefore, a mistake in one of the classes will seriously reduce the result of the metric.
Cohen’s Kappa, or better known as Kappa, is a metric used to evaluate the success of the classifier in multiple classification problems [55]. The Kappa criterion takes a maximum value of 1 when the classification process is perfect. If it takes a value of 0, the model’s prediction is completely independent of the real classification, and if it takes a negative value, it indicates that there is no accordance between the model’s prediction and the real value [52]. Despite all this, there are also studies suggesting that the Kappa criterion exhibits abnormal performance in some cases and becomes inconsistent when compared to the MCC criterion, and therefore, the Kappa criterion should not be preferred when evaluating classification processes [56]. According to the Kappa metric, the performance of all models varies between approximately 0.95 and 0.98. The RF model has the best Kappa value and this is 0.9809.
As mentioned before, there are studies on the classification of fruits and vegetables using various features. Trieu and Thinh (2021) [9] achieved 98.5% accuracy in the classification of Dragon fruits with the CNN method, Bimantaka (2017) [28] achieved 96.67% accuracy, and Fitri et al. (2021) [12] achieved 87.4% accuracy with the Naive Bayes method. The success of the conducted study is approximately 99%. In multi-class classification problems, there are many metrics other than the Accuracy metric to evaluate the success of the established models. These metrics are Precision (Weighted, Macro), Recall (Weighted, Macro), F1 (Weighted, Macro), MCC, and Cohen’s Kappa. In the study whose details are explained in the materials and methods and the results sections, the model established with RF methods obtained the best results. Accuracy, Accuracy (Weighted), Precision (Weighted, Macro), Recall (Weighted, Macro), F1 (Weighted, Macro), MCC, and Cohen’s Kappa results are 0.9866, 0.9891, 0.9897, 0.9823, 0.9866, 0.9891, 0.9839, 0.9870, 0.9817, 0.9809, respectively. As a result, in short, all models have successfully predicted classes. The results obtained in all metrics show that the models are very successful.
To address the computational requirements and industrial integration of the proposed dragon fruit classification system, future implementations should consider hardware specifications, such as GPU-accelerated processors for real-time inference, and edge computing devices to minimize latency in packaging facilities. Studies by Zhang et al. and Ortiz et al. [18,32] demonstrated the viability of lightweight convolutional neural networks and robotic systems for real-time fruit quality assessment, which could be adapted for dragon fruit classification to balance accuracy and computational efficiency. Cost–benefit analyses, as highlighted in Kaur et al. [16], suggest that modular sensor arrays and scalable cloud-based solutions can reduce upfront infrastructure investments while maintaining high throughput. However, challenges such as sensor calibration for diverse environmental conditions and hybridized fruit varieties must be addressed to ensure robustness. Integrating the Random Forest model into existing sorting lines, as proposed by Trieu and Thinh [9], would require optimizing model inference speeds through quantization or pruning techniques. Future work should prioritize pilot deployments in commercial settings to evaluate operational costs, maintenance needs, and scalability, ensuring that the system aligns with industry standards for precision agriculture technologies.
The real-world applicability of this study has significant potential to improve quality control, classification, and logistics processes in the agricultural sector. Today, many fruits and vegetables are classified manually, which can be inefficient due to high labor costs and margin of error. Automated classification systems meet a great need in the industry, especially considering the increasing global trade volume and food safety requirements. The Random Forest model used in this study can be integrated into real-time classification systems with a high accuracy rate (98.66%) and can automate quality control in fruit packing facilities and minimize human error. Similar approaches can be applied to different agricultural products, such as apples, citrus fruits, and grapes, and similar AI-based solutions have been successfully used in the post-harvest sorting and classification of products [20,21]. In addition, such systems can contribute to sustainable agricultural practices, reduce waste, and provide more consistent product quality to the consumer. However, integrating genetic and biochemical analyses to overcome difficulties such as variability due to environmental factors and the classification of hybrid species will be an important area of development for future studies.
The performance of all models in the training dataset is the same and all classes are estimated with 100% accuracy. In the test dataset, all models are successful according to their metric results. The fact that the results of the training and test dataset are close to each other is a desired condition in ML models. This indicates that the established model is consistent and that there is no overlearning problem in the model.
Another important point is the hyper parameter settings applied in the methods. This arrangement process, which directly affects the model results, provides the ability to make better estimates and generalize the models. Many hyper parameter settings have been tried in the Random Forest, Gradient Boosting, and Support Vector Machine models established. The parameters that give the best results are given in the method section.
4. Conclusions
This study successfully demonstrated the feasibility of classifying dragon fruit varieties based on their color, physical, and mechanical properties using machine learning techniques. In the study, three separate models were used to classify four dragon fruit varieties: American Beauty, Dark Star, Vietnamese White, and Pepino Dulce. The dataset consisted of 224 records and the models were evaluated using multiple metrics such as accuracy, precision, recall, Matthews Correlation Coefficient (MCC), Cohen’s Kappa, and F1-score.
The results showed that the Random Forest model outperformed the other models in all evaluation metrics, achieving 98.66% accuracy, 98.97% weighted precision, and 98.66% weighted recall. The Gradient Boosting model also performed well, although it was slightly less accurate than RF, while the Support Vector Classification model was the least successful model among the three.
The study highlights the importance of automated classification systems in the agricultural sector, especially for fruits such as dragon fruit, which have many similar physical, color, and mechanical properties. This research provides a reliable and effective method for distinguishing between dragon fruit varieties, which is crucial for quality control, marketing, and export purposes, using machine learning. The findings also highlight the potential of machine learning to improve agricultural practices, ensure product quality, and support sustainable development in the dragon fruit industry.
The real-world applicability of this study has great potential for improving quality control, classification, and logistics processes in the agricultural sector. The accurate and rapid classification of agricultural products, especially those with different varieties such as dragon fruit, is critical for compliance with export standards, consumer satisfaction, and operational efficiency. The machine learning models used in the study can reduce labor costs and minimize error margins by offering higher accuracy rates compared to manual classification methods. The Random Forest model, with its 98.66% accuracy rate, shows that it is a solution that can be integrated into real-time classification systems. Such automatic classification systems are not limited to dragon fruit alone but can also be applied to separate other fruits such as apples, citrus, and grapes. In addition, integrating the system with biochemical and genetic analyses can further increase classification accuracy, providing significant gains in terms of sustainable agriculture and food security.
In the study, the photographs of the dragon fruit can be taken through the cameras in the mobile phone or transport band. By analyzing these data, manual distinction or automatic distinction machines can be developed.
Future research could explore the inclusion of additional features such as biochemical traits or genetic markers to further improve classification accuracy. This could include identifying key biochemical compounds that affect fruit quality and assessing their impact on predictive performance. Additionally, optimizing feature selection techniques and incorporating advanced machine learning algorithms such as deep learning or ensemble methods could improve the robustness and generalization of the model across different datasets. Another important aspect is scalability, where testing the model with larger datasets from various regions and harvest conditions could help assess its adaptability and consistency. Research on cost-effective and rapid data collection methods such as hyperspectral imaging or sensor-based approaches could also facilitate large-scale implementation. The practical application of these models in real-time sorting systems in packaging facilities should also be investigated. Integrating machine learning models with automated sorting and grading machines, evaluating real-time processing capabilities, and optimizing decision-making speed are important steps for smooth industrial adoption. Addressing hardware limitations and developing user-friendly interfaces for farmers and agribusinesses could further enhance the usability of the model. Overall, this study provides valuable insights into the application of machine learning in agricultural product classification. By improving model accuracy, ensuring scalability, and enabling industrial integration, future research can contribute to more advanced, automated, and efficient solutions for the agricultural sector. Overall, this study provides valuable insights into the application of machine learning in agricultural product classification, paving the way for more advanced and automated solutions in the industry.
Author Contributions
Conceptualization, A.K. and U.E.; methodology, A.K. and U.E.; software, U.E.; validation, O.K., G.M. and A.K.; formal analysis, A.K.; investigation, U.E.; resources, A.K.; data curation, A.K. and G.M.; writing—original draft preparation, A.K.; writing—review and editing, A.K., G.M., U.E. and O.K.; visualization, O.K.; funding acquisition, G.M. All authors have read and agreed to the published version of the manuscript.
Funding
The APC was funded by the National University of Science and Technology Politehnica Bucharest through the program PubArt.
Institutional Review Board Statement
Not applicable.
Informed Consent Statement
Not applicable.
Data Availability Statement
The raw data supporting the conclusions of this article will be made available by the authors on request.
Conflicts of Interest
The authors declare no conflicts of interest.
References
- Huang, M.; Zhao, J. Recent Advances in Postharvest Storage and Preservation Technology of Pitaya (Dragon Fruit). J. Hortic. Sci. Biotechnol. 2024, 99, 115–129. [Google Scholar] [CrossRef]
- Attar, Ş.H.; Gündeşli, M.A.; Urün, I.; Kafkas, S.; Kafkas, N.E.; Ercisli, S.; Ge, C.; Mlcek, J.; Adamkova, A. Nutritional Analysis of Red-Purple and White-Fleshed Pitaya (Hylocereus) Species. Molecules 2022, 27, 808. [Google Scholar] [CrossRef]
- Abirami, K.; Swain, S.; Baskaran, V.; Venkatesan, K.; Sakthivel, K.; Bommayasamy, N. Distinguishing Three Dragon Fruit (Hylocereus spp.) Species Grown in Andaman and Nicobar Islands of India Using Morphological, Biochemical and Molecular Traits. Sci. Rep. 2021, 11, 2894. [Google Scholar] [CrossRef] [PubMed]
- Trindade, A.R.; Paiva, P.; Lacerda, V.; Marques, N.; Neto, L.; Duarte, A. Pitaya as a New Alternative Crop for Iberian Peninsula: Biology and Edaphoclimatic Requirements. Plants 2023, 12, 3212. [Google Scholar] [CrossRef] [PubMed]
- Trivellini, A.; Lucchesini, M.; Ferrante, A.; Massa, D.; Orlando, M.; Incrocci, L.; Mensuali-Sodi, A. Pitaya, an Attractive Alternative Crop for Mediterranean Region. Agronomy 2020, 10, 1065. [Google Scholar] [CrossRef]
- Becerra, J.A.; Lacerda, V.R. Cultivo Da Pitaia Na Espanha, Importância Da Pitaia Orgânica e Futuro Da Comercialização Da Pitaia No Mundo. In I Circuito Internacional de Pitaia: Tendências e Projeções Latino-Americanas Para a Cultura da Pitaia; Lacerda, V.R., Almeida, S., Eds.; FEPAF: Botucatu, Brazil, 2022; pp. 33–35. [Google Scholar]
- Castillo Martínez, M.; Muñoz, L.; Guzmán, M. Caracterización Morfológica y Compatibilidad Sexual de Cinco Genotipos de Pitahaya (Hylocereus undatus). Agrociencia 2005, 39, 183–194. [Google Scholar]
- Tel-Zur, N.; Mizrahi, Y.; Cisneros, A.; Mouyal, J.; Schneider, B.; Doyle, J.J. Phenotypic and Genomic Characterization of Vine Cactus Collection (Cactaceae). Genet. Resour. Crop. Evol. 2011, 58, 1075–1085. [Google Scholar] [CrossRef]
- Minh Trieu, N.; Truong Thinh, N.; Editors, A.; Biancolillo, A.; Graña, M. Quality Classification of Dragon Fruits Based on External Performance Using a Convolutional Neural Network. Appl. Sci. 2021, 11, 10558. [Google Scholar] [CrossRef]
- Tran, D.-H.; Yen, C.-R. Morphological Characteristics and Pollination Requirement in Red Pitaya (Hylocereus spp.). Int. J. Agric. Biosyst. Eng. 2014, 8, 268–272. [Google Scholar] [CrossRef]
- Yusamran, N.; Hiransakolwong, N. DIP-CBML: A New Classification of Thai Dragon Fruit Species from Images. IJACSA Int. J. Adv. Comput. Sci. Appl. 2023, 14. [Google Scholar] [CrossRef]
- Fitri, Z.E.; Baskara, A.; Silvia, M.; Madjid, A.; Imron, A.M.N. Application of Backpropagation Method for Quality Sorting Classification System on White Dragon Fruit (Hylocereus Undatus). IOP Conf. Ser. Earth Environ. Sci. 2021, 672, 012085. [Google Scholar] [CrossRef]
- Trieu, N.M.; Thinh, N.T. Development of Grading System Based on Machine Learning for Dragon Fruit. In Proceedings of the AUN/SEED-Net Joint Regional Conference in Transportation, Energy, and Mechanical Manufacturing Engineering, Hanoi, Vietnam, 10–12 December 2021; Lecture Notes in Mechanical Engineering. Springer: Singapore, 2022; pp. 230–243. [Google Scholar] [CrossRef]
- Shaikh, H.; Wagh, Y.; Shinde, S.; Patil, S.M. Classification of Affected Fruits Using Machine Learning. Int. J. Eng. Res. Technol. 2021, 9, 519–524. [Google Scholar]
- Thanusri, R.; Vaishnavi, D.; Aranganathan, A. Detection of Quality Monitoring Using Deep Learning for Dragon Fruits. Int. Res. J. Mod. Eng. Technol. Sci. 2023, 5, 2384–2391. [Google Scholar]
- Kaur, A.; Kukreja, V.; Tiwari, P.; Manwal, M.; Sharma, R. Fruitful Fusion: An Accuracy-Boosting Ensemble of VGG19 and Convolutional Neural Networks for Dragon Fruit Classification. In Proceedings of the International Conference on Interdisciplinary Approaches in Technology and Management for Social Innovation, Gwalior, India, 14–16 March 2024; IEEE: Gwalior, India, 2024; pp. 1–5. [Google Scholar]
- Jinpeng, W.; Kai, G.; Hongzhe, J.; Hongping, Z. Method for Detecting Dragon Fruit Based on Improved Lightweight Convolutional Neural Network. Trans. Chin. Soc. Agric. Eng. 2020, 36, 218. [Google Scholar]
- Zhang, W.; Chen, K.; Zheng, C.; Liu, Y.; Guo, W. EasyDAM_V2: Efficient Data Labeling Method for Multishape, Cross-Species Fruit Detection. Plant Phenomics 2022, 2022, 9761674. [Google Scholar] [CrossRef] [PubMed]
- Khojastehnazhand, M.; Omid, M.; Tabatabaeefar, A. Development of a Lemon Sorting System Based on Color and Size. Afr. J. Plant Sci. 2010, 4, 122–127. [Google Scholar]
- Nandi, C.S.; Tudu, B.; Koley, C. Machine Vision Based Techniques for Automatic Mango Fruit Sorting and Grading Based on Maturity Level and Size. Smart Sens. Meas. Instrum. 2014, 8, 27–46. [Google Scholar] [CrossRef]
- Risdin, F.; Kumar Mondal, P.; Mahmudul Hassan, K. Convolutional Neural Networks (CNN) for Detecting Fruit Information Using Machine Learning Techniques. IOSR J. Comput. Eng. 2020, 22, 1–13. [Google Scholar] [CrossRef]
- Kumari Behera, S.; Kumar Rath, A.; Kumar Sethy, P. Fruit Recognition Using Support Vector Machine Based on Deep Features. Karbala Int. J. Mod. Sci. 2020, 6, 16. [Google Scholar] [CrossRef]
- Tho, T.P.; Thinh, N.T.; Bich, N.H. Design and Development of the Vision Sorting System. In Proceedings of the 3rd International Conference on Green Technology and Sustainable Development (GTSD), Kaohsiung, Taiwan, 24–25 November 2016; pp. 217–223. [Google Scholar] [CrossRef]
- Istiadi, A.; Sulistiyanti, S.R.; Herlinawati; Fitriawan, H. Model Design of Tomato Sorting Machine Based on Artificial Neural Network Method Using Node MCU Version 1.0. J. Phys. Conf. Ser. 2019, 1376, 012026. [Google Scholar] [CrossRef]
- Vijayakumar, T.; Vinothkanna, M.R. Mellowness Detection of Dragon Fruit Using Deep Learning Strategy. Artic. J. Innov. Image Process. 2020, 2, 35–43. [Google Scholar] [CrossRef]
- Hakim, L.; Kristanto, S.P.; Yusuf, D.; Shodiq, M.N.; Setiawan, W.A. Disease Detection of Dragon Fruit Stem Based on The Combined Features of Color and Texture. INTENSIF 2021, 5, 161–175. [Google Scholar] [CrossRef]
- Wulanningrum, R.; Vera, N.; Lelitavistara, W. Discrete Cosine Transform Untuk Identifikasi Citra Hylocereus Costaricensis. Simetris J. Tek. Mesin Elektro Ilmu Komput. 2015, 6, 353–360. [Google Scholar] [CrossRef]
- Bimantaka, R.D.M. Identifikasi Kematangan Buah Naga Merah Menggunakan Metode Backpropagation Berbasis Android; Universitas Teknologi Yogyakarta: Yogyakarta, Indonesia, 2017. [Google Scholar]
- Le Bellec, F.; Vaillant, F.; Imbert, E. Pitahaya (Hylocereus spp.): A new fruit crop, a market with a future. Fruits 2006, 61, 237–250. [Google Scholar] [CrossRef]
- Tel-Zur, N.; Abbo, S.; Bar-Zvi, D.; Mizrahi, Y. Genetic relationships among Hylocereus and Selenicereus vine cacti (Cactaceae): Evidence from hybridization and cytological studies. Ann. Bot. 2004, 94, 527–534. [Google Scholar] [CrossRef]
- Hoa, T.T.; Clark, C.J.; Waddell, B.C.; Woolf, A.B. Postharvest quality of dragon fruit (Hylocereus undatus) following disinfesting hot air treatments. Postharvest Biol. Technol. 2006, 41, 62–69. [Google Scholar] [CrossRef]
- Kabas, O.; Ozmerzi, A. Determining The Mechanical Properties of Cherry Tomato Varieties for Handling. J. Texture Stud. 2008, 39, 199–209. [Google Scholar] [CrossRef]
- Chandio, F.A.; Li, Y.; Ma, Z.; Ahmad, F.; Syed, T.N.; Shaikh, S.A.; Tunio, M.H. Influences of Moisture Content and Compressive Loading Speed on the Mechanical Properties of Maize Grain Orientations. Int. J. Agric. Biol. Eng. 2021, 14, 41–49. [Google Scholar] [CrossRef]
- Sirisomboon, P.; Kitchaiya, P.; Pholpho, T.; Mahuttanyavanitch, W. Physical and Mechanical Properties of Jatropha curcas L. Fruits, Nuts and Kernels. Biosyst. Eng. 2007, 97, 201–207. [Google Scholar] [CrossRef]
- Ortiz, C.; Blanes, C.; Gonzalez-Planells, P.; Rovira-Más, F. Non-Destructive Evaluation of White-Flesh Dragon Fruit Decay with a Robot. Horticulturae 2023, 9, 1286. [Google Scholar] [CrossRef]
- Ecer, O.; Yetgin, Z.; Çelik, T. Air Write Letter Recognition Using Random Forest Classification on Arduino Dataset. Int. J. Sci. Technol. Res. 2018, 4, 1–9. [Google Scholar]
- Rokach, L.; Maimon, O. Data Mining with Decision Trees Theory and Applications, 2nd ed.; World Scientific Publishing Co., Pte., Ltd.: Singapore, 2014. [Google Scholar]
- Sullivan, W. Machine Learning for Beginners Guide Algorithms; Healthy Pragmatic Solutions Inc.: Westlake Village, CA, USA, 2017; ISBN 2013206534. [Google Scholar]
- Akın, P.; Terzi, Y. Dengesiz Veri Setli Sağkalım Verilerinde Cox Regresyon ve Rastgele Orman Yöntemlerin Karşılaştırılması. Veri Bilim. 2020, 3, 21–25. [Google Scholar]
- Oshiro, T.M.; Perez, P.S.; Baranauskas, J.A. How Many Trees in a Random Forest? In Proceedings of the Machine Learning and Data Mining in Pattern Recognition, Berlin, Germany, 13–20 July 2012; Lecture Notes in Computer Science; Lecture Notes in Artificial Intelligence. Springer: Berlin/Heidelberg, Germany; Volume 7376, pp. 154–168. [Google Scholar] [CrossRef]
- Friedman, J. Greedy Function Approximation: A Gradient Boosting Machine Author. Ann. Stat. 2001, 29, 1189–1232. [Google Scholar] [CrossRef]
- Flores, V.; Keith, B. Gradient Boosted Trees Predictive Models for Surface Roughness in High-Speed Milling in the Steel and Aluminum Metalworking Industry. Complexity 2019, 2019, 1536716. [Google Scholar] [CrossRef]
- Natekin, A.; Knoll, A. Gradient Boosting Machines, a Tutorial. Front. Neurorobot. 2013, 7, 63623. [Google Scholar] [CrossRef]
- Cortes, C.; Vapnik, V.; Saitta, L. Support-Vector Networks. Mach. Learn. 1995, 20, 273–297. [Google Scholar] [CrossRef]
- Vapnik, V.N. An Overview of Statistical Learning Theory. IEEE Trans. Neural Netw. 1999, 10, 988–999. [Google Scholar] [CrossRef]
- Lu, W.; Wang, W.; Leung, A.Y.T.; Lo, S.M.; Yuen, R.K.K.; Xu, Z.; Fan, H. Air Pollutant Parameter Forecasting Using Support Vector Machines. Proc. Int. Jt. Conf. Neural Netw. 2002, 1, 630–635. [Google Scholar] [CrossRef]
- Hamel, L.H. Knowledge Discovery with Support Vector Machines; John Wiley & Sons: Hoboken, NJ, USA, 2009. [Google Scholar]
- Kecman, V. Support Vector Machines—An Introduction. In Support Vector Machines: Theory and Application; Wang, L., Ed.; Springer: Berlin/Heidelberg, Germany, 2005; pp. 1–47. [Google Scholar]
- Ding, Z. Diversified Ensemble Classifiers for Highly Imbalanced Data Learning and Their Application in Bioinformatics; Georgia State University: Atlanta, GA, USA, 2011. [Google Scholar]
- Chicco, D.; Jurman, G. The Advantages of the Matthews Correlation Coefficient (MCC) over F1 Score and Accuracy in Binary Classification Evaluation. BMC Genom. 2020, 21, 6. [Google Scholar] [CrossRef]
- Bekkar, M.; Kheliouane Djemaa, D.; Akrouf Alitouche, D. Evaluation Measures for Models Assessment over Imbalanced Data Sets. J. Inf. Eng. Appl. 2013, 3, 27–38. [Google Scholar]
- Grandini, M.; Bagli, E.; Visani, G. Metrics for Multi-Class Classification: An Overview. arXiv 2020, arXiv:2008.05756. [Google Scholar]
- Farhadpour, S.; Warner, T.A.; Maxwell, A.E. Selecting and Interpreting Multiclass Loss and Accuracy Assessment Metrics for Classifications with Class Imbalance: Guidance and Best Practices. Remote Sens. 2024, 16, 533. [Google Scholar] [CrossRef]
- Jurman, G.; Riccadonna, S.; Furlanello, C. A Comparison of MCC and CEN Error Measures in Multi-Class Prediction. PLoS ONE 2012, 7, e41882. [Google Scholar] [CrossRef] [PubMed]
- Tallón-Ballesteros, A.J.; Riquelme, J.C. Data Mining Methods Applied to a Digital Forensics Task for Supervised Machine Learning. Stud. Comput. Intell. 2014, 555, 413–428. [Google Scholar] [CrossRef]
- Delgado, R.; Tibau, X.A. Why Cohen’s Kappa Should Be Avoided as Performance Measure in Classification. PLoS ONE 2019, 14, e0222916. [Google Scholar] [CrossRef]


Disclaimer/Publisher’s Note: The statements, opinions and data contained in all publications are solely those of the individual author(s) and contributor(s) and not of MDPI and/or the editor(s). MDPI and/or the editor(s) disclaim responsibility for any injury to people or property resulting from any ideas, methods, instructions or products referred to in the content. |
© 2025 by the authors. Licensee MDPI, Basel, Switzerland. This article is an open access article distributed under the terms and conditions of the Creative Commons Attribution (CC BY) license (https://creativecommons.org/licenses/by/4.0/).