Abstract
Calculating carbon footprints can aid in clarifying the emission reduction responsibilities in various regions. Using an input–output model and the high-precision top-down carbon emission inventory provided by the China Carbon Monitoring, Verification, and Support System for Regional (CCMVS-R), carbon footprint size and transfer direction in China were estimated. From a production responsibility perspective, Shandong, Hebei, and Inner Mongolia presented the greatest carbon footprints, while the production and distribution of electric power and heat power constituted the sector with the highest carbon footprint. From a consumption responsibility perspective, Guangdong, Shandong, and Jiangsu displayed the highest carbon footprints, whereas the construction sector presented the greatest carbon footprint. From the perspective of shared responsibility, Shandong, Guangdong, and Jiangsu experienced the greatest pressure to reduce emissions, and carbon footprint reductions in the production and distribution of electric power and heat power sector are critical for mitigating climate warming. Carbon footprints were generally transferred from economically developed regions with limited natural resources to industrially developed regions with abundant natural resources, and from developed provinces to neighboring provinces. On the basis of these results, it would be helpful for the government to formulate reasonable emission reduction measures to achieve sustainable development.
1. Introduction
With the increasing attention given to climate warming, new concepts related to anthropogenic emissions, such as the carbon footprint, have increasingly appeared in various studies. Carbon footprint is often thought to have originated from the ecological footprint [1], but there remains controversy in academic circles regarding the concept of the carbon footprint. There are three main points of controversy: 1. Different studies have different definitions. Wiedmann and Minx [2] summarized the varying definitions among different organizations and studies. 2. Does carbon footprint only include CO2 emissions [3,4] or encompass all greenhouse gas emissions [5,6]? 3. What is its unit? Is the unit the same as that of the ecological footprint [7] or is it the same as that of carbon emissions, which are based on mass [5]? For calculation convenience, we adopted the definition proposed by Wiedmann and Minx [2]; namely, this refers to the total amount of CO2 emissions directly or indirectly generated via an activity or the cumulative CO2 emissions over the whole life cycle of the given goods. According to this definition, a carbon footprint only includes CO2 emissions, and mass is employed as the unit.
There are many different methods for calculating a carbon footprint, such as the IPCC calculation method [8], the carbon footprint calculator [9,10], the input–output (IO) method, and the life cycle assessment (LCA) method. Currently, the IO and LCA methods are the most popular. The IO method is a top-down method that was proposed by Wassily Leontief in 1936 [11]. This method estimates a carbon footprint by utilizing the economic flows and carbon emission coefficients between various regions and sectors, which has the advantages of saving time and reducing labor, as well as the ability to reduce the uncertainty caused by system boundary delineation [4,12,13,14,15]. However, this method also has certain limitations. First, the tabulation cycle of IO tables is relatively long, so use of this method is characterized by a certain lag. Second, application of the IO method is difficult at a microscopic level, and this method is more suitable for macroscopic accounting [2]. The LCA method [3,16,17,18] is a bottom-up method in which a carbon footprint is calculated by comprehensively assessing the energy consumption and greenhouse gas emissions of a product throughout its entire process, from cradle to grave [19]. This method is often used to calculate small-scale carbon footprints, with a detailed calculation process and high accuracy. However, calculations at the macroscopic scale are difficult [2], and the life cycle and boundaries cannot be readily defined [20].
Considering accuracy, calculation cost, and efficiency, the IO method is used in this study. In this method, a CO2 emission inventory is needed. In most previous studies, the bottom-up method has been employed to compile CO2 emission inventories [12,13,21,22,23]. Due to the uncertainty of statistical factors and the fact that only carbon emissions above a certain scale are considered, bottom-up inventories often underestimate anthropogenic carbon emissions, resulting in significant uncertainty in the spatial distribution [24,25]. In the 2019 Refinement to the 2006 IPCC Guidelines for National Greenhouse Gas Inventories [26], a comprehensive monitoring, verification, and support (MVS) approach based on top-down atmospheric inversion was proposed to validate bottom-up inventories. The China Carbon Monitoring, Verification, and Support System (CCMVS) was established on this basis and was the first top-down carbon source and sink monitoring and verification support system in China [25,27,28,29,30]. On the basis of the Weather Research and Forecasting-Greenhouse Gas (WRF-GHG) model, the CCMVS-R system was constructed via a four-dimensional variational proper orthogonal decomposition (POD-4DVar) algorithm, which can provide high-accuracy anthropogenic carbon emission data and natural carbon flux data [27]. The CCMVS-R system assimilated high-precision CO2 concentration observation data from 39 sites in China for the first time, greatly increasing the accuracy of anthropogenic carbon emission inversion. The use of this optimized anthropogenic carbon emission inventory for carbon footprint accounting can better reveal the real situation, so as to formulate more reasonable emission reduction measures and achieve sustainable development.
On the basis of an IO table for 31 provinces and 42 sectors in China, and CO2 emission data optimized by the CCMVS-R system, the distribution and transfer direction of carbon footprints were studied, and reasonable emission reduction measures were proposed according to the calculation results. In Section 1, we introduce the research background. In Section 2, we provide details on the calculation method, data sources, and processing steps. In Section 3, we calculate the carbon footprint size and transfer direction of each province and sector, analyze the results, and propose reasonable emission reduction measures. In the final section, we provide a summary of our work.
2. Methods and Data
2.1. Input–Output (IO) Model
In an IO model, the IO table reflects the interlinkages and balanced proportional relationships among various sectors during a certain period, and homogeneity and proportionality are often assumed [31]. The IO table is typically divided into monetary and physical IO tables [32]. The monetary IO table is measured in monetary units, whereas the physical IO table is measured in physical units [33]. The National Bureau of Statistics of China regularly releases monetary IO tables, and research on footprints via monetary IO tables is relatively mature. Therefore, the monetary IO table was used in our study. In this study, the environmentally extended multi-regional IO (EE-MRIO) model was used to calculate carbon footprints. To comprehensively explain this model, we first introduce the single-regional IO (SRIO) model and multi-regional IO (MRIO) model.
2.1.1. Single-Regional Input–Output (SRIO) Model
The SRIO model only accounts for the transactions between various sectors in a single region and is the earliest IO model [34]. Table 1 shows an SRIO table, where the rows indicate the process of product allocation and the columns represent the process of value formation. The SRIO table is divided into three quadrants. The first quadrant (green background) encompasses intermediate use and intermediate input. This quadrant is the core of the IO table, indicating how the various sectors are connected via intermediate inputs. In addition, CO2 emissions are generated in this process [35]. The second quadrant (blue background) is the final use, which reflects the distribution of the output in final use by the different sectors. The third quadrant (yellow background) denotes the initial input, indicating the composition of the initial input for each sector.

Table 1.
SRIO table (the green background denotes the first quadrant, the blue background denotes the second quadrant, and the yellow background denotes the third quadrant) [36].
In the IO table, there are horizontal and vertical balance relationships, and the horizontal balance relationship can be expressed as Equation (1) [36]:
where denotes the quantity of products produced by sector provided to sector for intermediate use, represents the final use of sector , and denotes the total output of sector .
Then, the variable , namely, the direct consumption coefficient, is introduced as follows:
By combining Equations (1) and (2), we can obtain
which can be represented in the matrix form of . Therefore, the SRIO model can be represented as
where is the total output vector, is the final use vector, and is the direct consumption coefficient matrix.
2.1.2. Multi-Regional Input–Output (MRIO) Model
The MRIO model considers the trade between different regions [37]. Therefore, it can reflect the transfer of products among different provinces and sectors. The MRIO table is similar to the SRIO table but with additional regional dimensions, as detailed in Table A1 in Appendix A.
Like the SRIO table, the MRIO table also exhibits balance relationships, which can be expressed as [36]
where denotes the quantity of products produced in sector of region that are provided to sector in region for intermediate use, denotes the final products provided by sector in region for region , and denotes the total output of sector in region . Similarly to the SRIO model, a direct consumption coefficient matrix is introduced in the MRIO model. The formula for the MRIO model is as follows:
where is the total output vector, is the final use vector, is the direct consumption coefficient matrix, and is the Leontief inverse matrix.
2.1.3. Environmentally Extended Multi-Regional Input–Output (EE-MRIO) Model
The EE-MRIO model accounts for environmental factors on the basis of the traditional MRIO model, which is convenient for evaluating the flow of environmental factors and provides notable support for policy formulation [38]. Compared with the SRIO model, this model considers carbon footprint transfer between regions, so we choose the EE-MRIO model in this research. Matthews et al. [39] added an environment-related vector to Equation (6) to estimate environmental emissions. Notably, is defined as the diagonal matrix of the direct carbon emission coefficient for each region, as expressed in Equation (7):
where is the diagonal matrix of the total output vector. is the diagonal matrix of the carbon emission intensity, which is determined on the basis of an anthropogenic emission inventory. Therefore, we can use Equation (8) to calculate the carbon footprint matrix :
where is the diagonal matrix of the final demand. According to Miller and Blair [36], the EE-MRIO model can be expressed via Equation (9):
where is the number of regions (), is a matrix with a size of ( is the number of sectors, which is 42 in this study), and element denotes the carbon emissions produced by sector in region to meet the final demand of sector in region . Therefore, by employing Equation (9), the carbon footprint in each region and each sector can be obtained.
2.2. Calculation of the Carbon Footprint
China is striving to achieve a carbon peak before 2030 and carbon neutrality before 2060 [27]. Achieving these dual carbon goals requires the joint efforts of all provinces, so it is necessary to clarify the emission reduction responsibilities of the 31 provinces. There are three common carbon emission sharing principles: production, consumption, and shared responsibility principles.
2.2.1. Calculation of the Carbon Footprint from a Production Responsibility Perspective
International trade separates the regions where products are consumed from the regions where they are produced. According to the production responsibility principle, producers are responsible for the carbon emissions generated during production [40]. As in the water footprint calculation method of Serrano et al. [41], from a production responsibility perspective, a carbon footprint can be calculated as follows:
where is a column vector composed entirely of values of 1, and is a row vector with all elements also set to 1. is a matrix whose elements denote the carbon footprints produced by sector in region to meet the final demand of sector in region . This principle is adopted in the Kyoto Protocol, which requires a country to be responsible for the carbon emissions occurring within its jurisdiction [42,43]. The advantage of using the production responsibility principle when formulating emission reduction policies is that producers can effectively understand their carbon emission situation. For provinces and sectors, the carbon footprint on the production side can often be obtained from yearbooks, and emission reduction measures can be directly implemented by producers to control carbon emissions at the source. However, this method may lead to carbon leakage [44,45], which indicates that greenhouse gas reduction measures in target regions may cause an increase in greenhouse gas emissions in other regions. For example, to reduce emissions, developed countries may transfer high-carbon factories to other countries. To promote local economic development, developing countries may undertake many low-tech and high-emission industries and subsequently export products to developed countries. This part of emissions occurs in developing countries, whereas developed countries serve as consumers and beneficiaries. If emission reduction measures are formulated according to this principle, it is obviously unfair for developing countries and will reduce their enthusiasm to participate in emission reduction schemes [45].
2.2.2. Calculation of the Carbon Footprint from a Consumption Responsibility Perspective
In international negotiations, developing countries prefer the consumption responsibility principle. According to this principle, consumers are responsible for the carbon emissions generated during the production of the commodity they consume [40]. From this perspective, the carbon footprint can be calculated as follows:
where is a column vector composed entirely of values of 1, and is a row vector with all elements also set to 1. is a matrix whose elements denote the carbon footprints produced by sector in region to meet the final demand of sector in region . The consumption responsibility principle can be used to mitigate carbon leakage issues [46]. However, consumers often cannot directly determine their carbon emissions, and their responsibilities are therefore uncertain. The use of this method is also not conducive to a trade balance, because consumers must not only bear their carbon emission responsibility but also pay for imported products, whereas producers benefit from exporting products but do not necessarily bear a carbon emission responsibility. Therefore, developed countries with greater discourse power in international negotiations still have opinions on this principle.
In fact, the carbon footprint on the consumption side is a redistribution of that on the production side, which is achieved via trade between regions and sectors. Therefore,
where is the carbon footprint from a production responsibility perspective and is the carbon footprint from a consumption responsibility perspective. is a column vector composed entirely of values of 1, and is a row vector with all elements also set to 1. is a matrix whose elements denote the carbon footprints produced by sector in region to meet the final demand of sector in region . is a matrix whose elements denote the carbon footprints produced by sector in region to meet the final demand of sector in region . Equation (12) can also be used to calculate the total carbon footprint.
2.2.3. Calculation of the Carbon Footprint from a Shared Responsibility Perspective
The principle of simultaneously considering production and consumption responsibilities is referred to as the shared responsibility principle, which accounts for the interests of both economically developed and economically underdeveloped regions and requires these regions to simultaneously assume emission reduction responsibilities. Kondo et al. [47] established an allocation factor between consumption- and production-side carbon emissions, thereby combining these two principles:
where is the carbon footprint in region calculated via the shared responsibility model; and are the coefficients of the shared responsibility model; and . In this study, we used the proportionality factor for environmental responsibility proposed by Rodrigues et al. [48] and Rodrigues and Domingos [49], which is .
2.2.4. Calculation of Carbon Footprint Transfer
The production-side carbon footprint of region s in Equation (10) can be divided into two parts:
where is a matrix whose elements denote the carbon footprints produced by sector in region to meet the final demand of sector in region . One part is the carbon footprint generated by region s for the production of products needed in that region, namely, . The other part is the carbon footprint generated by region for the production of products needed in other regions, known as the carbon footprint transferred in, namely, [41]. Similarly, Equation (11) can also be divided into two parts:
where is a matrix whose elements denote the carbon footprints produced by sector in region to meet the final demand of sector in region . One part is the carbon footprint generated by the consumption of products produced in region , namely, . The other part is the carbon footprint generated by the consumption of products produced in other regions in region s, which is referred to as the carbon footprint transferred out, namely, .
Owing to significant differences in local conditions, such as resource storages, industrial level, economic development, and consumption among different provinces, in a certain region, the carbon footprint on the production side is generally not equal to that on the consumption side [23]. The difference in the carbon footprints under these two principles in a given province can be expressed as the net carbon footprint transfer [50]:
According to Equations (14) and (15), the net carbon footprint transfer is also equal to the difference between the carbon footprint transferred out and that transferred in:
If the net carbon footprint transfer is positive, this indicates that the province mainly serves as a consumer; that is, its carbon footprint is transferred to other provinces via trade. In contrast, if the net carbon footprint transfer is negative, this indicates that the province functions mainly as a producer; i.e., the province bears the carbon footprint transferred from other provinces via trade [51].
2.3. Data
2.3.1. IO Table
In this study, the MRIO table of 31 provinces and cities (excluding Taiwan, Hong Kong, and Macao) provided by Carbon Emission Accounts and Datasets (CEADs) was selected [52]. For convenience, we refer to these 31 provinces and cities as “provinces”. According to the classification of the National Bureau of Statistics, the IO table contains a total of 42 sectors (https://data.stats.gov.cn/ifnormal.htm?u=/files/html/quickSearch/trcc/trcc01.html&h=740, accessed on 12 March 2025), as detailed in Table A2 in Appendix A. Notably, when the IO table is used, if an import-competitive IO table is encountered, the intermediate and final use parts of the IO table should be processed according to the proportionality assumption, thereby removing the import part and rendering it as an import noncompetitive IO table before the subsequent calculations [53].
2.3.2. CO2 Emission Inventory
Considering the significant uncertainty and lack of independent validation in the bottom-up inventory method, for the first time, the CCMVS-R system was used to assimilate high-precision data from 39 sites in China via the top-down method, thus greatly increasing the accuracy of anthropogenic carbon emission inversion. High-precision ground-based observation data underwent strict screening, including identification of observation gases and standard gases, removal of abnormal values from observations and standard gases, linear correction, outputting results, screening, and fitting. The CCMVS-R system consists of CGHGNET, WRF-GHG, and POD-4DVar [25]. The CCMVS-G system uses abundant observational data to obtain low-uncertainty carbon flux inversion results, which can provide reasonable initial and boundary conditions for the CCMVS-R system [29]. Then, a cost function is constructed:
where is the background value, with an error covariance matrix ; represents the control variable; is the observed value, with error covariance matrix ; and refers to the observation operator. In the carbon assimilation model, the observation operator relates the observed CO2 concentration to the surface CO2 flux. The subscript represents the observation time of the CO2 concentration. In the cost function, is related to through the following equation:
where represents the forecasting model. represents the initial time, and represents time j. The posteriori anthropogenic carbon emissions are obtained by deriving the cost function (). The detailed inversion system was described by Guo et al. [27]. Zhong et al. [25] compared the emission inventory inverted via the CCMVS-R system with five bottom-up emission inventories (CHRED, GID, EDGAR, ODIAC, and GCP). The study revealed that the values in the inverted inventory were generally higher than those in the five inventories, and the total emissions were closer to those in the CHRED inventory, which considers more emission information and local emission situations in China. The top-down method can reduce the underestimation of anthropogenic carbon emissions in bottom-up inventories to a certain extent and can reduce the uncertainty of inventory estimation. The top-down inventory was also the data basis for the more accurate calculation of carbon footprints in this study. In the future, with the gradual improvement in CGHGNET, more station data will be added to the assimilation system, and the accuracy of inversion results will further increase. Considering the advantages of the inversion results and the considerable potential for improvement, a CO2 emission inventory inverted via the CCMVS-R system was adopted [25].
The spatial resolution of the inversion emission inventory is 45 km × 45 km. When using MRIO model to calculate a carbon footprint, the provincial emission inventory is required, not grid inventory. Therefore, we used the statistical values of the grid inventory inverted by CCMVS-R system in each province.
Because the inverted emission inventory only provides the total emissions in each province, without detailed information on the emissions from the above 42 sectors in each province, this inverted inventory was supplemented with the CO2 emission inventory of 31 provinces and 42 sectors in China provided by CEADs [54].
3. Results and Discussion
Using the MRIO table of 31 provinces and 42 sectors in China, as well as the CO2 emission inventory inverted by the CCMVS-R system, the total carbon footprint was calculated via Equation (12), totaling 12,032.69 Mt. Our result is close to the carbon emission estimate of approximately 11.4 Gt in China calculated in 2021 via the Global Carbon Project [55]. Next, we analyzed the three types of carbon footprints. Considering that the shared responsibility principle accounts for the interests and responsibilities of both producers and consumers, we provide appropriate emission reduction suggestions on the basis of this principle. Finally, we examined the transfer of the carbon footprint between provinces and sectors.
3.1. Size of the Carbon Footprint
3.1.1. Carbon Footprint from a Production Responsibility Perspective
Regional Carbon Footprint
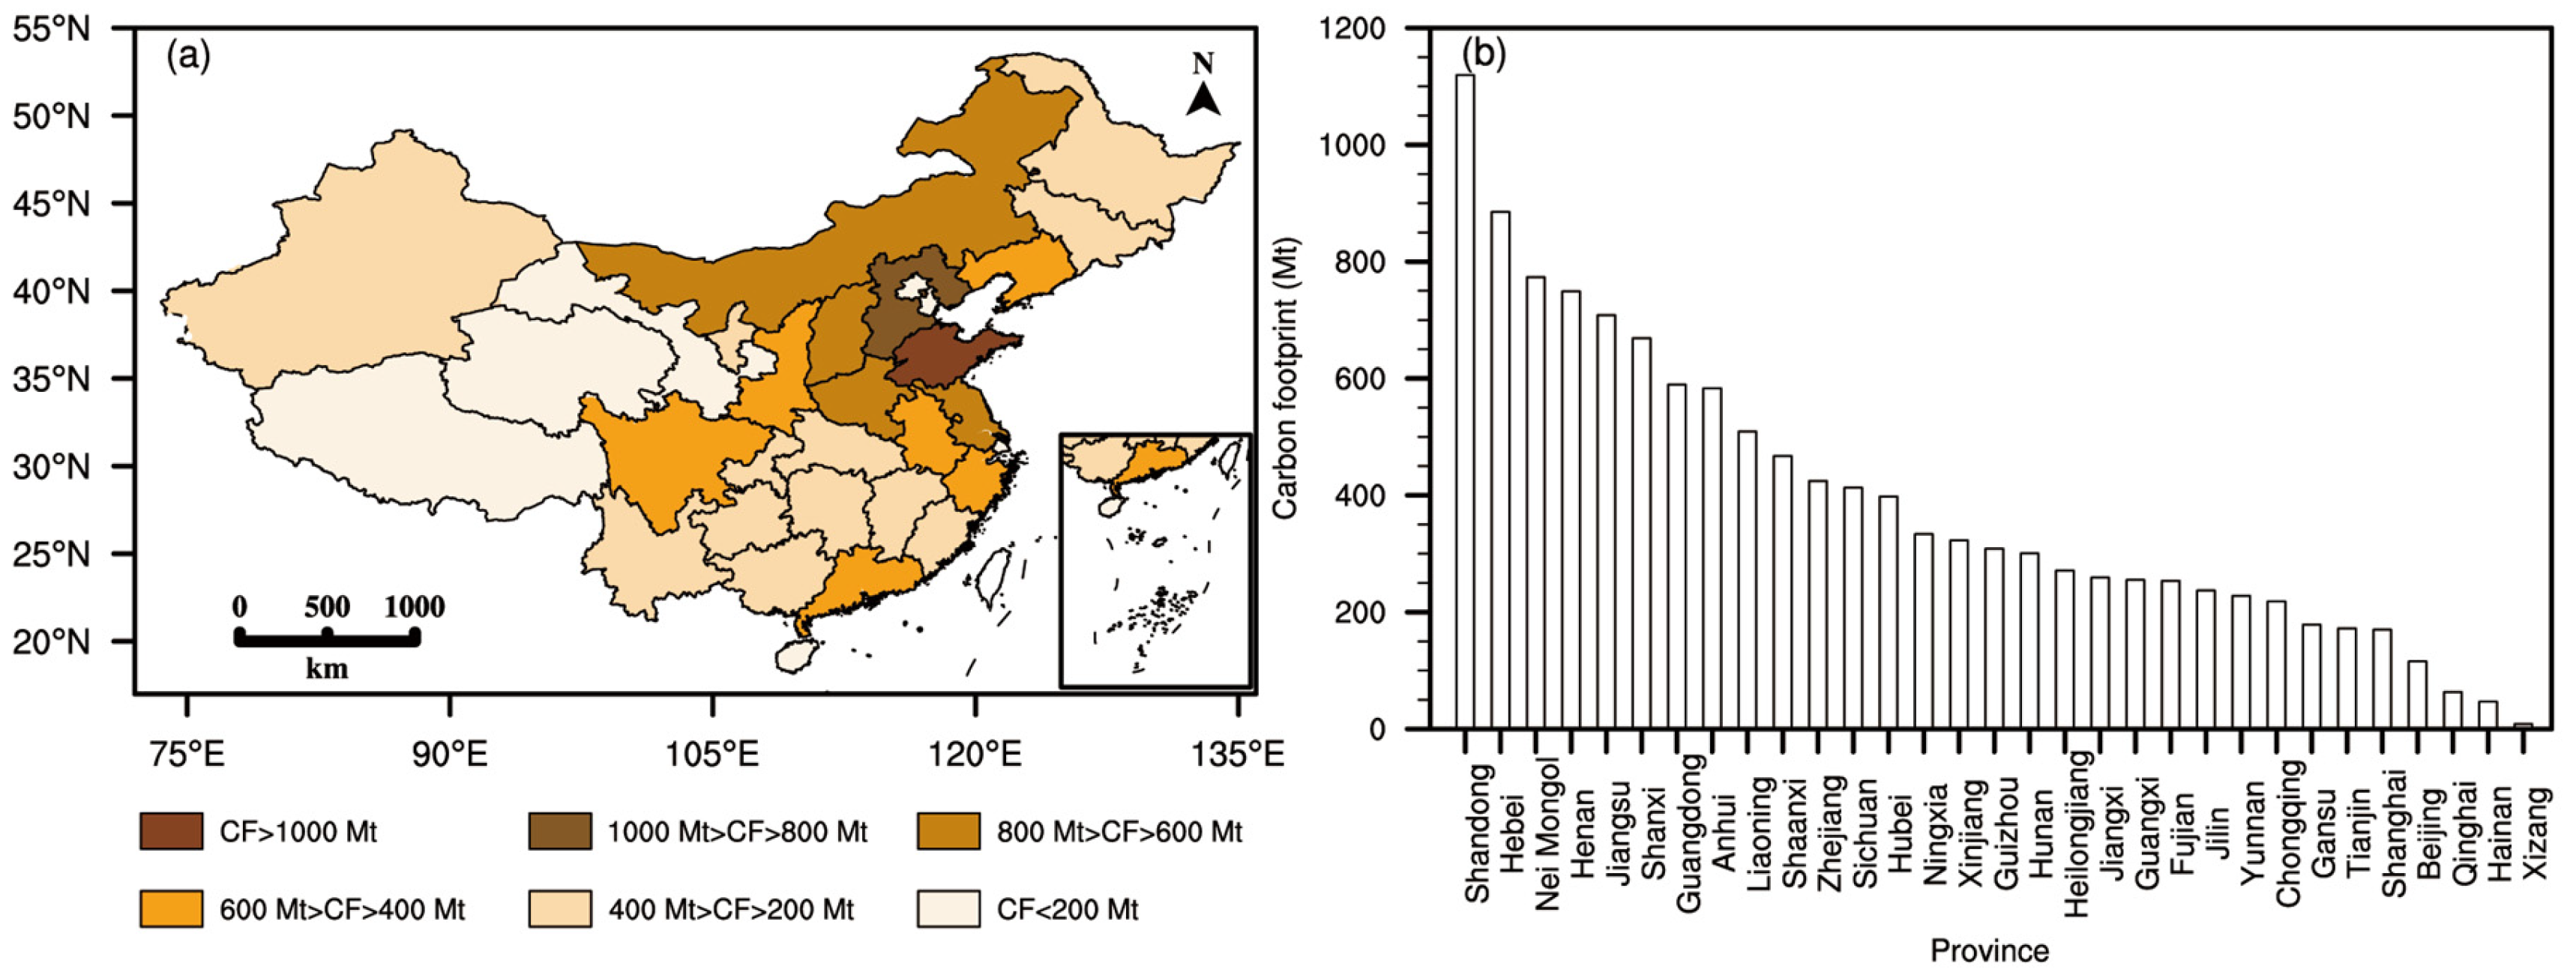
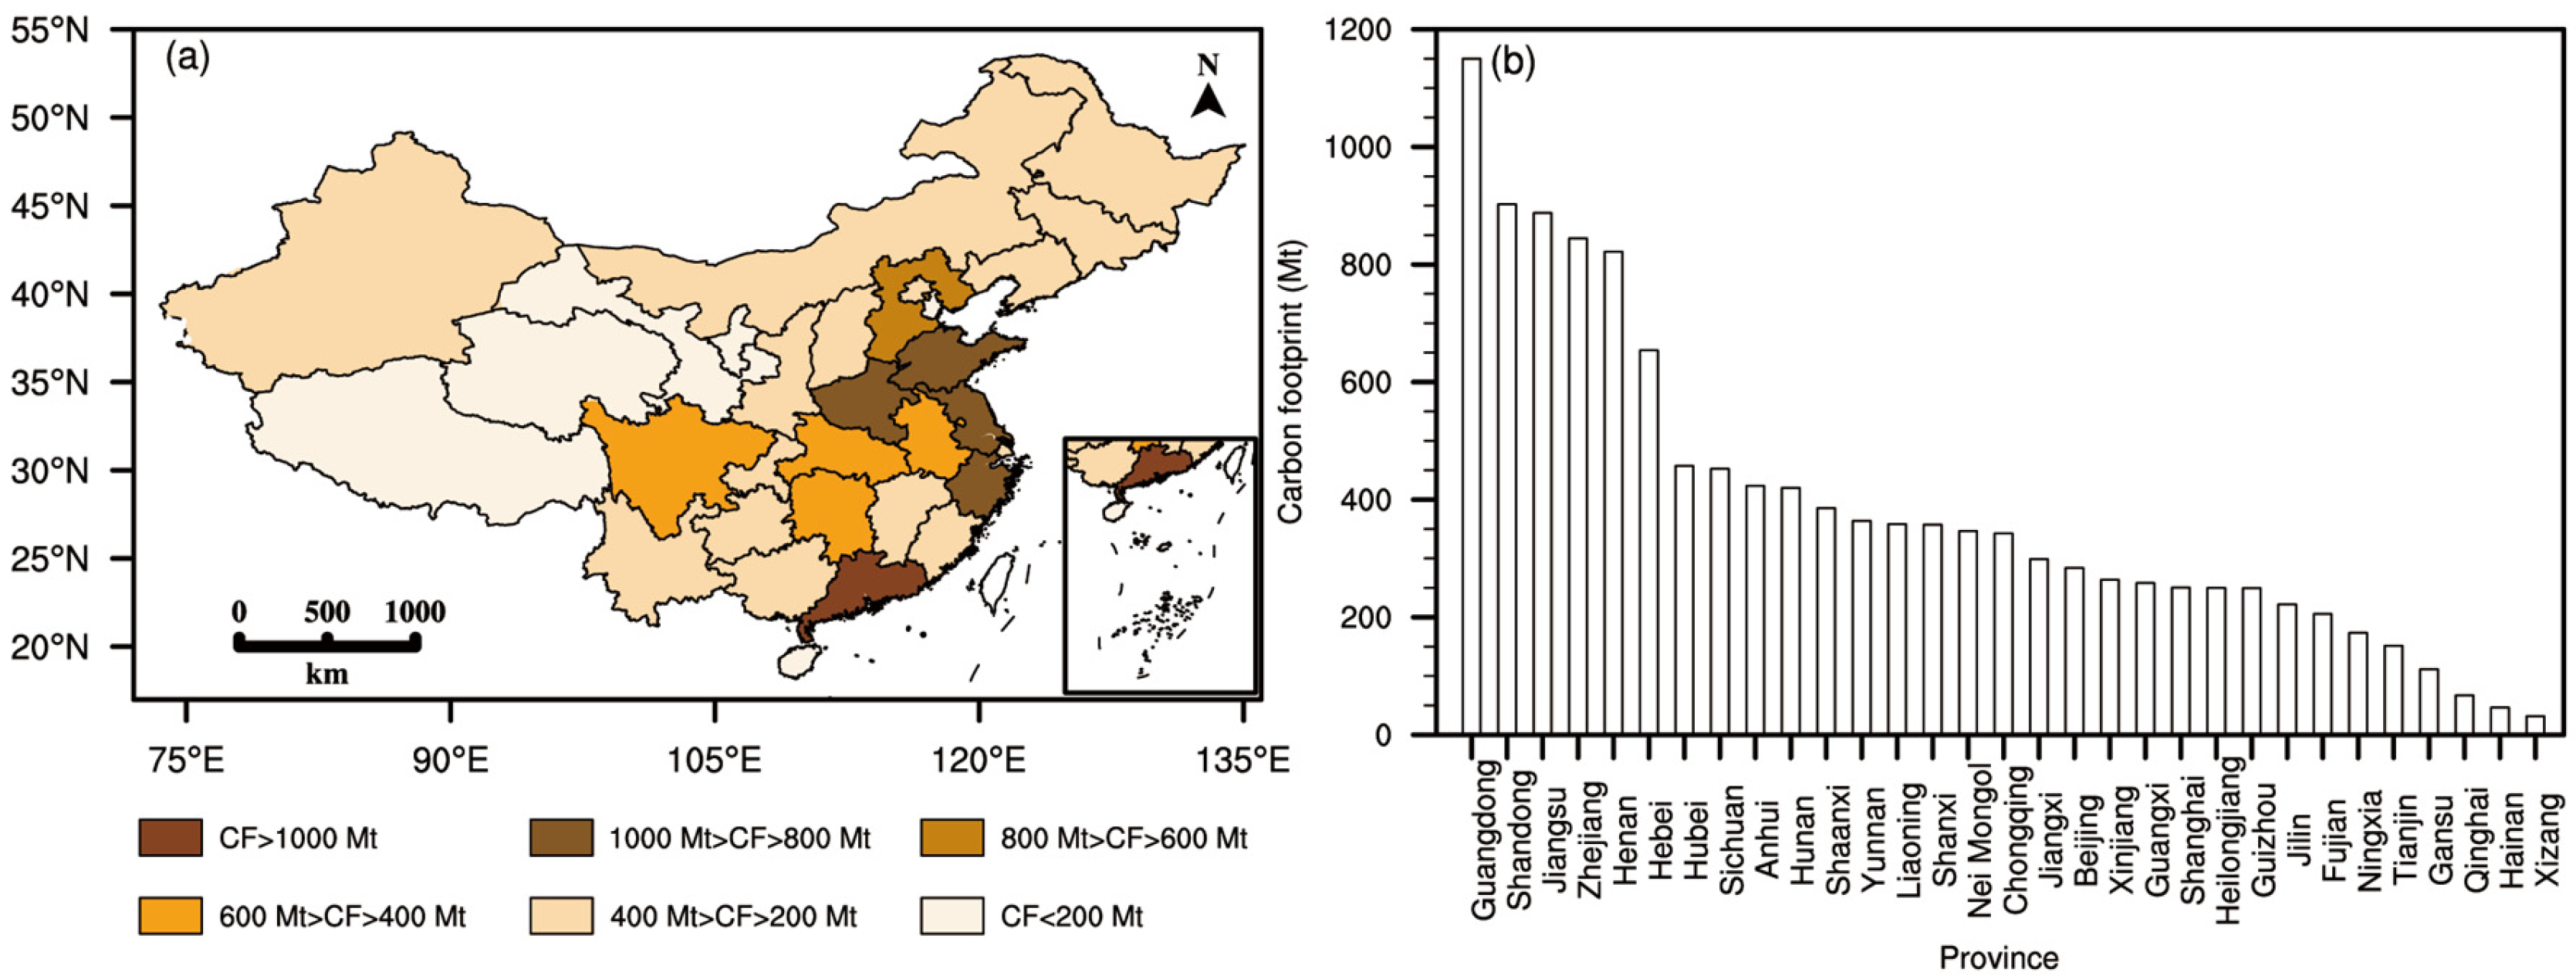
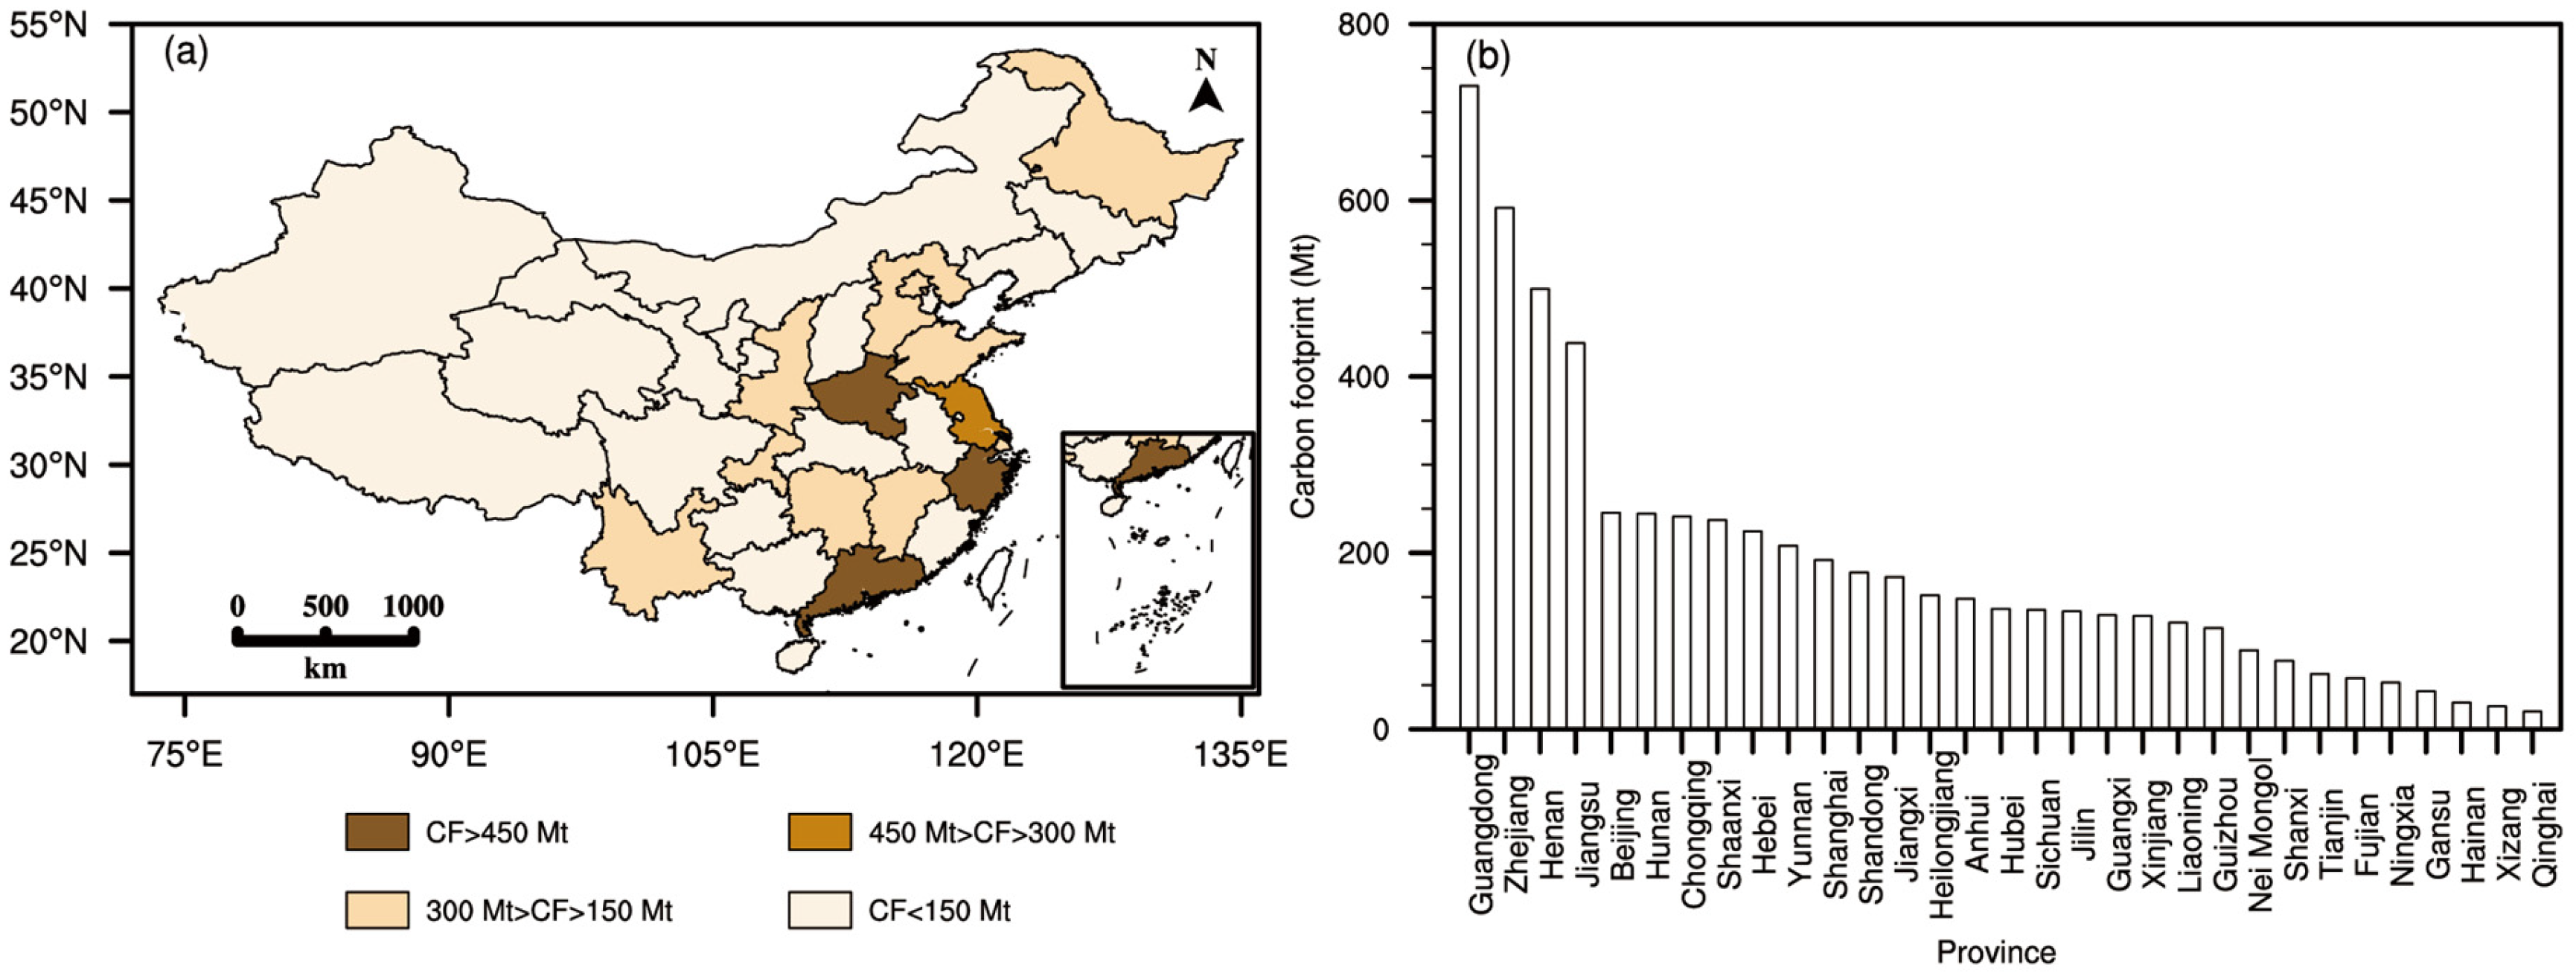
Equation (10) was employed to calculate the carbon footprint in 31 provinces in 2021 from a production responsibility perspective, as shown in Figure 1. The spatial distribution is uneven, namely, the carbon footprint was high in East China and North China and low in West China and South China. In the industrially developed and high-energy-consumption regions of North China and coastal regions, the carbon footprint was significantly greater than that in other regions. Regions with abundant natural resources had significantly greater carbon footprints than other regions. Shandong, Hebei, Inner Mongolia, Henan, and Jiangsu had the largest carbon footprints, accounting for 35.2% of the country’s total value, which is similar to the results calculated by Wang [56]. Xizang, Hainan, Qinghai, Beijing, and Shanghai exhibited the lowest carbon footprints, because some provinces have low economic development levels and underdeveloped industries, whereas others have low carbon footprints because of their small areas, small populations, and advanced production technology.

Figure 1.
Carbon footprint from the perspective of production responsibility in 31 provinces in 2021: (a) spatial distribution map; (b) statistical chart.
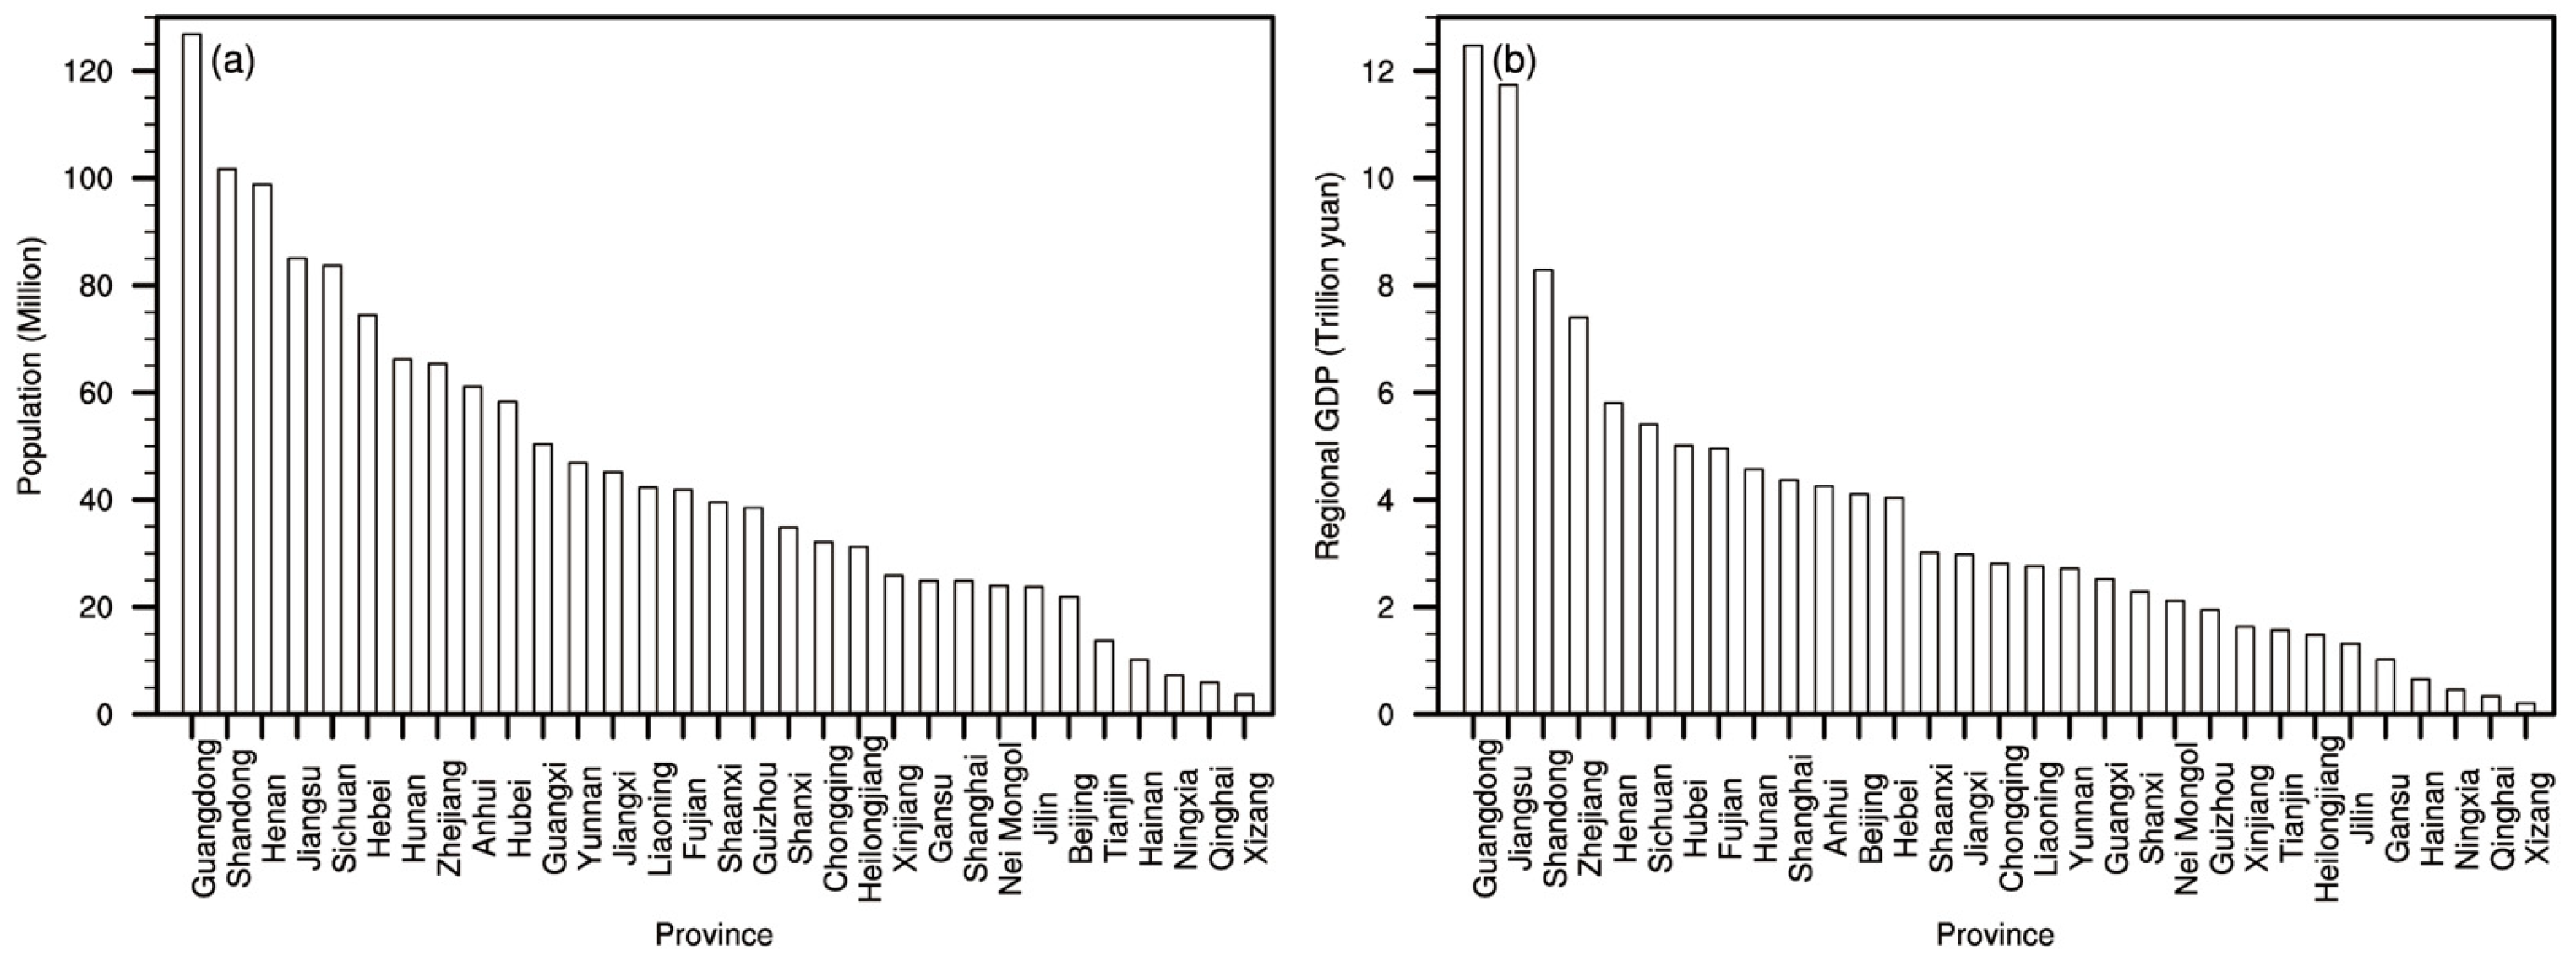
The per capita carbon footprint could be calculated via the annual resident population (https://data.stats.gov.cn/easyquery.htm?cn=E0103, accessed on 18 December 2024, Figure 2a), see Table 2. As detailed in this table, the per capita carbon footprint has a distribution of low values in the southern areas, and higher values in the northern areas. Ningxia, Inner Mongolia, Shanxi, Tianjin, and Xinjiang presented the greatest per capita carbon footprints, a result similar to those of Liu [57] and Wang et al. [58]. This may have occurred because these provinces are rich in resources and host many high-carbon-emission enterprises. In addition, these provinces are constrained by their technological innovation capacity, production technology, and low resource utilization efficiency, resulting in a high carbon footprint per capita.
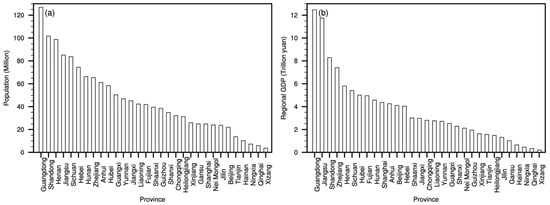
Figure 2.
(a) Population rankings of 31 provinces in 2021; (b) regional GDP rankings of 31 provinces in 2021.
Table 2.
Per capita carbon footprint from a production responsibility perspective in 31 provinces in 2021 (unit: t per person).
Sectoral Carbon Footprint
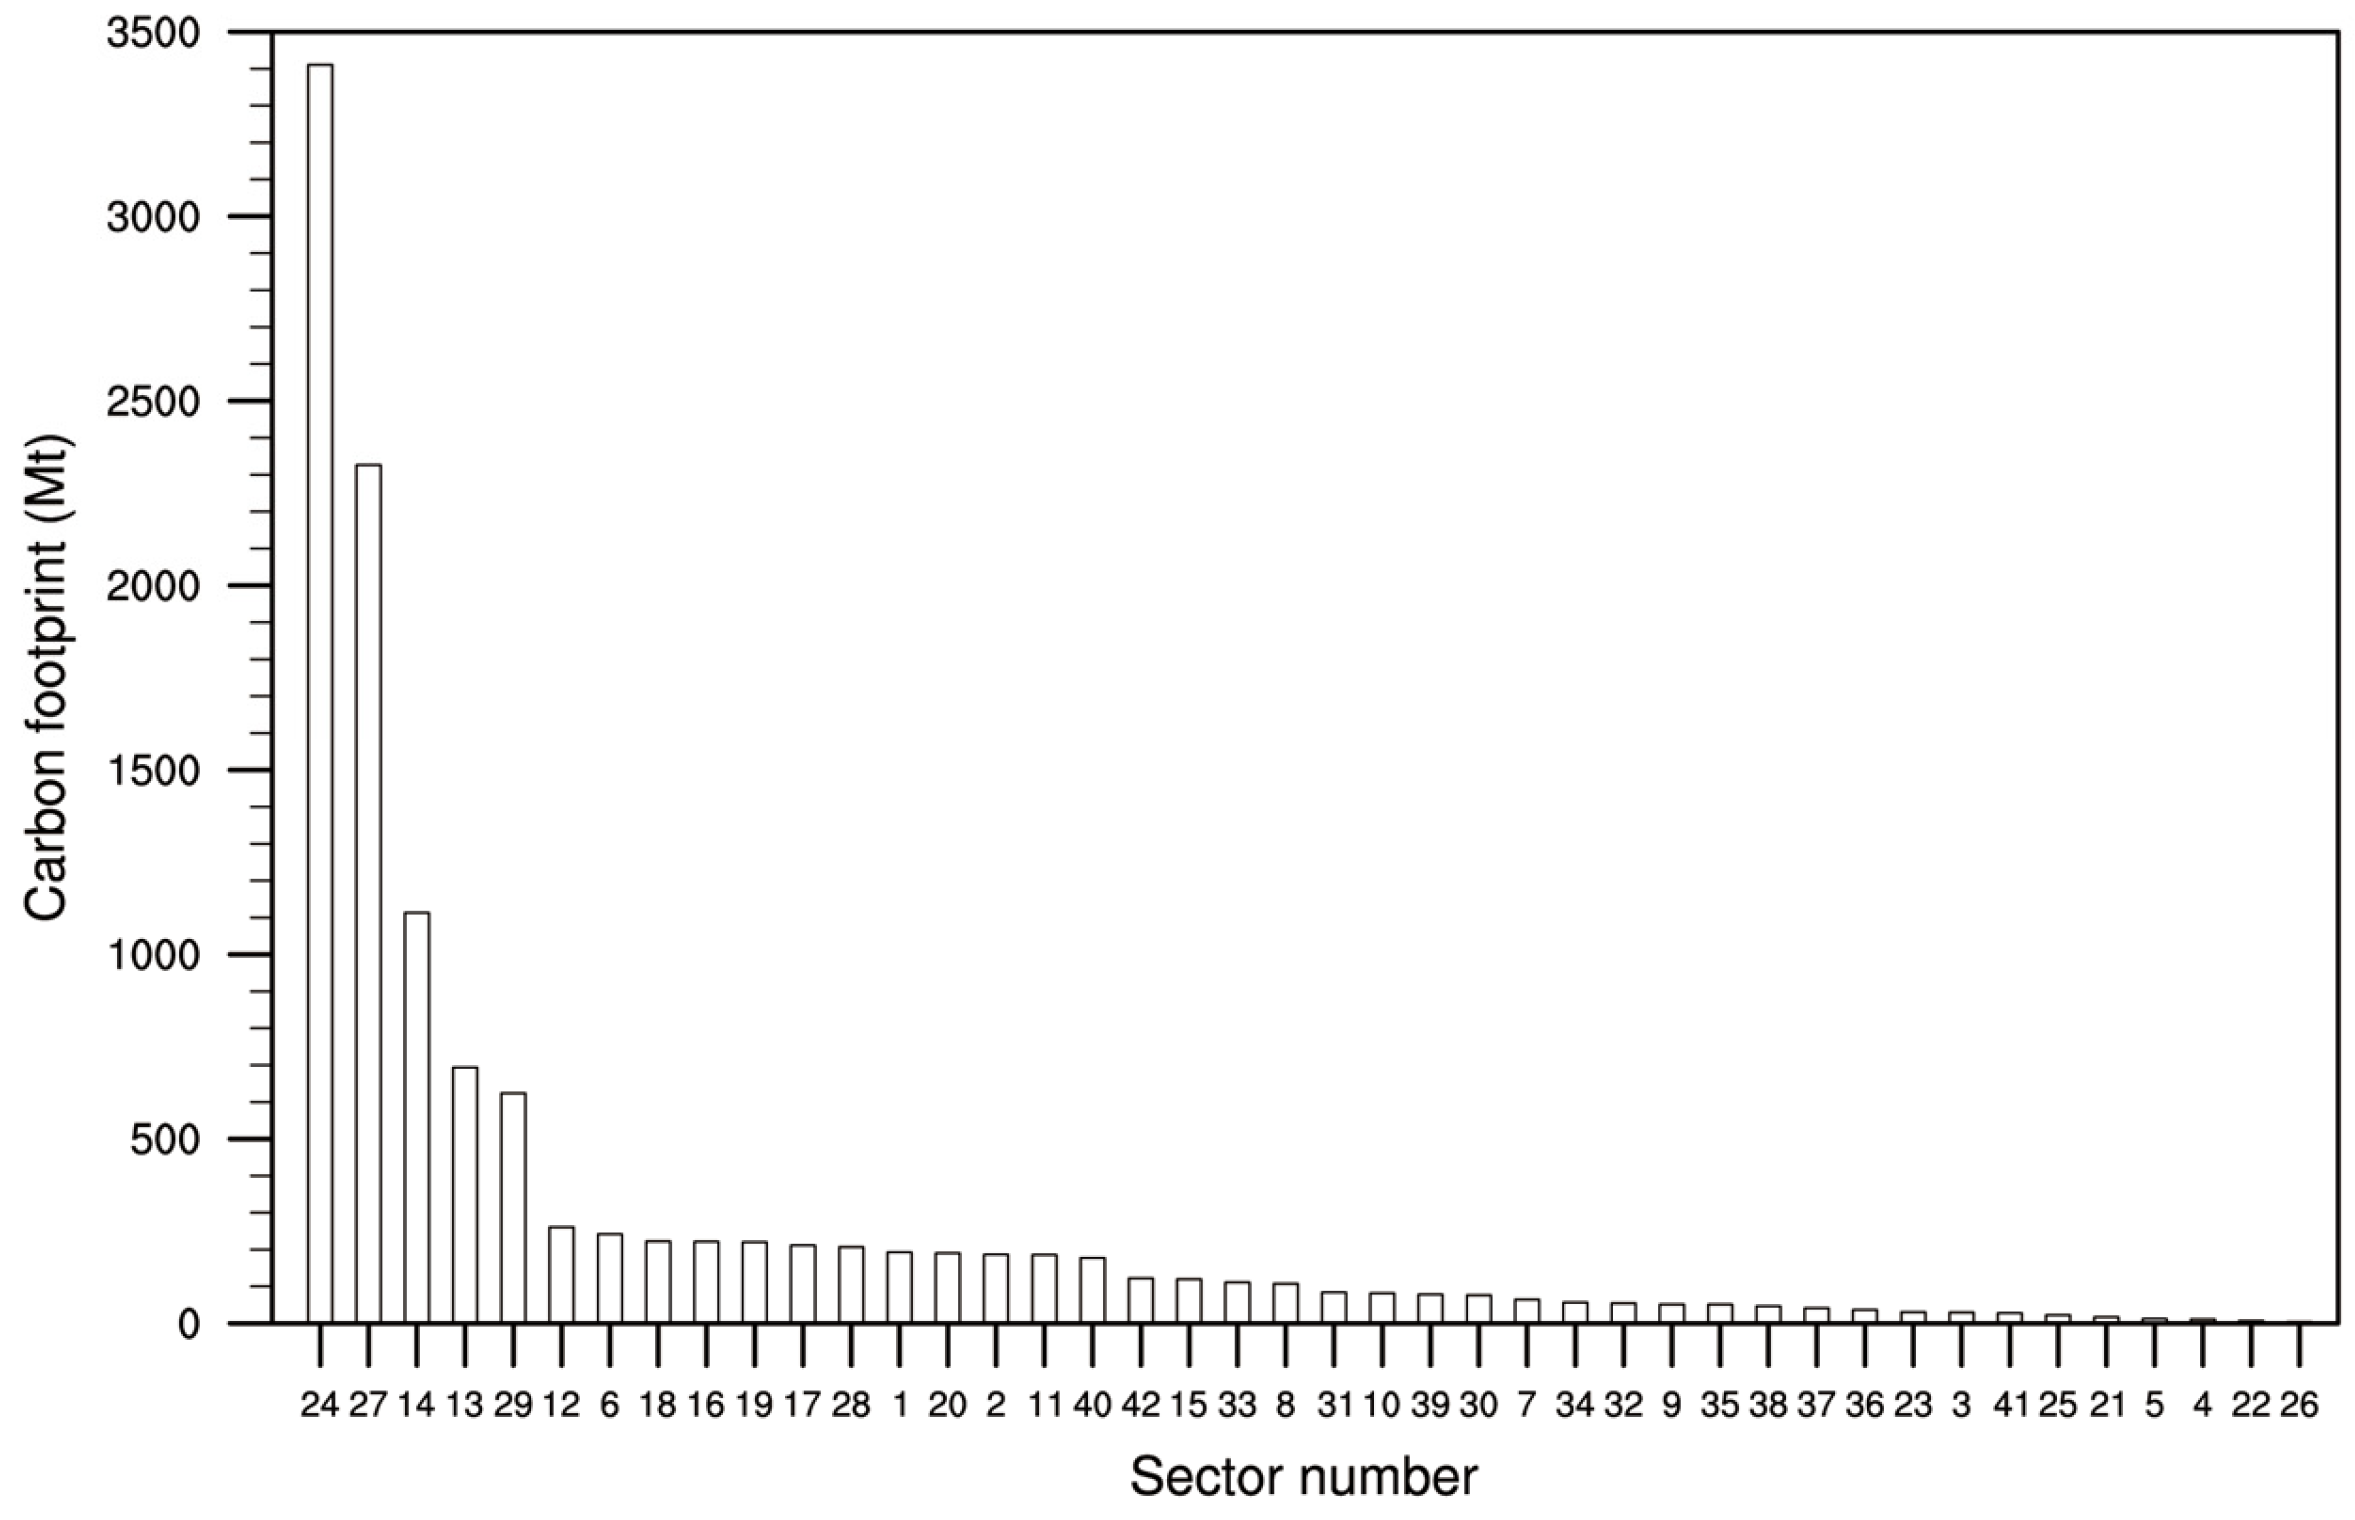
We calculated the carbon footprint of 42 sectors in 2021 from a production responsibility perspective. The production and distribution of electric power and heat power; smelting and processing of metals; manufacture of non-metallic mineral products; transport, storage, and postal services; and mining and washing of coal sectors exhibited the highest carbon footprints (Table 3). These sectors share a common feature, namely, high dependence on primary energy consumption. Their carbon footprint accounted for 87.1% of the total footprint.
Table 3.
Carbon footprint from a production responsibility perspective in 42 sectors in 2021 (unit: Mt).
The sector of the production and distribution of electric power and heat power produces electricity and heat to meet the needs of users’ social life and production activities. Therefore, this sector had the largest carbon footprint, accounting for approximately 50.3%, which is similar to other research results [59,60]. The mean driving factor underlying the high carbon footprint of this sector was the manufacturing sector (No. 6–22), followed by the construction sector (No. 27) [61]. With the rapid development of the economy, the carbon footprint of transport, storage, and postal services is also high [22].
Compared with primary and tertiary industries, the other three high-carbon footprint sectors were secondary industries, which have higher emissions and lower emission efficiency [62]. The continuous development of secondary industry resulted in notable carbon footprints in the relevant sectors.
3.1.2. Carbon Footprint from a Consumption Responsibility Perspective
Regional Carbon Footprint
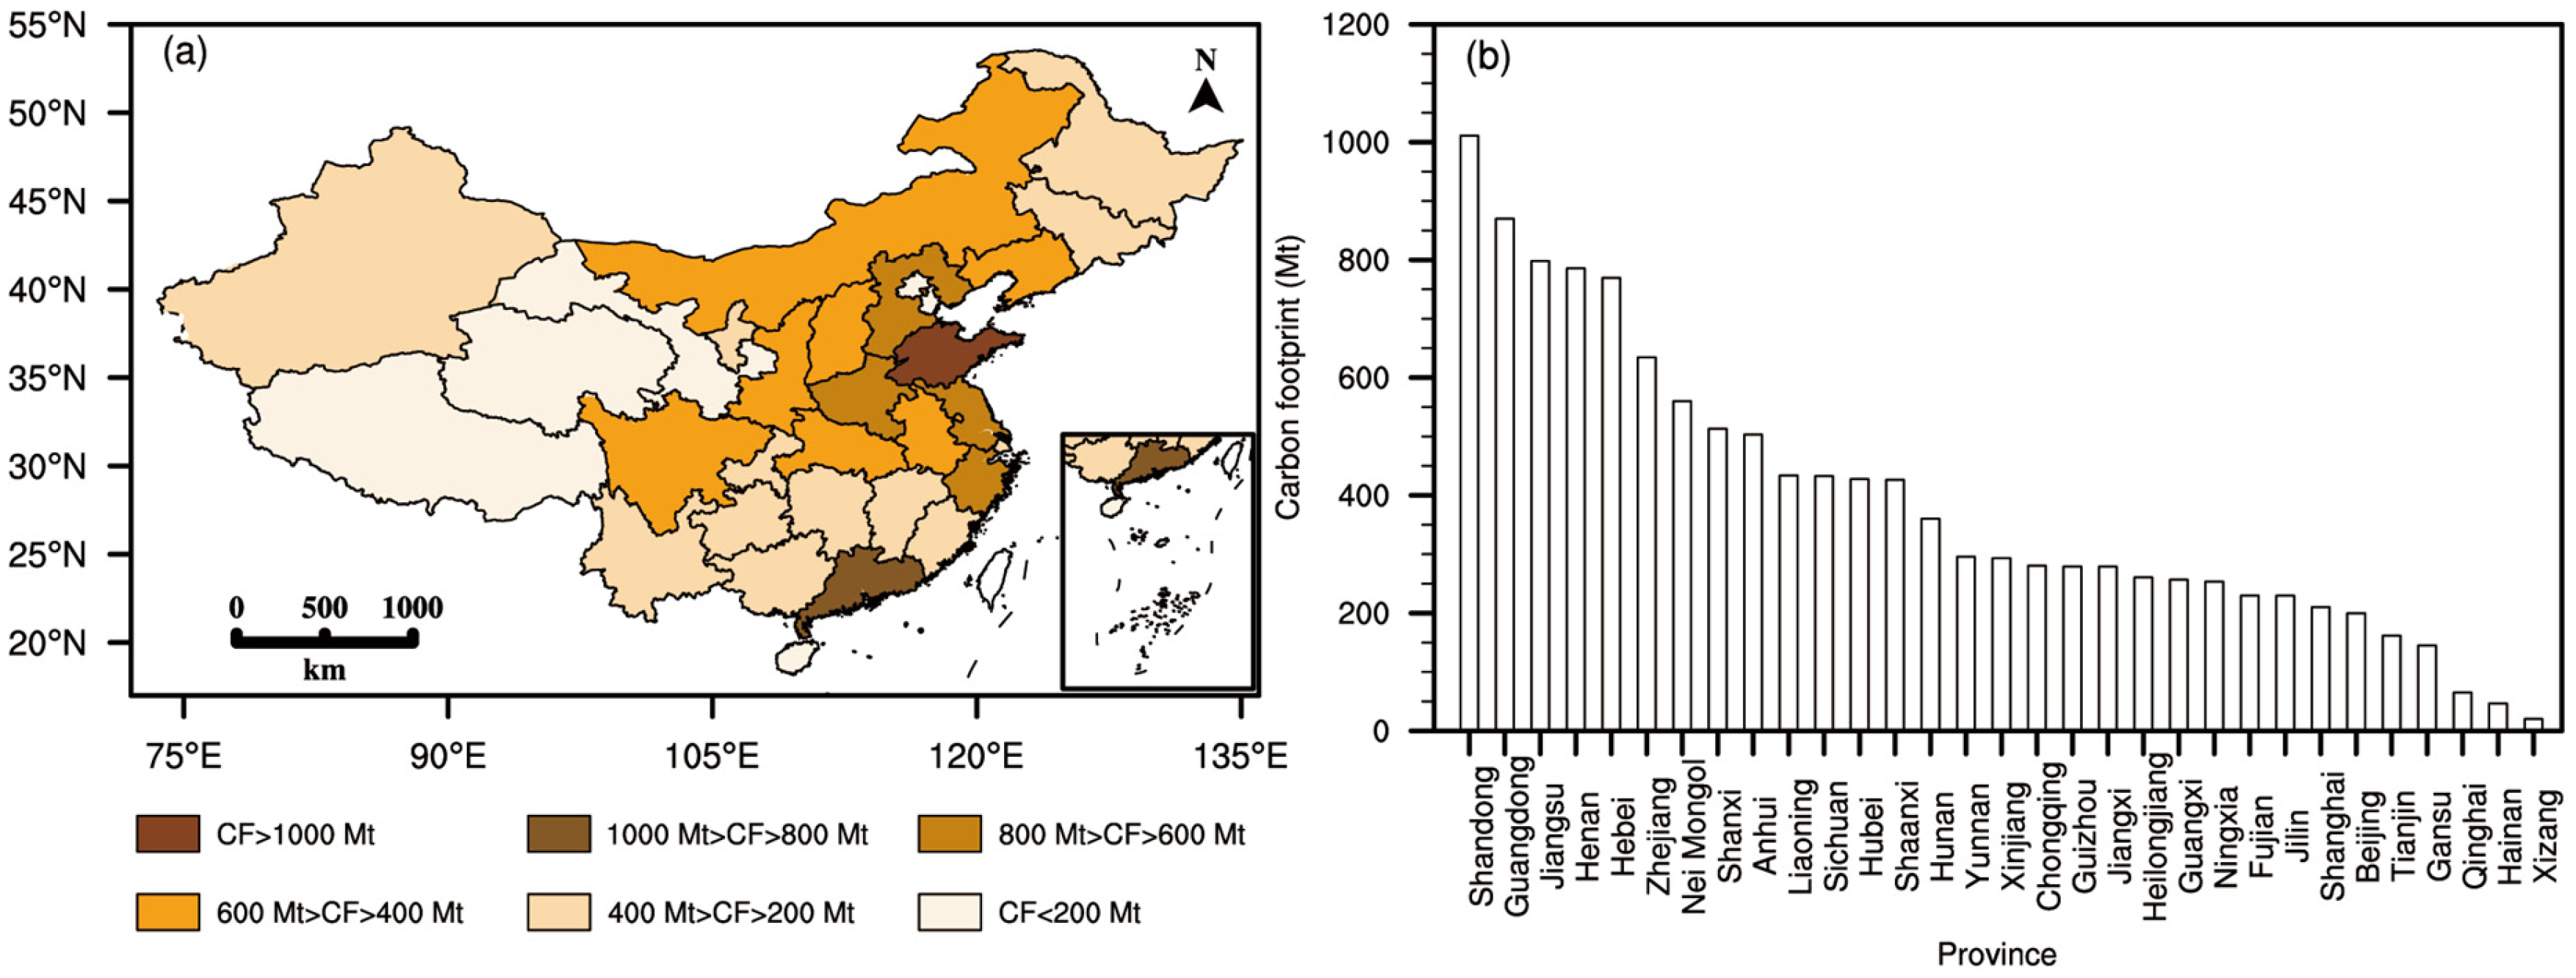
The carbon footprint from a consumption responsibility perspective in 2021 was calculated via Equation (11), as shown in Figure 3. Consistent with the results of Liu [57] and Xiao [63], the carbon footprint was unevenly distributed spatially and positively correlated with economic development level, with higher levels in the east and lower levels in the west. Guangdong, Shandong, Jiangsu, Zhejiang, and Henan had the largest carbon footprints. According to the data from the National Bureau of Statistics (Figure 2b), these five provinces had the highest regional gross domestic product (GDP) in 2021. In addition to Zhejiang, the remaining four provinces are also the most populous provinces (Figure 2a). Developed economies, high consumption levels, and large populations [23] result in large carbon footprints. Moreover, these provinces encompass developed industrial manufacturing industries, which often require the consumption of other materials in the production process. These five provinces together accounted for 38.3% of the total amount, indicating that the carbon footprint was concentrated in a few provinces. Xizang, Hainan, Qinghai, Gansu, and Tianjin presented the smallest carbon footprints. On the one hand, the populations of these provinces are small (Figure 2a). On the other hand, the economies of some provinces are relatively underdeveloped, and the consumption capacities of the residents are relatively low, which resulted in small carbon footprints in these regions.

Figure 3.
Carbon footprint from a consumption responsibility perspective in 31 provinces in 2021: (a) spatial distribution map; (b) statistical chart.
Table 4 provides the per capita carbon footprint from a consumption responsibility perspective in 2021. Ningxia, Inner Mongolia, Beijing, Zhejiang, and Qinghai exhibited the highest values. Beijing and Zhejiang have developed economies and high per capita consumption levels, resulting in relatively high values. The other three provinces have small populations. In these provinces, large amounts of products produced in other regions are consumed to meet local demands. A comparison of the results in Table 2 and Table 4 reveals that the per capita carbon footprint derived from a consumption responsibility perspective was more evenly distributed across regions than that derived from a production responsibility perspective [64].
Table 4.
Per capita carbon footprint from a consumption responsibility perspective in 31 provinces in 2021 (unit: t per person).
Sectoral Carbon Footprint
Table 5 provides the distribution of the sectoral carbon footprint. Construction, the production and distribution of electric power and heat power, the manufacture of electrical machinery and equipment, food and tobacco processing, and the manufacture of transport equipment exhibited the highest carbon footprints, accounting for 54.9% of the total amount. The carbon footprint on the consumption side is relatively evenly distributed (Table 5), whereas the carbon footprint on the production side is relatively concentrated in individual sectors (Table 3). The high value for the construction sector reflects the importance of construction in economic development in China [65], especially in populous provinces where many houses are constructed to meet the housing needs of residents during the development process. In the construction sector, many products provided by other sectors are consumed during production, so the construction sector has the highest carbon footprint on the consumption side. The sector of production and distribution of electric power and heat power, which is highly dependent on primary energy, also had a high carbon footprint. In the remaining three sectors, products produced by other sectors are consumed to meet their own needs.
Table 5.
Carbon footprint from a consumption responsibility perspective in 42 sectors in 2021 (unit: Mt).
3.1.3. Carbon Footprint Under the Shared Responsibility Principle and Emission Reduction Suggestions
Regional Carbon Footprint
Combined with the results presented in Section 3.1.1 Regional Carbon Footprint and Section 3.1.2 Regional Carbon Footprint, the carbon footprints of 31 provinces under the shared responsibility principle were calculated via Equation (13), as shown in Figure 4. Shandong, Guangdong, Jiangsu, Henan, and Hebei had the largest carbon footprints, accounting for approximately 35.2%, which is close to the value of 34.61% reported by Liu [57]. Shandong, Jiangsu, and Henan had the largest carbon footprints in the production and distribution of electric power and heat power, construction, and the smelting and processing of metals sectors. The total carbon footprint of these three sectors accounted for 61.93%, 57.61%, and 55.17% of their provinces’ total carbon footprint, respectively. Guangdong had the largest carbon footprints in the production and distribution of electric power and heat power; construction; and transport, storage, and postal services sectors, accounting for 57.73% of the province’s total carbon footprint. Hebei had the top three carbon footprints in the smelting and processing of metals, production and distribution of electric power and heat power, and construction sectors, accounting for 68.65% of the total carbon footprint. For industrial provinces, the carbon footprints of secondary industry were relatively large, and in economically developed regions, the carbon footprints of tertiary industry cannot be ignored. Provinces located in the Pearl River Delta and Yangtze River Delta economic belts, as well as traditional industrial provinces in northern China [57], are facing greater emission reduction pressure to achieve the dual carbon goals and thus require more stringent emission reduction efforts. When formulating emission reduction measures, provincial governments should consider both production- and consumption-side emissions.
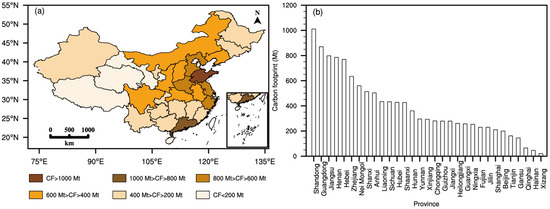
Figure 4.
Carbon footprint from a shared responsibility perspective in 31 provinces in 2021: (a) spatial distribution map; (b) statistical chart.
In terms of production, provincial governments should aim to accelerate the innovation of production technology, eliminate high-carbon-emission enterprises, optimize production processes, and increase production efficiency levels, thereby reducing energy consumption. In addition, they could expand the pilot scope of the national carbon emission trading market and reduce the emissions of enterprises via economic incentives. Some emission reduction measures have achieved initial results. According to the National Carbon Market Development Report (2024) (https://big5.mee.gov.cn/gate/big5/www.mee.gov.cn/ywdt/xwfb/202407/W020240722528848347594.pdf, accessed on 18 December 2024), as of 2023, the cumulative trading volume of carbon emission quotas in the national carbon emission trading market was 442 million tons. The trading scale is gradually expanding, and the trading price is steadily increasing, which is highly important for achieving carbon emission control goals.
In terms of consumption, the use of carbon labels to indicate the embodied greenhouse gas emissions of products should be promoted, making consumers aware of their emission reduction responsibilities. Additionally, the use of carbon-inclusive platforms [66,67] should be promoted to increase consumers’ awareness of the need for emission reductions. Guangdong faces considerable pressure to reduce emissions, but the level of awareness regarding emissions reduction there is relatively high. They started early with the establishment of a carbon-inclusive platform. As of October 2024, the membership of the carbon-inclusive platform exceeded 400,000, with a cumulative emission reduction of more than 50,000 tons (https://www.tanph.cn/, accessed on 18 December 2024). This approach can provide guidance and help other regions establish carbon-inclusive platforms in the future. However, the current accounting method for reducing carbon-inclusive emissions still needs to be improved, and an insufficient incentive mechanism restricts the sustainable operation of the platform [67].
Provinces with small carbon footprints, such as Qinghai, Hainan, and Xizang, face lower pressures to reduce emissions. Owing to their regional and resource advantages, these provinces can help other provinces reduce emissions. In this process, they can simultaneously develop their own economies. For example, Hainan is rich in forestry and marine carbon sinks, with excellent potential for renewable energy development [68]. It has good conditions for quickly achieving carbon neutrality and can contribute to carbon neutrality in other regions.
Sectoral Carbon Footprint
The sectors of the production and distribution of electric power and heat power; construction; smelting and processing of metals; manufacture of non-metallic mineral products; and transport, storage, and postal services presented the highest carbon footprints (Figure 5). In the production and distribution of electric power and heat power sector, Shandong, Inner Mongolia, and Guangdong had the largest carbon footprints, accounting for 26.9% of the country’s total carbon footprints in this sector. In the construction sector, Guangdong, Shandong, and Jiangsu contributed the most. In the smelting and processing of metals sector, Hebei, Shandong, and Liaoning contributed the most, with Hebei in particular contributing 20.50% to the sector. In the manufacture of non-metallic mineral products sector, Shandong, Guangdong, and Henan had the largest carbon footprints. In the transport, storage, and postal services sector, Guangdong, Shandong, and Beijing contributed the most to the carbon footprints, accounting for 24.08% in total. Overall, economically developed provinces significantly contributed to the carbon footprints of the tertiary industry, while industrialized provinces contributed significantly to the carbon footprints of the secondary industry.
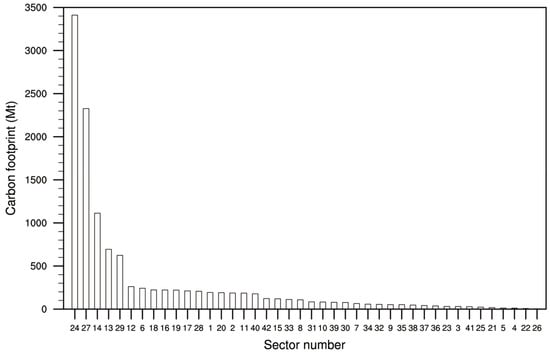
Figure 5.
Carbon footprint under the shared responsibility principle of 42 sectors in 2021.
These sectors require special attention when reducing emissions. At present, thermal power generation remains the primary power generation method. In the future, the associated emissions can be reduced by levying carbon taxes, increasing power generation efficiency levels, optimizing the industrial structure, and developing renewable energy sources [59]. The construction sector can reduce its carbon emissions by recycling materials and using sustainable materials. For relevant sectors in secondary industry, production efficiency can be increased by updating production methods and adopting new industrial equipment, thereby reducing energy consumption. The promotion of circular economic models can increase resource utilization efficiency levels and save energy. The transportation industry can promote the use of new-energy electric vehicles with low energy consumption levels, while optimizing the transportation structure. The logistics industry can increase the proportion of clean energy, increase research and development efforts focused on green technologies [22], introduce advanced equipment, enhance logistics efficiency, adjust industrial structure, and improve emission reduction management mechanisms [69].
3.2. Transfer of the Carbon Footprint
3.2.1. Transfer of the Regional Carbon Footprint
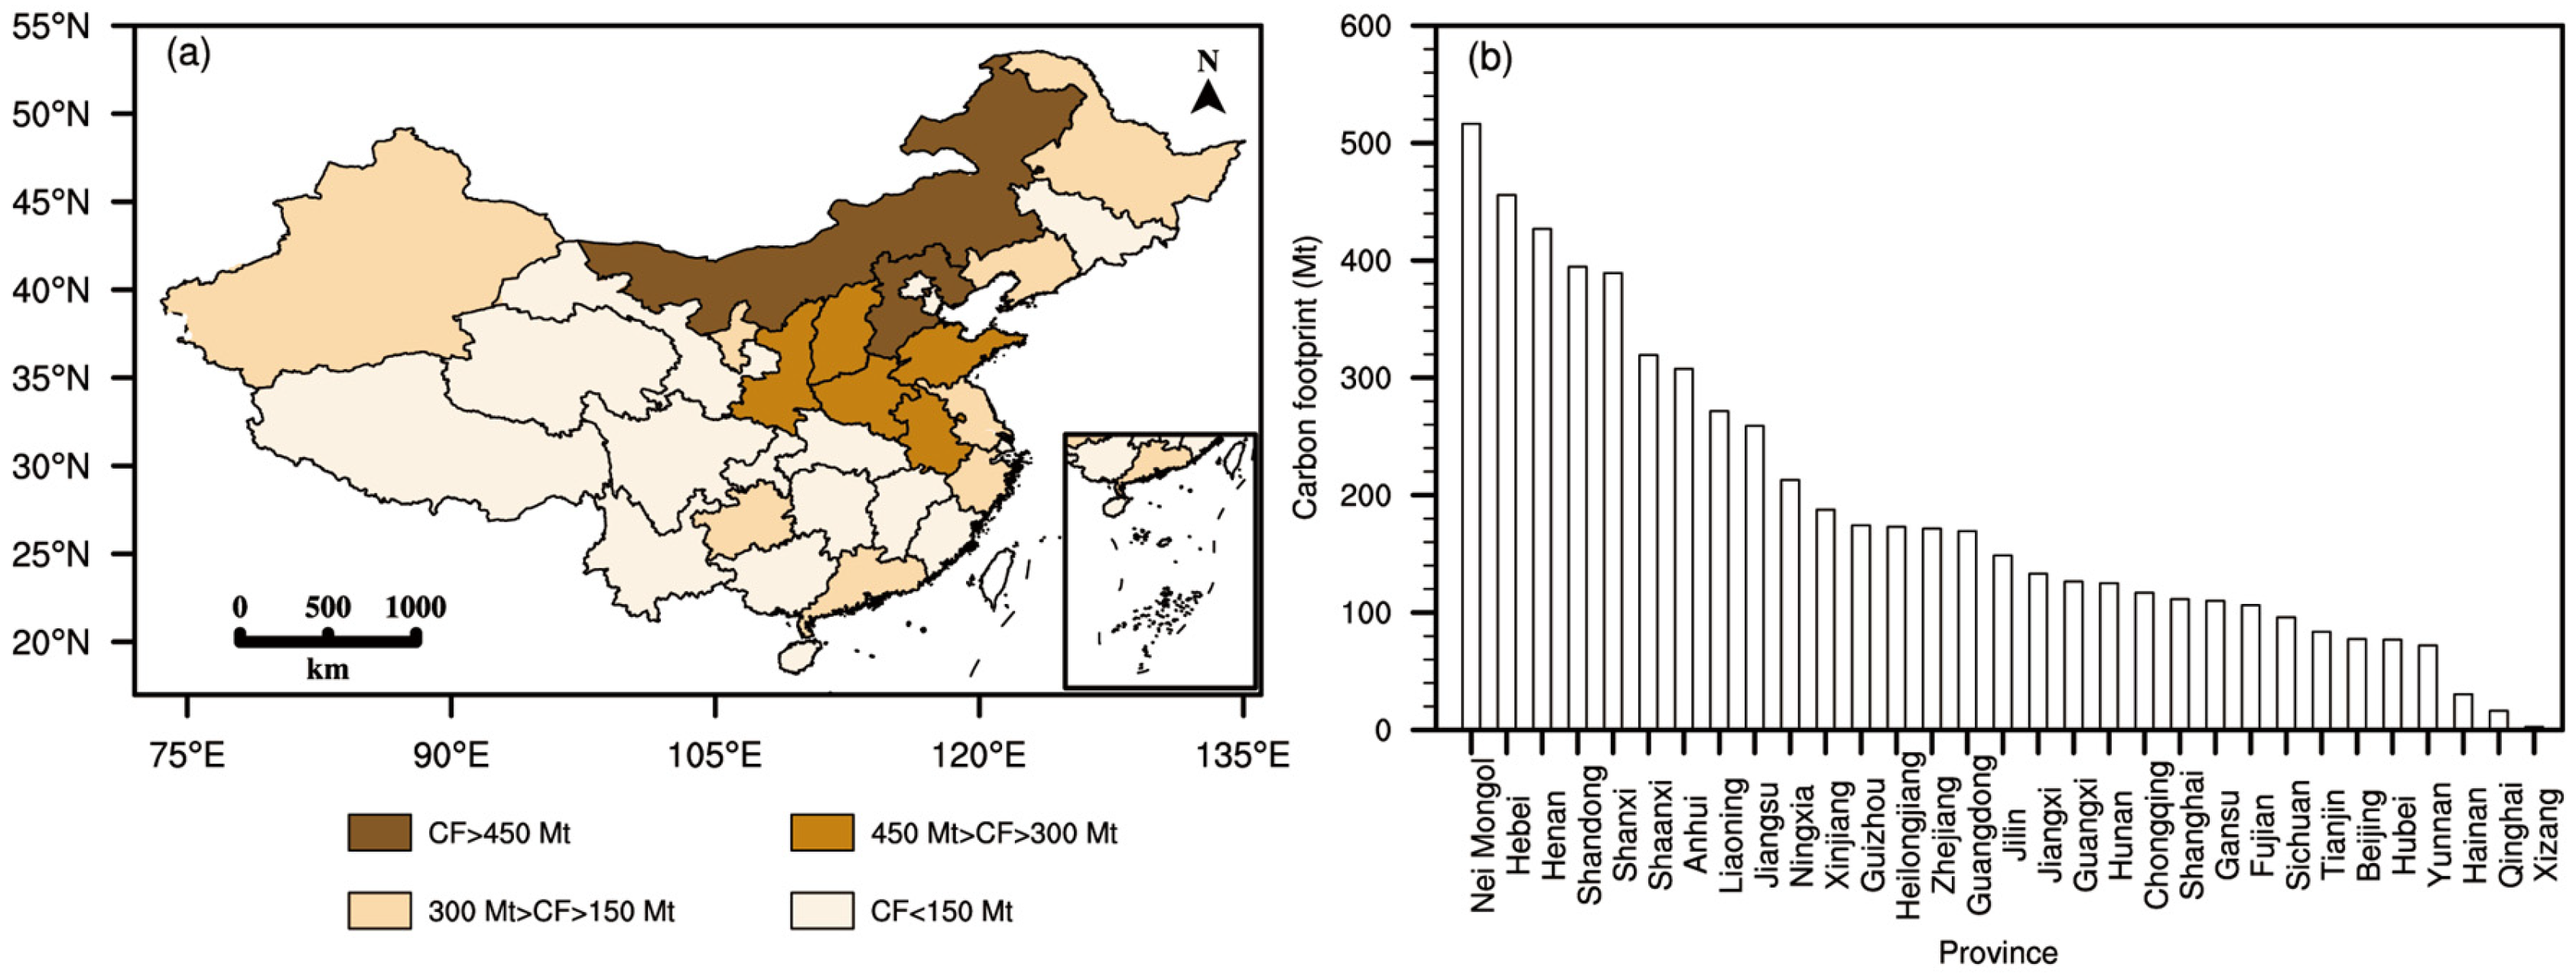
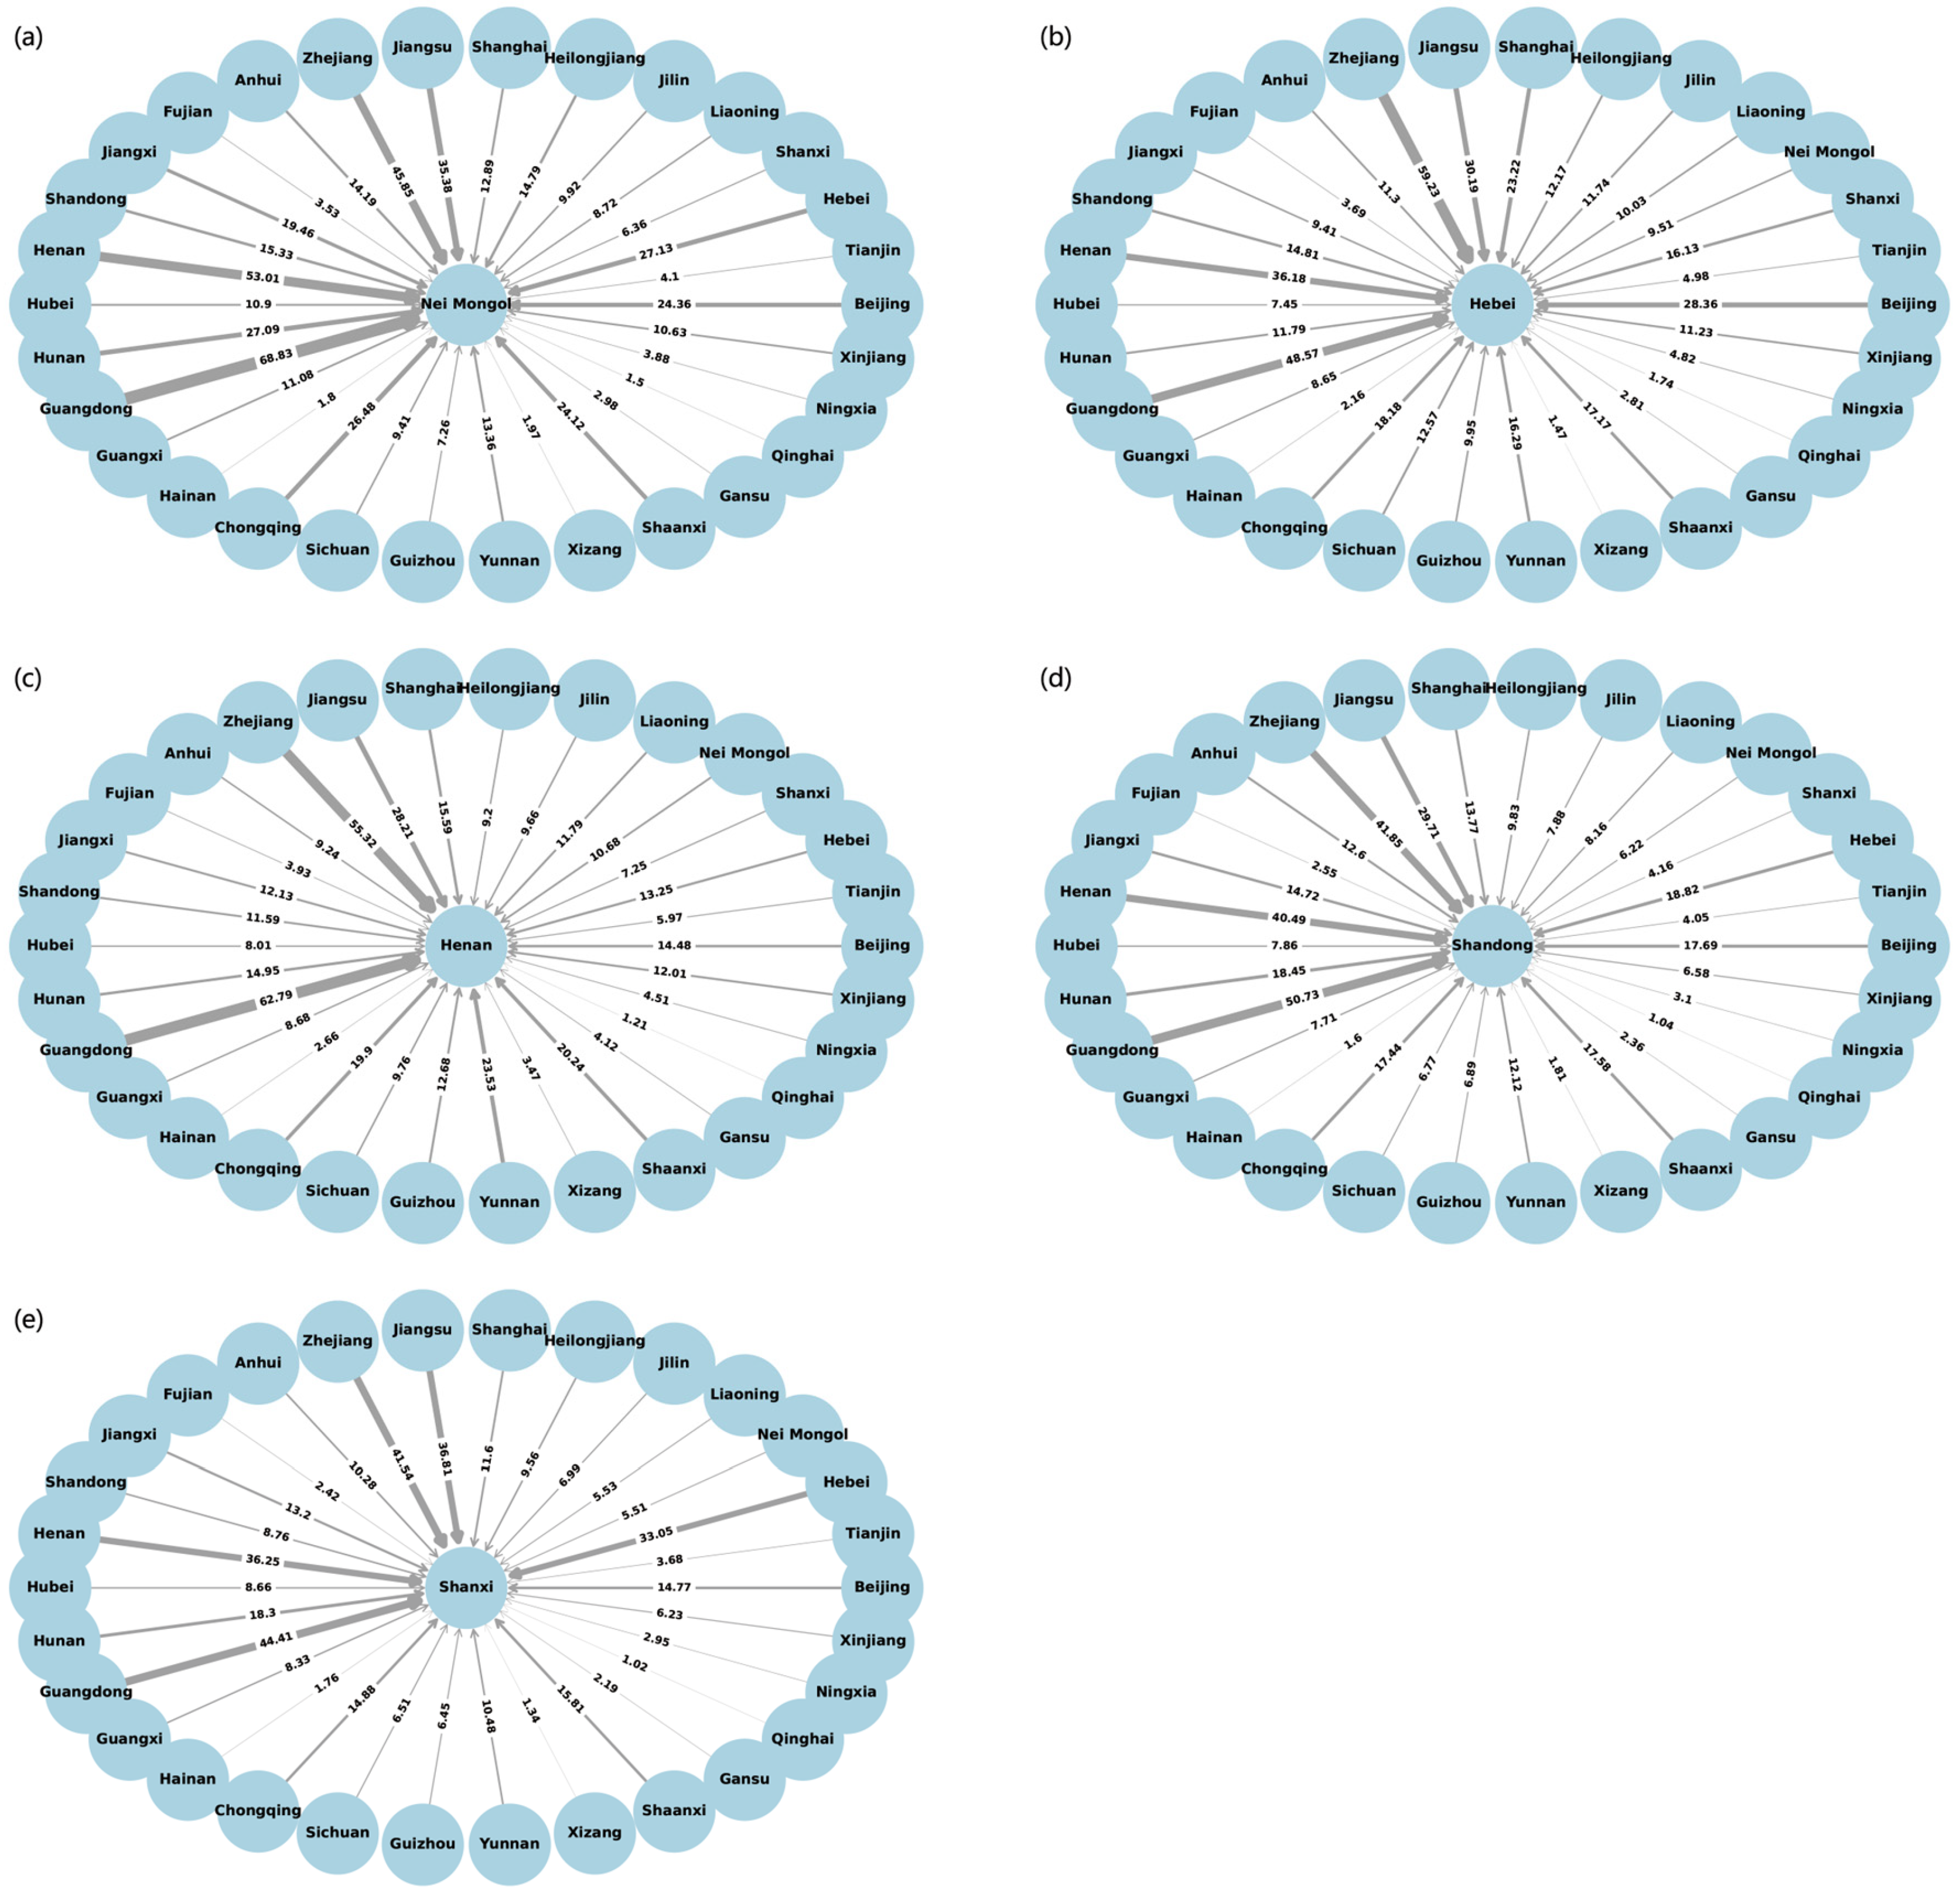
Figure 6 shows the carbon footprints transferred in for 31 provinces. Notably, the carbon footprints transferred in for the northern areas were greater than those of the southern areas, and Inner Mongolia, Hebei, Henan, Shandong, and Shanxi displayed the largest transferred carbon footprints.
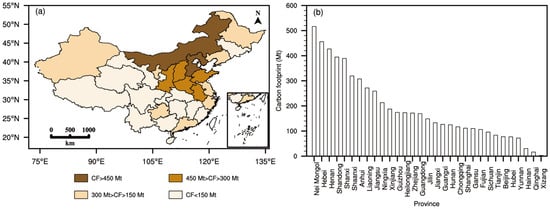
Figure 6.
Carbon footprints transferred in: (a) spatial distribution map; (b) statistical chart.
In Figure 7, we list the amounts of carbon footprint transferred from each province to Inner Mongolia, Hebei, Henan, Shandong, and Shanxi. Economically developed provinces, such as Guangdong, Zhejiang, and Jiangsu, were the most important sources. The secondary sources were neighboring provinces, such as Beijing, and its carbon footprint was partially transferred to Hebei.
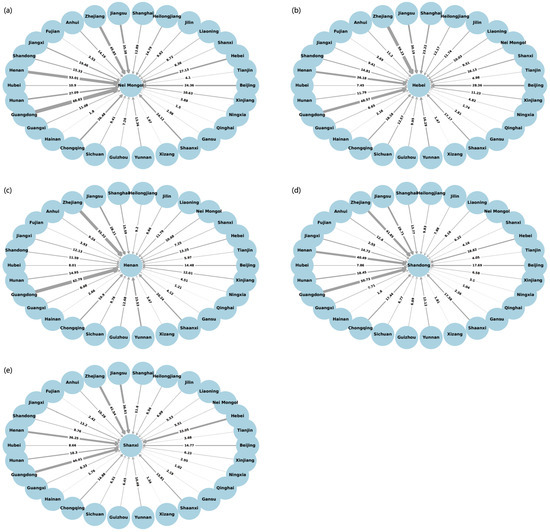
Figure 7.
Sources and amounts of carbon footprints transferred to (a) Nei Mongol; (b) Hebei; (c) Henan; (d) Shandong; (e) Shanxi (unit: Mt).
The carbon footprints transferred out of each province were calculated via Equation (15). As shown in Figure 8, Guangdong, Zhejiang, Henan, Jiangsu, and Beijing exhibited the highest carbon footprints transferred out.
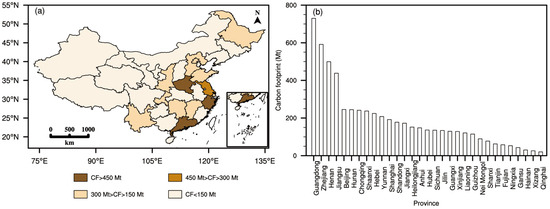
Figure 8.
Carbon footprint transferred out: (a) spatial distribution map; (b) statistical chart.
Figure 9 shows the amounts of carbon footprint transferred from Guangdong, Zhejiang, Henan, Jiangsu, and Beijing to other provinces. Inner Mongolia, Shanxi, Hebei, and Shandong were the main destinations of carbon footprints transferred out. Some provinces possess abundant natural resources, whereas others encompass developed industries. Thus, they can receive many high-carbon-emission industries from economically developed regions. Neighboring provinces are also major destinations for carbon footprint transfer [70]. For example, Jiangsu transferred part of its carbon footprint to Anhui, whereas Henan transferred part of its carbon footprint to Shaanxi. This occurred because the distance between these provinces is relatively short. From the perspective of reducing transportation costs, neighboring provinces were also the main destinations of industrial transfer. Overall, the results obtained for the carbon footprints transferred in and out are similar to those of Liu [57] and Wang et al. [23]. Economically developed provinces were the main sources of carbon footprint transfer, whereas energy-rich provinces were the main destinations, mainly due to the provincial industrial structure and energy storage conditions.
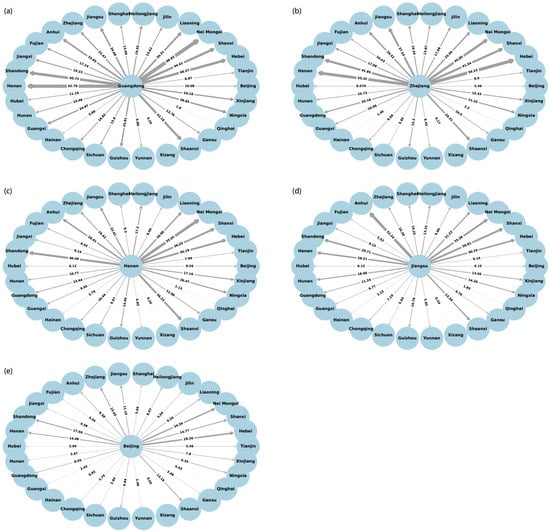
Figure 9.
Destinations and amounts of carbon footprints transferred out: (a) Guangdong; (b) Zhejiang; (c) Henan; (d) Jiangsu; (e) Beijing (unit: Mt).
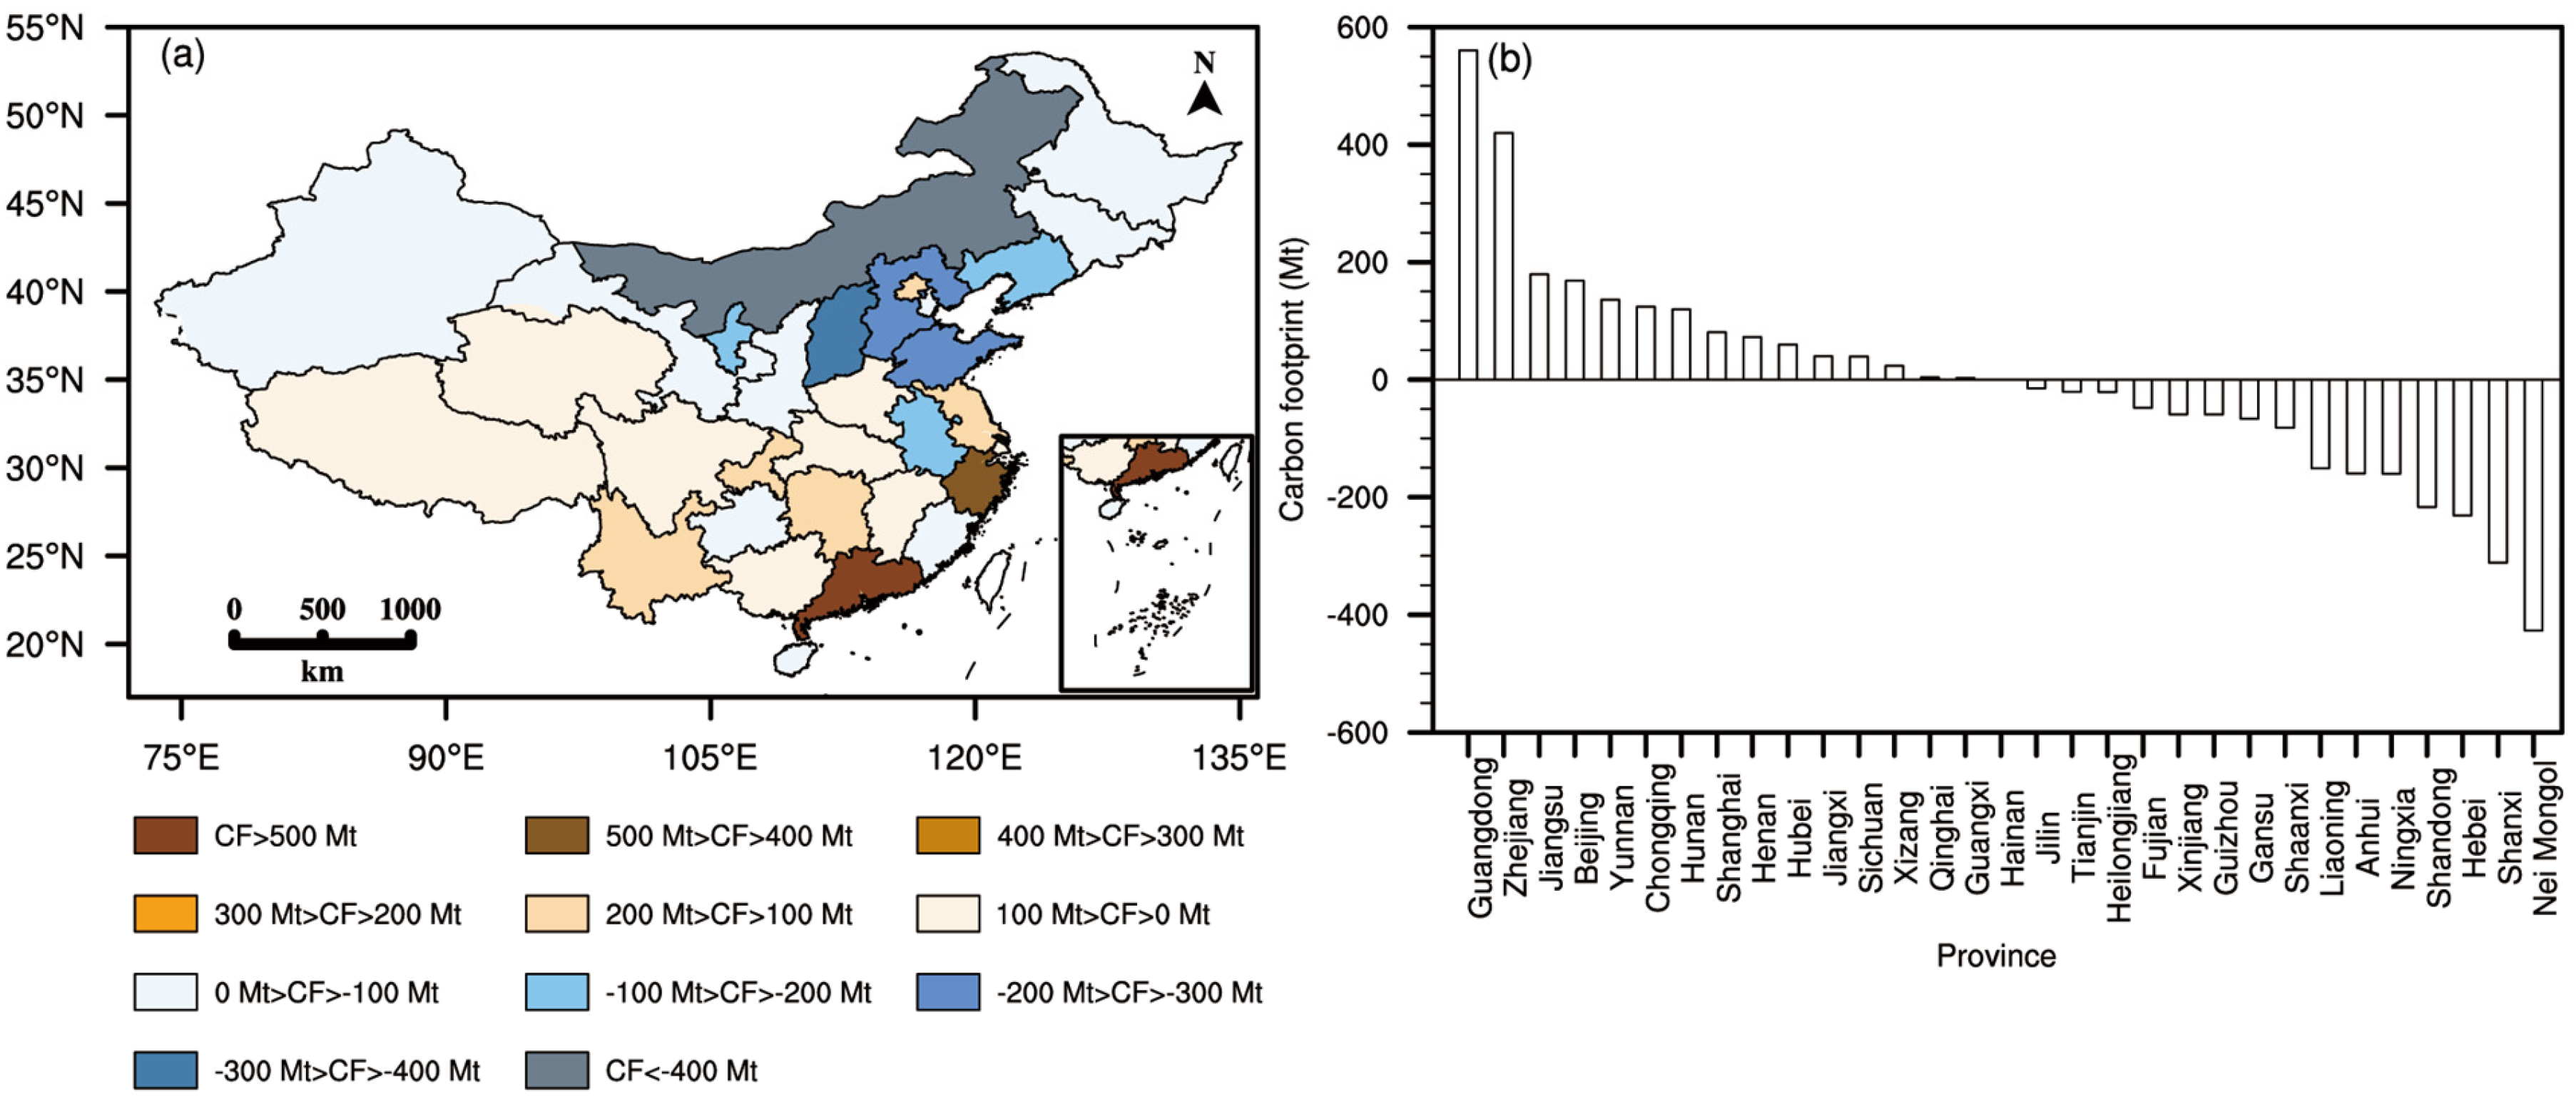
On the basis of the carbon footprints transferred out and transferred in, we calculated the net carbon footprint transfer. The results are shown in Figure 10. Provinces with positive net carbon footprint transfer were mainly distributed in southern China, whereas regions with a negative net carbon footprint transfer were primarily located in northern China. The net carbon footprint transfer in 15 provinces was positive, indicating that these provinces mainly served as consumers, thus transferring their carbon footprint to other provinces via trade. Guangdong, Zhejiang, Jiangsu, Beijing, and Yunnan presented the greatest positive net carbon footprint transfer. The results are similar to those of Wang et al. [58]. This occurred because these provinces encompass relatively scarce natural resources and must import products from other provinces for use. Moreover, these provinces host developed economies and often transfer high-carbon-emission industries to neighboring or western provinces via industrial transfer [58]. The net carbon footprint transfer in 16 provinces was negative, suggesting that they mainly serve as producers, thus transferring the carbon footprint of other provinces to their own provinces via trade. Inner Mongolia, Shanxi, Hebei, Shandong, and Ningxia exhibited the greatest negative net carbon footprint transfer, due to their abundant natural resources and developed industries. Therefore, they transferred high-carbon-emission industries from economically developed provinces to better promote economic development.
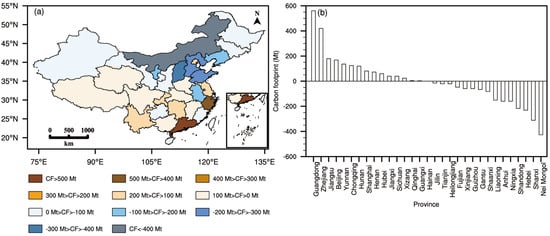
Figure 10.
Net carbon footprint transfer: (a) spatial distribution map; (b) statistical chart.
3.2.2. Transfer of the Sectoral Carbon Footprint
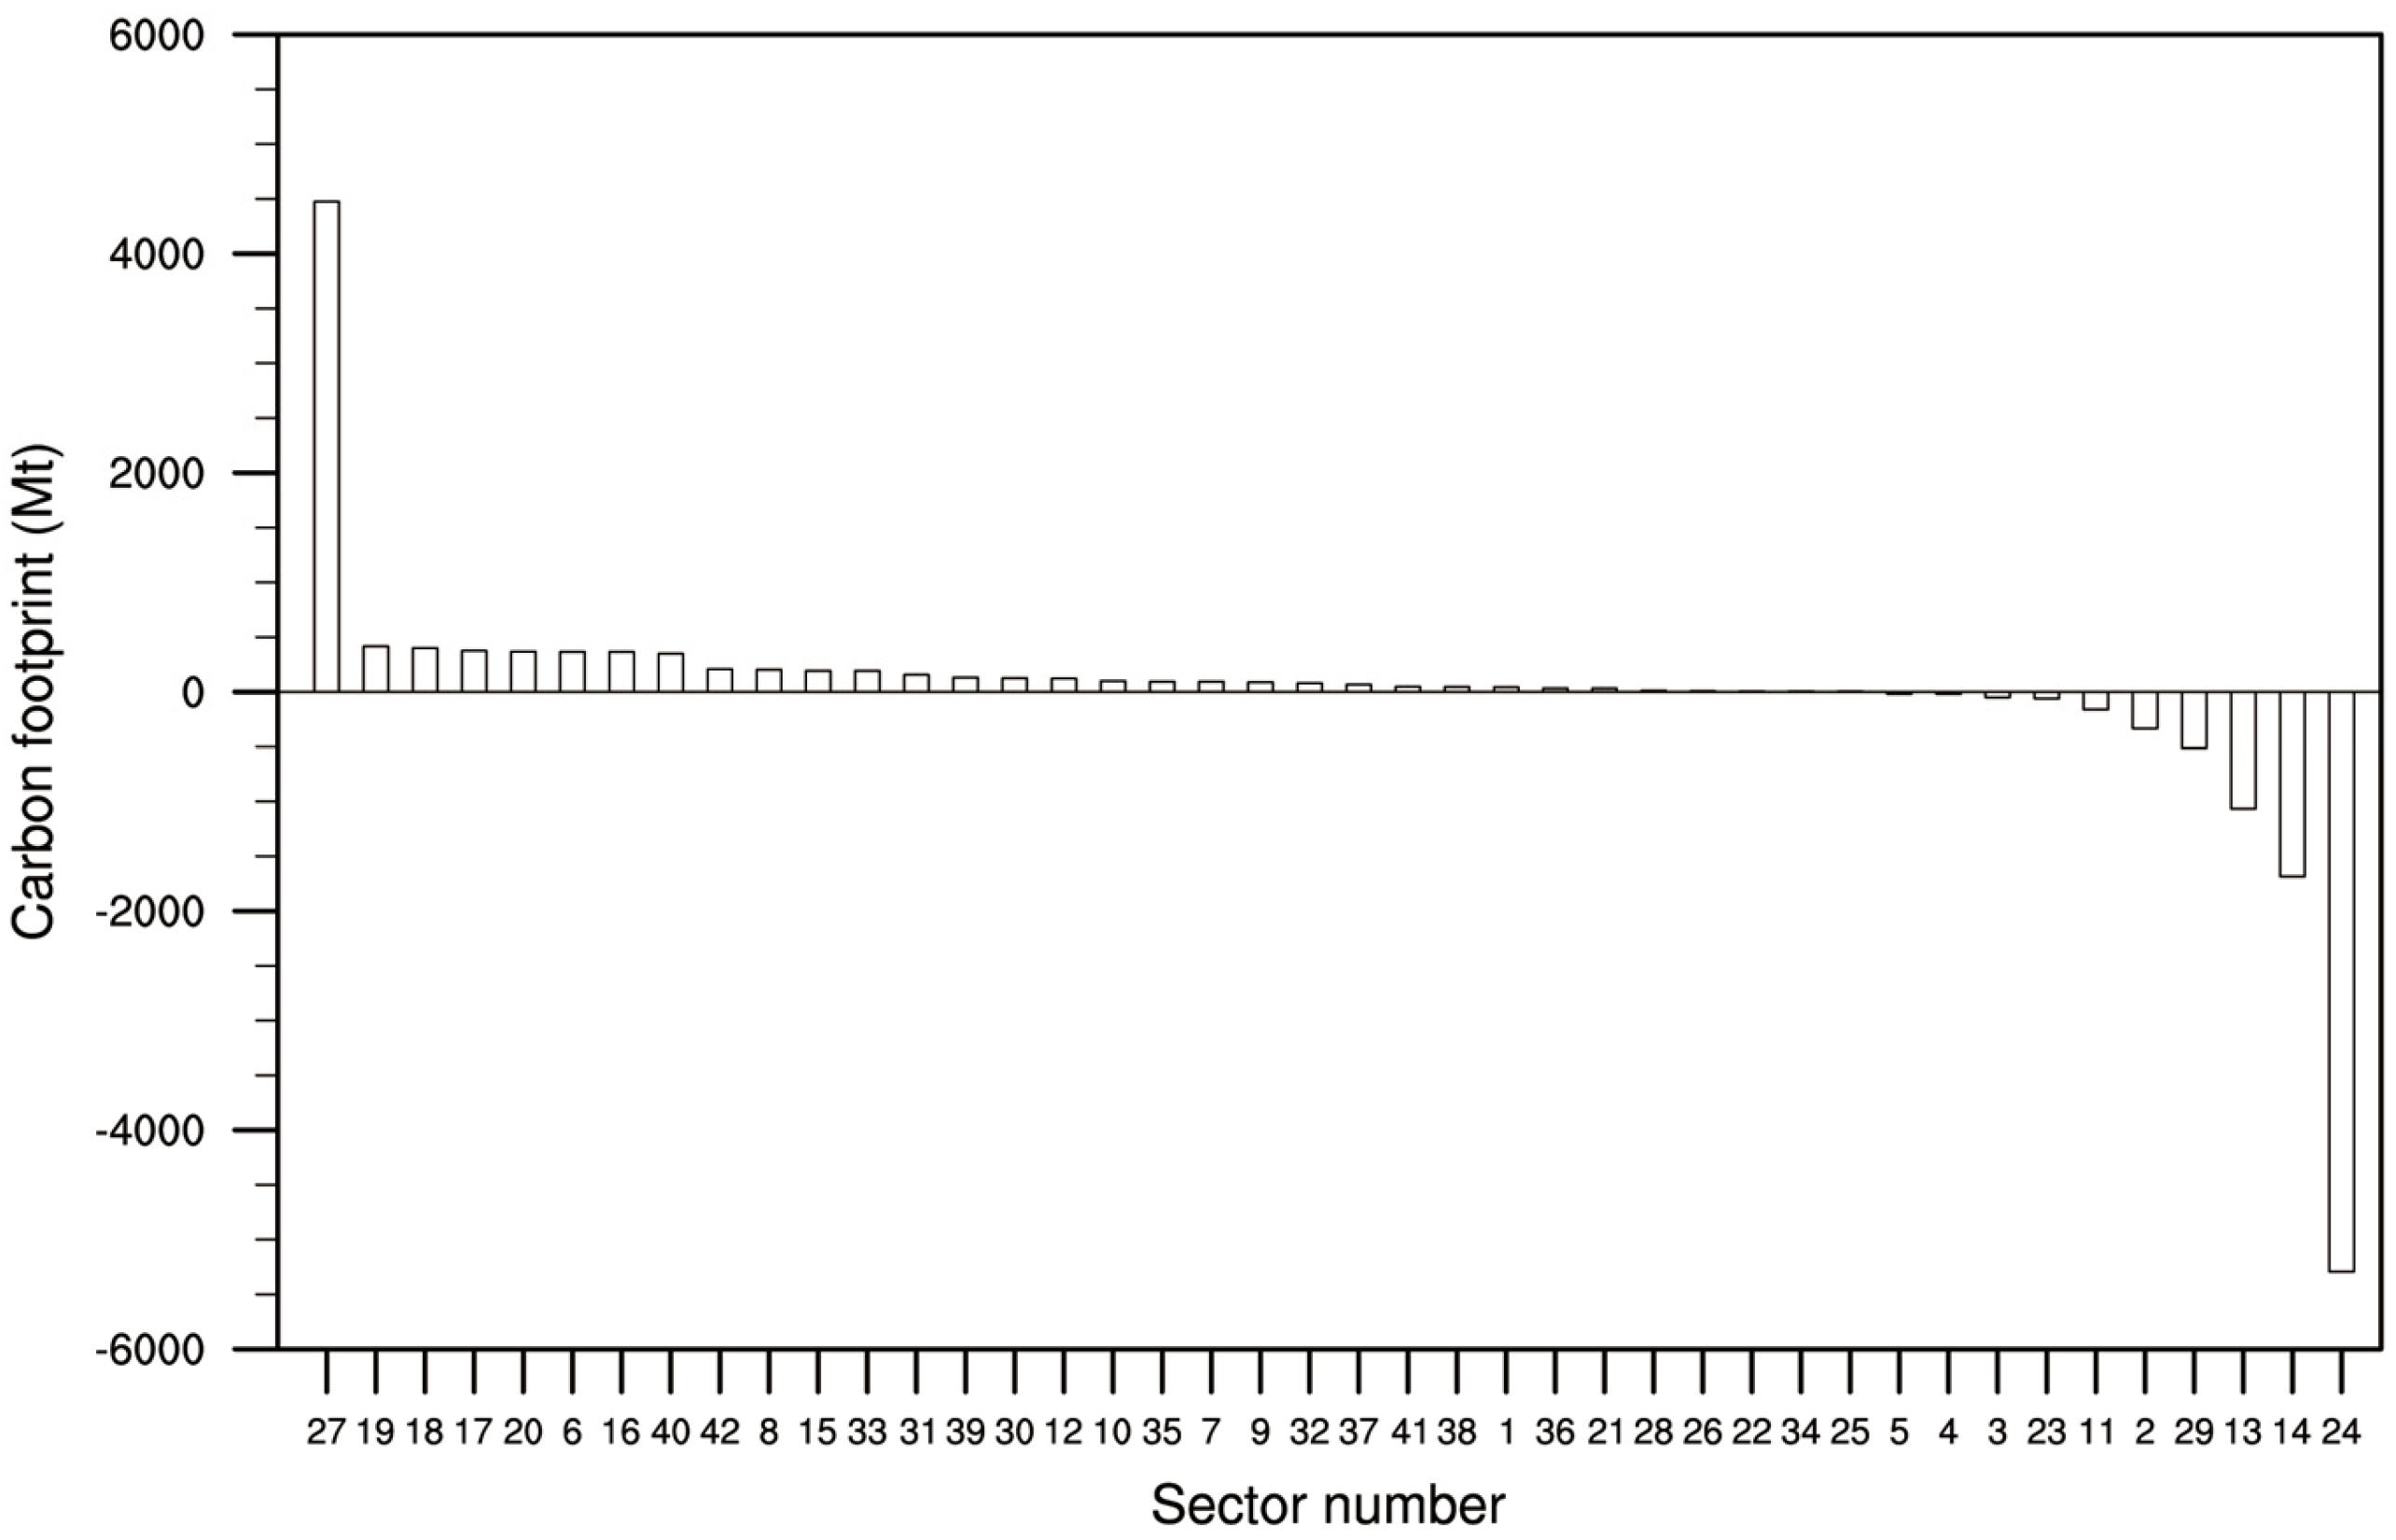
We then calculated the net carbon footprint transfer between different sectors, as shown in Figure 11. Notably, sectors that heavily rely on primary energy exhibited a negative net carbon footprint transfer, and they mainly functioned as producers. The sectors of construction, manufacture of electrical machinery and equipment, and the manufacture of transport equipment consumed goods produced by other sectors during production. Thus, these sectors featured a positive net carbon footprint transfer, and they largely fulfilled the role of consumers. Overall, the carbon footprint was transferred from high-consumption sectors to sectors that are highly dependent on primary energy.
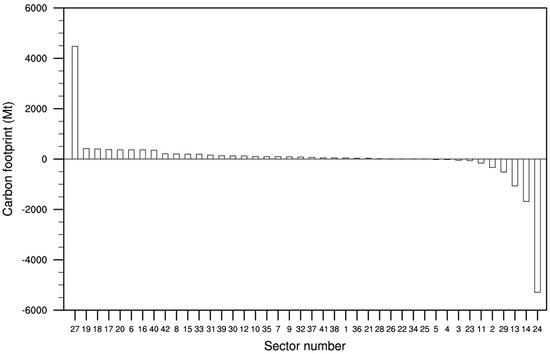
Figure 11.
Distribution of the net carbon footprint transfer of 42 sectors.
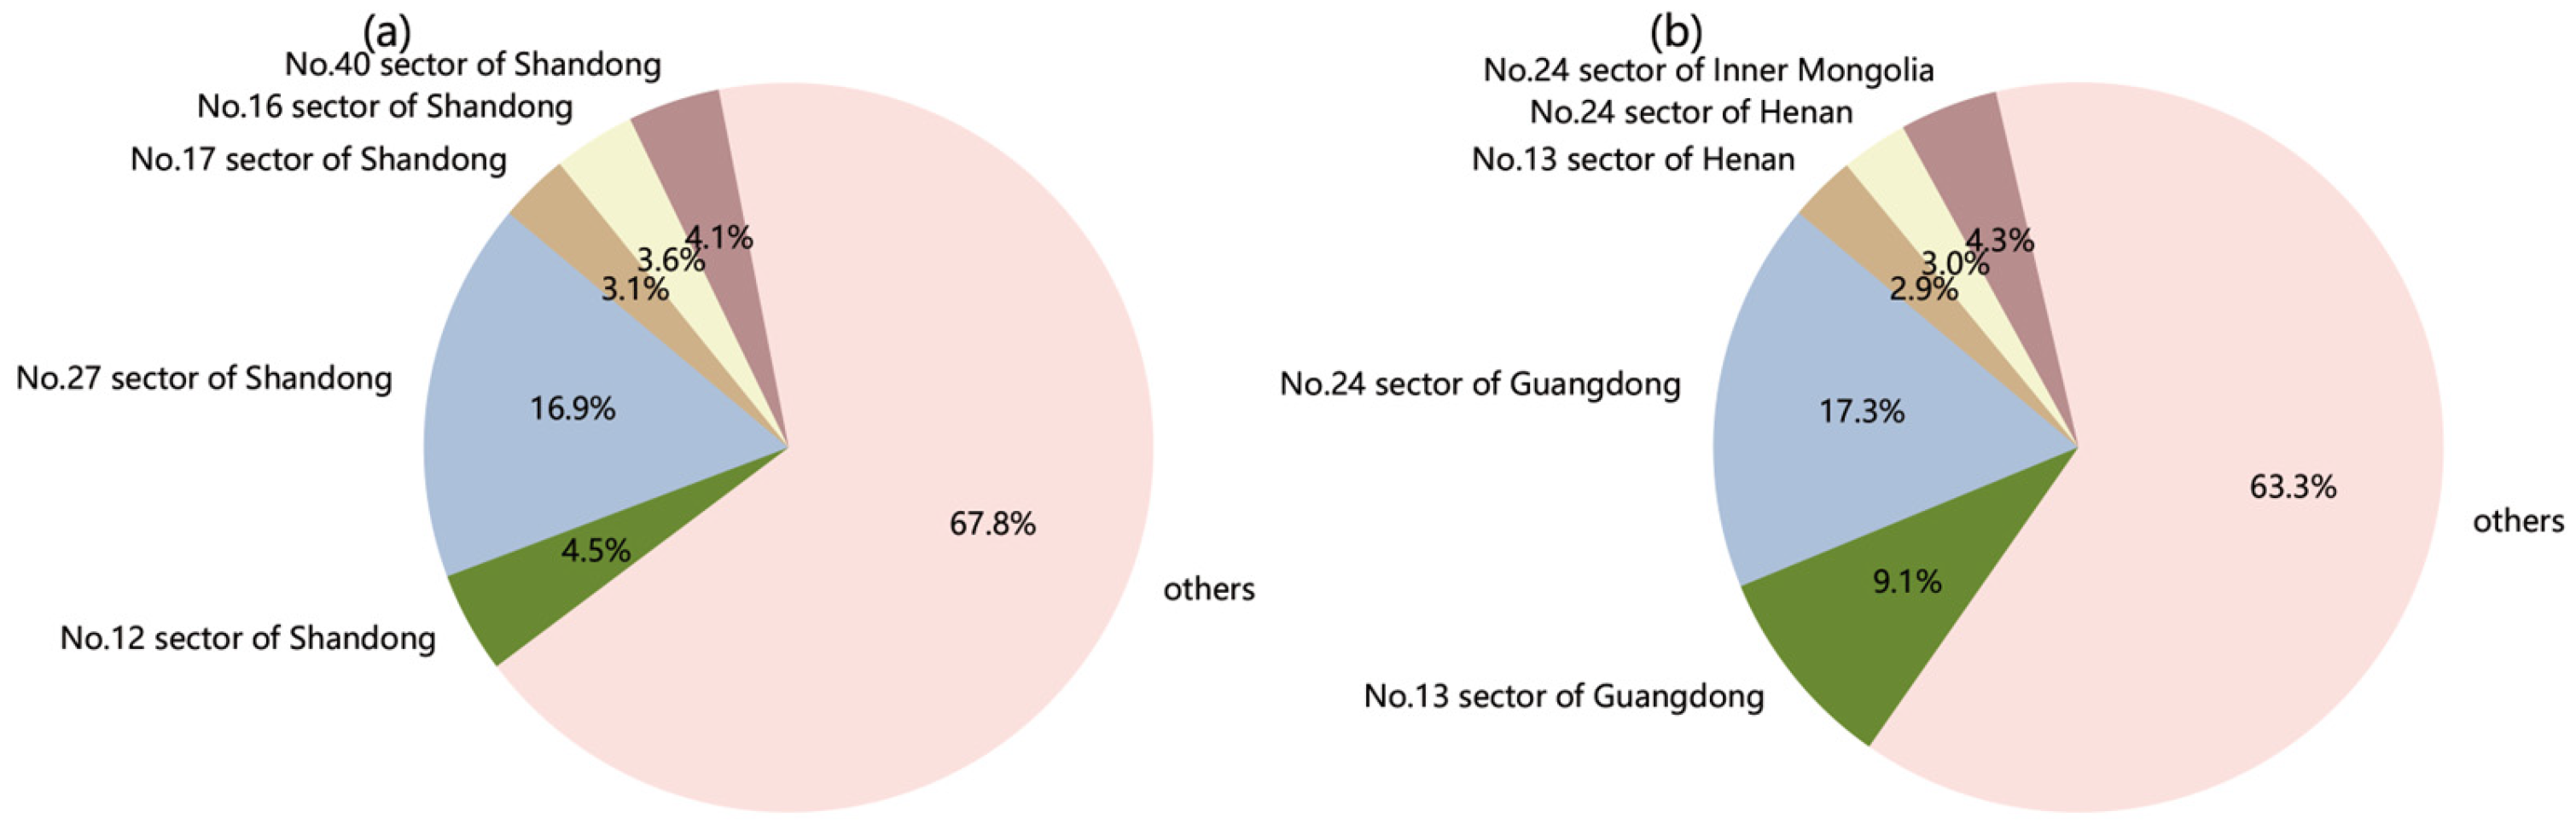
Next, we analyzed the specific direction of carbon footprint transfer in and out for each sector in each province. The main sectors with the largest carbon footprints transferred in were the production and distribution of electric power and heat power sector of various provinces. The production and distribution of electric power and heat power sectors of Shandong and Inner Mongolia, as well as the smelting and processing of metals sector of Hebei Province, ranked among the top three. The production and distribution of electric power and heat power sectors of Jiangsu, Henan, Shanxi, Anhui, Zhejiang, Hebei, and Guangdong also had a relatively high carbon footprint transfer in. For the production and distribution of electric power and heat power sector in Shandong, the main sources of carbon footprint transferred in were the construction (16.9%), manufacture of chemical products (4.5%), health care and social work (4.1%), manufacture of general purpose machinery (3.6%), and manufacture of special purpose machinery (3.1%) sectors of Shandong (Figure 12a). It can be seen that the top carbon footprint sources transferred to the production and distribution of electric power and heat power sector in Shandong were mainly other sectors in Shandong.
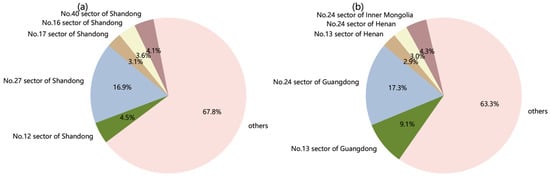
Figure 12.
(a) The sources of carbon footprints transferred in the production and distribution of electric power and heat power sector of Shandong; (b) the destination of carbon footprints transferred in the construction sector of Guangdong.
The sectors with the largest carbon footprints transferred out were the construction sectors of various provinces, such as Guangdong, Shandong, Jiangsu, Henan, and Hebei. The construction sector in Guangdong was the sector with the largest carbon footprint transferred out, mainly to the production and distribution of electric power and heat power sector in Guangdong (17.3%), manufacture of non-metallic mineral products sector in Guangdong (9.1%), production and distribution of electric power and heat power sector in Inner Mongolia (4.3%), production and distribution of electric power and heat power sector in Henan (3.0%), and manufacture of non-metallic mineral products sector in Henan (2.9%) (Figure 12b). Therefore, the carbon footprints of Guangdong’s construction sector were mainly transferred to other sectors, not only Guangdong, but also in other provinces.
4. Conclusions
In our study, the MRIO model was combined with a high-precision CO2 emission inventory inverted using the CCMVS-R system to calculate the carbon footprints of 31 provinces and 42 sectors in China in 2021, considering production, consumption, and shared responsibility principles. On the basis of the shared responsibility principle, reasonable emission reduction suggestions were provided. Then, the direction of carbon footprint transfer was analyzed.
The total carbon footprint was 12,032.69 Mt. The spatial distribution of the carbon footprint was heterogeneous. Provinces with well-developed industries and high energy consumption levels, such as Shandong, Hebei, and Inner Mongolia, exhibited high carbon footprints on the production side, whereas provinces with well-developed economies, high living standards, and large populations, such as Guangdong, Shandong, and Jiangsu, presented high carbon footprints on the consumption side. Under the shared responsibility principle, which accounts for the interests and responsibilities of both producers and consumers, Shandong, Guangdong, and Jiangsu exhibited the largest carbon footprints, and they faced a high pressure to reduce emissions. Accelerating the innovation of production technology, increasing production efficiency, promoting carbon emissions trading markets, encouraging carbon labeling, and utilizing carbon-inclusive platforms are all reasonable measures. Provinces with small carbon footprints can exploit their geographical and resource advantages to help other provinces reduce emissions and develop their own economies.
The distributions of the carbon footprints were also heterogeneous across sectors. The production-side carbon footprints of sectors highly dependent on primary energy consumption were relatively large. Construction, the production and distribution of electric power and heat power, and the manufacture of electrical machinery and equipment sectors presented the largest carbon footprints under the consumption responsibility principle. In these sectors, products provided by other sectors are typically consumed to meet in-sector production needs. The production and distribution of electric power and heat power, construction, and smelting and processing of metals sectors exhibited the largest carbon footprints under the shared responsibility principle. These high-carbon-emitting sectors should receive increased attention, and improving production technology, optimizing the industrial structure, using clean energy, and strengthening resource recycling are all reasonable methods.
The net carbon footprint transfer of 15 provinces was positive, while the remaining 16 provinces showed a negative net carbon footprint transfer. Overall, carbon footprints were transferred from economically developed but resource-scarce regions to industrially developed and resource-rich regions, followed by transfer from economically developed regions to neighboring regions.
After a high-precision emission inventory is obtained, the MRIO model can be adopted to accurately calculate the distribution and transfer direction of carbon footprints, so as to formulate more reasonable emission reduction measures. This helps to reduce greenhouse gas emissions, enhance public awareness of environmental protection, and coordinate efforts across regions to address climate change. Through effective carbon footprint management, we can move towards a greener, low-carbon, and sustainable future. In the future, with more high-precision CGHGNET ground observation data added to the CCMVS-R system, we will be able to obtain more accurate anthropogenic carbon emission inventories and carbon footprint distributions.
Author Contributions
Conceptualization, X.Z., L.G. and J.Z.; methodology, J.L., X.Z. and L.G.; software, J.L.; validation, J.L. and L.G.; formal analysis, J.L. and L.G.; investigation, J.L., J.Z., L.L., C.W., D.Z., F.Y. and B.P.; resources, X.Z.; data curation, J.Z., L.L., C.W., D.Z., F.Y. and B.P.; writing—original draft preparation, J.L.; writing—review and editing, X.Z. and L.G.; visualization, X.Z.; supervision, X.Z.; project administration, X.Z.; funding acquisition, X.Z. All authors have read and agreed to the published version of the manuscript.
Funding
This research was funded by National Key Research and Development Program of China (2023YFE0204600), National Natural Science Foundation of China (42341202), and Key Innovation Team Project of China Meteorological Administration (CMA2022ZD02).
Data Availability Statement
Dataset available on request from the authors (due to legal reasons).
Acknowledgments
The authors are grateful to all groups and organizations that provided the data used in this study. We want to acknowledge China’s Greenhouse Gas Observation Network (CGHGNET) for providing China’s high-precision ground-based CO2 observational data.
Conflicts of Interest
The authors declare no conflicts of interest.
Appendix A
Table A1.
MRIO table [36].
Table A1.
MRIO table [36].
| Output | Intermediate Use | Final Use | Total Output | ||||||||||||||
|---|---|---|---|---|---|---|---|---|---|---|---|---|---|---|---|---|---|
| Region 1 | Region 2 | … | Region m | Region 1 | Region 2 | … | Region m | ||||||||||
| Input | Sector 1 | … | Sector n | Sector 1 | … | Sector n | … | Sector 1 | … | Sector n | |||||||
| Intermediate input | Region 1 | Sector 1 | … | … | … | … | … | ||||||||||
| … | … | … | … | … | … | … | … | … | … | … | … | … | … | … | … | ||
| Sector n | … | … | … | … | |||||||||||||
| Region 2 | Sector 1 | … | … | … | … | … | |||||||||||
| … | … | … | … | … | … | … | … | … | … | … | … | … | … | … | … | ||
| Sector n | … | … | … | … | … | ||||||||||||
| … | … | … | … | … | … | … | … | … | … | … | … | … | … | … | … | … | |
| Region m | Sector 1 | … | … | … | … | … | |||||||||||
| … | … | … | … | … | … | … | … | … | … | … | … | … | … | … | … | ||
| Sector n | … | … | … | … | … | ||||||||||||
| Initial input | … | … | … | … | |||||||||||||
| Total input | … | … | … | … | |||||||||||||
Table A2.
Classification of sectors (the sector names are derived from CEADs, https://www.ceads.net/, accessed on 12 March 2025).
Table A2.
Classification of sectors (the sector names are derived from CEADs, https://www.ceads.net/, accessed on 12 March 2025).
| Sector Number | Sector Name |
|---|---|
| 1 | Agriculture, forestry, animal husbandry, and fishery |
| 2 | Mining and washing of coal |
| 3 | Extraction of petroleum and natural gas |
| 4 | Mining and processing of metal ores |
| 5 | Mining and processing of nonmetal and other ores |
| 6 | Food and tobacco processing |
| 7 | Textile industry |
| 8 | Manufacture of leather, fur, feather, and related products |
| 9 | Processing of timber and furniture |
| 10 | Manufacture of paper, printing, and articles for culture, education, and sport activity |
| 11 | Processing of petroleum, coking, processing of nuclear fuel |
| 12 | Manufacture of chemical products |
| 13 | Manufacture of non-metallic mineral products |
| 14 | Smelting and processing of metals |
| 15 | Manufacture of metal products |
| 16 | Manufacture of general purpose machinery |
| 17 | Manufacture of special purpose machinery |
| 18 | Manufacture of transport equipment |
| 19 | Manufacture of electrical machinery and equipment |
| 20 | Manufacture of communication equipment, computers, and other electronic equipment |
| 21 | Manufacture of measuring instruments |
| 22 | Other manufacturing and waste resources |
| 23 | Repair of metal products, machinery, and equipment |
| 24 | Production and distribution of electric power and heat power |
| 25 | Production and distribution of gas |
| 26 | Production and distribution of tap water |
| 27 | Construction |
| 28 | Wholesale and retail trades |
| 29 | Transport, storage, and postal services |
| 30 | Accommodation and catering |
| 31 | Information transfer, software, and information technology services |
| 32 | Finance |
| 33 | Real estate |
| 34 | Leasing and commercial services |
| 35 | Scientific research |
| 36 | Polytechnic services |
| 37 | Administration of water, environment, and public facilities |
| 38 | Resident, repair, and other services |
| 39 | Education |
| 40 | Health care and social work |
| 41 | Culture, sports, and entertainment |
| 42 | Public administration, social insurance, and social organizations |
References
- Wackernagel, M.; Rees, W.E. Our Ecological Footprint: Reducing Human Impact on the Earth; New Society Publishers: Gabriola Island, BC, Canada, 1996. [Google Scholar]
- Wiedmann, T.; Minx, J. A Definition of ‘Carbon Footprint’; Nova Science Publishers: Hauppauge, NY, USA, 2008; pp. 1–11. [Google Scholar]
- Barthelmie, R.J.; Morris, S.D.; Schechter, P. Carbon neutral Biggar: Calculating the community carbon footprint and renewable energy options for footprint reduction. Sustain. Sci. 2008, 3, 267–282. [Google Scholar] [CrossRef]
- Druckman, A.; Jackson, T. The carbon footprint of UK households 1990–2004: A socio-economically disaggregated, quasi-multi-regional input–output model. Ecol. Econ. 2009, 68, 2066–2077. [Google Scholar] [CrossRef]
- Hertwich, E.G.; Peters, G.P. Carbon Footprint of Nations: A Global, Trade-Linked Analysis. Environ. Sci. Technol. 2009, 43, 6414–6420. [Google Scholar] [CrossRef] [PubMed]
- Larsen, H.N.; Hertwich, E.G. The case for consumption-based accounting of greenhouse gas emissions to promote local climate action. Environ. Sci. Policy 2009, 12, 791–798. [Google Scholar] [CrossRef]
- Kitzes, J.; Galli, A.; Bagliani, M.; Barrett, J.; Dige, G.; Ede, S.; Erb, K.; Giljum, S.; Haberl, H.; Hails, C.; et al. A research agenda for improving national Ecological Footprint accounts. Ecol. Econ. 2009, 68, 1991–2007. [Google Scholar] [CrossRef]
- IPCC. Guidelines for National Greenhouse Gas Inventories. 2006. Available online: https://www.ipcc-nggip.iges.or.jp/public/2006gl/index.html (accessed on 6 March 2025).
- Kenny, T.; Gray, N.F. Comparative performance of six carbon footprint models for use in Ireland. Environ. Impact Assess. 2009, 29, 1–6. [Google Scholar] [CrossRef]
- Padgett, J.P.; Steinemann, A.C.; Clarke, J.H.; Vandenbergh, M.P. A comparison of carbon calculators. Environ. Impact Assess. 2008, 28, 106–115. [Google Scholar] [CrossRef]
- Leontief, W.W. Quantitative input and output relations in the economic systems of the United States. Rev. Econ. Stat. 1936, 18, 105–125. [Google Scholar] [CrossRef]
- Chen, G.; Hadjikakou, M.; Wiedmann, T. Urban carbon transformations: Unravelling spatial and inter-sectoral linkages for key city industries based on multi-region input–output analysis. J. Clean. Prod. 2016, 163, 224–240. [Google Scholar] [CrossRef]
- Kucukvar, M.; Samadi, H. Linking national food production to global supply chain impacts for the energy-climate challenge: The cases of the EU-27 and Turkey. J. Clean. Prod. 2015, 108, 395–408. [Google Scholar] [CrossRef]
- Lenzen, M.; Sun, Y.-Y.; Faturay, F.; Ting, Y.-P.; Geschke, A.; Malik, A. The carbon footprint of global tourism. Nat. Clim. Change 2018, 8, 522–528. [Google Scholar] [CrossRef]
- Weber, C.L.; Matthews, H.S. Quantifying the global and distributional aspects of American household carbon footprint. Ecol. Econ. 2008, 66, 379–391. [Google Scholar] [CrossRef]
- Friedrich, E.; Pillay, S.; Buckley, C.A. Carbon footprint analysis for increasing water supply and sanitation in South Africa: A case study. J. Clean. Prod. 2009, 17, 1–12. [Google Scholar] [CrossRef]
- Schmidt, H.-J. Carbon footprinting, labelling and life cycle assessment. Int. J. Life Cycle Assess. 2009, 14, 6–9. [Google Scholar] [CrossRef]
- Zawartka, P.; Burchart-Korol, D.; Blaut, A. Model of Carbon Footprint Assessment for the Life Cycle of the System of Wastewater Collection, Transport and Treatment. Sci. Rep. 2020, 10, 5799. [Google Scholar] [CrossRef] [PubMed]
- ISO 14067; Carbon Footprint of Products—Requirements and Guidelines for Quantification and Communication. International Organization for Standardization: Geneva, Switzerland, 2012.
- Minx, J.; Peters, G.; Wiedmann, T.; Barrett, J. GHG emissions in the global supply chain of food products. In Proceedings of the International Input–Output Meeting on Managing the Environment, Seville, Spain, 9–11 July 2008. [Google Scholar]
- Dong, X.; Jiang, Q.; Wang, J. Assessing Embodied Carbon Emission and Its Intensities in the ICT Industry: The Global Case. Front. Energy Res. 2021, 9, 685021. [Google Scholar] [CrossRef]
- Sun, Z.; Zhang, Y.; Yu, P.; Zhang, L.; Pang, J. Calculation and Intensity Analysis of Logistics Industry Embodied CO2 Emissions in China. J. Green Econ. Low-Carbon Dev. 2023, 2, 27–35. [Google Scholar] [CrossRef]
- Wang, Z.; Yang, Y.; Wang, B. Carbon footprints and embodied CO2 transfers among provinces in China. Renew. Sust. Energy Rev. 2018, 82, 1068–1078. [Google Scholar] [CrossRef]
- Rypdal, K.; Winiwarter, W. Uncertainties in greenhouse gas emission inventories—Evaluation, comparability and implications. Environ. Sci. Policy 2001, 4, 107–116. [Google Scholar] [CrossRef]
- Zhong, J.; Zhang, X.; Guo, L.; Wang, D.; Miao, C.; Zhang, X. Ongoing CO2 monitoring verify CO2 emissions and sinks in China during 2018–2021. Sci. Bull. 2023, 68, 2467–2476. [Google Scholar] [CrossRef]
- IPCC. Refinement to the 2006 IPCC Guidelines for National Greenhouse Gas Inventories. 2019. Available online: https://www.ipcc.ch/report/2019-refinement-to-the-2006-ipcc-guidelines-for-national-greenhouse-gas-inventories/ (accessed on 6 March 2025).
- Guo, L.; Zhang, X.; Zhong, J.; Wang, D.; Miao, C.; Zhao, L.; Zhou, Z.; Liao, J.; Hu, B.; Zhu, L.; et al. Construction and Application of a Regional Kilometer-Scale Carbon Source and Sink Assimilation Inversion System (CCMVS-R). Engineering 2024, 33, 263–275. [Google Scholar] [CrossRef]
- Li, J.; Zhang, X.; Guo, L.; Zhong, J.; Wang, D.; Wu, C.; Jiang, L. If Some Critical Regions Achieve Carbon Neutrality, How Will the Global Atmospheric CO2 Concentration Change? Remote Sens. 2024, 16, 1486. [Google Scholar] [CrossRef]
- Li, J.; Zhang, X.; Guo, L.; Zhong, J.; Wang, D.; Wu, C.; Li, F.; Li, M. Invert global and China’s terrestrial carbon fluxes over 2019–2021 based on assimilating richer atmospheric CO2 observations. Sci. Total Environ. 2024, 929, 172320. [Google Scholar] [CrossRef]
- Wu, C.-Y.; Zhang, X.-Y.; Guo, L.-F.; Zhong, J.-T.; Wang, D.-Y.; Miao, C.-H.; Gao, X.; Zhang, X.-L. An inversion model based on GEOS-Chem for estimating global and China’s terrestrial carbon fluxes in 2019. Adv. Clim. Change Res. 2023, 14, 49–61. [Google Scholar] [CrossRef]
- Jiang, M.; Liu, L.; Behrens, P.; Wang, T.; Tang, Z.; Chen, D.; Yu, Y.; Ren, Z.; Zhu, S.; Tukker, A.; et al. Improving Subnational Input–Output Analyses Using Regional Trade Data: A Case-Study and Comparison. Environ. Sci. Technol. 2020, 54, 12732–12741. [Google Scholar] [CrossRef] [PubMed]
- Hubacek, K.; Giljum, S. Applying physical input–output analysis to estimate land appropriation (ecological footprints) of international trade activities. Ecol. Econ. 2003, 44, 137–151. [Google Scholar] [CrossRef]
- Weisz, H.; Duchin, F. Physical and monetary input–output analysis: What makes the difference? Ecol. Econ. 2006, 57, 534–541. [Google Scholar] [CrossRef]
- Hasegawa, R.; Kagawa, S.; Tsukui, M. Carbon footprint analysis through constructing a multi-region input–output table: A case study of Japan. J. Econ. Struct. 2015, 4, 5. [Google Scholar] [CrossRef]
- Sun, C.; Ding, D.; Yang, M. Estimating the complete CO2 emissions and the carbon intensity in India: From the carbon transfer perspective. Energy Policy 2017, 109, 418–427. [Google Scholar] [CrossRef]
- Miller, R.E.; Blair, P.D. Input-Output Analysis: Foundations and Extensions; Cambridge University Press: Cambridge, UK, 2009. [Google Scholar]
- Moses, L.N. The stability of interregional trading patterns and input-output analysis. Am. Econ. Rev. 1955, 45, 803–826. [Google Scholar]
- Tukker, A.; Poliakov, E.; Heijungs, R.; Hawkins, T.; Neuwahl, F.; Rueda-Cantuche, J.M.; Giljum, S.; Moll, S.; Oosterhaven, J.; Bouwmeester, M. Towards a global multi-regional environmentally extended input–output database. Ecol. Econ. 2009, 68, 1928–1937. [Google Scholar] [CrossRef]
- Matthews, H.S.; Hendrickson, C.T.; Weber, C.L. The importance of carbon footprint estimation boundaries. Environ. Sci. Technol. 2008, 42, 5839–5842. [Google Scholar] [CrossRef] [PubMed]
- Munksgaard, J.; Pedersen, K.A. CO2 accounts for open economies: Producer or consumer responsibility? Energy Policy 2001, 29, 327–334. [Google Scholar] [CrossRef]
- Serrano, A.; Guan, D.; Duarte, R.; Paavola, J. Virtual Water Flows in the EU27: A Consumption-based Approach. J. Ind. Ecol. 2016, 20, 547–558. [Google Scholar] [CrossRef]
- Marques, A.; Rodrigues, J.; Lenzen, M.; Domingos, T. Income-based environmental responsibility. Ecol. Econ. 2012, 84, 57–65. [Google Scholar] [CrossRef]
- Serrano, M.; Dietzenbacher, E. Responsibility and trade emission balances: An evaluation of approaches. Ecol. Econ. 2010, 69, 2224–2232. [Google Scholar] [CrossRef]
- Grubb, M.; Jordan, N.D.; Hertwich, E.; Neuhoff, K.; Das, K.; Bandyopadhyay, K.R.; van Asselt, H.; Sato, M.; Wang, R.; Pizer, W.A. Carbon Leakage, Consumption, and Trade. Annu. Rev. Env. Resour. 2022, 47, 753–795. [Google Scholar] [CrossRef]
- Peters, G.P.; Hertwich, E.G. CO2 embodied in international trade with implications for global climate policy. Environ. Sci. Technol. 2008, 42, 1401–1407. [Google Scholar] [CrossRef]
- Peters, G.P.; Hertwich, E.G. Post-Kyoto greenhouse gas inventories: Production versus consumption. Clim. Change 2007, 86, 51–66. [Google Scholar] [CrossRef]
- Kondo, Y.; Moriguchi, Y.; Shimizu, H. CO2 emissions in Japan: Influences of imports and exports. Appl. Energy 1998, 59, 163–174. [Google Scholar] [CrossRef]
- Rodrigues, J.; Domingos, T.; Giljum, S.; Schneider, F. Designing an indicator of environmental responsibility. Ecol. Econ. 2006, 59, 256–266. [Google Scholar] [CrossRef]
- Rodrigues, J.; Domingos, T. Consumer and producer environmental responsibility: Comparing two approaches. Ecol. Econ. 2008, 66, 533–546. [Google Scholar] [CrossRef]
- Chen, H.; Wen, J.; Pang, J.; Chen, Z.; Wei, Y. Research on the carbon transfer and carbon equity at provincial level of China based on MRIO model of 31 provinces. China Environ. Sci. 2020, 40, 5540–5550. [Google Scholar] [CrossRef]
- Zou, X. Analysis on the Implied Carbon of China’s Inter Provincial Trade Based on LMID Model. Master’s Thesis, Southwestern University of Finance and Economics, Chengdu, China, 2021. [Google Scholar]
- Zheng, H.; Bai, Y.; Wei, W.; Meng, J.; Zhang, Z.; Song, M.; Guan, D. Chinese provincial multi-regional input-output database for 2012, 2015, and 2017. Sci. Data 2021, 8, 244. [Google Scholar] [CrossRef]
- Shi, M.; Wang, Y.; Zhang, Z.; Zhou, X. Regional Carbon Footprint and Interregional Transfer of Carbon Emissions in China. Acta Geogr. Sin. 2012, 67, 1327–1338. [Google Scholar] [CrossRef]
- Shan, Y.; Huang, Q.; Guan, D.; Hubacek, K. China CO2 emission accounts 2016–2017. Sci. Data 2020, 7, 54. [Google Scholar] [CrossRef]
- Friedlingstein, P.; O’Sullivan, M.; Jones, M.W.; Andrew, R.M.; Gregor, L.; Hauck, J.; Le Quéré, C.; Luijkx, I.T.; Olsen, A.; Peters, G.P.; et al. Global Carbon Budget 2022. Earth Syst. Sci. Data 2022, 14, 4811–4900. [Google Scholar] [CrossRef]
- Wang, W. Calculation on Net Value of Carbon Emission Transfer between China’s Provinces and Responsibility Sharing. J. Environ. Econ. 2018, 3, 19–36. [Google Scholar] [CrossRef]
- Liu, Z. A Multi-Regional Input–Output Analysis of Provincial Responsibility for Carbon Emissions and Carbon Equity of China. Master’s Thesis, Lanzhou University, Lanzhou, China, 2022. [Google Scholar]
- Wang, A.; Feng, Z.; Meng, B. Measure of Carbon Emissions and Carbon Transfers in 30 Provinces of China. J. Quant. Tech. Econ. 2017, 34, 89–104. [Google Scholar] [CrossRef]
- Ma, J.-J.; Du, G.; Xie, B.-C. CO2 emission changes of China’s power generation system: Input-output subsystem analysis. Energy Policy 2019, 124, 1–12. [Google Scholar] [CrossRef]
- Wei, W.; Hao, S.; Yao, M.; Chen, W.; Wang, S.; Wang, Z.; Wang, Y.; Zhang, P. Unbalanced economic benefits and the electricity-related carbon emissions embodied in China’s interprovincial trade. J. Environ. Manage. 2020, 263, 110390. [Google Scholar] [CrossRef] [PubMed]
- Zhang, Y.; Chen, Q.; Chen, B.; Liu, J.; Zheng, H.; Yao, H.; Zhang, C. Identifying hotspots of sectors and supply chain paths for electricity conservation in China. J. Clean. Prod. 2020, 251, 119653. [Google Scholar] [CrossRef]
- Xiao, H. A Comparative Study of Carbon Emission Performance of Secondary and Service Industries: An Empirical Study of Yangtze River Delta Cities. Master’s Thesis, Jinan University, Guangzhou, China, 2019. [Google Scholar]
- Xiao, S. The Research on Calculation and Influence Factors of Carbon Footprint in China’s 30 Provinces. Master’s Thesis, Jiangxi University of Finance and Economics, Nanchang, China, 2015. [Google Scholar]
- Wu, Q. Analysis of Embodied Carbon Emission Flow Network Among Provinces-Industries in China. Master’s Thesis, Xiamen University, Xiamen, China, 2022. [Google Scholar]
- Tian, X.; Chang, M.; Lin, C.; Tanikawa, H. China’s carbon footprint: A regional perspective on the effect of transitions in consumption and production patterns. Appl. Energy 2014, 123, 19–28. [Google Scholar] [CrossRef]
- Li, C.; Ren, Z.; Wang, L. Research on the driving path of carbon inclusive system to green behavior of the public: Based on procedural grounded theory and multiple intermediary model. Environ. Sci. Pollut. Res. 2023, 30, 80393–80415. [Google Scholar] [CrossRef] [PubMed]
- Wang, Z.; Zhang, M.; Su, C.; Zhang, X. Practical Experience and Development Suggestions for Carbon Inclusiveness Mechanism of China. Environ. Prot. 2023, 51, 55–59. [Google Scholar] [CrossRef]
- Min, W. Research on Inter-Provincial Coordinated Governance of China’s Energy Carbon Dioxide Emissions Under the Background of Carbon Neutrality. Ph.D. Thesis, Nanchang University, Nanchang, China, 2023. [Google Scholar]
- Xu, A.; Yang, X. Analysis of total carbon emission of the logistics industry in Guangdong and solutions to emission reduction. E3S Web Conf. 2021, 245, 01020. [Google Scholar] [CrossRef]
- Feng, K.; Siu, Y.L.; Guan, D.; Hubacek, K. Analyzing Drivers of Regional Carbon Dioxide Emissions for China. J. Ind. Ecol. 2012, 16, 600–611. [Google Scholar] [CrossRef]

Disclaimer/Publisher’s Note: The statements, opinions and data contained in all publications are solely those of the individual author(s) and contributor(s) and not of MDPI and/or the editor(s). MDPI and/or the editor(s) disclaim responsibility for any injury to people or property resulting from any ideas, methods, instructions or products referred to in the content. |
© 2025 by the authors. Licensee MDPI, Basel, Switzerland. This article is an open access article distributed under the terms and conditions of the Creative Commons Attribution (CC BY) license (https://creativecommons.org/licenses/by/4.0/).