

A BIM-Based Framework for Life Cycle, Cost, and Circularity Data Integration in Environmental Impact Assessment


Abstract
:1. Introduction
2. Literature Review
2.1. Circularity, Life Cycle Assessment Standards, and End of Life
2.2. BIM—Not a Model but Heterogenous Data
2.3. BIM, Screening, Simplified and Complete LCA Studies
2.4. BIM for Circular Design
2.5. Future Directions for Circularity in Construction
2.6. Towards a Comprehensive Circular Strategy in the Construction Sector
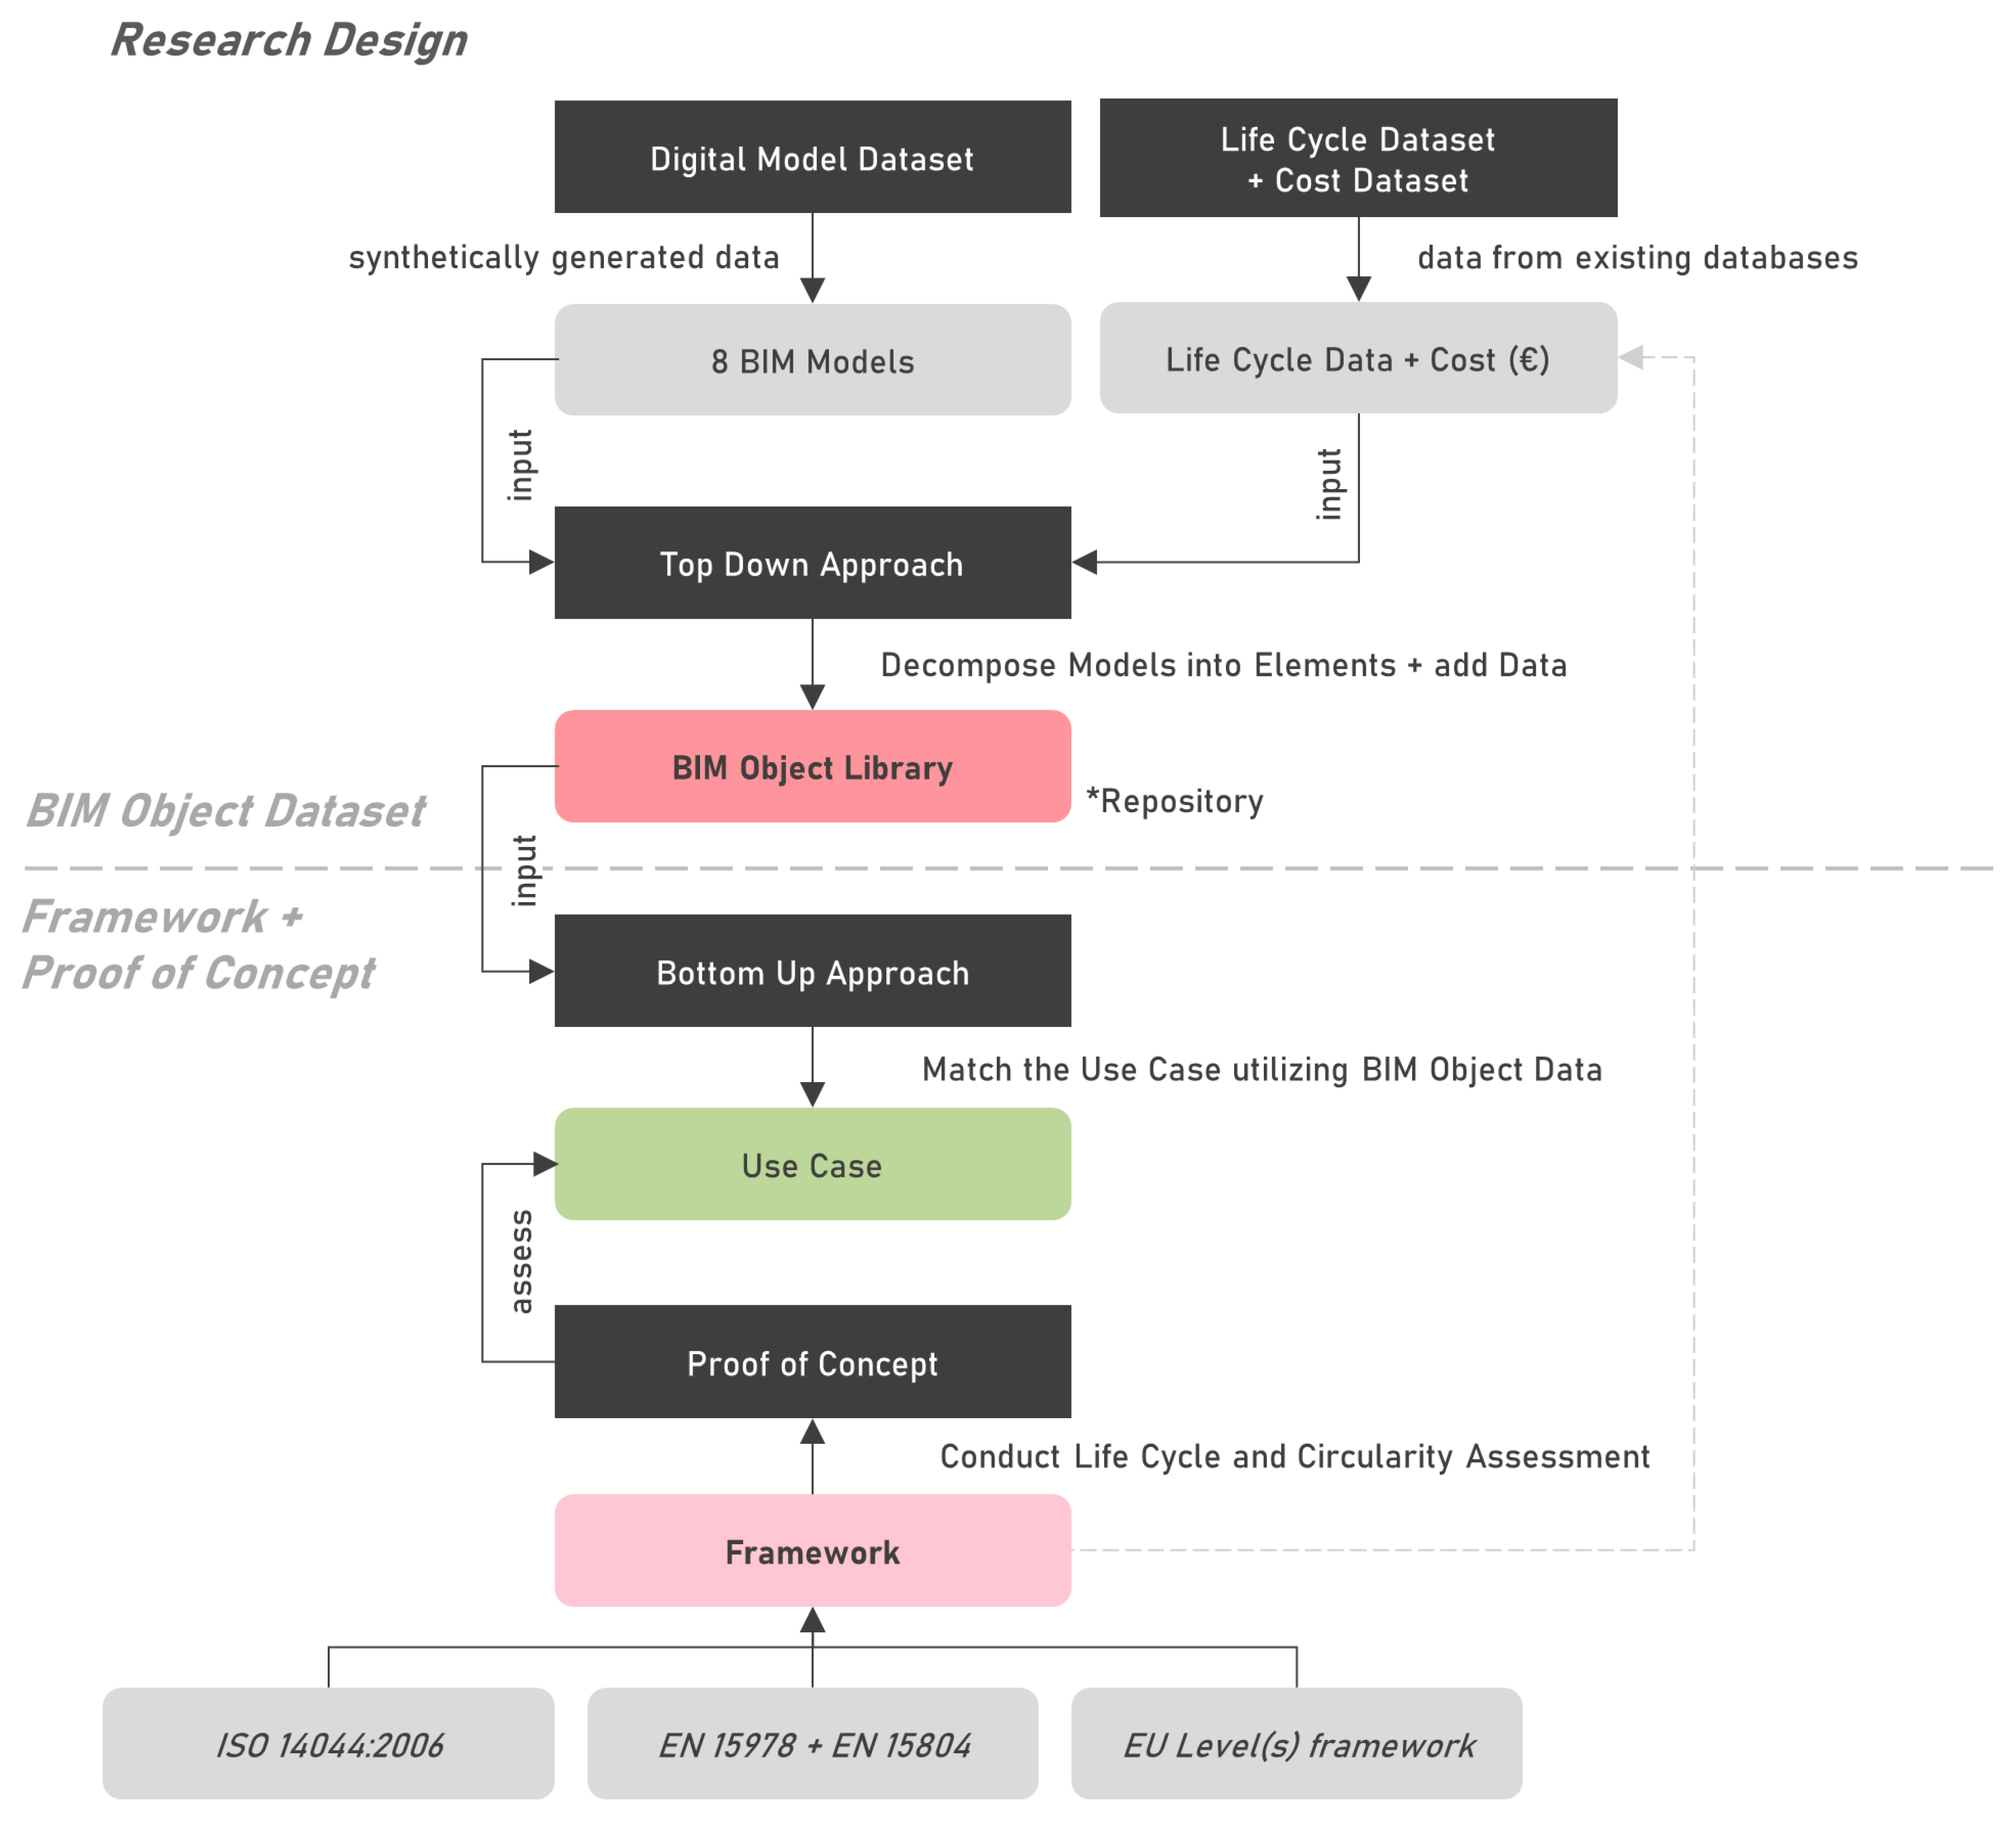
3. Research Design
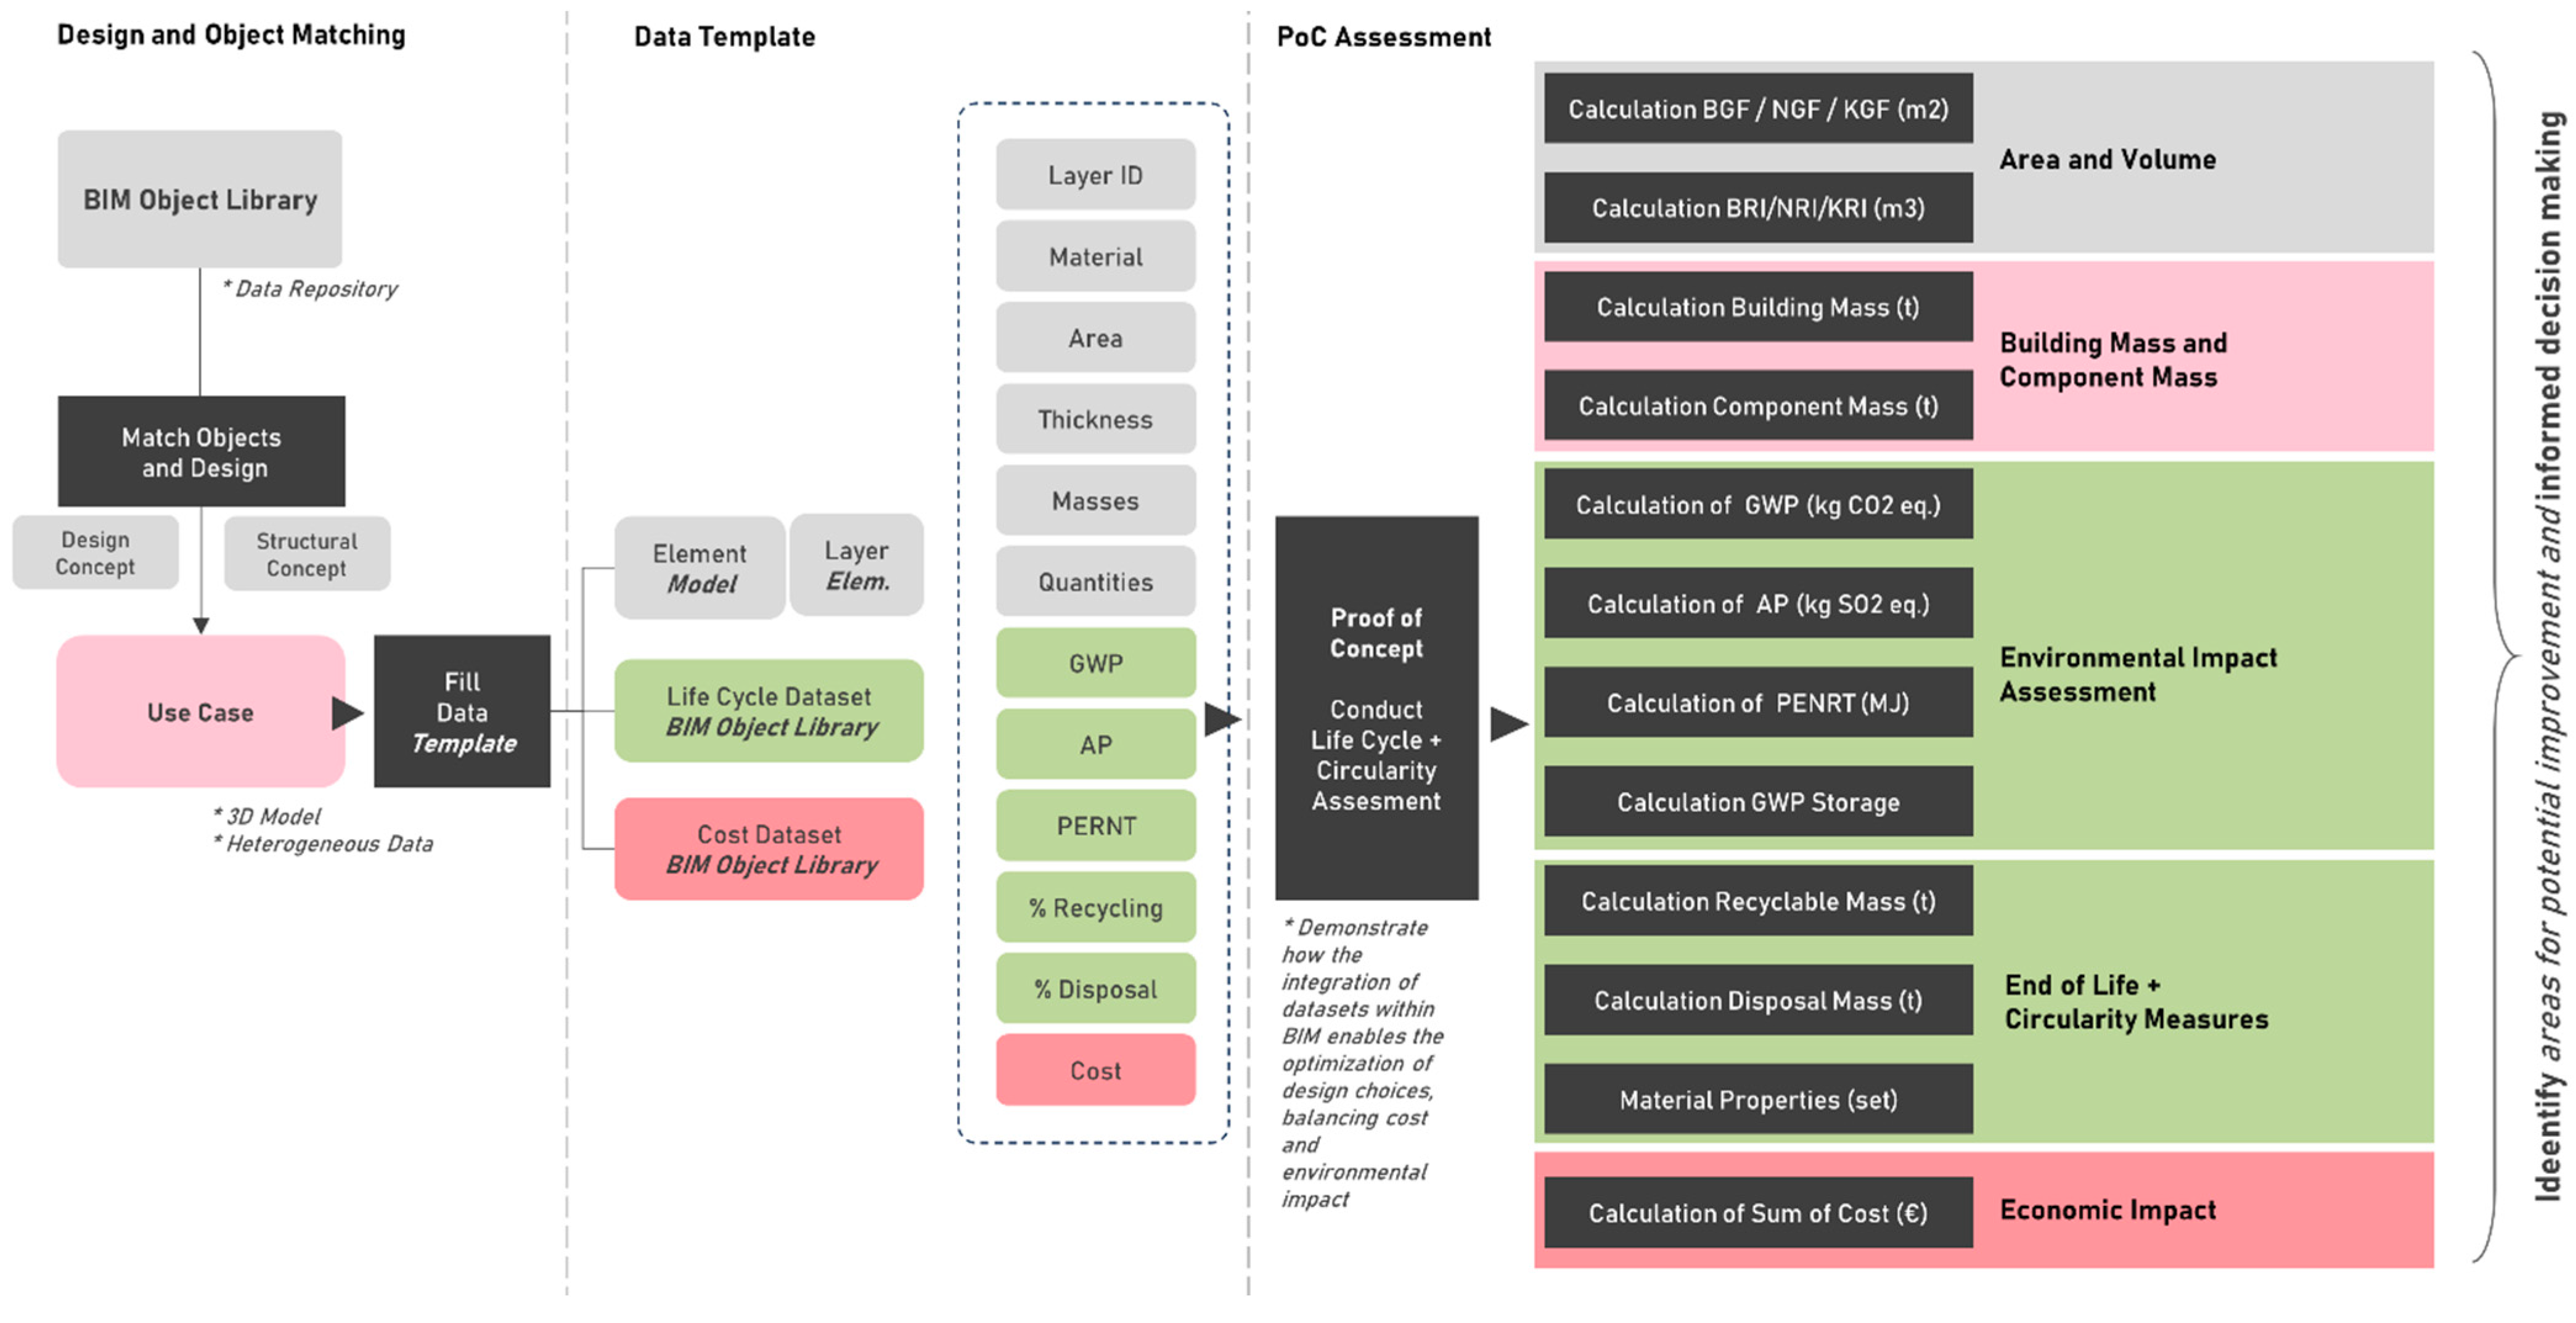
4. Framework
4.1. Data Template

| Category | Calculation/Metric | Units | Standard/Framework | Reference Details |
|---|---|---|---|---|
| Area and Volume | Building Gross Floor Area (GFA) | m2 | EN 15978, ÖNORM B 1800 [76] | Defines total floor area including walls and structural elements. |
| Net Gross Floor Area (NFA) | m2 | Excludes structural elements, considering only usable floor space. | ||
| Construction Gross Floor Area (CFA) | m2 | Floor area used for construction, including structure | ||
| Gross Room Volume (GRV) | m3 | Total enclosed volume of a building, including walls and ceilings. | ||
| Net Room Volume (NRV) | m3 | Usable volume within a building, excluding structural elements. | ||
| Construction Room Volume (CRV) | m3 | Volume used for construction calculations. | ||
| Building Mass and Component Mass | Total Building Mass | tons/kg | EN 15804, EN 15978 | Mass data used in building-level and component-level LCA stages. |
| Building Mass after 100 Years | tons/kg | EN 15978 | Relevant for assessing impacts over the life cycle and future material needs. | |
| Individual Component Masses | tons/kg | EN 15804 | Supports environmental assessments of specific materials and their life cycle impacts. | |
| Environmental Impact Assessment | GWP(100) (Global Warming Potential) | kg CO2 equivalent | ISO 14044, EN 15804, EN 15978, EU Level(s) | Core LCA metric for assessing climate impact across product and building levels. |
| AP (Acidification Potential) | kg SO2 equivalent | ISO 14044, EN 15804, EN 15978 | Used in impact assessments to quantify acidification in product and building LCA. | |
| PENRT (Primary Energy Non-Renewable Total) | MJ | ISO 14044, EN 15804, EN 15978 | Reflects non-renewable energy use, integral in environmental impact analysis. | |
| GWP Storage | kg CO2 equivalent | EN 15804, EU Level(s) | Assesses CO2 sequestration potential within materials, contributing to GWP balance. | |
| EoL and Circularity Measures | Recyclable Mass | tons/kg | EN 15804, EN 15978, EU Level(s) | Critical for EoL analysis, assessing recyclability within LCA. |
| Disposal Mass | tons/kg | EN 15804, EN 15978 | Used to evaluate end-of-life disposal impacts and circularity metrics. | |
| Material Properties | descriptive | EN 15804, EU Level(s) | Describes attributes influencing circularity, EoL recovery, and reuse. | |
| Economic and Regulatory Impact | Cost | € | EN 15978, EU Level(s) | Supports life cycle cost (LCC) assessments and economic evaluations in LCA. |
4.2. Key Metrics and Assessment
5. Proof of Concept
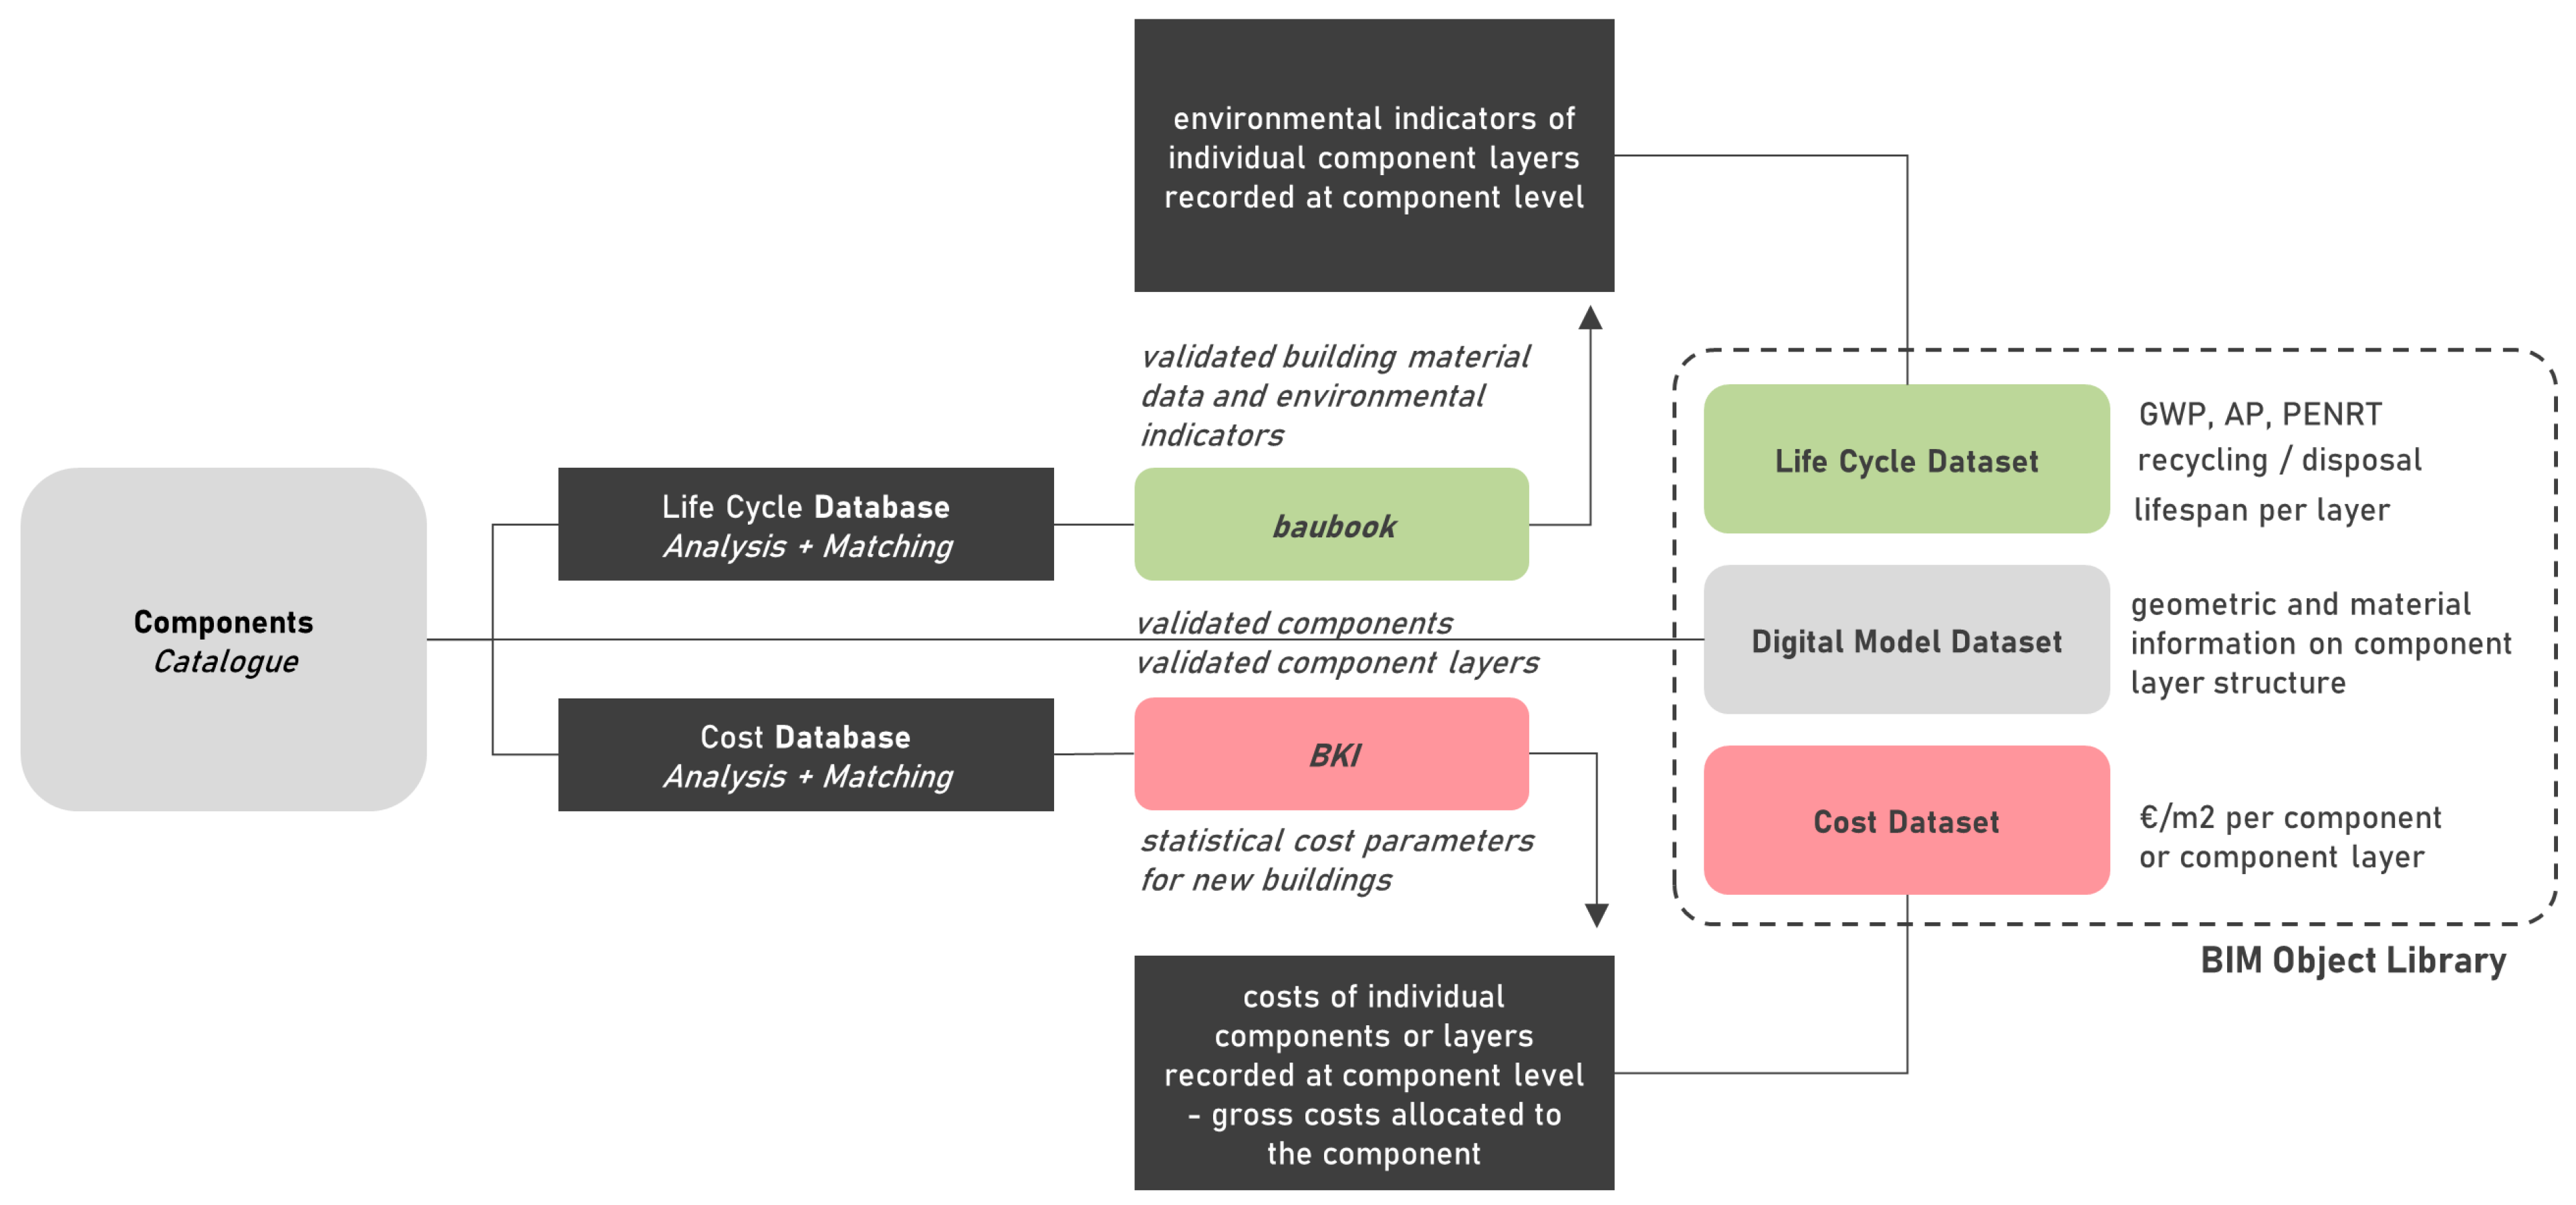
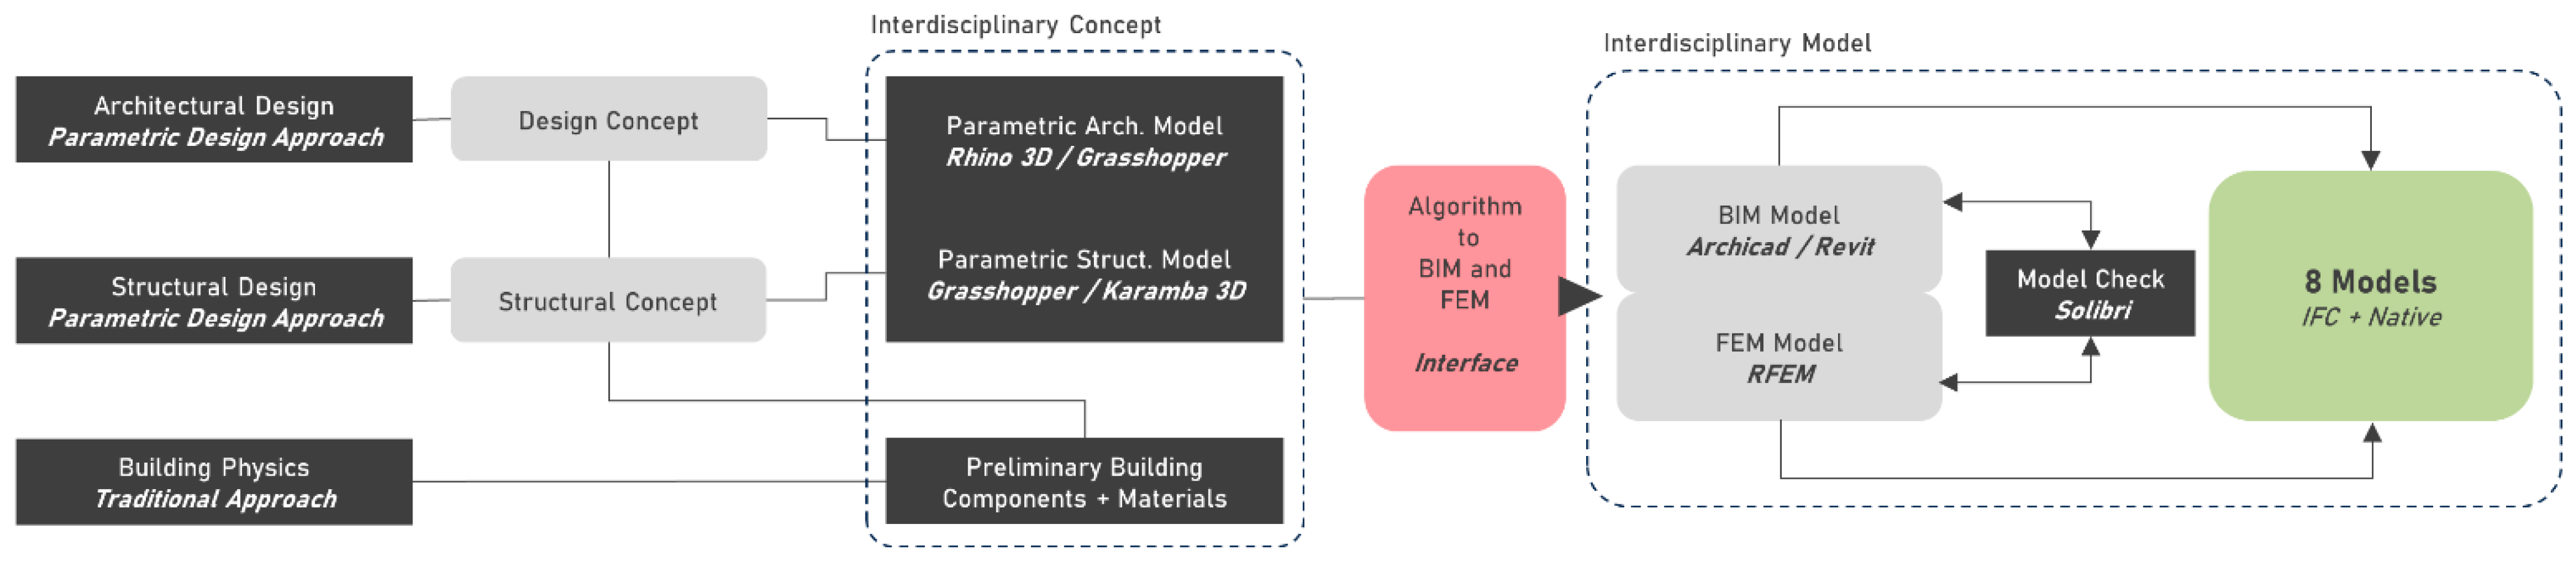
5.1. Digital Model Dataset (Component Catalogue)
5.2. Environmental Impact—Life Cycle Dataset
5.3. Cost Dataset
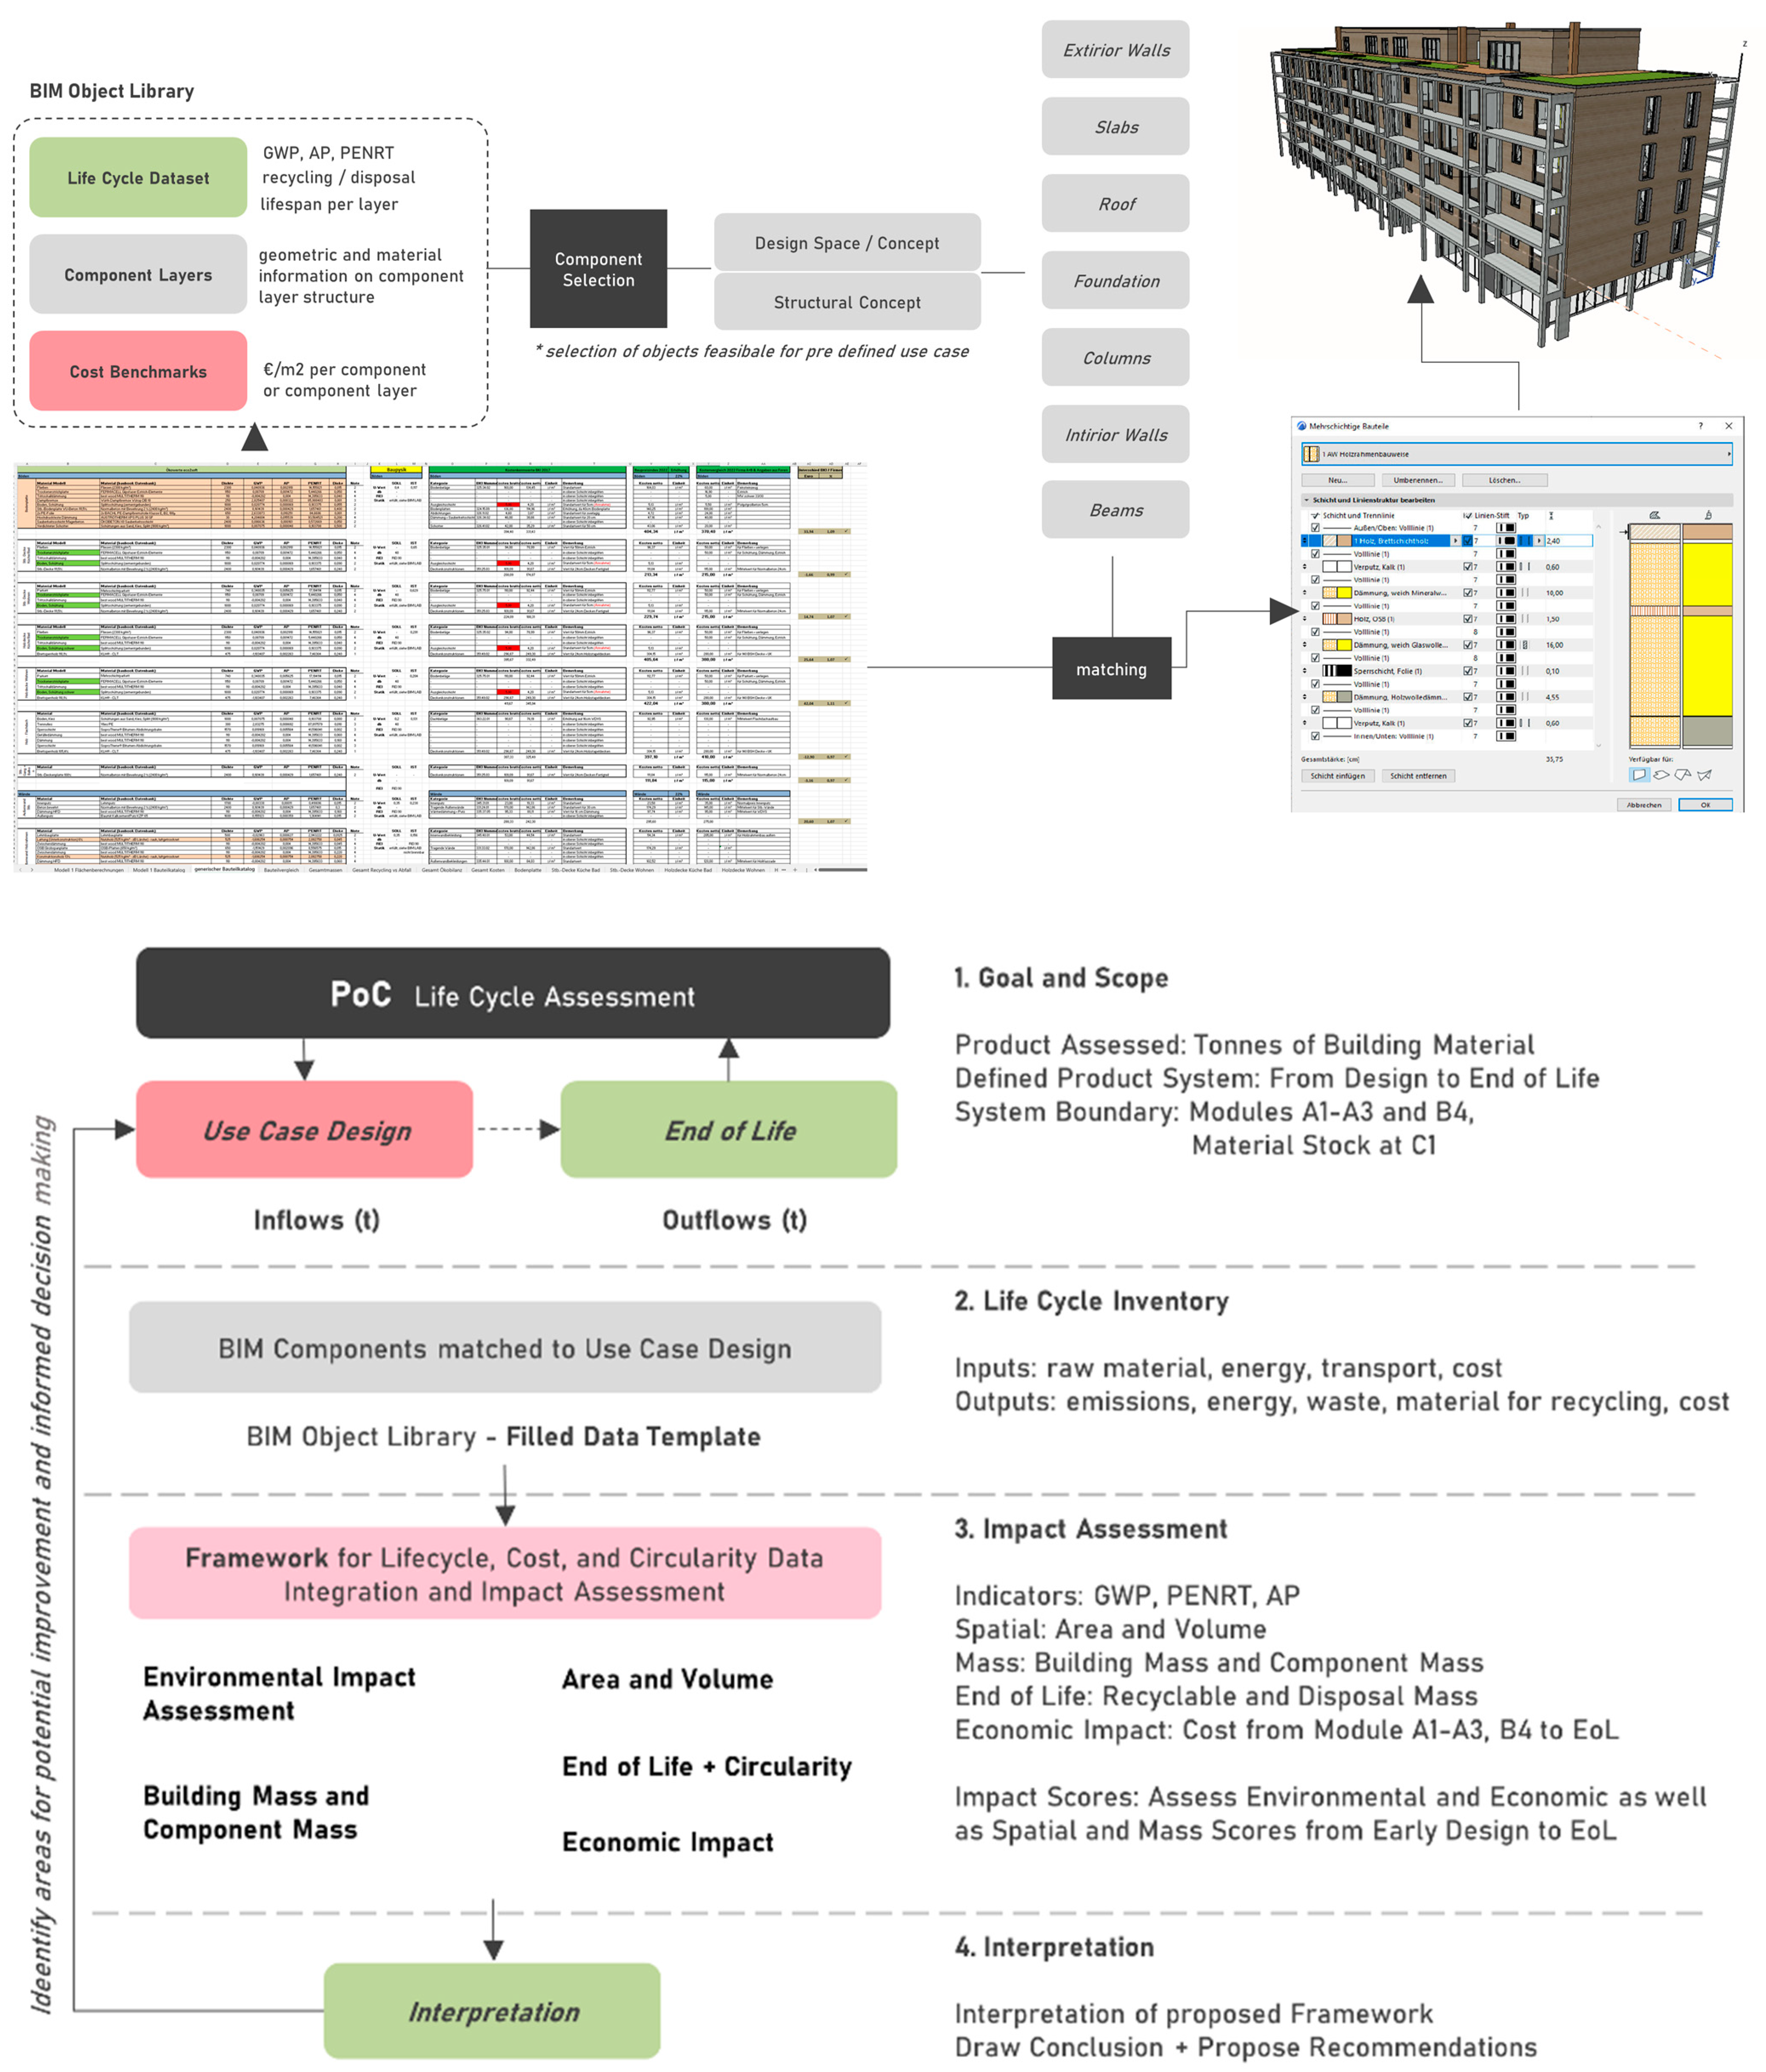
5.4. Proof of Concept—Life Cycle Assessment
- Goal and Scope, which defines the assessment boundaries from design to end-of-life: Product Assessed: Construction materials measured in tons; Product System: Covers the life cycle of one building in design and EoL. System Boundary: Includes Modules A1–A3 (product stage), B4 (replacement stage), and material stock at C1, C3 and C4 (end-of-life).
- Life Cycle Inventory, which uses BIM to integrate life cycle data: Identifies inputs: raw materials, energy, transport, cost; Tracks outputs: emissions, energy use, waste, recycling potential, cost; BIM components are matched to the use case design, ensuring data consistency; BIM object library acts as a data repository.
- Impact Assessment, evaluating Impact Scores are calculated based on environmental, economic, spatial, and material mass assessments.
- Interpretation and synthesizing of results.
6. Results
6.1. Area and Volume
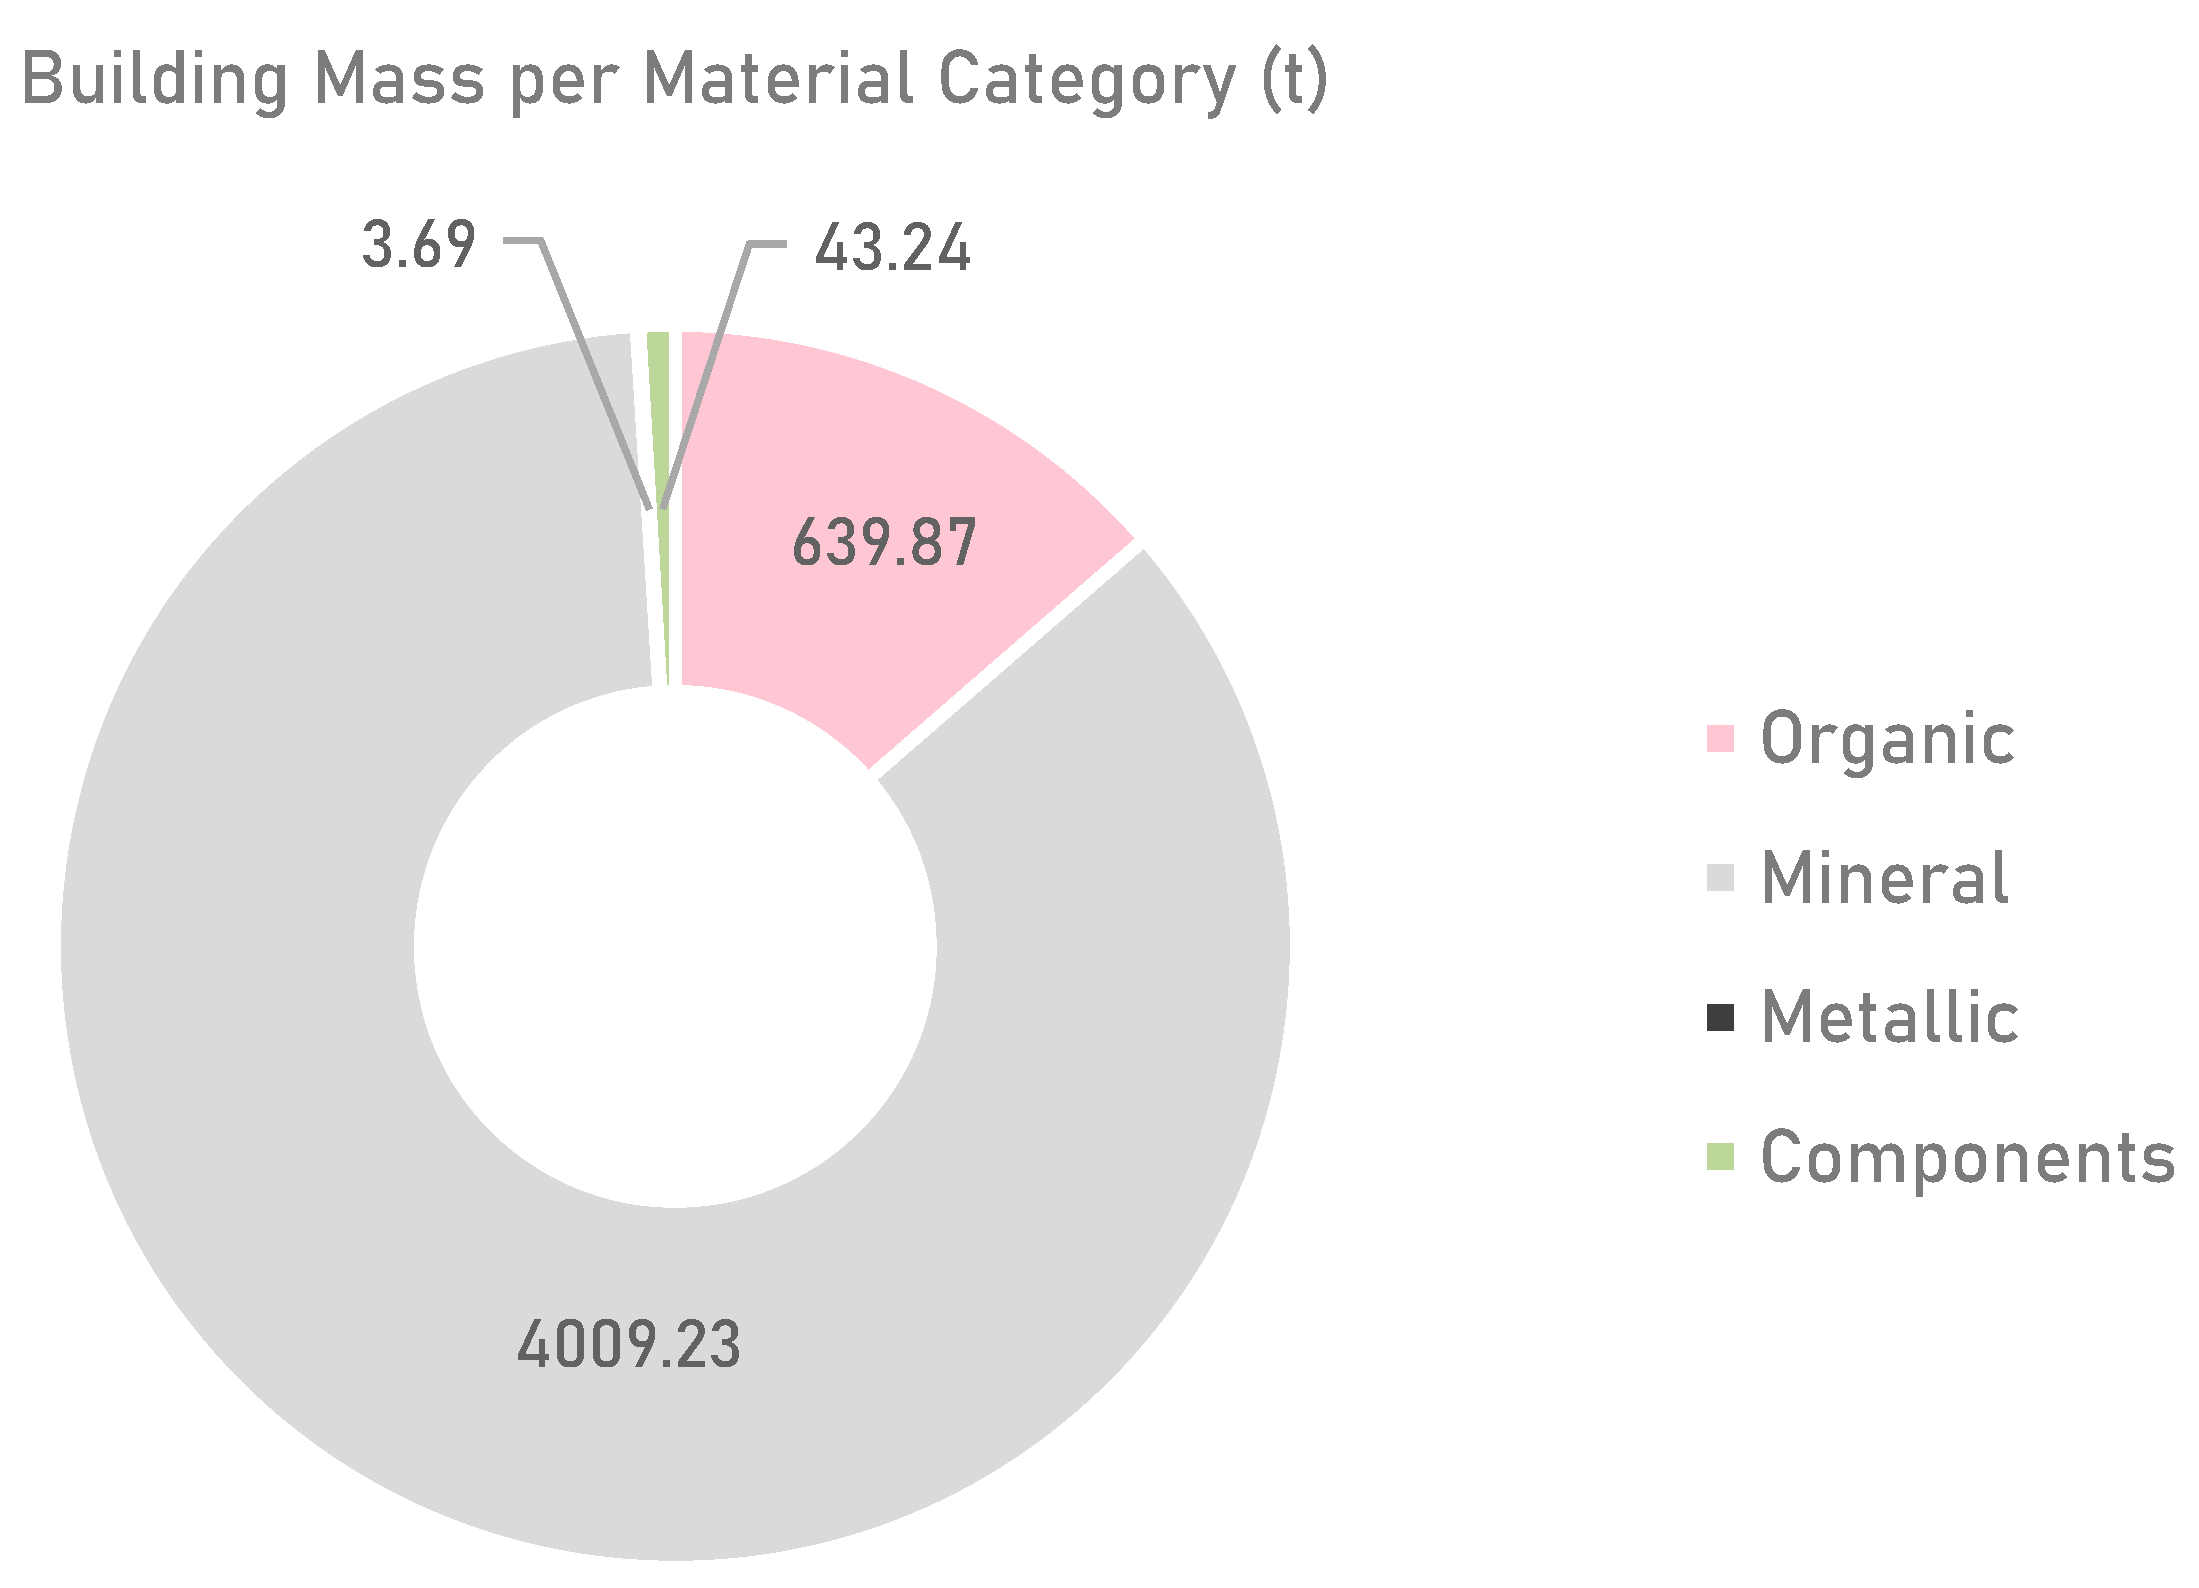
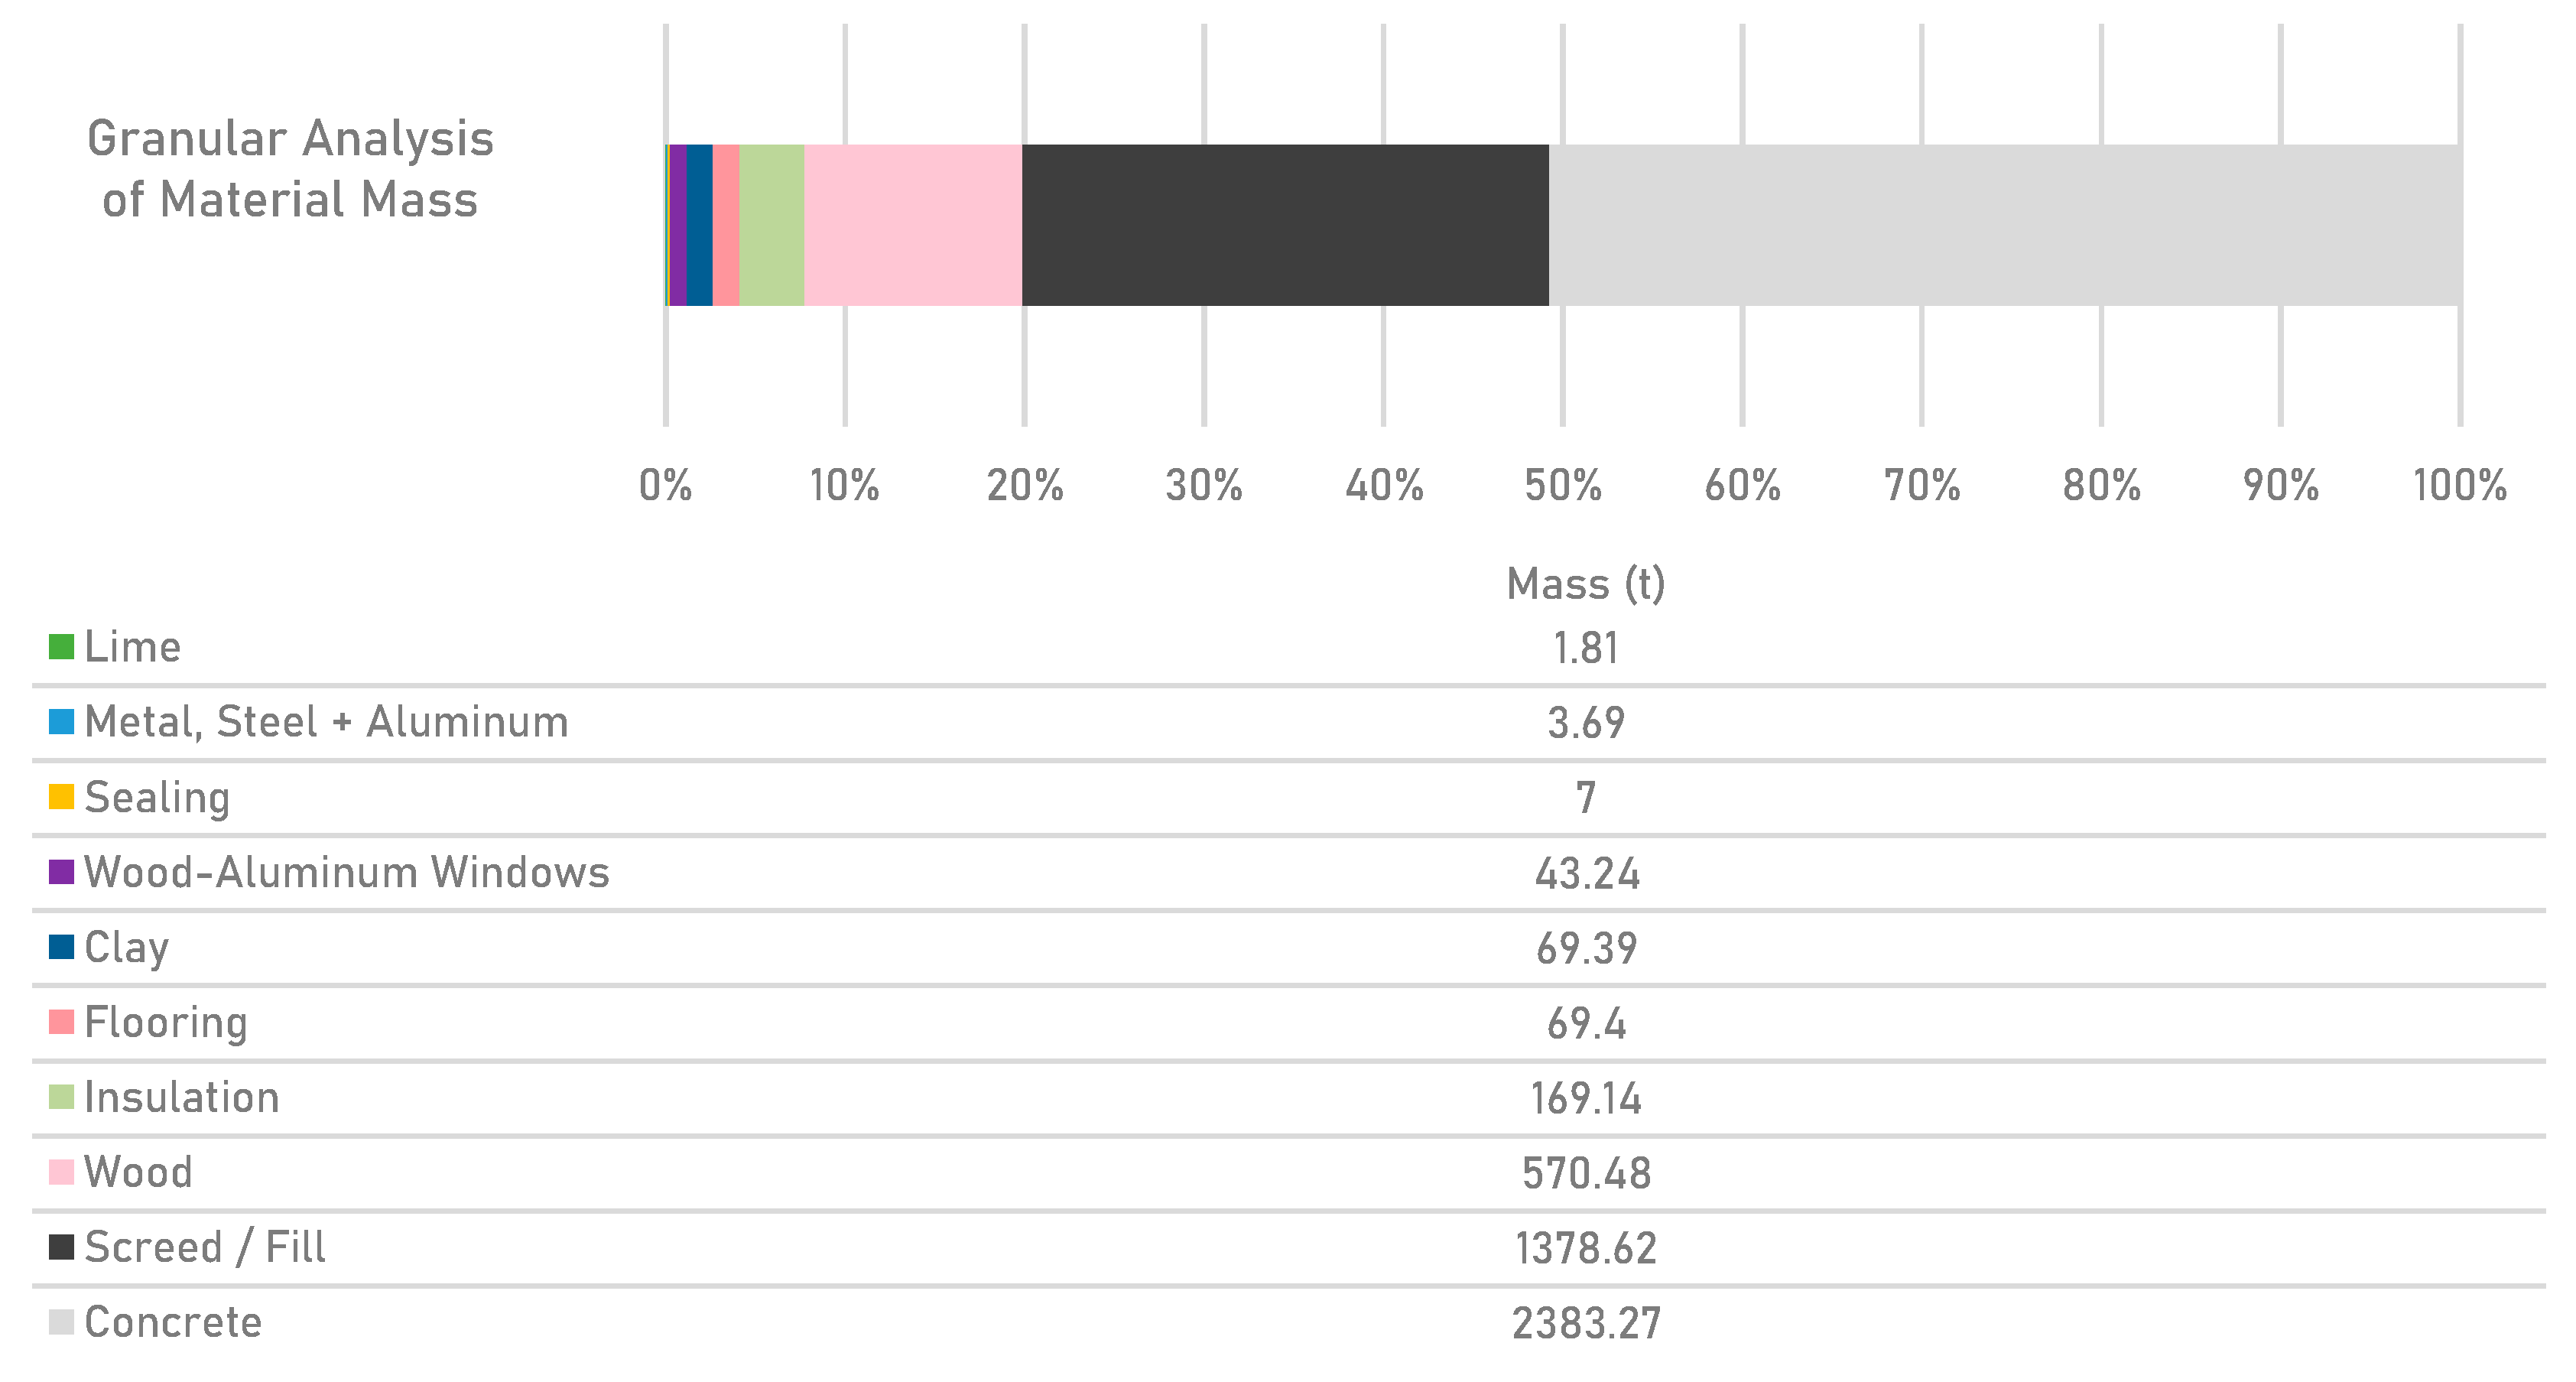
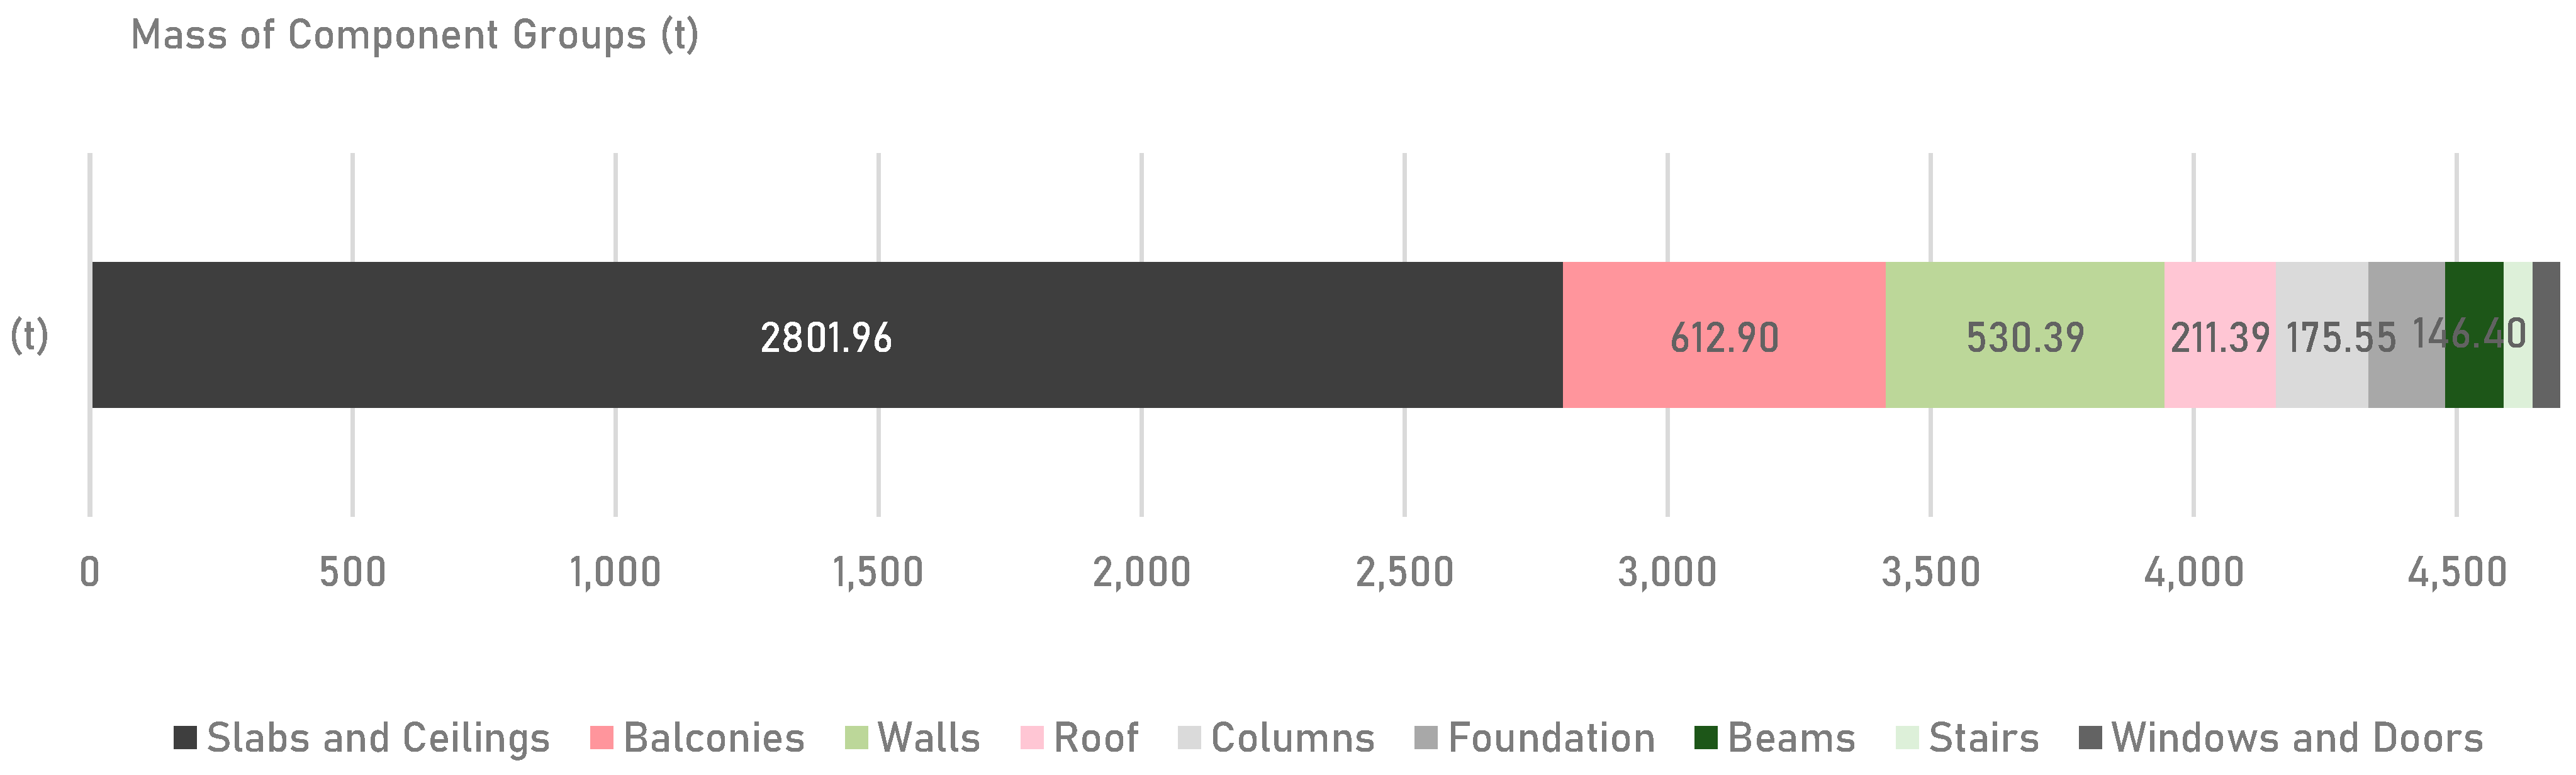
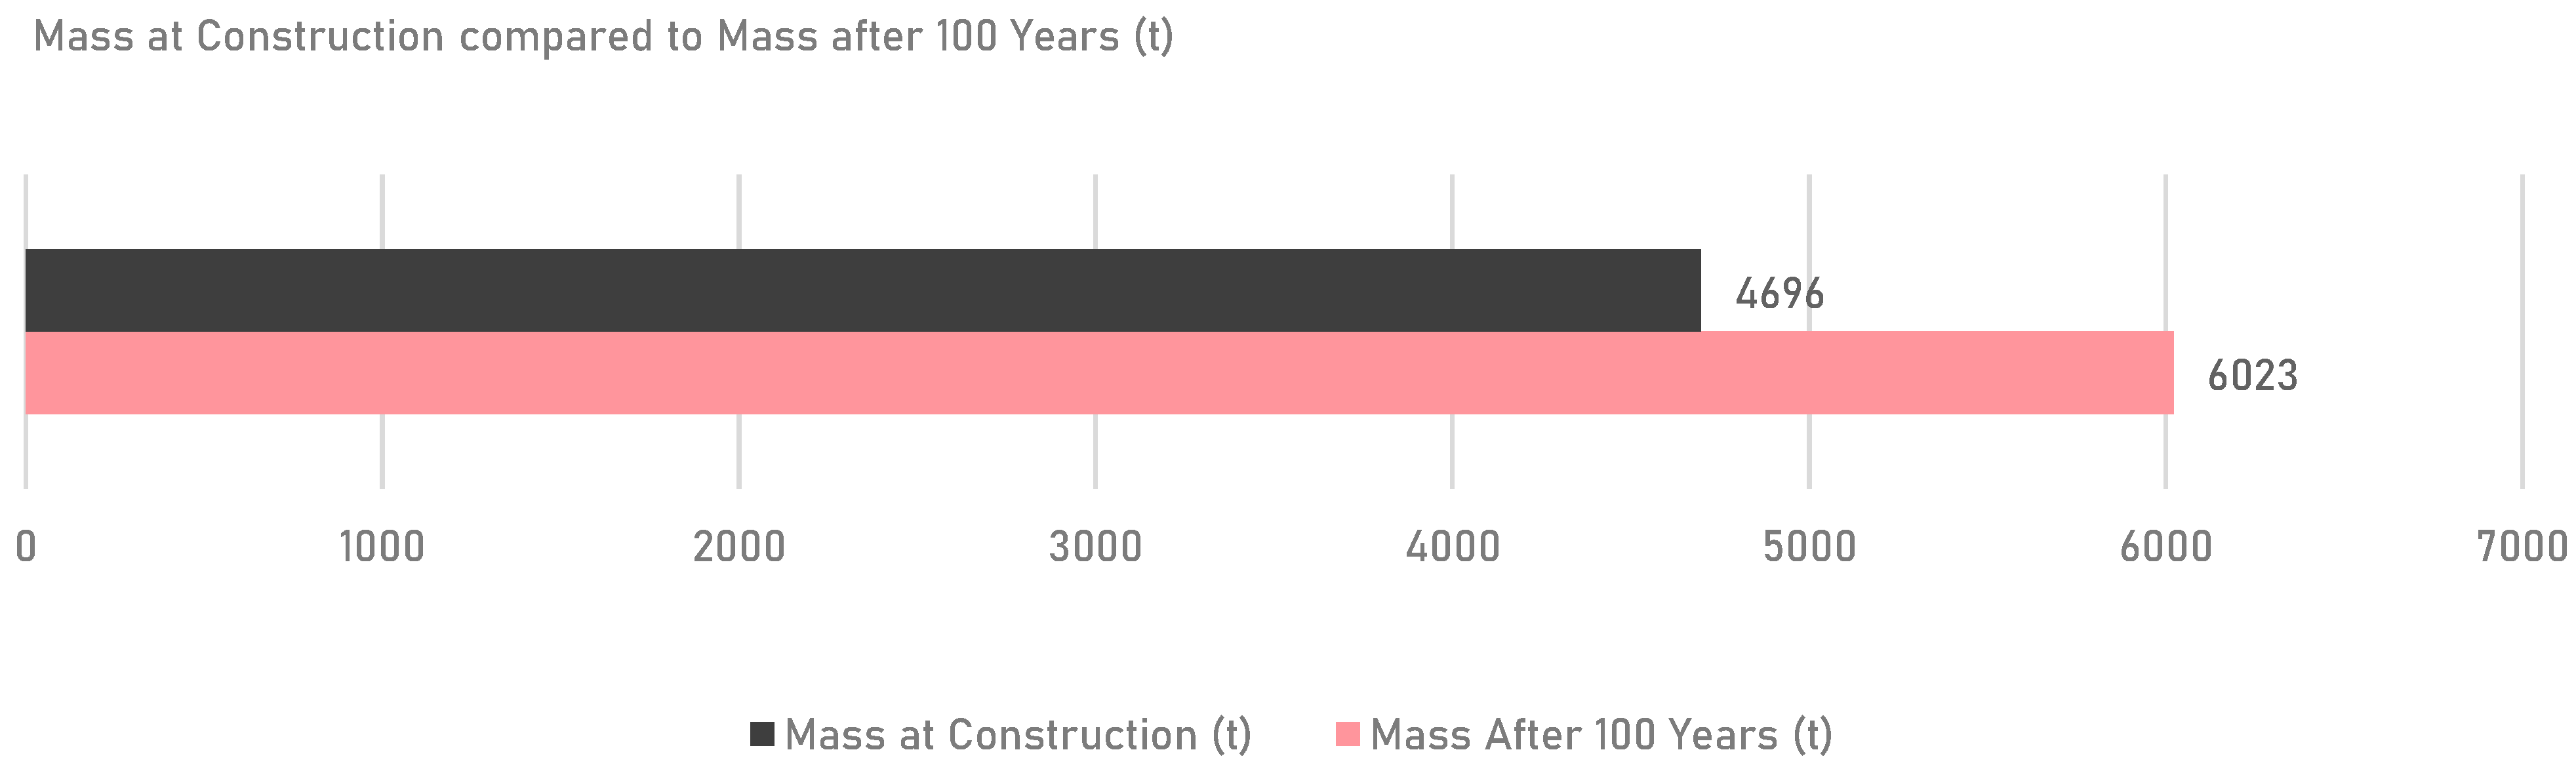
6.2. Building Mass and Component Mass
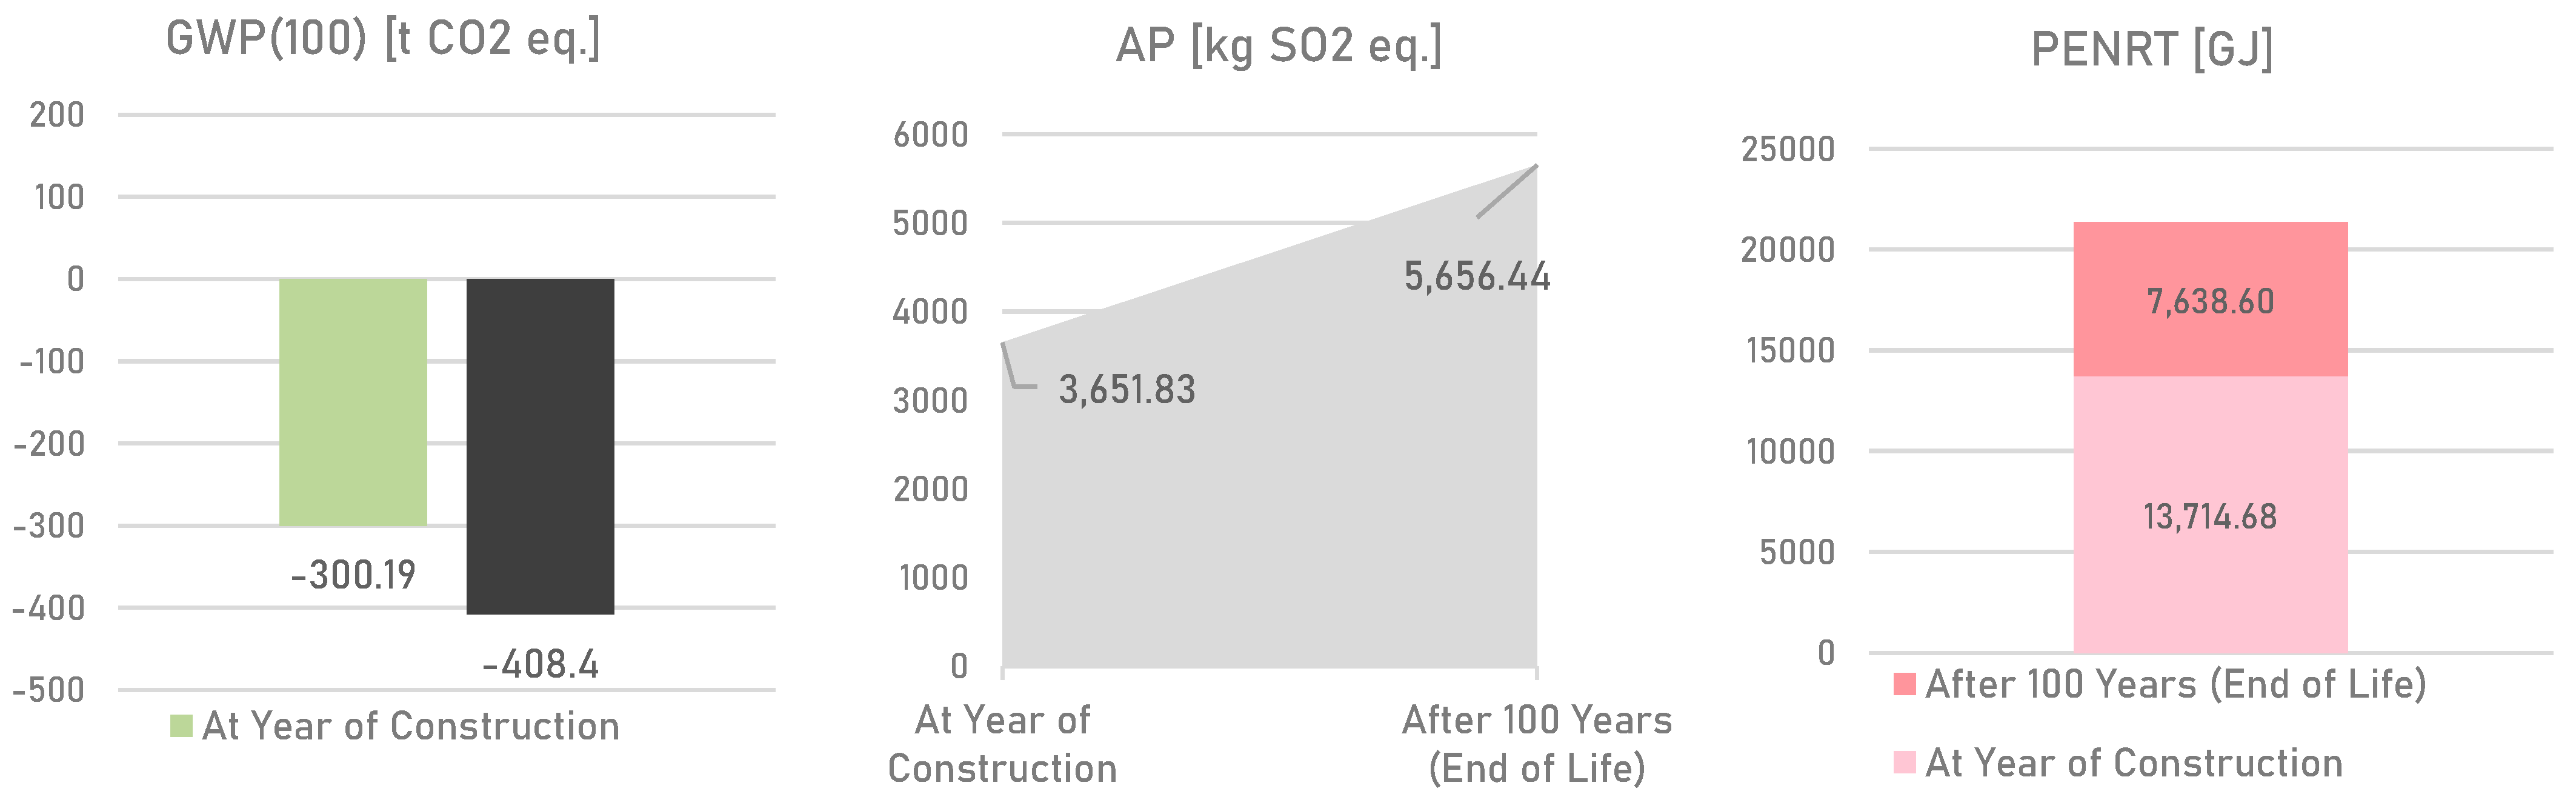
6.3. Environmental Impact Assessment
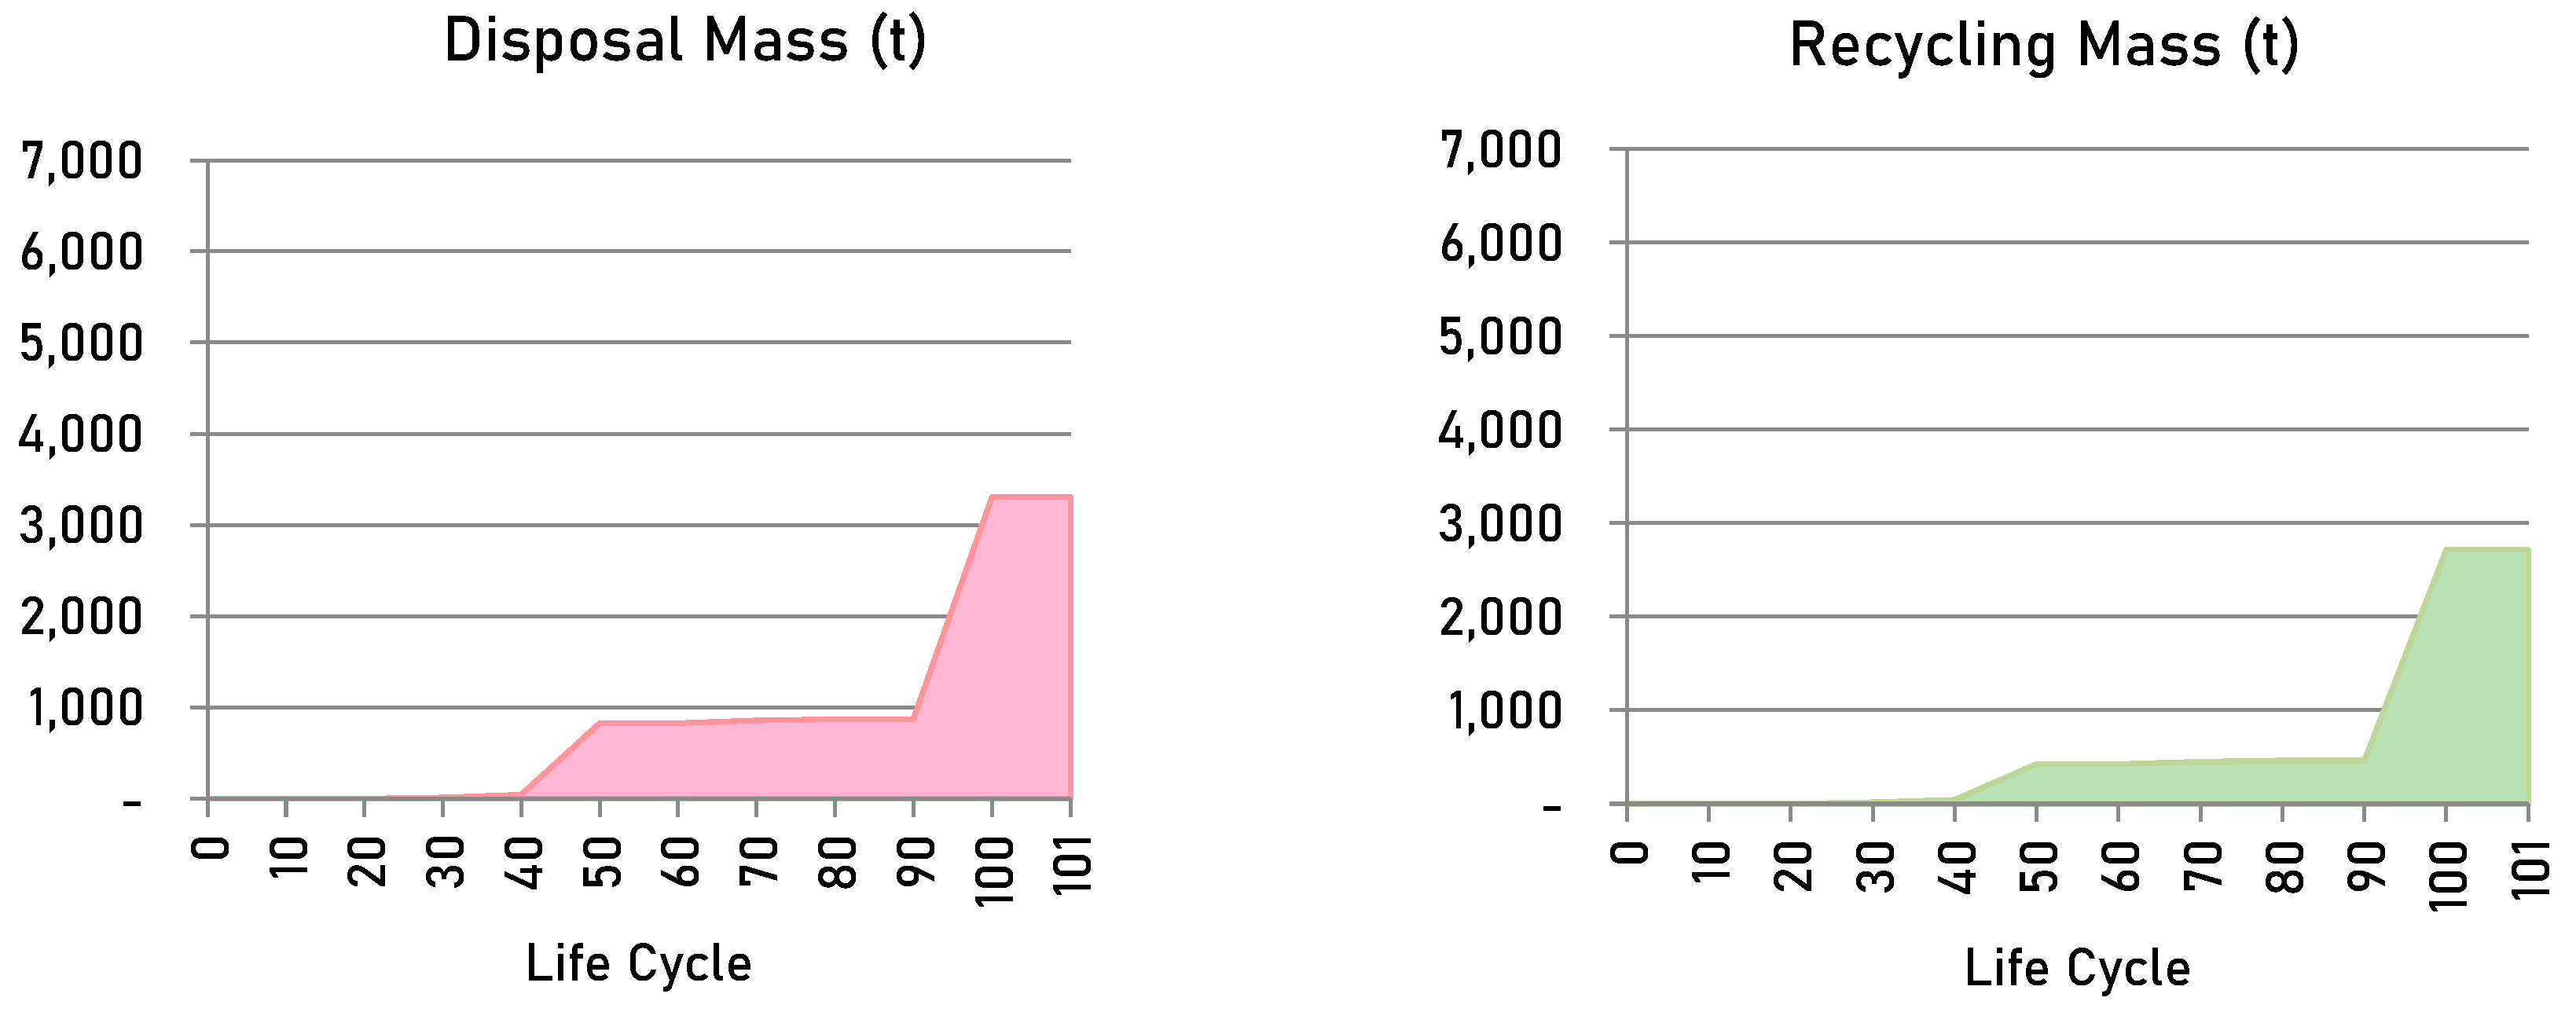
6.4. End of Life and Circularity Measures
6.5. Economic Impact
7. Discussion
7.1. Addressing the Research Questions
7.2. Key Insights and Limitations from the PoC Implementation
7.3. Advancing Automation and Integration: Comparison of Current Study and Proposed Enhancements
- Library Creation and Maintenance: predominantly manual—experts must collect, validate, and structure environmental data (LCI databases, cost benchmarks) and embed these into the BIM elements.
- Component Selection and Matching: partially automated—once the library is established, designers can systematically apply filters and automatically match components (via parameter queries or design constraints), but human oversight is needed for final decisions and irregular cases.
- Analytical Calculations (LCA, cost, circularity): increasingly automated—scripts or plug-ins can pull embedded data from the library to run calculations in near real-time. However, custom boundaries, sensitivity analyses, and contextual adjustments (e.g., site-specific disposal options) often require manual configuration.
7.4. Proposed Stakeholders, Challenges and Considerations
8. Conclusions and Future Research
9. Declaration of Generative AI and AI-Assisted Technologies in the Writing Process
Author Contributions
Funding
Informed Consent Statement
Data Availability Statement
Conflicts of Interest
References
- bSDD Search. Available online: https://search.bsdd.buildingsmart.org/?SearchText=object&ShowPreview=true (accessed on 31 October 2024).
- NBS BIM Object Standard. Available online: https://source.thenbs.com/bimlibrary/nbs-bim-object-standard (accessed on 31 October 2024).
- Guignone, G.; Calmon, J.L.; Vieira, D.; Bravo, A. BIM and LCA integration methodologies: A critical analysis and proposed guidelines. J. Build. Eng. 2023, 73, 106780. [Google Scholar] [CrossRef]
- Honic, M.; Kovacic, I.; Rechberger, H. Concept for a BIM-based Material Passport for buildings. IOP Conf. Ser. Earth Environ. Sci. 2019, 225, 012073. [Google Scholar] [CrossRef]
- Kovacic, I.; Honic, M.; Sreckovic, M. Digital Platform for Circular Economy in AEC Industry. Eng. Proj. Organ. J. 2024, 9, 16. [Google Scholar] [CrossRef]
- Honic, M.; Kovacic, I.; Rechberger, H. BIM-Based Material Passport (MP) as an Optimization Tool for Increasing the Recyclability of Buildings. Appl. Mech. Mater. 2019, 887, 327–334. [Google Scholar] [CrossRef]
- Honic, M.; Kovacic, I.; Sibenik, G.; Rechberger, H. Data-and stakeholder management framework for the implementation of BIM-based Material Passports. J. Build. Eng. 2019, 23, 341–350. [Google Scholar] [CrossRef]
- Andriyani, N.; Suprobo, P.; Adi, T.J.W.; Aspar, W.A.N.; Jatmiko, A.D.; Santoso, A.D. Integrating urban building information modeling and circular economy framework for green sustainability. Glob. J. Environ. Sci. Manag. 2024, 10, 1313–1332. [Google Scholar]
- Nawrocka, N.; Machova, M.; Jensen, R.L.; Kanafani, K.; Birgisdottir, H.; Hoxha, E. Influence of BIM’s level of detail on the environmental impact of buildings: Danish context. Build. Environ. 2023, 245, 110875. [Google Scholar] [CrossRef]
- Chen, Z.; Chen, L.; Zhou, X.; Huang, L.; Sandanayake, M.; Yap, P.-S. Recent Technological Advancements in BIM and LCA Integration for Sustainable Construction: A Review. Sustainability 2024, 16, 1340. [Google Scholar] [CrossRef]
- Abdulai, S.F.; Nani, G.; Taiwo, R.; Antwi-Afari, P.; Zayed, T.; Sojobi, A.O. Modelling the relationship between circular economy barriers and drivers for sustainable construction industry. Build. Environ. 2024, 254, 111388. [Google Scholar] [CrossRef]
- ÖNORM EN ISO 14044; Environmental Management—Life Cycle Assessment—Requirements and Guidelines. Austrian Standards: Vienna, Austria, 2021. Available online: https://www.austrian-standards.at/de/shop/onorm-en-iso-14044-2021-03-01~p2568309 (accessed on 31 October 2024).
- ÖNORM EN 15804; Sustainability of Construction Works—Environmental Product Declarations—Core Rules for the Product Category of Construction Products. Austrian Standards: Vienna, Austria, 2022. Available online: https://www.austrian-standards.at/de/shop/onorm-en-15804-2022-02-15~p2614831 (accessed on 31 October 2024).
- ÖNORM EN 15978; Nachhaltigkeit von Bauwerken—Bewertung der Umweltbezogenen Qualität von Gebäuden—Berechnungsmethode. Austrian Standards: Vienna, Austria, 2012. Available online: https://www.austrian-standards.at/de/shop/onorm-en-15978-2012-10-01~p1963407 (accessed on 31 October 2024).
- Level(s)—European Commission. Available online: https://environment.ec.europa.eu/topics/circular-economy/levels_en (accessed on 31 October 2024).
- Norouzi, M.; Chàfer, M.; Cabeza, L.F.; Jiménez, L.; Boer, D. Circular economy in the building and construction sector: A scientific evolution analysis. J. Build. Eng. 2021, 44, 102704. [Google Scholar] [CrossRef]
- Roberts, M.; Allen, S.; Coley, D. Life cycle assessment in the building design process—A systematic literature review. Build. Environ. 2020, 185, 107274. [Google Scholar] [CrossRef]
- Häfliger, I.-F.; John, V.; Passer, A.; Lasvaux, S.; Hoxha, E.; Saade, M.R.M.; Habert, G. Buildings environmental impacts’ sensitivity related to LCA modelling choices of construction materials. J. Clean. Prod. 2017, 156, 805–816. [Google Scholar] [CrossRef]
- Buyle, M.; Braet, J.; Audenaert, A. Life cycle assessment in the construction sector: A review. Renew. Sustain. Energy Rev. 2013, 26, 379–388. [Google Scholar] [CrossRef]
- Giorgi, S. Assessment methods and digital tools to support circular building strategies. IOP Conf. Ser. Earth Environ. 2024, 1402, 012047. [Google Scholar] [CrossRef]
- Austrian Standards Jahresbericht 2021; Austrian Standards: Vienna, Austria, 2021.
- ISO 14040:2006; Environmental Management—Life Cycle Assessment—Principles and Framework. ISO: Geneva, Switzerland, 2006. Available online: https://www.iso.org/standard/37456.html (accessed on 6 November 2024).
- ÖNORM ISO 14025; Umweltkennzeichnungen Und—Deklarationen—Typ-III-Umweltdeklarationen—Grundsätze und Verfahren. Austrian Standards: Vienna, Austria, 2006. Available online: https://www.austrian-standards.at/de/shop/onorm-iso-14025-2006-09-01~p1515466 (accessed on 31 October 2024).
- Charef, R.; Lu, W. Factor dynamics to facilitate circular economy adoption in construction. J. Clean. Prod. 2021, 319, 128639. [Google Scholar] [CrossRef]
- Akbarieh, A.; Jayasinghe, L.B.; Waldmann, D.; Teferle, F.N. BIM-Based End-of-Lifecycle Decision Making and Digital Deconstruction: Literature Review. Sustainability 2020, 12, 2670. [Google Scholar] [CrossRef]
- Sacks, R.; Eastman, C.; Lee, G.; Teichholz, P. BIM Handbook: A Guide to Building Information Modeling for Owners, Designers, Engineers, Contractors, and Facility Managers; John Wiley & Sons: Hoboken, NJ, USA, 2011. [Google Scholar] [CrossRef]
- Eastman, C.M.; Teicholz, P.M.; Rafael, S.; Eastman, C.; Lee, G. BIM Handbook: A Guide to Building Information Modeling for Owners, Managers, Designers, Engineers and Contractors; John Wiley & Sons: Hoboken, NJ, USA, 2018. [Google Scholar]
- Azhar, S. Building Information Modeling (BIM): Trends, Benefits, Risks, and Challenges for the AEC Industry. Leadersh. Manag. Eng. 2011, 11, 241–252. [Google Scholar] [CrossRef]
- Malmqvist, T.; Glaumann, M.; Scarpellini, S.; Zabalza, I.; Aranda, A.; Llera, E.; Díaz, S. Life cycle assessment in buildings: The ENSLIC simplified method and guidelines. Energy 2011, 36, 1900–1907. [Google Scholar] [CrossRef]
- Soust-Verdaguer, B.; Llatas, C.; García-Martínez, A. Critical review of bim-based LCA method to buildings. Energy Build. 2017, 136, 110–120. [Google Scholar] [CrossRef]
- Sajid, Z.W.; Khan, S.A.; Hussain, F.; Ullah, F.; Khushnood, R.A.; Soliman, N. Assessing economic and environmental performance of infill materials through BIM: A life cycle approach. Smart Sustain. Built Environ. 2024. ahead-of-print. [Google Scholar] [CrossRef]
- Zhao, L.; Guo, C.; Chen, L.; Qiu, L.; Wu, W.; Wang, Q. Using BIM and LCA to Calculate the Life Cycle Carbon Emissions of Inpatient Building: A Case Study in China. Sustainability 2024, 16, 5341. [Google Scholar] [CrossRef]
- Al Mahmud, J.; Arefin, S.; Ahmmed, M.I. Uncovering the research tapestry: Bibliometric insights into BIM and LCA—Exploring trends, collaborations and future directions. Construction Innovation. Smart Sustain. Built Environ. 2024. ahead-of-print. [Google Scholar] [CrossRef]
- Ding, Y.; Guo, Z.-Z.; Zhou, S.-X.; Wei, Y.-Q.; She, A.-M.; Dong, J.-L. Research on carbon emissions during the construction process of prefabricated buildings based on BIM and LCA. J. Asian Archit. Build. Eng. 2024, 1–13. [Google Scholar] [CrossRef]
- Namaki, P.; Vegesna, B.S.; Bigdellou, S.; Chen, R.; Chen, Q. An Integrated Building Information Modeling and Life-Cycle Assessment Approach to Facilitate Design Decisions on Sustainable Building Projects in Canada. Sustainability 2024, 16, 4718. [Google Scholar] [CrossRef]
- Santos, R.; Costa, A.A.; Silvestre, J.D.; Pyl, L. Integration of LCA and LCC analysis within a BIM-based environment. Autom. Constr. 2019, 103, 127–149. [Google Scholar] [CrossRef]
- Gantner, J.; Saunders, T.; Lasvaux, S.; Gazulla, C.; Mundy, J.; Sjöström, C. Operational Guidance for Life Cycle Assessment Studies of the Energy-Efficient Buildings Initiative (EeBGuide); Fraunhofer: München, Germany, 2011; Available online: https://cordis.europa.eu/project/id/285490/reporting (accessed on 28 January 2025).
- Silvestre, J.D.; Lasvaux, S.; Hodková, J.; de Brito, J.; Pinheiro, M.D. NativeLCA—A systematic approach for the selection of environmental datasets as generic data: Application to construction products in a national context. Int. J. Life Cycle Assess. 2015, 20, 731–750. [Google Scholar] [CrossRef]
- Pomponi, F.; Moncaster, A. Circular economy for the built environment: A research framework. J. Clean. Prod. 2017, 143, 710–718. [Google Scholar] [CrossRef]
- Gbenga John, O.; Forth, K.; Theißen, S.; Borrmann, A. Estimating the Circularity of Building Elements using Building Information Modelling. IOP Conf. Ser. Earth Environ. 2024, 1363, 012043. [Google Scholar] [CrossRef]
- Askar, R.; Karaca, F.; Bragança, L.; Gervásio, H. The Role of BIM in Supporting Circularity: A Conceptual Framework for Developing BIM-Based Circularity Assessment Models in Buildings. In 4th International Conference “Coordinating Engineering for Sustainability and Resilience” & Midterm Conference of CircularB “Implementation of Circular Economy in the Built Environment”; Springer: Cham, Switzerland, 2024; pp. 649–658. [Google Scholar]
- Almeida, R.; Chaves, L.; Silva, M.; Carvalho, M.; Caldas, L. Integration between BIM and EPDs: Evaluation of the main difficulties and proposal of a framework based on ISO 19650:2018. J. Build. Eng. 2023, 68, 106091. [Google Scholar] [CrossRef]
- Tomczak, A.; Benghi, C.; van Berlo, L.; Hjelseth, E. Requiring Circularity Data in Bim with Information Delivery Specification. J. Circ. Econ. 2024, 1. [Google Scholar] [CrossRef]
- Heisel, F.; McGranahan, J. Enabling Design for Circularity with Computational Tools. In A Circular Built Environment in the Digital Age; Springer: Cham, Switzerland, 2024; pp. 97–110. [Google Scholar]
- De Wolf, C.; Cordella, M.; Dodd, N.; Byers, B.; Donatello, S. Whole life cycle environmental impact assessment of buildings: Developing software tool and database support for the EU framework Level(s). Resour. Conserv. Recycl. 2023, 188, 106642. [Google Scholar] [CrossRef]
- Di Bari, R.; Horn, R.; Bruhn, S.; Alaux, N.; Ruschi Mendes Saade, M.; Soust-Verdaguer, B.; Potrč Obrecht, T.; Hollberg, A.; Birgisdottír, H.; Passer, A.; et al. Buildings LCA and digitalization: Designers’ toolbox based on a survey. IOP Conf. Ser. Earth Environ. 2022, 1078, 012092. [Google Scholar] [CrossRef]
- Hollberg, A.; Tjäder, M.; Ingelhag, G.; Wallbaum, H. A Framework for User Centric LCA Tool Development for Early Planning Stages of Buildings. Front. Built Environ. 2022, 8, 744946. [Google Scholar] [CrossRef]
- Säwén, T.; Magnusson, E.; Sasic Kalagasidis, A.; Hollberg, A. Tool characterisation framework for parametric building LCA. IOP Conf. Ser. Earth Environ. 2022, 1078, 012090. [Google Scholar] [CrossRef]
- Honic, M.; Ferschin, P.; Breitfuss, D.; Cencic, O.; Gourlis, G.; Kovacic, I.; De Wolf, C. Framework for the assessment of the existing building stock through BIM and GIS. Dev. Built Environ. 2023, 13, 100110. [Google Scholar] [CrossRef]
- Turan, I.; Fernandez, J. Material Across Scales: Combining Material Flow Analysis and Life Cycle Assessment to Promote Efficiency in A Neighborhood Building Stock. In Proceedings of the BS2015:14th Conference of International Building Performance Simulation Association, Hyderabad, India, 7–9 December 2015. [Google Scholar] [CrossRef]
- Çetin, S.; Raghu, D.; Honic, M.; Straub, A.; Gruis, V. Data requirements and availabilities for material passports: A digitally enabled framework for improving the circularity of existing buildings. Sustain. Prod. Consum. 2023, 40, 422–437. [Google Scholar] [CrossRef]
- Charef, R. The use of Building Information Modelling in the circular economy context: Several models and a new dimension of BIM (8D). Clean. Eng. Technol. 2022, 7, 100414. [Google Scholar] [CrossRef]
- Nepal, M.P.; Jupp, J.R.; Aibinu, A.A. Evaluations of BIM: Frameworks and Perspectives. In Computing in Civil and Building Engineering (2014); American Society of Civil Engineers: Reston, VA, USA, 2014; pp. 769–776. [Google Scholar]
- Gu, N.; London, K. Understanding and facilitating BIM adoption in the AEC industry. Autom. Constr. 2010, 19, 988–999. [Google Scholar] [CrossRef]
- Li, X.; Shen, G.Q.; Wu, P.; Yue, T. Integrating Building Information Modeling and Prefabrication Housing Production. Autom. Constr. 2019, 100, 46–60. [Google Scholar] [CrossRef]
- de Lima, P.R.B.; de Rodrigues, C.S.; Post, J.M. Integration of BIM and design for deconstruction to improve circular economy of buildings. J. Build. Eng. 2023, 80, 108015. [Google Scholar] [CrossRef]
- Lu, Y.; Wu, Z.; Chang, R.; Li, Y. Building Information Modeling (BIM) for green buildings: A critical review and future directions. Autom. Constr. 2017, 83, 134–148. [Google Scholar] [CrossRef]
- Palumbo, E.; Soust-Verdaguer, B.; Llatas, C.; Traverso, M. How to Obtain Accurate Environmental Impacts at Early Design Stages in BIM When Using Environmental Product Declaration. A Method to Support Decision-Making. Sustainability 2020, 12, 6927. [Google Scholar] [CrossRef]
- Xue, K.; Hossain, M.d.U.; Liu, M.; Ma, M.; Zhang, Y.; Hu, M.; Chen, X.; Cao, G. BIM Integrated LCA for Promoting Circular Economy towards Sustainable Construction: An Analytical Review. Sustainability 2021, 13, 1310. [Google Scholar] [CrossRef]
- van Eijk, F.; Turtoi, A.; Moustafa, A.; Hamada, K. Circular Buildings and Infrastructure—State of Play Report ECESP Leadership Group on Buildings and Infrastructure 2021. Available online: https://www.researchgate.net/publication/359062006_Circular_buildings_and_infrastructure_-_State_of_play_report_ECESP_Leadership_Group_on_Buildings_and_Infrastructure_2021 (accessed on 31 October 2024).
- Khadim, N.; Agliata, R.; Thaheem, M.J.; Mollo, L. Whole building circularity indicator: A circular economy assessment framework for promoting circularity and sustainability in buildings and construction. Build. Environ. 2023, 241, 110498. [Google Scholar] [CrossRef]
- Plociennik, C.; Pourjafarian, M.; Saleh, S.; Hagedorn, T.; do Carmo Precci Lopes, A.; Vogelgesang, M.; Baehr, J.; Kellerer, B.; Jansen, M.; Berg, H.; et al. Requirements for a Digital Product Passport to Boost the Circular Economy. In Proceedings of the P326—INFORMATIK 2022—Informatik in den Naturwissenschaften, Hamburg, Germany, 26–30 September 2022; pp. 1485–1494. [Google Scholar]
- Bergquist, A.K.; David, T. Beyond Planetary Limits! The International Chamber of Commerce, the United Nations, and the Invention of Sustainable Development. Bus. Hist. Rev. 2023, 97, 481–511. [Google Scholar] [CrossRef]
- Kovacic, I.; Honic, M.; Rechberger, H. Proof of Concept for a BIM-Based Material Passport. In Advances in Informatics and Computing in Civil and Construction Engineering; Mutis, I., Hartmann, T., Eds.; Springer: Cham, Switzerland, 2019; pp. 741–747. [Google Scholar] [CrossRef]
- Honic, M.; Kovacic, I.; Aschenbrenner, P.; Ragossnig, A. Material Passports for the end-of-life stage of buildings: Challenges and potentials. J. Clean. Prod. 2021, 319, 128702. [Google Scholar] [CrossRef]
- de Araujo, J.B.; de Oliveira, J.F.G. Proposal of a Methodology Applied to the Analysis and Selection of Performance Indicators for Sustainability Evaluation Systems. In Collaborative Product and Service Life Cycle Management for a Sustainable World; Springer: London, UK, 2008; pp. 593–600. [Google Scholar]
- Illankoon, C.; Vithanage, S.C. Closing the loop in the construction industry: A systematic literature review on the development of circular economy. J. Build. Eng. 2023, 76, 107362. [Google Scholar] [CrossRef]
- Zelger, T.; Mötzl, H.; Scharnhorst, A.; Wurm, M. Erweiterung des OI3-Index Um Die Nutzungsdauer Von Baustoffen. Available online: https://www.ibo.at/fileadmin/ibo/forschung/Nachhaltigmassiv_AP3Nutzungsdauer_Endbericht_20091022.pdf (accessed on 27 February 2025).
- ISO 15686-1:2011; Buildings and Constructed Assets—Service Life Planning—Part 1: General Principles and Framework. Austrian Standards: Vienna, Austria, 2011. Available online: https://www.austrian-standards.at/de/shop/iso-15686-1-2011-2011-05-05~p1874913 (accessed on 27 February 2025).
- OFI Österreichisches Forschungsinstitut für Chemie und Technik, Technische Universität Wien Institut für Hochbau und Technologie Hochbaukonstruktionen und Bauwerkserhaltung. Forschungsprojekt ‘Zukunftssicheres Bauen’. Available online: https://nachhaltigwirtschaften.at/resources/hdz_pdf/zukunftssicheres_bauen_04_projektteil_wohngebaeudezustand.pdf (accessed on 27 February 2025).
- Figl, H. Life Cycle Assessment Rules—Criteria for the Inclusion of Product-Specific Life Cycle Assessment Data (‘EPD Data’) in the Database. Available online: https://www.baubook.at (accessed on 27 February 2025).
- EI Kon-Entsorgungsindikator Für Bauteile EI10-Entsorgungsindikator Für Gebäude Leitfaden zur Berechnung des Entsorgungsindikators EI Kon von Bauteilen und des Entsorgungsindikators EI10 auf Gebäudeebene (für Neubauten, Sanierungen und Bestandsgebäude). Available online: https://www.ibo.at/fileadmin/ibo/materialoekologie/EI10_Berechnungsleitfaden_V2.01_2020.pdf (accessed on 27 February 2025).
- Röck, M.; Saade, M.R.M.; Balouktsi, M.; Rasmussen, F.N.; Birgisdottir, H.; Frischknecht, R.; Habert, G.; Lützkendorf, T.; Passer, A. Embodied GHG emissions of buildings—The hidden challenge for effective climate change mitigation. Appl. Energy 2020, 258, 114107. [Google Scholar] [CrossRef]
- IBO—Österreichisches Institut für Bauen und Ökologie GmbH. Leitfaden zur Berechnung des Oekoindex OI3 für Bauteile und Gebäude. Available online: https://www.ibo.at/fileadmin/ibo/materialoekologie/OI3_Berechnungsleitfaden_V4.0_20181025_01.pdf (accessed on 27 February 2025).
- Pibal, S.; Jakoubek, R. Digital Twins to BIM Object Library—A Top-Down Modeling Approach. In Proceedings of the CIB W78 2021, Luxembourg, 11–15 October 2021. [Google Scholar]
- ÖNORM B 1800; Ermittlung von Flächen und Rauminhalten von Bauwerken und Zugehörigen Außenanlagen. Austrian Standards: Vienna, Austria, 2013. Available online: https://www.austrian-standards.at/de/shop/onorm-b-1800-2013-08-01~p2022362 (accessed on 27 February 2025).
- Pibal, S.S.; Kovacic, I. Digital Design Workflow for an Algorithm Aided BIM Approach in Research Led Teaching. In Proceedings of the EG-ICE 2020 Proceedings: Workshop on Intelligent Computing in Engineering, Berlin, Germany, 1–4 July 2020; pp. 204–214. [Google Scholar]
- Welcome to Baubook—English. Available online: https://www.baubook.info/en/welcome-to-baubook?set_language=en (accessed on 11 November 2024).
- BKI—Baukosteninformationszentrum für Architekten. Available online: https://bki.de/ (accessed on 11 November 2024).
- DIN 276:2018-12; Building Costs. DIN Media: Berlin, Germany, 2018. Available online: https://www.austrian-standards.at/de/shop/din-276-2018-12~p2452589 (accessed on 12 November 2024).


| Category | Parameter | Description | Unit/Examples |
|---|---|---|---|
| Component | Type | Horizontal or vertical Component/Element of Building | Wall, Slab, Beam, Column, Roof, Foundation, Flooring… |
| ID Component | Identification of Component | WE01(Exterior Wall 01) | |
| Component Information | Component Layers | List of various construction components. | e.g., Tiles, Dry Screed Plate |
| ID Layer | Identification of Layer | WE01-01 | |
| Corresponding Construction Layers | Specific types of materials used in construction. | e.g., FERMACELL gypsum fiber screed | |
| Lifespan | Expected lifespan of each material. Note: Over 100 years, the initial data will be multiplied by the number of times indicated by the lifespan. | Number of years (e.g., 10, 25, 35, 50, 100 years) | |
| Thickness of Layers | Thickness of each material layer. | Measurement in meters (e.g., 0.015 m) | |
| Material Properties | Material Classification | Classification based on the function of the material. | e.g., Flooring, Insulation |
| Building Material Category | Type of material based on composition. | organic, mineral, metallic | |
| Harmful Substances | List of harmful substances contained in the material/layer. | e.g., KMF, DEHP, H/F/C/KW, PAK | |
| Density | Density of each material/component layer | kg/m3 (e.g., 2300 kg/m3) | |
| Environmental Impact Metrics | GWP | Potential contribution to global warming. | kg CO2 eq./kg |
| AP | Potential to contribute to acidification. | kg SO2 eq./kg | |
| Primary Energy Non-Renewable total (PENRT) | Primary Energy Non-Renewable total. Primary energy input. | MJ/kg | |
| Disposal Classification | Dimensionless classification categorizing disposal difficulty, impacting waste volume calculations via multipliers. | Dimensionless (classification scale) | |
| Recycling Potential | Expressed as a percentage, indicating recyclability and potential for waste reduction. | Percentage (%) | |
| Mass and Environmental Impact | Mass per Area | Mass of material per square meter. | kg/m2 |
| Mass at Construction | Mass of the material at the time of construction. | kg | |
| Mass after 100 Years | Mass of the material after 100 years. | kg | |
| Waste and Recycling Potential | Recycling Potential | Classification of the material’s potential for recycling and disposal. | Potential rating from 1 to 5 (e.g., high to medium to low) |
| Recyclable Mass at Construction | Mass of material that can be recycled after EOL considered at the time of construction. | kg | |
| Waste Mass at Construction | Mass of material that becomes waste after EOL considered at the time of construction. | kg | |
| Recyclable Mass after 100 Years | Mass of material that can be recycled after 100 years. Recyclable Mass at Construction * (100/Lifespan) | kg | |
| Waste Mass after 100 Years | Mass of material that becomes waste after 100 years. Waste Mass at Construction * (100/Lifespan) | kg | |
| Environmental Impact at Different LC-Stages | GWP at Construction | Environmental impact in terms of GWP at the time of construction. | t CO2 eq. |
| AP at Construction | Environmental impact in terms of AP at the time of construction. | kg SO2 eq. | |
| PENRT at Construction | Primary energy non-renewable total at the time of construction. | GJ | |
| GWP(100) after 100 Years | Environmental impact in terms of GWP after 100 years. GWP at Construction * (100/Lifespan) | t CO2 eq. | |
| AP after 100 Years | Environmental impact in terms of AP after 100 years. AP at Construction * (100/Lifespan) | kg SO2 eq. | |
| PENRT after 100 Years | Primary energy non-renewable total after 100 years. PENRT at Construction * (100/Lifespan) | GJ | |
| GWP Storage | The amount of CO2 stored in biogenic materials, expressed in kg or t CO2 eq./m2 | t CO2 eq. | |
| Cost Information | Costs at Construction | Cost per square meter for each material/component as of 2022. | €/m2 |
| Costs after 100 Years | Cost per square meter for each material/component after 100 years. Cost at Construction * (100/Lifespan) | €/m2 |
| Metric | Description | Unit |
|---|---|---|
| GWP(100) | Measures greenhouse gas emissions for each material, assessing climate change impact. | kg CO2-equivalent |
| AP | Calculates emissions contributing to acidification, assessing impacts on ecosystems, infrastructure, and health. | kg SO2-equivalent |
| Primary Energy Non-Renewable Total (PENRT) | Indicates total non-renewable energy consumed throughout a material’s life cycle, reflecting resource depletion. | Megajoules (MJ) |
| Disposal Classification | Dimensionless classification categorizing disposal difficulty, impacting waste volume calculations via multipliers, based on the EI10 indicator. | Dimensionless (classification scale 1 to 5) |
| Recycling Potential | Expressed as a percentage, indicating recyclability and potential for waste reduction, based on EI10 indicator. | Percentage (%) |
| Lifespan per Layer | Represents expected service life of each material element layer, accounting for durability and replacement cycles. | Years (yr) |
| ID | Type | Element Layer (BIM-Modell) | Layer ID | Element Layer (Baubook) | Life Span (Years) | Thickness (m) | Material Category | Material Classification | Density (kg/m3) |
|---|---|---|---|---|---|---|---|---|---|
| IW01 | Wooden interior partition wall (non-load bearing) | Clay Panel | IW01-01 | Clay Panel | 50 | 0.013 | mineral | Clay | 500 |
| Installation Level with Insulation | IW01-02 | best wood MULTITHERM 110 | 50 | 0.04 | organic | Insulation | 110 | ||
| OSB Chipboard | IW01-03 | OSB Board (650 kg/m3) | 50 | 0.015 | organic | Wood | 650 | ||
| Intermediate Insulation | IW01-04 | best wood MULTITHERM 110 | 50 | 0.1 | organic | Insulation | 110 | ||
| Construction Wood 13% | IW01-05 | Timber (525 kg/m3—e.g., Larch)—Rough, Air-Dried | 50 | 0.1 | organic | Wood | 525 | ||
| Insulated Separation Layer | IW01-06 | best wood MULTITHERM 110 | 50 | 0.04 | organic | Insulation | 110 | ||
| Intermediate Insulation | IW01-07 | best wood MULTITHERM 110 | 50 | 0.1 | organic | Insulation | 110 | ||
| Construction Wood 13% | IW01-08 | Timber (525 kg/m3—e.g., Larch)—Rough, Air-Dried | 50 | 0.1 | organic | Wood | 525 | ||
| OSB Chipboard | IW01-09 | OSB Board (650 kg/m3) | 50 | 0.015 | organic | Wood | 650 | ||
| Installation Level with Insulation | IW01-10 | best wood MULTITHERM 110 | 50 | 0.04 | organic | Insulation | 110 | ||
| Clay Panel | IW01-11 | Clay Panel | 50 | 0.013 | mineral | Clay | 500 |
| Element | At Year of Construction | After 100 Years EoL | ||||
|---|---|---|---|---|---|---|
| GWP(100) [t CO2 eq.] | AP [kg SO2 eq.] | PENRT [GJ] | GWP(100) [t CO2 eq.] | AP [kg SO2 eq.] | PENRT [GJ] | |
| Slabs and Ceilings | −51.65 | 2447.59 | 9136.02 | 32.62 | 3552.29 | 13,435.51 |
| Walls | −306.3 | 1001.87 | 3663.38 | −525.52 | 1901.78 | 7002.49 |
| Beams | 3.31 | 42.74 | 254.05 | 30.05 | 42.74 | 254.05 |
| Columns | 21.86 | 73 | 326.56 | 21.86 | 73 | 326.56 |
| Stairs | 8.96 | 23.82 | 92.02 | 8.96 | 23.82 | 92.02 |
| Foundations | 23.63 | 62.81 | 242.65 | 23.63 | 62.81 | 242.65 |
| Sum | −300.19 | 3651.83 | 13,714.68 | −408.4 | 5656.44 | 21,353.28 |
| Elements After 100 Years EoL | Recyclable Mass [t] | Disposal Mass [t] |
|---|---|---|
| Concrete Slab—General | 695.93 | 772.82 |
| Concrete Slab—Kitchen/Bathroom | 94.00 | 116.48 |
| Concrete Slab—Living Area | 261.57 | 325.65 |
| Wooden Ceiling—Kitchen/Bathroom | 146.54 | 177.32 |
| Wooden Ceiling—Living Area | 492.12 | 600.05 |
| Wooden Flat Roof | 119.92 | 120.18 |
| Concrete Balcony | 306.45 | 306.45 |
| Exterior Wall 01 | 32.69 | 36.67 |
| Exterior Wall 02 | 58.40 | 139.76 |
| Interior Wall 01 | 59.32 | 135.66 |
| Interior Wall 02 | 52.96 | 52.96 |
| Partition Wall | 50.29 | 170.03 |
| Shaft Walls | 7.42 | 14.05 |
| Attica | 13.53 | 30.17 |
| Concrete Beams | 49.78 | 49.78 |
| Glulam Beams | 8.12 | 2.71 |
| Steel Beams | 0.39 | 0.13 |
| Concrete Columns | 85.07 | 85.07 |
| Glulam Columns | 3.73 | 1.24 |
| Steel Columns | 0.34 | 0.11 |
| Concrete Stairs | 27.76 | 27.76 |
| Wooden Windows | 19.88 | 19.88 |
| Glass Surfaces Windows | 20.61 | 20.61 |
| Wooden Doors | 11.67 | 3.89 |
| Glass Surfaces Doors | 24.37 | 24.37 |
| Concrete Foundations | 73.20 | 73.20 |
| Sum Mass [t] | 2716.05 | 3306.99 |
| Component | At Construction (€) | After 100 Years (€) | Increase (%) |
|---|---|---|---|
| Slabs and Ceilings/Roof | 1,749,324.11 | 2,258,235.42 | 29.06% |
| Walls | 1,099,900.92 | 1,706,316.42 | 55.12% |
| Beams | 118,544.09 | 118,544.09 | 0% |
| Columns | 200,372.80 | 200,372.80 | 0% |
| Stairs | 50,048.93 | 50,048.93 | 0% |
| Windows | 462,468.37 | 1,387,405.12 | 200.05% |
| Doors | 470,244.18 | 1,258,845.62 | 167.60% |
| Foundations | 22,513.61 | 22,513.61 | 0% |
| Total | 4,173,417.02 | 7,002,282.01 | 67.73% |
| Incl. 20% VAT | 5,008,100.42 | 8,402,738.41 |
| Component | Difference (€) | Difference (%) |
|---|---|---|
| Base Slab Concrete | 33.94 | −9% |
| Concrete Slab + Floor Tiles | −1.66 | 1% |
| Concrete Slab + Floor Wood | 14.74 | −7% |
| Wood Slab + Floor Tiles | 25.64 | −7% |
| Wood Slab + Floor Wood | 42.04 | −11% |
| Flat Roof Wood | −12.9 | 3% |
| Exterior Wall Concrete | 20.6 | −7% |
| Exterior Wall Wood | 6.14 | −2% |
| Interior Wall Wood | −92.08 | 54% |
| Interior Wall Concrete | −14.06 | 7% |
| Interior Wall Wood | −141.09 | 47% |
| Interior Wall Gypsum | −75.16 | 50% |
| Attika Wood | −9.05 | 2% |
| Beam Concrete | no comparison available | no comparison available |
| Beam Glulam | 14,406.87 | 16% |
| Beam Steel | no comparison available | no comparison available |
| Column Steel | no comparison available | no comparison available |
| Column Glulam | 8821.65 | −12% |
| Column Steel | no comparison available | no comparison available |
| Stairs Concrete | no comparison available | no comparison available |
| Window | 206.13 | −46% |
| Door | no comparison available | no comparison available |
| Foundation Concrete | 119.08 | −48% |
| Aspect | Key Insights and Limitations |
|---|---|
| Digital Building Model of the Use Case and BIM Object Library | The primary objective was to align the BIM object library with the building concept, resulting in a digital model utilizing enriched BIM data. |
| Challenges such as component duplication and improper layering were addressed through model optimization. | |
| Removing non-essential elements and consolidating components improved usability and accuracy. | |
| Feasibility and Compliance Assessments | Feasibility assessments verified the practicality of elements within the model, revealing discrepancies such as non-standard insulation thicknesses. |
| Structural evaluations ensured compliance with engineering standards for load-bearing capacities. | |
| Compliance with building physics regulations, including thermal, acoustic, and fire protection standards, was confirmed to ensure real-world applicability. | |
| Matching the Model and Library | A comprehensive component catalog was developed to ensure consistency between the evaluated model and the BIM object library. Each element in the model was carefully aligned with the library’s components. This alignment facilitated precise assessments of life cycle impacts and circularity measures for the project-specific components. |
| Heterogeneous BIM Data and Integration Challenges | The PoC demonstrated that working with heterogeneous BIM data formats—combining structured BIM models with external spreadsheet-based data repositories—was feasible and provided flexibility. However, this approach introduced challenges in data synchronization and potential inconsistencies between the model and external sources, necessitating manual data validation. |
| Limitations and Challenges | While the PoC provided valuable insights, limitations were encountered that impact its applicability. Initial errors in component duplication and layering highlighted the need for meticulous modeling practices. |
| Discrepancies between modeled specifications and commercially available materials necessitated adjustments, emphasizing the importance of aligning digital models with real-world constraints. | |
| The integration of extensive LCA and CE data increases the complexity of BIM objects, requiring advanced software capabilities and user expertise. | |
| While the study focused on key environmental indicators such as GWP(100), AP, and PENRT, broader sustainability metrics such as biodiversity loss or water use were not explicitly considered. | |
| The study’s application to a residential building in Vienna may limit generalizability to other building types, locations, or regulatory contexts. | |
| Additionally, economic analysis primarily compared BKI benchmarks and firm prices but lacked a full life cycle cost analysis incorporating operational energy consumption, maintenance costs, and potential savings from sustainable technologies. | |
| The framework’s successful application heavily depends on stakeholder expertise, potentially affecting adoption in practice. | |
| This study conducted an LCA withing the system boundary that includes both mass and environmental impacts in the production phase (Module A1–A3) and during replacements (Module B4), while we consider only mass for deconstruction and demolition (C1), recycling potential (C3), and disposal (C4). Hence not all modules from A to C and potentially D. |
| Aspect/Process | Current Study Method (Spreadsheet-Based, Project-Specific) | Proposed Future Improvements (Automated and Scalable Approach) |
|---|---|---|
| Data Collection (EPDs, MPs, Cost Databases) | Manual data entry and storage in spreadsheets and BIM Model | Increasingly Automated (API-based) integration with external databases and sources (Baubook, BKI, global EPD repositories) |
| BIM Object Data Population | Manual enrichment of BIM objects using spreadsheet datasets | Database-driven dynamic updates for generic and manufacturer-specific BIM objects |
| Life cycle Data Processing | Semi-automated matching of environmental indicators (GWP(100), AP, PENRT), recyclability, disposal, lifespan per layer | Increasingly Automated LCA matching to streamline data processing and ensure real-time analysis |
| LCA Impact Quantification | Semi-automated calculation from input datasets inside templates | Increasingly Automated BIM-integrated assessments with manufacturer-specific or generic data |
| Cost Estimation | Manually linked to project-specific pricing from BKI | Automated cost estimation through integration with cost databases and/or quarterly stock market price of material |
| Circularity and End-of-Life Analysis | Semi-automated calculation from input datasets inside template of recyclable and waste fractions | Increasingly Automated classification using standard MP and BIM-integrated CE evaluation |
| Report Generation | Manually compiled sustainability report from spreadsheet calculations | Partially Automated sustainability reporting with customizable dashboard outputs and recommendations |
| Stakeholder Role in Data Input | Designers and sustainability experts manually input data | Manufacturers supply standardized EPDs and MPs; BIM model updates dynamically |
| Data Sources | Limited to specific databases like baubook | Expanded to include global EPD databases and generic repositories |
| Evaluation Approach | Static assessment at specific stages | Continuous monitoring and real-time sustainability dashboards |
| Circularity Metrics | Basic assessment of material recyclability | Advanced tracking of material flows, reuse potential, and disposal scenarios |
| Object Types | Predominantly project-specific BIM objects | Integration of both generic and manufacturer-specific objects for flexibility |
| Data Automation | Partial semi-automation for calculations | Increased automation in data collection, calculation, validation, and reporting |
| Stakeholder | Why They Are Proposed | What They Provide for BIM Objects | Tasks and Responsibilities Related to BIM Objects | Benefits of Their Contribution to BIM Objects | Challenges and Considerations |
|---|---|---|---|---|---|
| Manufacturers | Ensure accurate material and product data is available early on | Product-specific EPDs, MPs, material compositions, durability data | Input validated product data into BIM object libraries, ensuring compliance with sustainability goals | Provides precise environmental data for LCA and CE evaluations at the object level | Keeping product data up-to-date with evolving sustainability standards; lack of standardized EPD formats |
| Organizations and Research Institutes | Provide generic BIM object data for EDSs | Generic BIM objects, standardized environmental data, default material properties | Develop and validate BIM object templates, ensure alignment with regulatory standards | Ensures availability of reliable baseline data for sustainability assessments | Harmonizing international standards; ensuring widespread industry adoption |
| Designers and Architects | Select sustainable materials and optimize BIM-based design | Material specifications, sustainability parameters | Integrate enriched BIM objects into project models, optimize material selection based on embedded sustainability data | Enables informed material selection and early-stage impact assessment in BIM models | Balancing sustainability with design, cost, and aesthetic constraints |
| Engineers | Validate structural integrity and material performance in BIM | Load-bearing capacities, material strength, fire resistance data | Ensure materials in BIM objects meet engineering performance requirements | Guarantees technical feasibility while incorporating sustainability data | Limited access to reliable sustainability data for engineering calculations |
| Sustainability Experts | Conduct detailed LCA and CE assessments using BIM-integrated data | LCA methodologies, environmental benchmarks within BIM objects | Assess environmental impacts of BIM objects, recommend substitutions, track life cycle metrics | Ensures compliance with international sustainability standards and real-time BIM-based evaluations | Time-intensive data validation and alignment with industry databases |
| BIM Managers | Maintain BIM object library integrity and interoperability | Data validation, metadata structures, interoperability solutions | Ensure consistent structure of BIM objects, integrate sustainability data, manage updates | Ensures smooth data exchange and standardization of sustainability-linked BIM objects | Managing interoperability issues between BIM tools and sustainability databases |
| BIM Software Firms and Developers | Enable seamless integration of LCA and CE within BIM | BIM automation tools, parametric LCA integration, API links to databases | Develop and refine BIM software features that enhance sustainability assessment within object-level data | Enhances automation, improves data handling, ensures BIM object interoperability with LCA and CE tools | Developing user-friendly interfaces and integrating diverse sustainability datasets |
| Demolition Experts | Ensure BIM-based material recovery planning during deconstruction | BIM-integrated material reuse potential, deconstruction sequencing data | Assess BIM objects for reuse, guide selective demolition, provide input for BIM updates on material recovery | Maximizes material recovery, minimizes waste, supports CE within BIM workflows | Lack of incentives for deconstruction over traditional demolition |
| Demolition Company | Execute sustainable deconstruction and BIM-linked material recovery tracking | Demolition logistics, material separation plans integrated into BIM | Implement BIM-based deconstruction strategies, coordinate selective material sorting for reuse | Facilitates efficient material reuse, supports CE objectives, reduces landfill waste | Costs associated with selective demolition and BIM model updates post-demolition |
| Challenge | Stakeholder | Potential Solution | Potential Contributions from This Research |
|---|---|---|---|
| Data interoperability issues | BIM Managers, BIM Software Developers | Implement standardized APIs for sustainability data exchange | Suggests a structured approach to integrating LCA, CE, and cost data into BIM workflows, demonstrating the feasibility. |
| Lack of structured EPD data from manufacturers | Manufacturers, Sustainability Experts | Develop standardized formats for BIM-ready EPDs | Highlights the necessity for structuring environmental data in template. |
| High manual workload for data input | BIM Managers, Engineers, Sustainability Experts | Increase automation in BIM-LCA integration | Identifies manual data handling limitations and outlines future automation potentials based on structured data templates. |
| Regulatory inconsistencies across regions | Regulatory Bodies | Align BIM-based sustainability compliance with EU Level(s) and ISO 14044 | |
| Limited material recovery tracking in BIM | Demolition Experts, Demolition Firms | Enhance deconstruction planning tools in BIM | Investigates the integration of EoL data into BIM objects, facilitating better tracking of material reuse potential. |
| Difficulty in assessing cost impacts in early design | Designers, Architects, Cost Planners | Link real-time cost datasets to BIM models | Explores how project-specific cost databases could improve early-stage decision making and support cost-efficient material selection. |
| Lack of collaboration between stakeholders in sustainability workflows | All Stakeholders | Define clear responsibilities and data-sharing protocols | |
| Inconsistent integration of circularity metrics in BIM | Sustainability Experts, BIM Managers | Develop standardized circularity indicators for BIM | Suggests a systematic approach for embedding circularity metrics into BIM, improving comparability and decision making. |
Disclaimer/Publisher’s Note: The statements, opinions and data contained in all publications are solely those of the individual author(s) and contributor(s) and not of MDPI and/or the editor(s). MDPI and/or the editor(s) disclaim responsibility for any injury to people or property resulting from any ideas, methods, instructions or products referred to in the content. |
© 2025 by the authors. Licensee MDPI, Basel, Switzerland. This article is an open access article distributed under the terms and conditions of the Creative Commons Attribution (CC BY) license (https://creativecommons.org/licenses/by/4.0/).
Share and Cite
Pibal, S.S.; Bittner, R.; Kovacic, I. A BIM-Based Framework for Life Cycle, Cost, and Circularity Data Integration in Environmental Impact Assessment. Sustainability 2025, 17, 2656. https://doi.org/10.3390/su17062656
Pibal SS, Bittner R, Kovacic I. A BIM-Based Framework for Life Cycle, Cost, and Circularity Data Integration in Environmental Impact Assessment. Sustainability. 2025; 17(6):2656. https://doi.org/10.3390/su17062656
Chicago/Turabian StylePibal, Sophia Silvia, Rene Bittner, and Iva Kovacic. 2025. "A BIM-Based Framework for Life Cycle, Cost, and Circularity Data Integration in Environmental Impact Assessment" Sustainability 17, no. 6: 2656. https://doi.org/10.3390/su17062656
APA StylePibal, S. S., Bittner, R., & Kovacic, I. (2025). A BIM-Based Framework for Life Cycle, Cost, and Circularity Data Integration in Environmental Impact Assessment. Sustainability, 17(6), 2656. https://doi.org/10.3390/su17062656