Abstract
With the intensification of global resource competition, the issue of timber supply has escalated from an economic concern to a significant strategic challenge. This study focuses on the evolution of disruption resilience in the global trade network for wood forest products, aiming to reveal the patterns of resilience dynamics under disruption risks by simulating underload cascading failure phenomena. The study provides theoretical support for enhancing the security and stability of the global wood forest product supply chain. Utilizing global trade data from the UN Comtrade Database 2023, a directed weighted complex network model was constructed, spanning upstream, midstream, and downstream sectors, with trade intensity distances serving as edge weights. By developing an underload cascading failure model, the evolution of disruption resilience was simulated under various disruption scenarios from 2002 to 2023, and the long-term impacts of critical node failures on network performance were analyzed. The results demonstrate significant spatiotemporal heterogeneity in the disruption resilience of the global wood forest product trade network. The upstream network exhibits improved resilience in total node strength but reduced global efficiency. The midstream network shows marked volatility in resilience due to external shocks, such as the global financial crisis, while the downstream network remains relatively stable. Simulations reveal that failures in core nodes (e.g., China, the United States, and Germany) disproportionately degrade global efficiency and node strength, with node centrality metrics positively correlated with network performance loss. This study elucidates the evolutionary mechanisms of disruption resilience in the wood forest product trade network under risk propagation, offering actionable insights for optimizing network robustness and supply chain stability. It is recommended that policymakers promote green supply chain initiatives, accelerate afforestation projects, and enhance domestic timber self-sufficiency to reduce reliance on imported timber, thereby strengthening node resilience and fostering sustainable forest resource utilization for economic and environmental benefits.
1. Introduction
Wood forest products are widely used in various fields due to their economic, ecological, and renewable properties [1]. Their transnational trade is crucial for sustaining global economic growth, meeting timber demands, and conserving forest resources [2]. Global timber production has reached a record annual volume of 4 billion cubic meters, with wood forest product exports hitting a historic high of USD 576 billion in 2022 [3]. The uneven global distribution of forest resources [4]—which are primarily concentrated in Russia, Brazil, Canada, the United States, and China [5]—compels many countries to engage in wood forest product trading to balance supply–demand dynamics, drive economic growth, and meet market needs. This trade forms a complex transnational network, the structural and dynamic characteristics of which have attracted significant attention. With intensifying global resource competition, timber supply issues have evolved from general economic concerns into major strategic challenges [6]. Environmental protection, resource endowments, and geopolitical factors increase the risk of supply disruptions in timber-exporting countries. Once a disruption occurs and triggers a cascading failure, it can cause significant damage to the global wood forest product trade network, potentially leading to the collapse of the entire network. To address this challenge, it is necessary to use scientific models to reveal the patterns of disruption propagation and to assess and analyze network resilience. This approach helps to identify vulnerable segments and potential risks within the network when it is subjected to internal and external shocks.
Recent studies have progressively deepened the understanding of wood forest product trade networks, with particular focus on the roles of core node countries. Tian and Jiang (2016) identified the United States as the core country in the international roundwood trade, while noting the rise of emerging economies like China [7]. Long et al. (2016) revealed the multilateralization trend of international wood forest product trade networks using social network analysis [2]. Pizzol and Scotti (2017) identified marginal suppliers through a trade network analysis [8], whereas Lovrić et al. (2018) demonstrated the intense competition and complementarity between China and countries such as Austria and Germany [9]. Wang et al. (2021) found that China, together with the Netherlands, France, and the United States, forms key hubs in the global network [10]. Zhou et al. (2021) highlighted China and Thailand as core countries with high centrality and growing influence [11]. Hou et al. (2022) emphasized how trade network characteristics affect global value chain positioning, with core countries maintaining dominance [12]. Li et al. (2022) confirmed China’s core status in the Regional Comprehensive Economic Partnership (RCEP) wood forest product trade network [13]. Wang et al. (2023) analyzed global forest product trade from 2000 to 2020, revealing that processed product networks exhibit tighter connectivity and higher efficiency, dominated by high-GDP countries [14]. Liu et al. (2024) further validated the rising influence of Asian developing countries, which now jointly control the global market with North American and European nations [15]. Gao (2023) investigated the complexity and centrality shifts in these networks, arguing that free trade agreements exacerbate imbalances in global forest resources [16]. The global wood forest product network exhibits distinct small-world characteristics—high clustering coefficients with short path lengths. Over time, deepening trade relationships, expanding volumes, and increased bilateral exchanges have made the network structure more ordered. Existing research on the trade network of wood forest products has made significant progress, successfully revealing the topological structures and dynamic changes of core countries within the network and establishing an analytical framework centered on trade volume as the core weight. However, there has been little research on the weighted characteristics of trade routes, which makes it difficult to effectively incorporate weighted factors into network metrics such as the average path length, global efficiency, node-betweenness centrality, and closeness centrality. This limitation hinders the practicality and depth of network models.
As trade network structure research matures, trade security has emerged as a critical issue facing multiple threats, including natural disasters, political and economic fluctuations, and changes in trade policies. The academic community is increasingly focusing on the intrinsic relationship between network structure and security, recognizing that network resilience is a core element for ensuring system stability. This growing recognition is driving related research from traditional topological analysis to more sophisticated resilience-assessment paradigms, thereby forming a new and dynamic research hotspot. Originating from mechanics [17], the concept of resilience refers to a system’s ability to recover its original state or function after disturbances. Network resilience specifically denotes the capacity of networked entities to collaboratively respond to external shocks through adaptation and transformation [18]. With advances in complex network theory, resilience analysis now spans diverse fields: biological systems [19], urban networks [20], transportation [21], economics [22], supply chains [23], and ecological networks [24]. These applications focus on analyzing system responses and recovery capabilities under disruptions.
Network resilience research has evolved from simplicity to complexity since 2007, focusing on four key aspects. The first of these concerns structural determinants: studies show that network density [25,26,27], average path length [28], clustering coefficients [29,30], global efficiency [31,32], hierarchy [33], and assortativity [34] critically influence resilience. Key nodes—particularly those with high betweenness centrality and degree—significantly affect resilience. Optimizing these features enhances disruption resistance and recovery [35]. The second focuses on responses to attack types: random failures cause limited damage, whereas targeted attacks (especially centrality-based ones) severely disrupt networks [36]. Dynamic networks exhibit self-recovery under specific conditions [37]. Effective strategies include structural adaptations, i.e., protecting critical nodes and increasing redundancy [28]. The third area concerns assessment methodologies: resilience evaluation involves complexity reduction, graph–theoretic models for vulnerability identification [38], performance curves visualizing post-attack changes [39], and multi-factor integration [40]. Simulated attacks under extreme conditions form a comprehensive assessment framework. The fourth area concerns risk transmission mechanisms: complex network models and simulations map risk propagation paths [41], revealing network response and recovery mechanisms during crises. Currently, the research on network resilience is predominantly focused on areas such as infrastructure, ecological networks, and transportation networks. Studies on trade network resilience remain in their nascent stages. The core challenge lies in the fundamental differences in dynamic behavior mechanisms following disruptions. Unlike the continuous failure propagation observed in physical networks, disruptions in trade networks trigger discrete cascading failures, characterized by asymmetric jumping patterns of risk diffusion. This distinctive feature necessitates a departure from traditional resilience evaluation frameworks and calls for the establishment of a new analytical paradigm that is specifically tailored to the resilience of trade networks.
Network disruption resilience refers to a network’s ability to maintain or restore acceptable performance under natural risks or intentional attacks [42]. Dynamic resilience assessment through cascading failure analysis under load redistribution mechanisms constitutes a critical research focus [43]. Cascading effects are defined as dynamic mechanisms where initial failures propagate through physical, social, or economic subsystems, ultimately causing severe consequences [44]. The existing studies predominantly employ load–capacity models. Crucitti et al. (2004) developed a cascading failure model with dynamic traffic redistribution, revealing the impacts of single-node failures on network efficiency [45]. Ash and Newth (2007) optimized complex networks against cascading failures using evolutionary algorithms [29]. Wang et al. (2008) established an initial node load-based model to quantify attack vulnerability in scale-free networks [46], while proposing locally weighted redistribution rules to analyze robustness in weighted networks [47]. Dueñas-Osorio and Vemuru (2009) introduced a tolerance parameter model to quantify capacity–demand relationships in infrastructure networks [48]. Recent advances focus on weighted networks and domain-specific systems. Mirzasoleiman et al. (2011) compared network performance under three weighting strategies: edge betweenness, node degree, and betweenness-degree products [49]. Mukherjee et al. (2014) investigated adaptive mechanisms for catastrophic disruptions in telecommunication networks [50]. Han (2017) proposed a tunable cascading failure model, integrating node betweenness, degree, and weight for initial load construction [51]. Li (2018) developed network connectivity entropy metrics for hierarchical network reliability assessments [52]. Cui (2021) designed network operation degree indicators to evaluate failure impacts in directed weighted supply chains [53]. Cascading failure research in trade networks has recently emerged: Li et al. (2021) simulated avalanche effects in global plastic waste trade networks [54]. Hao et al. (2023) assessed lithium trade network robustness under random/targeted attacks [55]; Fu et al. (2024) proposed two-stage recovery strategies for automotive supply chains, identifying underload nodes as primary resilience degradation drivers [56]. Yin et al. (2024) revealed crisis propagation patterns in semiconductor trade networks [57]. Wang et al. (2024) incorporated national risk absorption capacities into improved models for iron ore trade disruption analysis [58]. Finally, Ouyang et al. (2024) combined trade volume and network analysis to characterize static/dynamic resilience in lithium supply chains [59].
Existing studies demonstrate that overload cascading failure models are widely applied, yet their theoretical frameworks prove inadequate for underload cascading failure scenarios. The fundamental distinction lies in failure triggers: overload failures occur when the node load exceeds maximum capacity, whereas underload cascading failures arise from loads dropping below the minimum operational thresholds, leading to performance degradation or functional loss [60]. These differences manifest not only in failure initiation conditions but also in the dynamic characteristics of load redistribution mechanisms. Although overload failure research is relatively mature, studies on underload cascading failures in resource trade networks remain nascent. Critical aspects including modeling approaches, propagation mechanisms, and systemic impacts on global trade networks require further exploration. Particularly in global resource trade networks, underload failures may induce unique cascading effects and network reconfiguration patterns that remain uncharacterized. This research gap underscores the urgent need for theoretical and empirical investigations to advance disruption resilience studies in global resource trade networks.
This study makes theoretical contributions by proposing an innovative underload cascading failure model based on disruption risk propagation, constructing a directed weighted complex network model using global wood forest product trade data (2002–2023) and systematically revealing the long-term impact of network structure evolution on resilience. It extends the existing resilience evaluation framework and provides methodological references for other complex network studies. Practically, our research delivers three key values: the dynamic evolution model accurately characterizes network structure evolution patterns and their resilience impacts, offering a scientific basis for trade network stability optimizations. Multi-scenario simulations are used to analyze network resilience features and quantitatively assess the long-term effects of critical node failures on global efficiency and node strength. Moreover, the establishment of a network resilience evaluation system based on quantitative correlations between node characteristics and performance loss provides direct support for the formulation of risk management strategies. This research not only deepens the understanding of trade network resilience but also offers critical decision-making references for optimizing the stability and risk management of the global wood forest product trade network.
2. Data Sources and Research Methodology
2.1. Data Sources and Research Framework
Wood forest products, as direct derivatives of forest resources, comprise three structural tiers: upstream primary products (e.g., logs, sawn timber, wood pulp), midstream processed goods (e.g., artificial boards, composite materials), and downstream end-consumer products (e.g., paper, wooden furniture). Based on the HS code classification system from the literature [61] (see Table 1), this study integrates 2002–2023 trade data from the UN Comtrade Database. The dataset systematically categorizes 1,023,568 trade records across 231 countries/regions into upstream, midstream, and downstream sectors.

Table 1.
HS codes of wood forest products.
For the sake of data consistency, the study utilizes import-based data. To handle missing values in trade data, a stratified mean imputation method is employed: first, the data are grouped according to HS codes and years. Within the same combination of code and year, the arithmetic mean of non-missing trade volumes is used to fill in the missing values, ensuring the homogeneity and temporal consistency of the imputed values. Additionally, regional consolidation (merging data from Hong Kong and Macau into China but not including Taiwan) and trade relationship thresholds (setting a threshold of 50 USD, below which trade relationships are disregarded) have been addressed.
Based on complex network and resilience theory, this study explores the disruption resilience of the global wood forest products trade network. To conduct a comprehensive study, we construct a directed weighted trade network model for wood forest products that encompasses upstream, midstream, and downstream sectors. The upstream network focuses on the supply of primary forest products such as logs and sawn timber; the midstream network centers on the trade of semi-finished goods such as plywood and wood pulp; and the downstream network maps the consumption market of final products such as furniture and paper products. By quantifying trade scales through weighting, we can accurately identify critical supply routes and avoid misjudging minor connections, clarifying each country’s pivotal role and competitive–complementary relationships within the global network. This provides solid data support for optimizing timber supply security and developing risk control strategies.
On this basis, the study analyzes scenarios of disruption risk propagation by constructing an overload cascade failure model to assess performance loss and average retained network performance under disruption disturbances. This approach evaluates node importance and network resilience, along with their evolutionary characteristics from 2002 to 2023, providing theoretical support and practical guidance for maintaining the stability and security of the wood forest product trade network. It contributes to building a more robust, flexible, and sustainable global trade system for wood forest products. The overall research framework is shown in Figure 1. This study not only covers the entire chain of wood forest products but also constructs a global network spanning trade relations between 231 countries and regions. Additionally, it analyzes data from 2002 to 2023, forming a 22-year multidimensional, comprehensive systematic model.
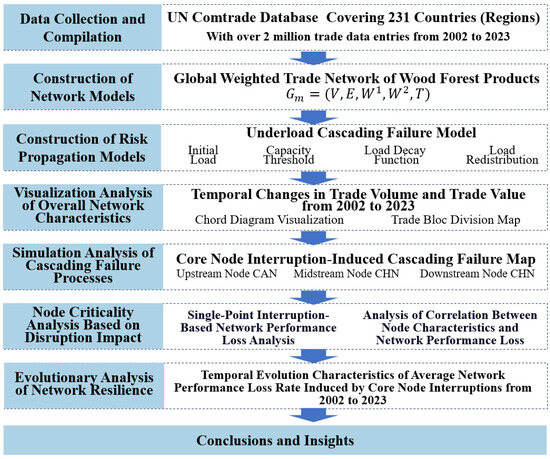
Figure 1.
Research framework.
2.2. Graph Theory Model Construction
Using the countries (regions) involved in global wood forest products trade as network nodes, trade relationships between countries (regions) as edges, and trade volume and trade closeness as weights, a complex network model is constructed. The wood forest products supply network is defined as follows:
where m represents the three different types of global wood networks, namely, upstream, midstream, and downstream. The node set V represents the collection of all countries (regions); the edge set E represents the collection of trade relationships between all countries (regions); represents the collection of edge weights for trade volumes between all nodes; represents the collection of edge weights for trade closeness between all nodes; and represents the collection of years.
Here, trade volume (in kilograms) is selected as the edge weight for modeling to avoid the influence of inflation and price fluctuations, thereby accurately revealing the trade relationships and dependency levels within the supply chain, which is crucial for analyzing network characteristics. Additionally, drawing on existing research [27], trade closeness is introduced as an edge weight to explore its impact on the shortest path length. The specific calculation formula for this edge weight is as follows:
where represents the trade closeness between node and node ; denotes the maximum edge trade volume in the network; and represents the trade volume of wood forest products exported from node to node . In practice, trade closeness is undoubtedly influenced by a multitude of complex factors, such as political relations, geographical proximity, cultural differences, and numerous other factors that are difficult to quantify. However, within the specific analytical framework of this study, we focus solely on the core element of trade volume.
2.3. Key Indicators for Analyzing Complex Network Models
On the basis of constructing the graph theory model, we further explain various metrics that are closely related to the subsequent underload cascading failure model and node characteristic analysis, as shown in Table 2.
Table 2.
Indicators related to complex networks.
The modularity Q in the table above is primarily used in the Louvain algorithm for community detection. The Louvain algorithm, proposed by Blondel et al. in 2008 [63], is an efficient community detection algorithm based on modularity optimization. By iteratively optimizing modularity Q, the algorithm identifies community structures within the network, offering advantages such as high computational efficiency and suitability for large-scale networks. Its core idea is to progressively improve modularity through local optimization, ultimately achieving a globally optimal community division result.
2.4. Disruption Resilience Evaluation Metrics
In the resilience assessment process, we conducted network disruption resilience analysis under the conditions of single-node disruptions induced by underload cascading failures. Specifically, the analysis involved examining the network performance loss rate following single-node disruptions to investigate the intrinsic relationships between node characteristics and network performance degradation. This step facilitated the identification of critical nodes and their impact levels on the overall network performance. Subsequently, the disruption resilience characteristics of the network were revealed by calculating the average network performance retention rate after disruptions to multiple core nodes. This metric reflects the network’s overall robustness and anti-disruption capabilities when facing critical node failures.
The formulas for the single-node-disruption-induced network performance loss rate and single-node disruption resilience are presented below:
Here, represents the network performance loss rate after the disruption of node i; denotes the network’s anti-disruption resilience; is the network performance retention value following the disruption of node i; indicates the initial network performance value; and ‘N’ refers to the number of core nodes in the network.
We selected global efficiency and total node strength of the network as key metrics. The propagation of node disruption risks triggers cascading decay and failure reactions, leading to increased average shortest path lengths and reduced trade volumes among nodes, thereby diminishing both global efficiency and total node strength. The formulas for global efficiency loss rate and global efficiency disruption resilience under single-node disruptions are defined as follows:
where denotes the global efficiency loss rate after the disruption of node i, represents the global efficiency disruption resilience, is the initial weighted global efficiency (with trade proximity weights), is the retained global efficiency value after the disruption of node i, and indicates the number of core nodes in the network.
The changes in total node strength under single-node disruptions directly reflect the network’s connection density, redundancy, and attack resistance capabilities. The formulas for total node strength loss rate and total node strength disruption resilience under single-node disruptions are expressed as:
Here, represents the total node strength loss rate, denotes the sum of the remaining node strengths across the network after the stabilization of the underload cascading failure reaction caused by the disruption of node i, is the initial total node strength of the network, and refers to the number of core nodes.
3. Construction of the Disruption Risk Propagation Model
3.1. Model Selection
This study focuses on the underload cascading failure in the trade network of wood forest products. Underload cascading failure occurs when a node’s trade volume is insufficient, leading to its failure, which subsequently affects downstream nodes, causing the disruption to propagate and amplify across the network. Previous studies on cascading failures have mainly focused on infrastructure networks such as power grids, transportation, and communication networks. However, the underload cascading failure in the wood forest product trade network differs fundamentally from these models. Specific differences are compared in Table 3.
Table 3.
Comparison of cascading failure mechanisms between infrastructure networks and the global wood forest product trade network.
On this basis, this study innovatively develops a cascading failure model that is closely tailored to the disruption risk propagation mechanisms specific to the wood forest products trade network. To model this, trade volume is treated as network load, and the network is simplified into an upstream-to-downstream directed structure. A load–capacity framework is adopted, where nodes are assigned initial loads, load decay thresholds, and failure lower bounds. After a disruption, loads are redistributed according to predefined strategies until network stabilization is achieved. The model is constructed based on four aspects—the initial load configuration, decay and failure capacities, load decay functions, and load redistribution mechanisms—in order to provide a foundation for simulating cascading failure dynamics and analyzing network performance evolution.
3.2. Initial Load Configuration
The initial load defines the starting point of the global wood forest product supply network in the underload cascading failure model, encompassing the import and export loads of nodes, as well as edge loads. These load distributions characterize the initial resource allocation and provide a baseline for dynamic simulations. The system vulnerability analysis, underload reallocation, and cascading failure propagation depend on the initial load settings. By establishing a clear baseline, the initial load enables the model to accurately reveal the response patterns of the network under disruption events and assess its resilience. The initial load configuration encompasses a node’s initial import load, initial export load, and the initial load on node i’s outgoing edges. The specific formulas are defined as follows:
where , represent node i’s initial import load, initial export load, and the initial load on the outgoing edge from node i to node j, respectively. These correspond to node i’s in-strength , out-strength , and the trade volume weight of the outgoing edge from node i to node j.
3.3. Decay Capacity and Failure Capacity
In the underload cascading failure model, the dynamic response behavior of nodes is divided into two stages. When a node’s load reaches its decay capacity, it enters an initial adaptive adjustment phase, known as the decay state, during which the node reduces its export volume to mitigate the underload caused by import reduction or interruption. Subsequently, when the node’s load reaches its failure capacity, it enters an irreversible functional collapse phase, termed the failure state. During this phase, the node interrupts its export volume to address underload caused by import reduction or interruption. This can potentially trigger a chain reaction of multi-layer failures. The formulas for decay capacity and failure capacity are defined as:
where and denote the decay capacity and failure capacity of node i, respectively; is the decay threshold, a key parameter regulating decay capacity during simulations; and is the failure threshold, governing failure capacity.
Different nodes exhibit distinct decay and failure coefficients. A node decay state function is further formulated as:
where is the decay state parameter, by which fi(t) = 1 indicates failure, fi(t) = 0 represents normal operation, and ≤ fi(t) ≤ corresponds to the decay state.
3.4. Export Load Decay Function
Before determining the allocation process for export decay amounts, first, the magnitude of the export decay is calculated using a decay function, which is set based on the coupling relationship between the import underload of a node and its load characteristics. Second, nodes are classified into three types according to their import load characteristics (as shown in Table 4), and different decay functions are determined based on the node type, thereby achieving differentiated dynamic responses in the decay amounts.
Table 4.
Export load decay node types.
Based on the node types defined in Table 3 and the node decay state function (Equation 14), the export load decay functions are further constructed as follows:
- (1)
- Export Load Decay Function for Type 1 (Import-Dominant) Nodes
The export load decay of import-dominant nodes is jointly influenced by the import–export load ratio and the node decay state. The function is formulated as:
where represents the export load decay at node i at time t. When , the node operates normally with zero decay. At , the node fails, and the export load drops to zero. For intermediate states (), the decay depends on and . The parameter quantifies the proportional relationship between export and import loads, calculated as:
When , the logarithmic difference vanishes ( = 1), aligning the decay rates of the export and import loads. For , the positive logarithmic difference reduces , amplifying the export load decay proportion () compared to the import load decay (). This reflects the heightened sensitivity of the export load to supply disruptions when import dependence is significant.
In summary, the α3 parameter plays a critical role in the export load decay model of import-dominant nodes. By dynamically adjusting the degree of export load decay based on the node’s import–export load ratio, it enables the model to precisely characterize the decay behavior of nodes across varying operational states. This mechanism holds substantial implications for understanding and analyzing how node failures in complex networks influence overall network performance.
- (2)
- Export Load Decay Function for Type 2 (Balanced Import–Export) Nodes
For nodes with slightly smaller import loads than export loads ( ≥ ; = 1/5), the decay function is:
In intermediate states (), the export load decay equals the reduction in the import load (), maintaining proportional decay.
- (3)
- Export Load Decay Function for Type 3 (Export-Dominant) Nodes
For nodes with import loads significantly smaller than export loads (), the decay function simplifies to:
In this formulation, only two states are defined: normal and decay, with no failure state. When , the export load decay equals the initial import load minus the import load at time . However, since the export load is significantly larger than the import load, the decay magnitude has a negligible impact on the export capacity.
3.5. Export Load Redistribution
When export load decay occurs, the decay amount must be redistributed to downstream nodes according to specific rules. Two scenarios are considered: first, if a node fails completely, its export load to all adjacent nodes drops to zero , and the edge load between node i and its neighbors decays to zero (). Second, if the node decays but remains functional, the export load is redistributed inversely proportionally to the strength of business relationships. This study posits that, during underload cascading failure, nodes with weaker relationships should receive a larger share of the decayed load, starting from the least critical trade partner, until the decay amount is fully allocated.
In the underload cascading failure model of the global wood supply network, the dynamic allocation mechanism of export reduction differs fundamentally from that in infrastructure network models. First, it follows the principle of global–local coupling assessment, where the importance of downstream nodes is evaluated based on both local supply strength and global topological influence to avoid underestimating the strategic value of nodes with high centrality but low export volumes, thereby improving risk identification accuracy. Second, it adopts the inverse proportion allocation logic principle, wherein lower relationship strength results in a higher allocation proportion, prioritizing the reduction of exports to weaker connections to safeguard critical links, reflecting a self-protection mechanism where nodes prioritize vital supply relationships under resource constraints.
To operationalize this, the importance of trade partner relationships between nodes is defined as:
where represents the trade partner importance, is the trade volume between nodes i and j, and is the eigenvector centrality of node j. The export neighbors of node i are ranked by ascending to form a sequence , where ki is the out-degree of node i. The residual allocatable decay amount is calculated as:
where denotes the remaining allocatable decay amount for node i’s edge to neighbor , and is the decay amount allocated to that edge.
For decay allocation in cycle t (starting with ):
Step 1: Calculate the decay allocation for the neighbor:
If > , compare with . If the former is larger, set ; otherwise, . If , compare with . Assign accordingly.
Step 2: Update the residual decay amount for the next neighbor:
Step 3: Repeat Steps 1–2 until all export edges of node i are processed.
The redistributed load alters adjacent nodes’ loads, triggering iterative updates until the underload cascading failure process halts:
(a) Compute the updated export load from node i to j in cycle t + 1:
(b) Update the import load for all nodes in the new cycle:
4. Results Analysis
4.1. Analysis of Overall Network Characteristics
This study examines the overall changes in the trade volume and trade value of global upstream, midstream, and downstream wood forest products from 2002 to 2023, as illustrated in Figure 2.
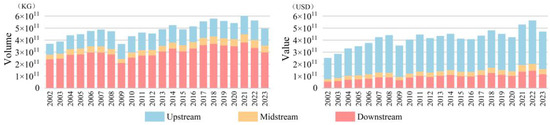
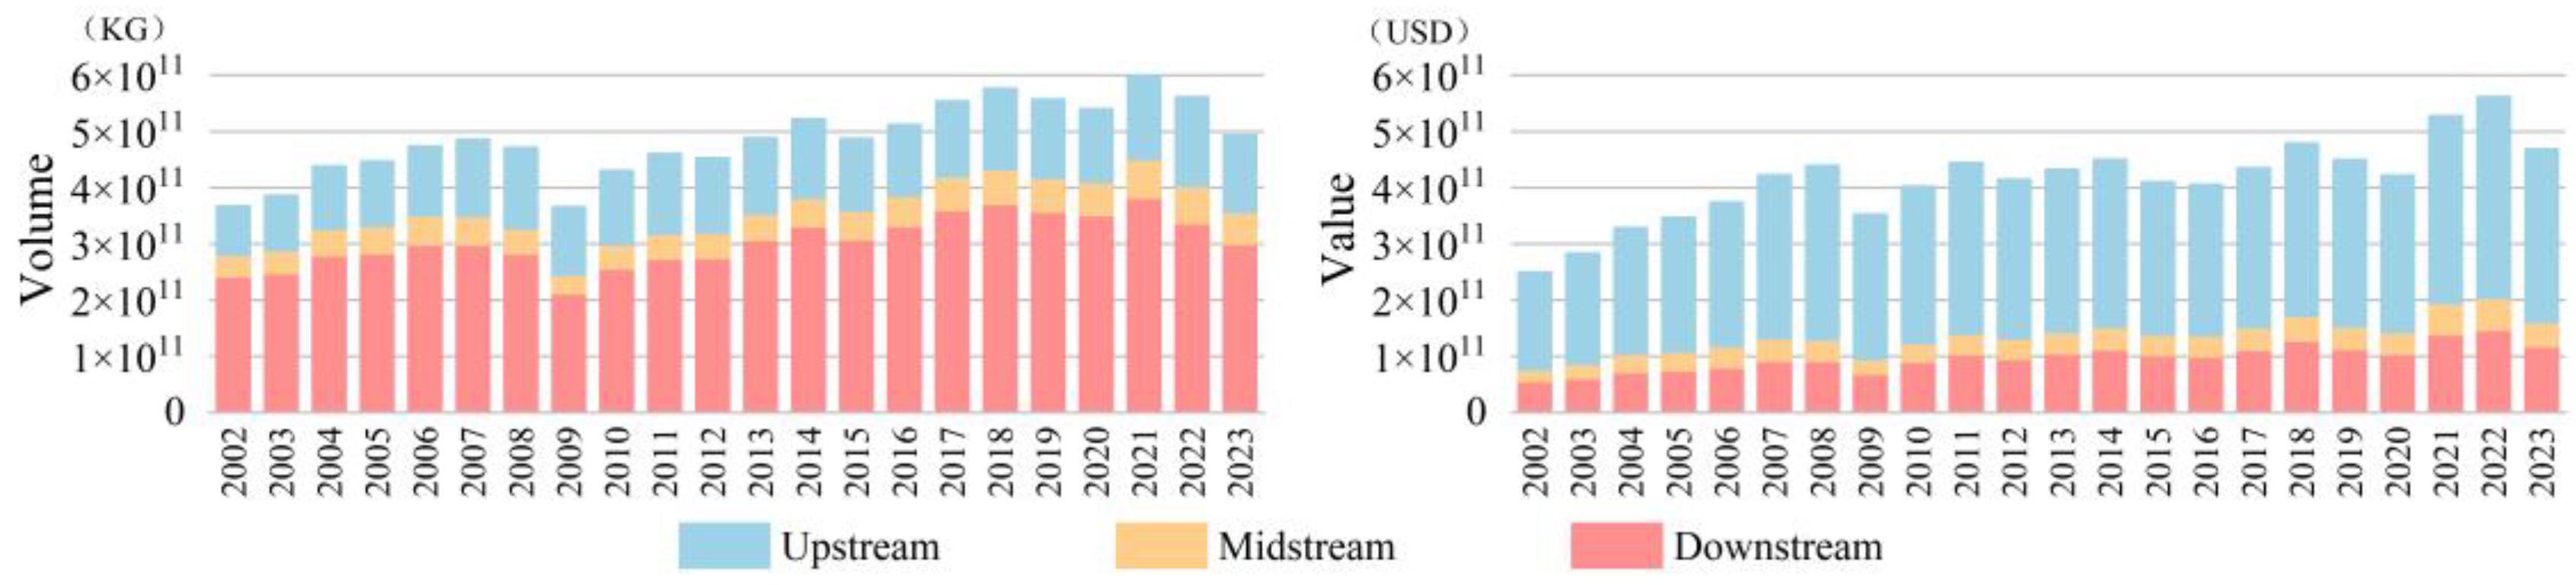
Figure 2.
Evolution of global wood forest products trade volume and trade value from 2002 to 2023.
Figure 2 shows that the trade volume and trade value of global wood forest products have shown a steady upward trend amidst fluctuations. Notably, upstream wood forest products have a large trade volume but low unit prices, accounting for the largest share of the total trade volume—over half—while their share of the total trade value is only about one-quarter. In contrast, downstream wood forest products have high trade value and unit prices, contributing nearly three-fifths of the total trade value, but only one-quarter of the total trade volume. The following analysis primarily focuses on trade volume to examine the wood forest products trade network.
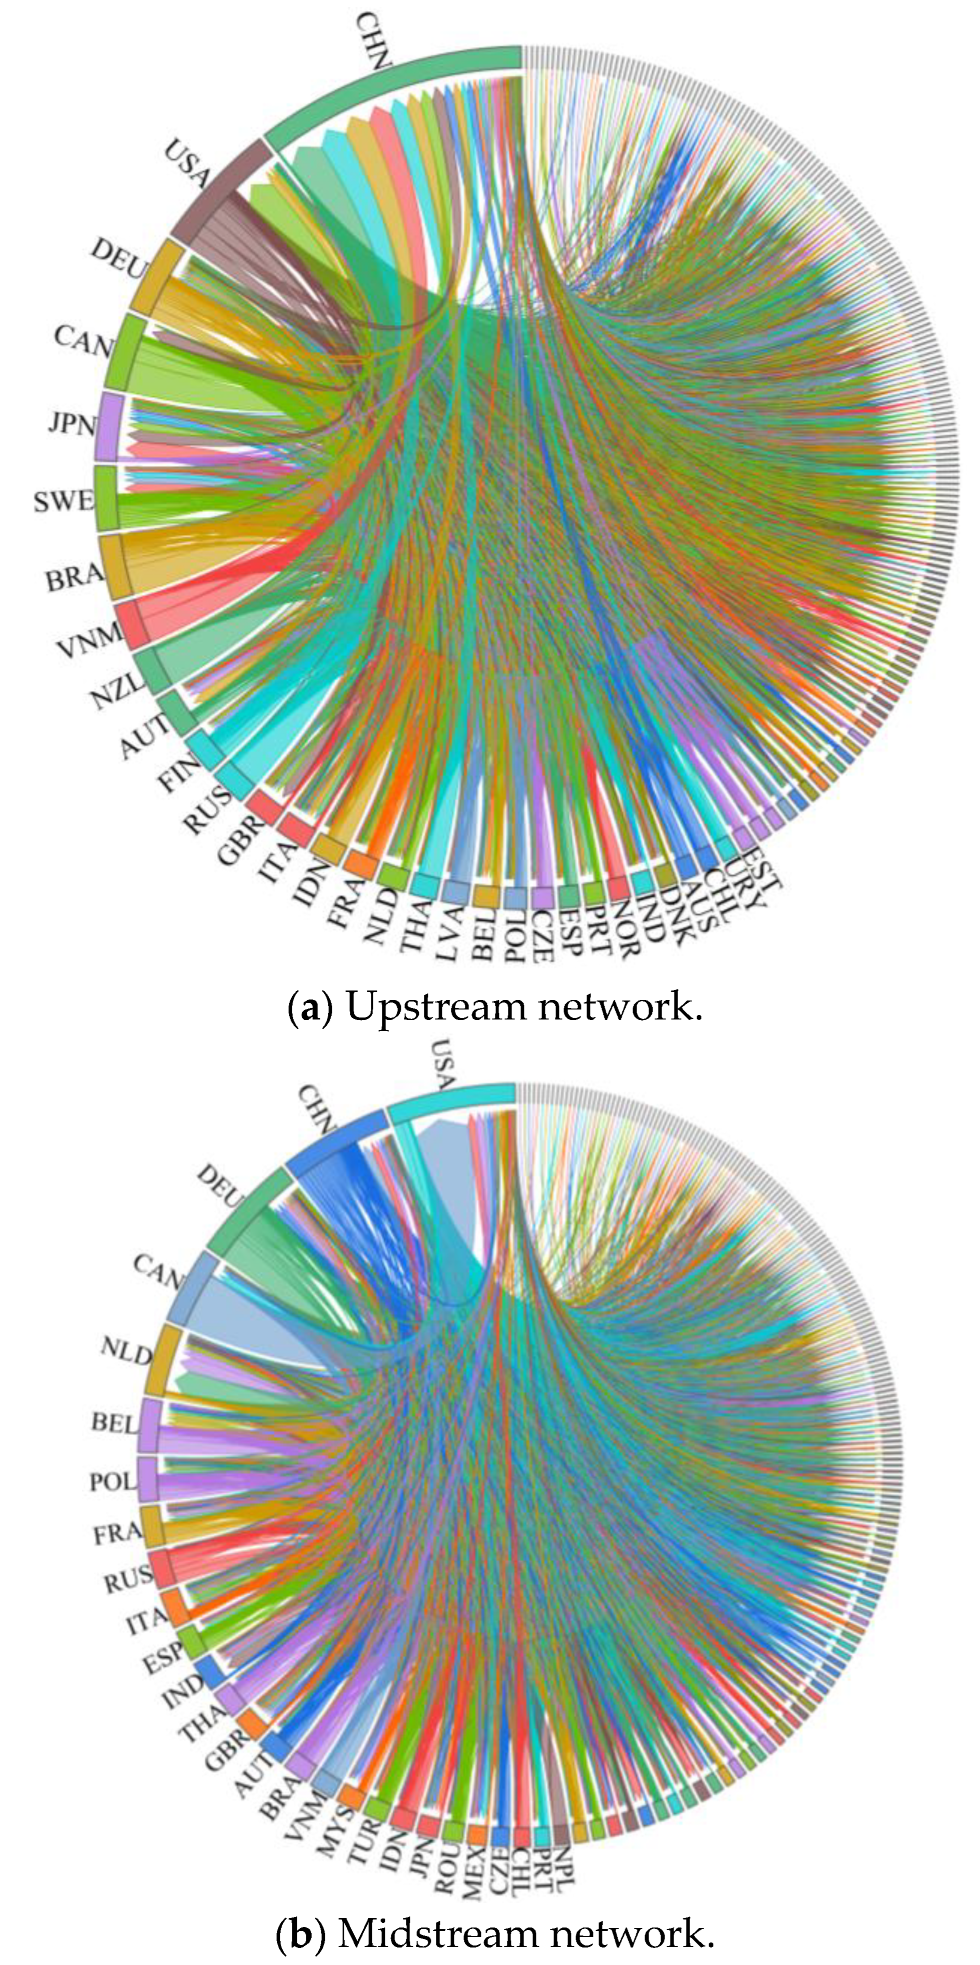
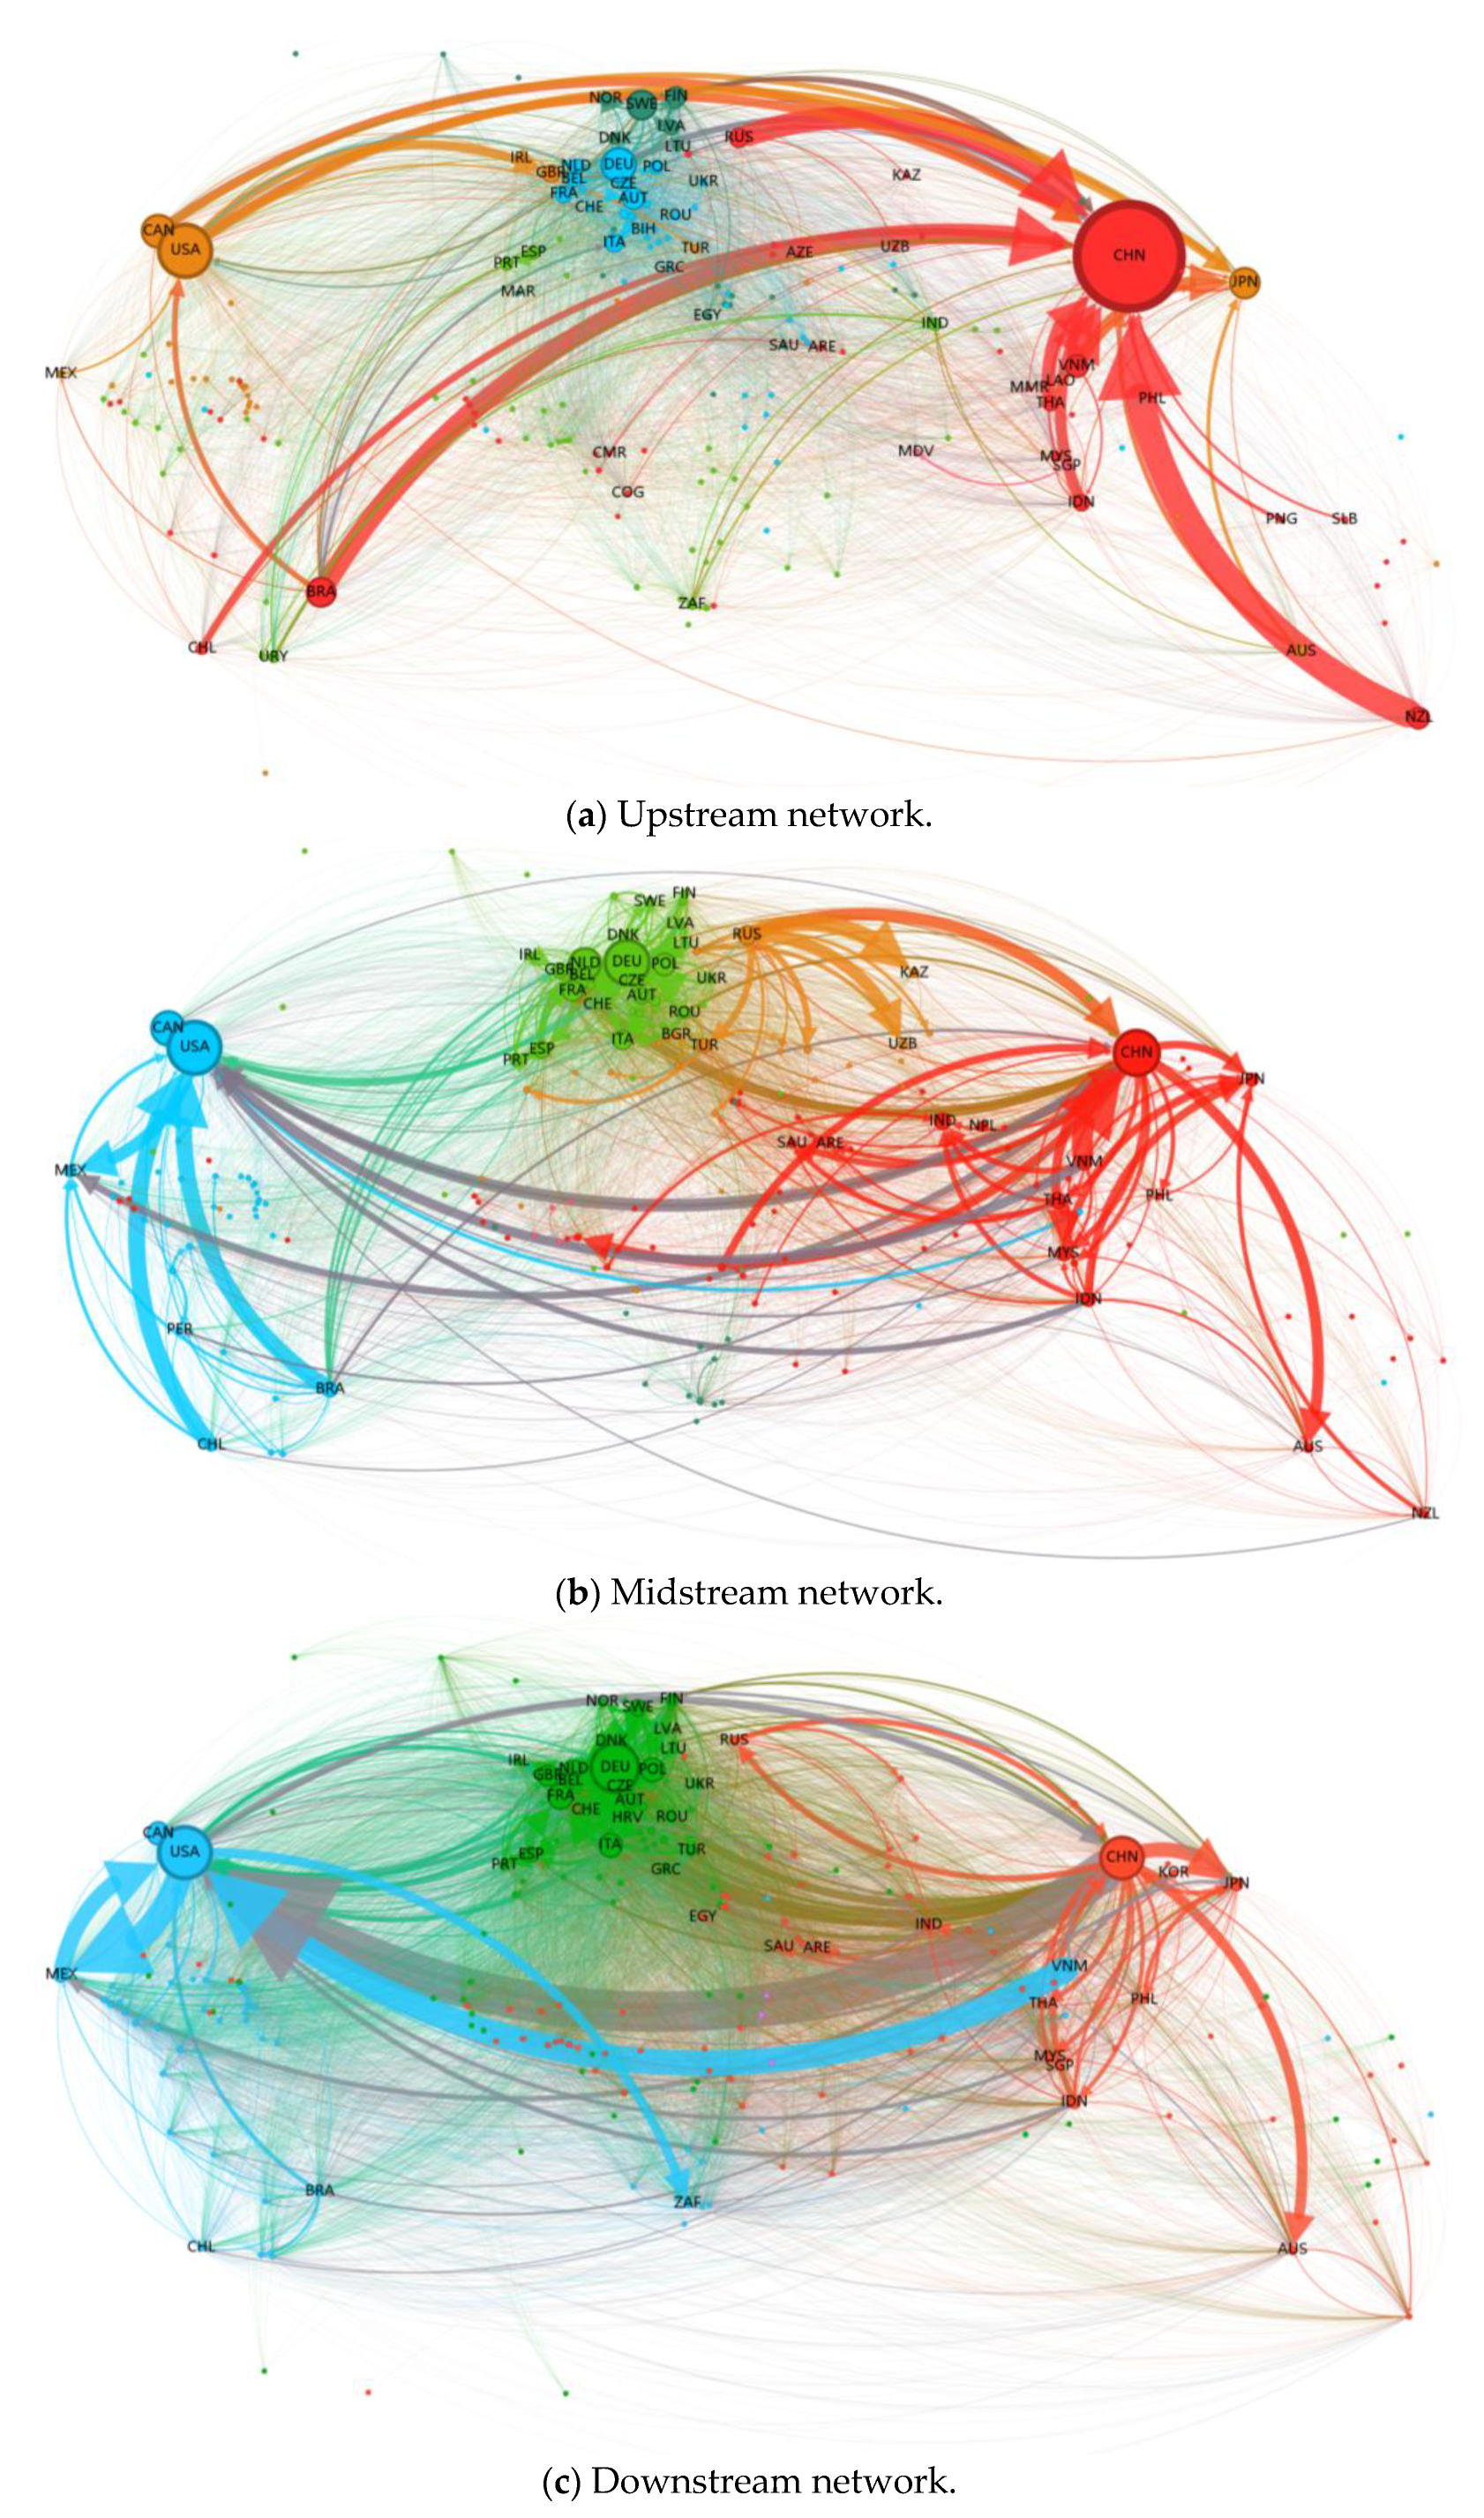
To clearly illustrate the trade volume relationships and proportional distributions among countries (regions) in the wood forest products trade network, this study employs chord diagram visualization to characterize trade patterns in three types of networks (Figure 3). In the diagram, the thickness of arcs represents trade volumes between countries (regions), with arrows indicating trade directions. Distinct trade dynamics emerge across different types of trade networks among countries (regions), reflecting variations in market vitality, trade relationships, and network balance. Regarding trade scale, the polarization degree of upstream networks significantly surpasses that of midstream and downstream networks.
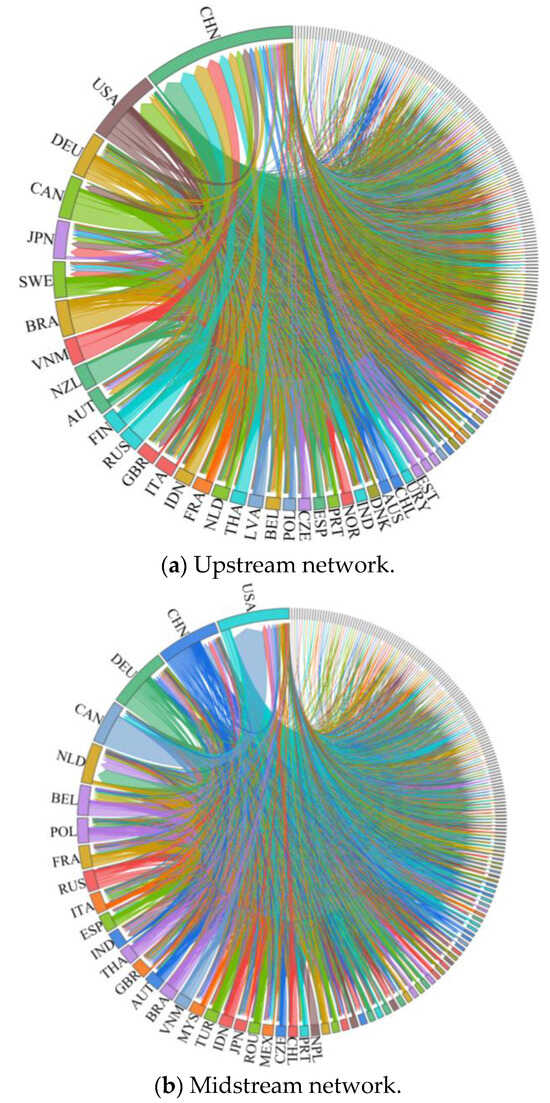
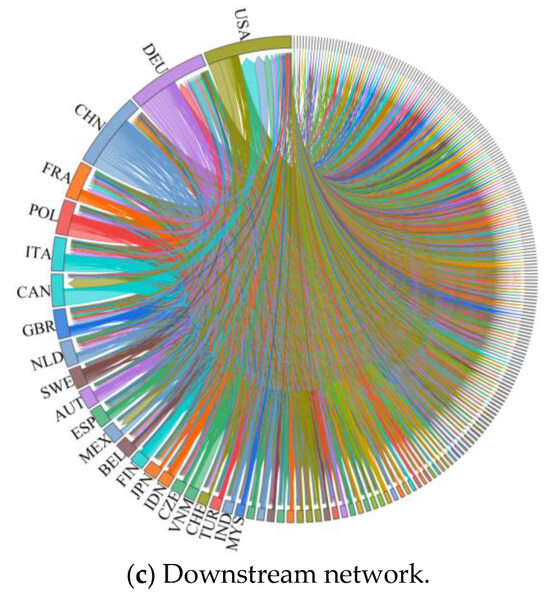
Figure 3.
Topological structure of the wood forest products supply network in 2023.
In the upstream network, China, the United States, Germany, Canada, and Russia serve as core nations, with their combined trade volume accounting for nearly one-third of the total upstream trade. This highlights the uneven distribution of wood forest product resources. As a major timber importer, China has established long-term cooperative relationships with countries rich in forest resources by integrating global supply chain resources, forming stable trade chains. This strategy has effectively enhanced its dominance in international markets and strengthened node resilience. In the midstream network, which is dominated by wood-based panels, the United States, Germany, China, and Canada collectively contribute nearly one-quarter of global trade volume. These nations are not only pivotal producers and consumers of wood-based panels but also possess advanced manufacturing industries and stable market demand. These advantages grant the midstream network robust recovery capabilities and resilience when facing external disruptions. In the downstream network, the United States, China, and Germany similarly occupy central positions, accounting for nearly one-quarter of global trade volume. China’s exports in this segment far exceed its imports, demonstrating the sophistication of its furniture manufacturing sector and its critical role in global markets. This dynamic also enhances the resilience and diversity of the downstream network.
After determining the topological structure of the wood forest products trade network, we applied the Louvain community detection algorithm to divide trade communities in the upstream, midstream, and downstream networks. This approach further reveals clustering relationships among countries (regions) and the characteristics of community structures within the network, with the results illustrated in Figure 4.
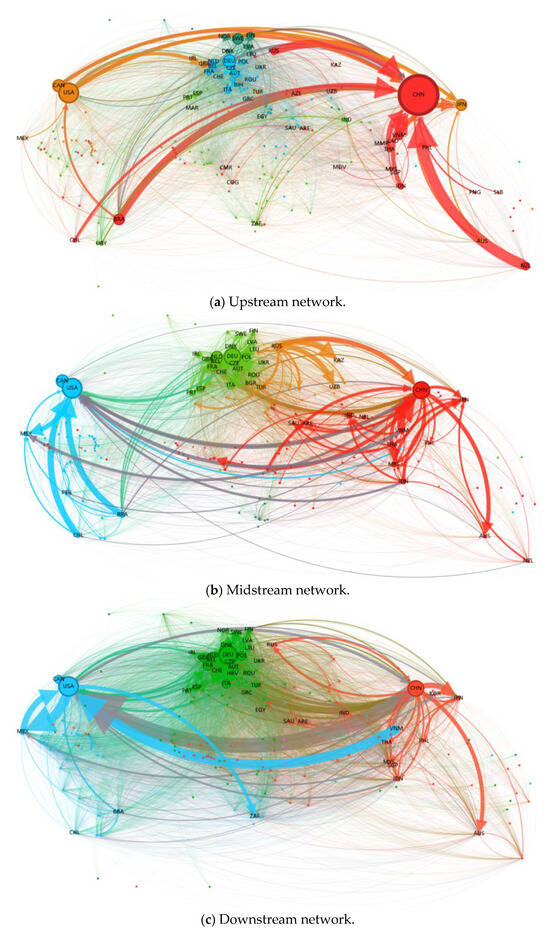
Figure 4.
Distribution of trade groups of wood forest products in 2023.
For ease of discussion, we define the largest node within each trade group as the core of the trade group; this node occupies a dominant position in the network. In 2023, the upstream wood forest products trade network could be divided into four major trade groups centered around China, Germany, the United States, and Switzerland. The midstream wood forest products trade network could be divided into four major trade groups centered around China, Germany, the United States, and Russia. The downstream wood forest products trade network could be divided into three major trade groups centered around China, Germany, and the United States. The division of trade groups and their core members in the upstream, midstream, and downstream networks are detailed in Table 5.
Table 5.
Classification of trade blocs for major countries (regions) in the upstream, midstream, and downstream networks.
4.2. Simulation Analysis of Underload Cascading Failure Propagation Process
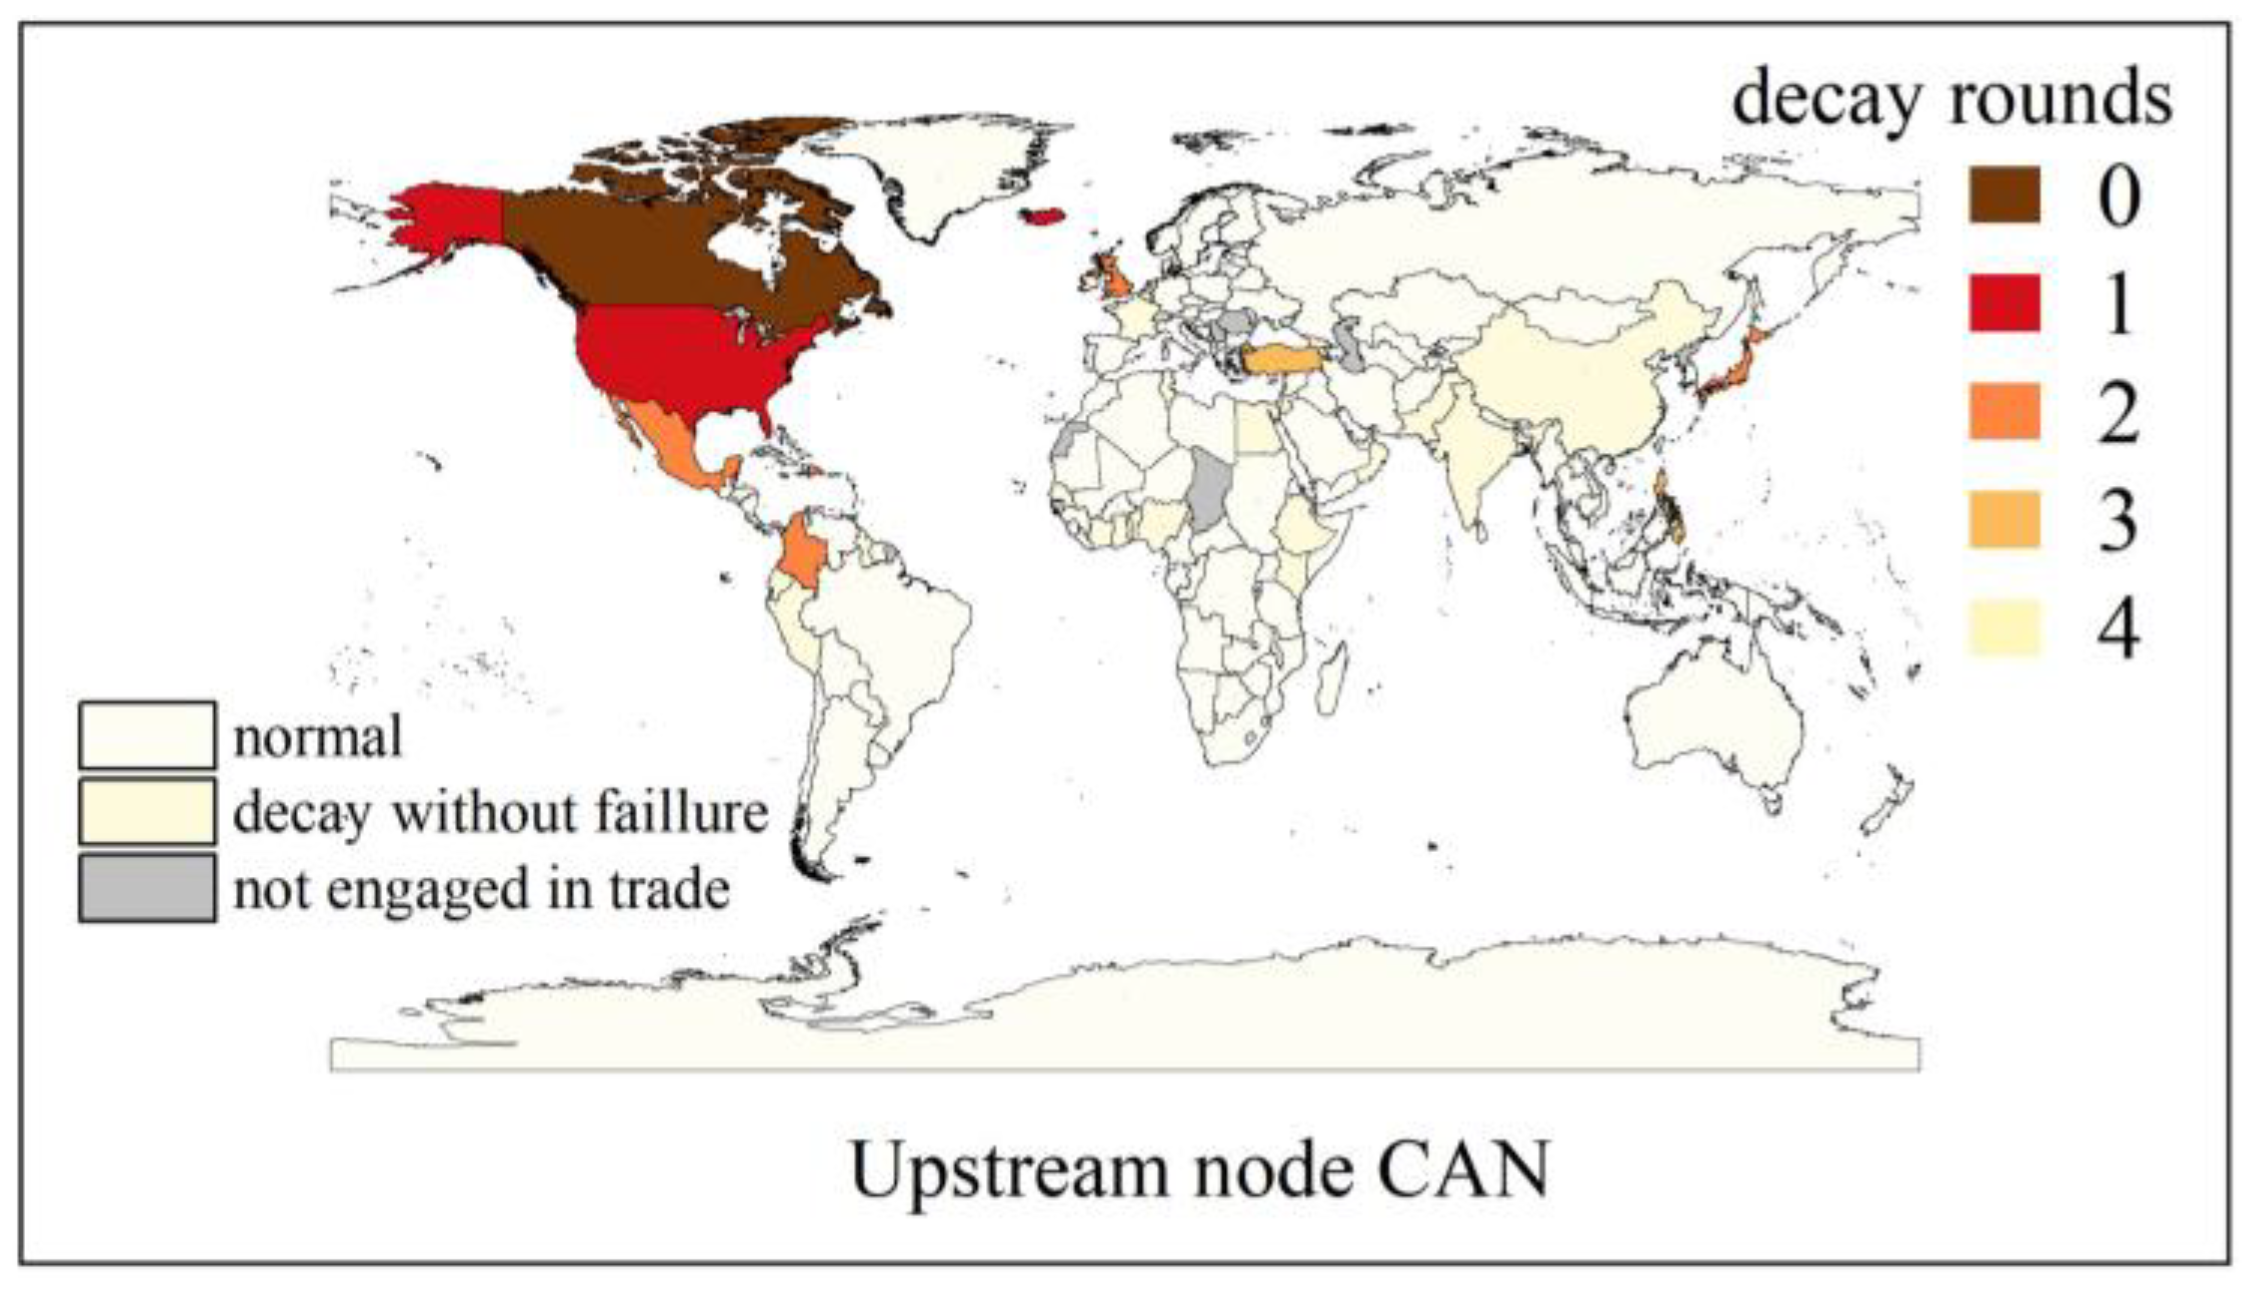
After analyzing the structural characteristics of the wood forest products network, we further investigated the performance and evolution of its disruption resilience, with a focus on underload cascading failures triggered by node disruptions. Using Python 3.12-based tools, we simulated the trade network based on an underload cascading failure model to capture the failure diffusion paths following node disruptions. Notably, Canadian nodes in the upstream network and Chinese nodes in the midstream and downstream networks exhibited prominent failure propagation effects. We specifically selected these critical nodes to illustrate the underload cascading failure propagation patterns among core exporting countries in the wood forest products trade network (Figure 5, Figure 6 and Figure 7).
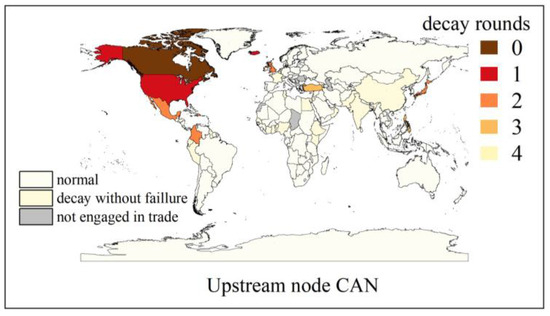
Figure 5.
Map of the underload cascading failure propagation process in the core supply nodes of the upstream network.

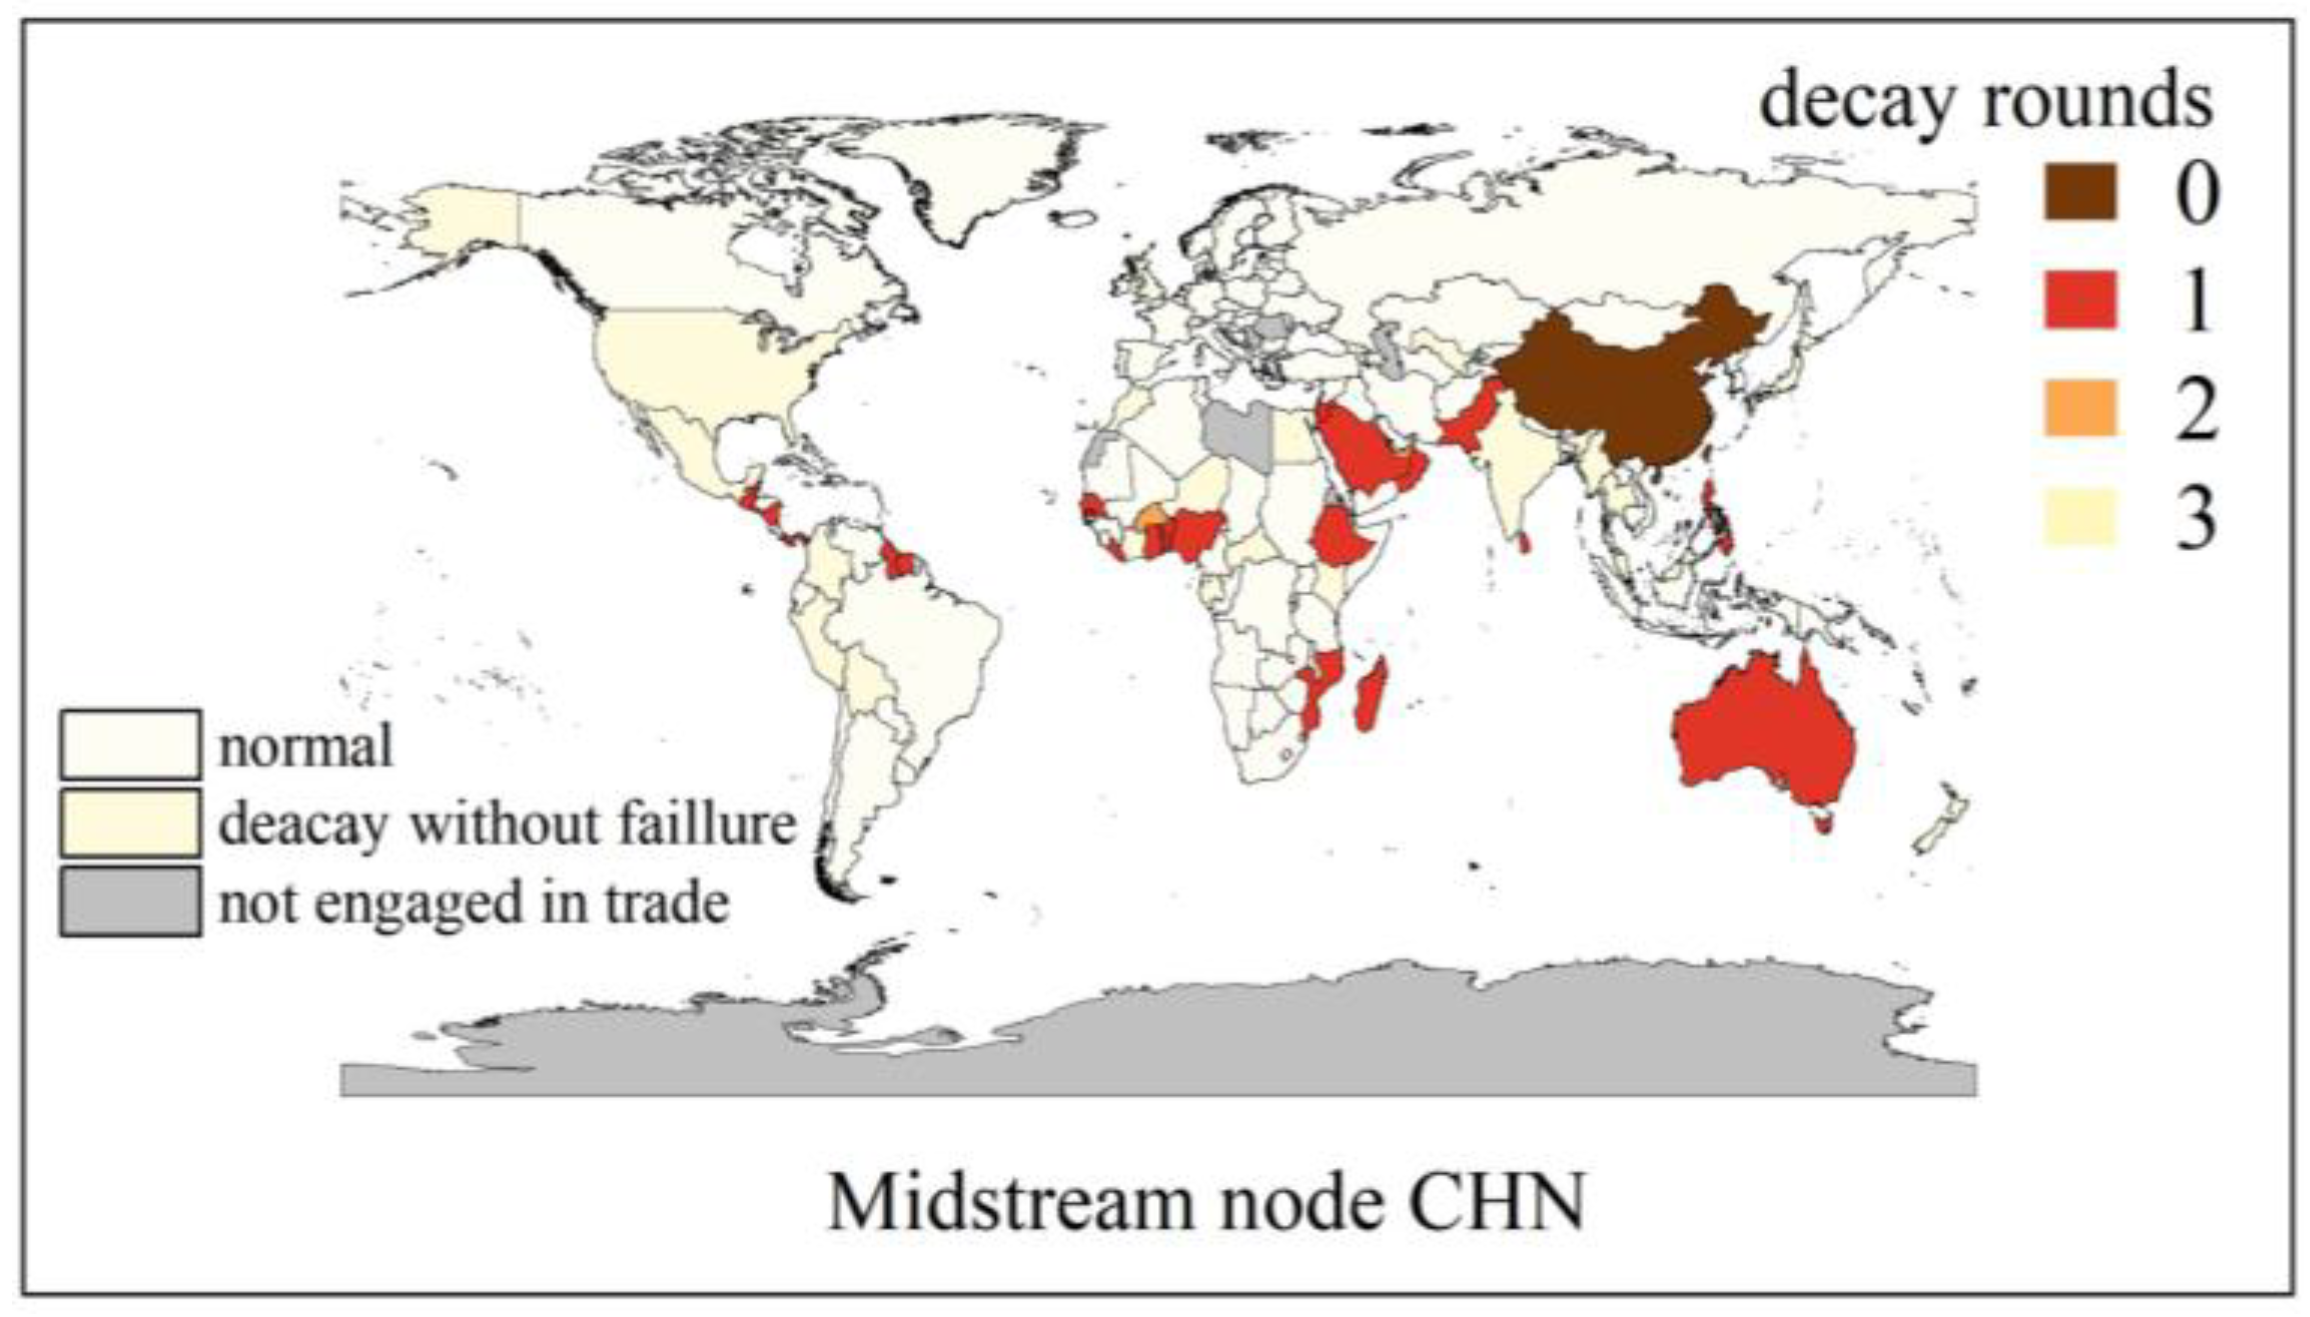
Figure 6.
Map of the underload cascading failure propagation process in the core supply nodes of the midstream network.

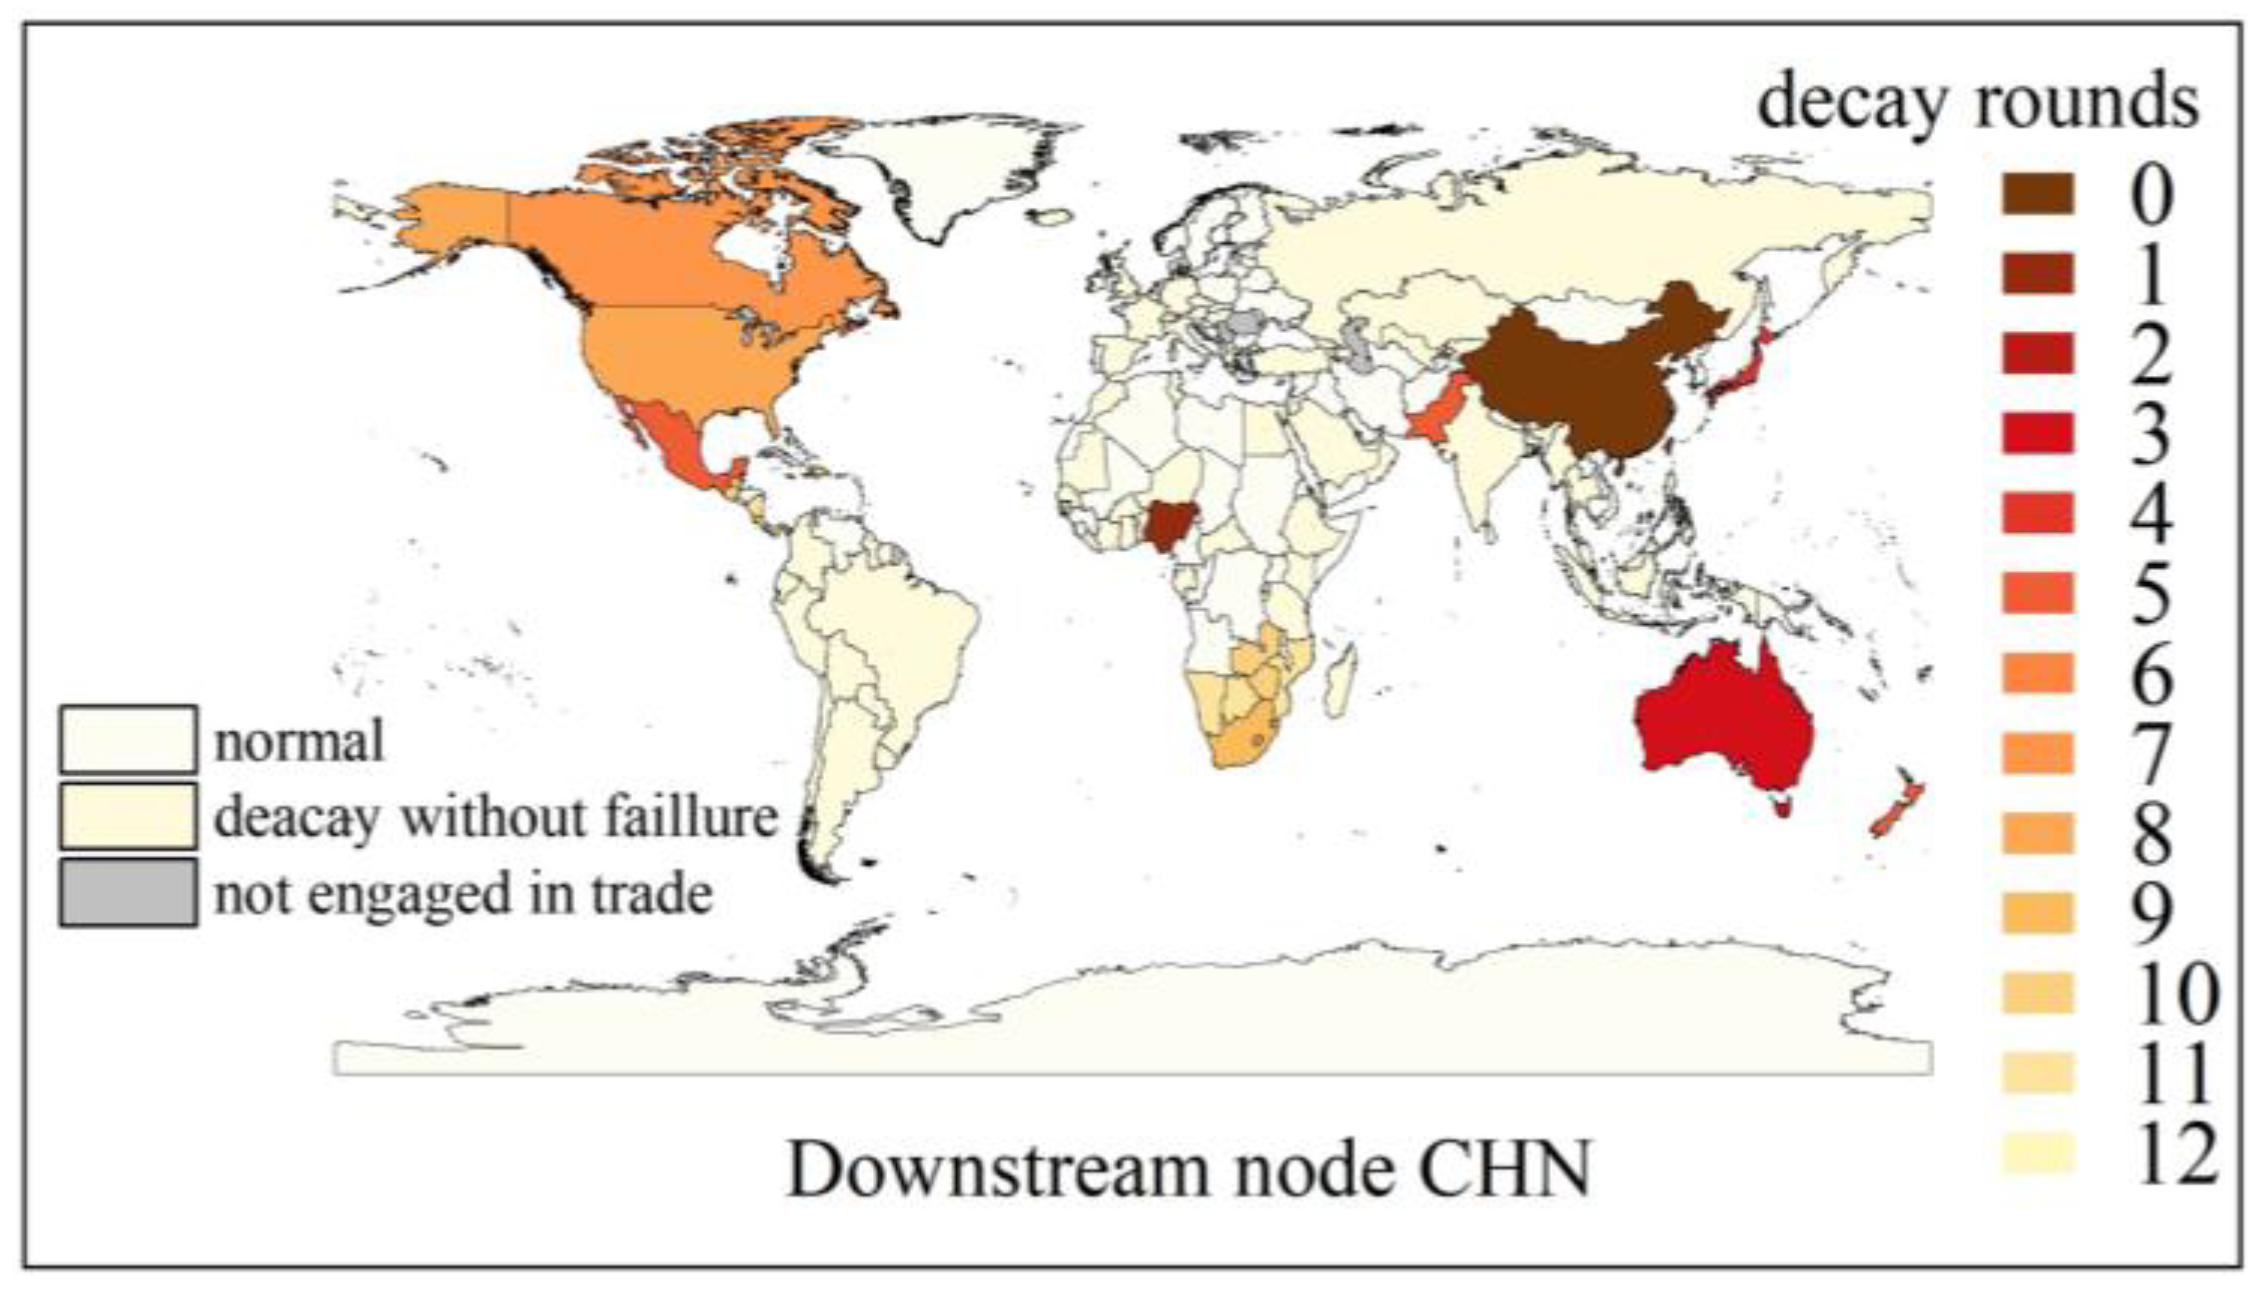
Figure 7.
Map of the cascading failure propagation process due to underload in the core supply nodes of the upstream network.
As a leading upstream exporter of wood forest products, Canada plays a pivotal role in global trade networks. As shown in Figure 5, the disruption of this node triggered a chain reaction that stabilized after four rounds of underload cascading failure propagation. During the first-round risk transmission, failures were observed in two nodes: the United States and Iceland. Moving into the second round, 11 additional nodes failed, including four countries (the United Kingdom, Japan, Mexico, and Colombia) and seven island nations within the Caribbean Sea region. The third round witnessed the failure of two more nodes: Turkey and the Philippines. The fourth and final round of propagation culminated in the failure of Aruba, a Caribbean node. Beyond directly causing the collapse of 16 nodes, this risk transmission process weakened 34 nodes while leaving 148 nodes unaffected.
As a critical downstream supplier of wooden consumer goods, China’s node disruption—illustrated in Figure 7—triggered cascading failures that persisted across twelve rounds before stabilizing. The first round saw only Nigeria’s failure, followed by the weakening of nodes that progressively expanded in subsequent rounds. Subsequent rounds witnessed the sequential failures of Australia, Japan, Fiji, Mexico, and others. The seventh and eighth rounds marked the collapse of Canada and the United States, while the ninth round resulted in the failure of South Africa and other nations. The tenth and eleventh rounds experienced an expansion in the scope of failures. Overall, the process led to the failure of 34 nodes, the weakening of 82 nodes, and 114 countries remaining unaffected. Compared to midstream disruptions, downstream risk propagation demonstrated broader reach and greater persistence.
4.3. Node Importance Analysis Under Disruption Risk Propagation
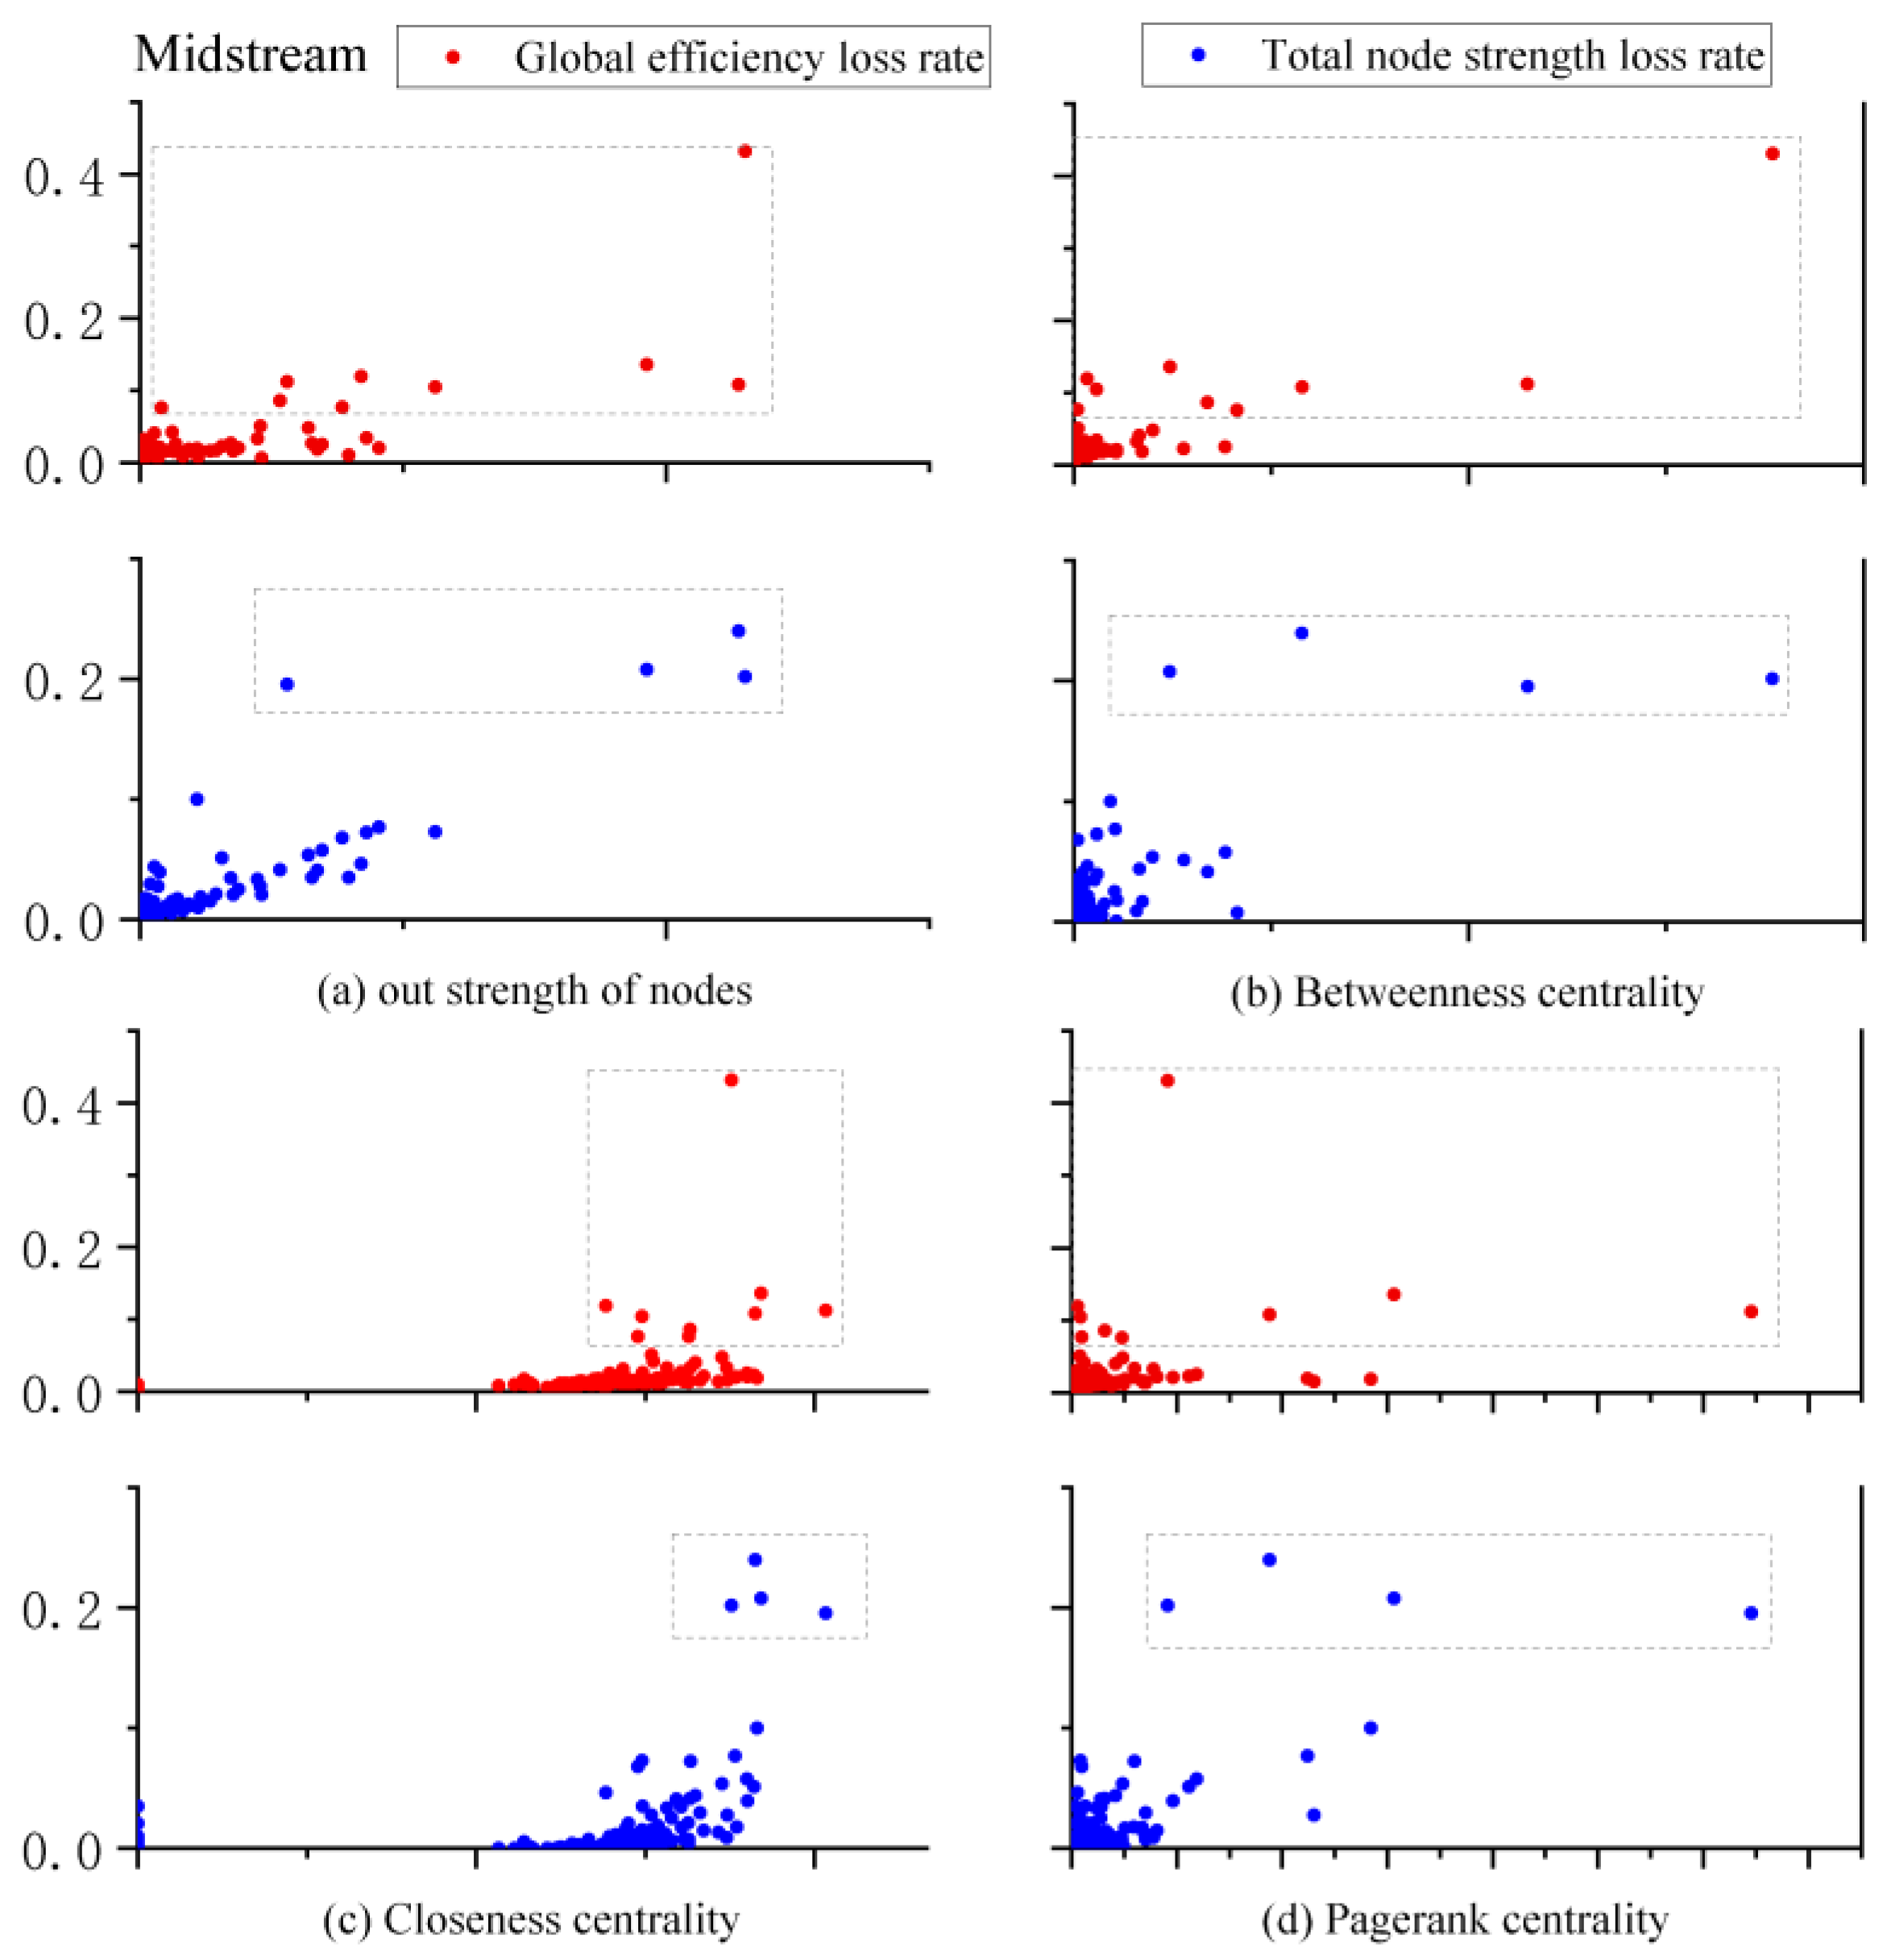
By simulating the cascading failure process triggered by single-node disruption risk propagation, we further calculate the network performance loss after cascading failure stabilization to precisely quantify the extent of the damage caused by node failures on the network. This approach intuitively reveals the influence and importance of nodes from the perspective of disruption impact. Figure 8, Figure 9 and Figure 10 present the distribution of global efficiency loss rates and total node strength loss rates following single-node disruptions.
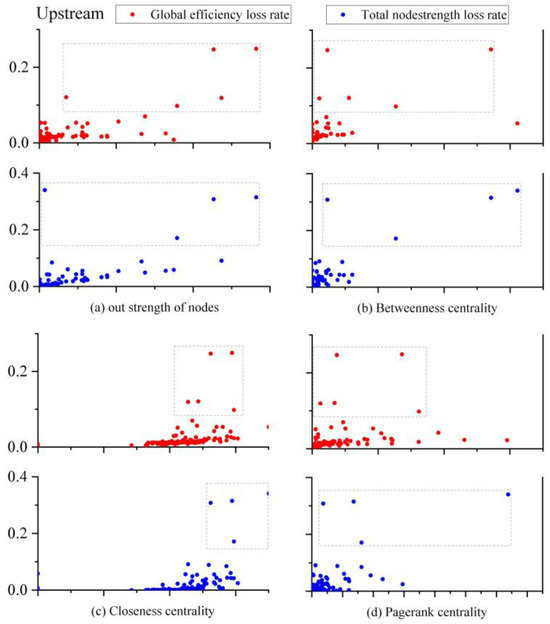
Figure 8.
X–Y plot of network performance loss rate under upstream-induced underload cascading failures triggered by a single-point interruption.
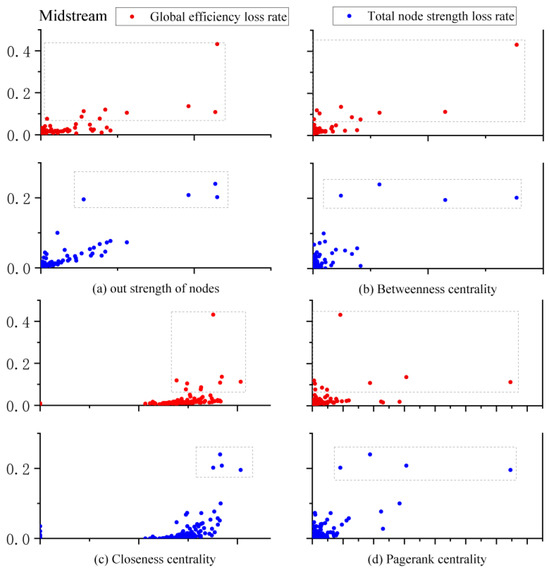
Figure 9.
X–Y plot of the network performance loss rate under midstream-induced underload cascading failures triggered by single-point interruptions.
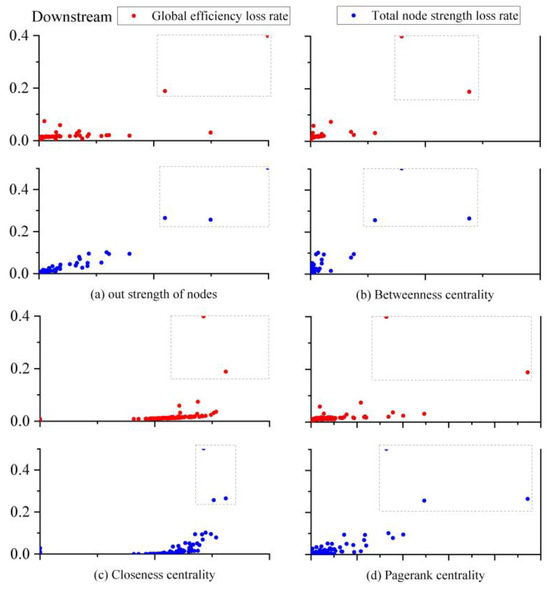
Figure 10.
X–Y plot of the network performance loss rate under downstream-induced underload cascading failures triggered by a single-point interruption.
As illustrated in Figure 8a–d, the horizontal axes of each subplot, respectively, represent node out-strength, betweenness centrality, closeness centrality, and PageRank centrality (the same convention applies hereafter). The analytical results demonstrate significant positive correlations between node centrality metrics and network performance loss rates. However, the strength of the association between individual centrality indicators and network performance loss rates exhibits differential characteristics, which are thoroughly discussed in subsequent sections.
In the upstream trade network of wood forest products, only a few nodes exhibit significant disruptive potential for the network; these are highlighted with dashed boxes as critical nodes, further validating the scale-free property of the network. Specifically, the disruption of nodes such as the United States, Canada, South Africa, Brazil, and Germany would cause the most severe damage to global efficiency, while nodes including China, the United States, Canada, and Germany demonstrate the greatest destructive impact on the total node strength of the network. These nodes not only play pivotal roles in maintaining network functionality but also represent vulnerable components, the failure of which could trigger catastrophic consequences for the entire system.
In the midstream trade network of wood forest products, nodes such as China, Canada, Brazil, the United States, Germany, Russia, Turkey, Thailand, and South Africa exhibit particularly significant disruptive impacts on global efficiency. Among them, the Chinese node demonstrates a disruptive impact value as high as 0.43, highlighting its dominant influence within the network. Simultaneously, nodes including Germany, Canada, China, and the United States also hold critical positions in terms of their disruptive effects on the total node strength of the network. This pattern underscores the structural vulnerabilities and differentiated disruption resilience characteristics within the global midstream trade system of wood forest products.
In the downstream trade network of wood forest products, although the number of nodes with significant disruptive impacts is notably low compared to the upstream and midstream networks, key nodes such as China, the United States, and Germany still demonstrate the highest disruptive effects on global efficiency and total node strength. Among these, the Chinese node exhibits particularly pronounced destructive impacts, reaching 0.4 and 0.5 for global efficiency and total node strength, respectively. This observation emphasizes the persistent structural vulnerabilities in downstream trade dynamics, where a limited number of dominant nodes disproportionately influences network stability, despite reduced systemic exposure to cascading disruptions.
As illustrated in Figure 8, Figure 9 and Figure 10, the global efficiency loss rate caused by single-node interruptions is significantly lower than the total node strength loss rate, indicating that single-node disruptions have relatively limited impacts on overall network efficiency. This suggests that the trade network of wood forest products possesses inherent redundancy and robustness, enabling it to partially mitigate shocks from individual node failures. In contrast, greater attention should be directed toward maintaining the stability of total node strength to ensure efficient and stable network operations. Table 6 identifies the top 10 nodes exhibiting the maximum network performance loss rates under single-node interruption scenarios.
Table 6.
Ranking of top 10 nodes by network performance loss rate under single-node interruptions.
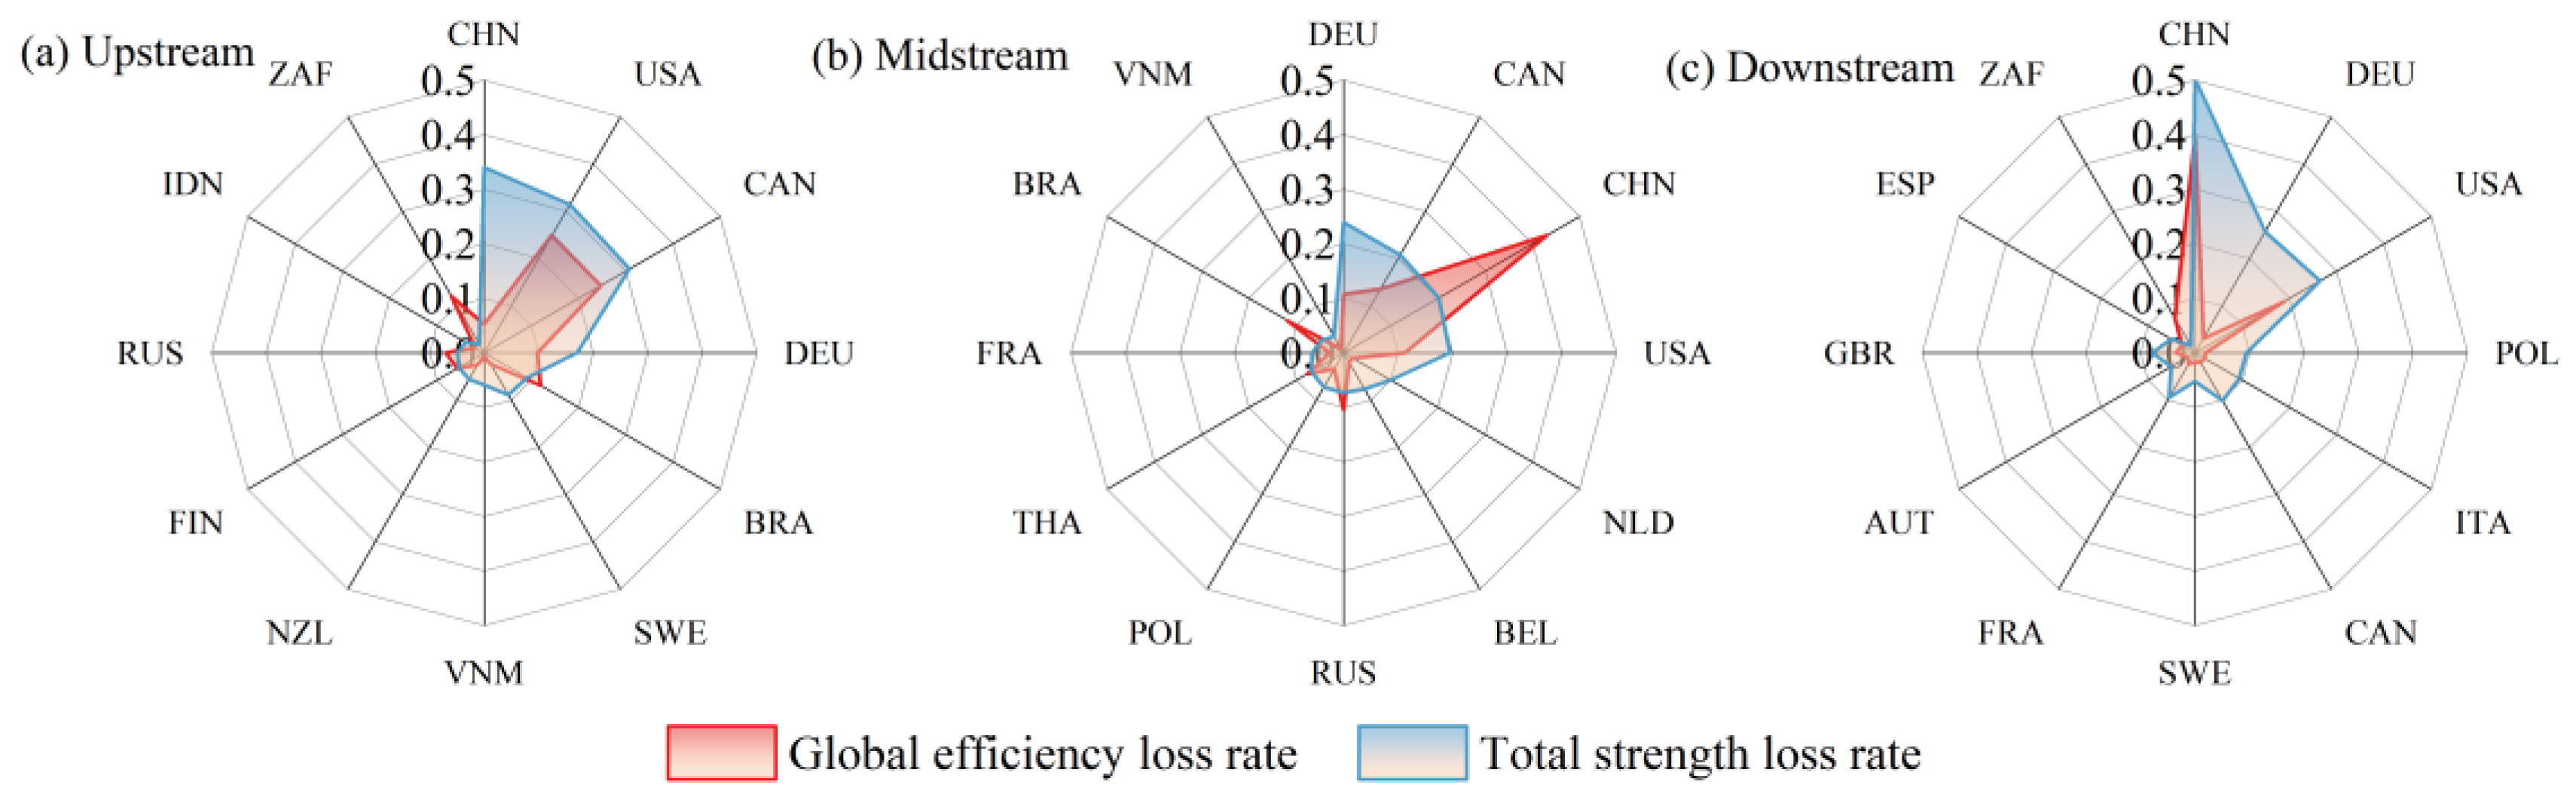
The disruption levels of single-node interruption on network performance exhibit significant heterogeneity, with particularly notable variations observed in certain nodes. To address this, we constructed a composite radar analysis map (Figure 11) under core node failure scenarios, incorporating both the global efficiency loss rate and node strength loss rate metrics. This visualization model effectively reveals sensitivity disparities across multiple network performance dimensions towards nodal failures, providing a quantitative analytical tool for assessing vulnerability characteristics in trade networks.
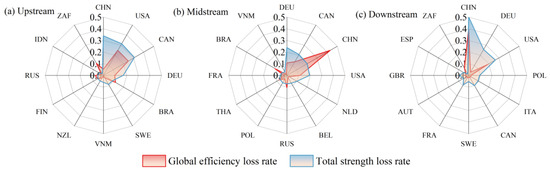
Figure 11.
Radar chart of network performance loss rates after core node interruption.
As shown in Figure 11, in the upstream network, the interruption of the Chinese node resulted in a node strength loss rate of 0.34, while the global efficiency loss rate remained at only 0.05. This marked discrepancy indicates that the Chinese node and its neighboring nodes account for a substantial proportion of total trade volume, meaning their interruption would significantly compromise network-wide strength. However, the limited impact on average path length suggests relatively preserved global connectivity. Nodes exhibiting similar characteristics include Sweden and Vietnam in the upstream network, Germany, the Netherlands, and Belgium in the midstream network, as well as Germany, Poland, Italy, Canada, and France in the downstream network. Notably, if such nodes establish strong interdependencies with high-betweenness nodes, their interruption may trigger extensive chain reactions, potentially leading to severe cascading failure consequences across the network.
The Brazilian node in the midstream network exhibits distinct destructive characteristic patterns. Its interruption caused a global efficiency loss rate of 0.12, whereas the node strength loss rate remained at merely 0.05—less than half of the global efficiency loss. This phenomenon indicates that the Brazilian node occupies a structurally central position, whereby its disruption significantly degrades network transmission efficiency. However, its limited trade volume with neighboring nodes minimizes the impact on the overall network strength. Nodes sharing similar traits include South Africa in the upstream and downstream networks, as well as China in the midstream network. Although these nodes contribute modestly to network-wide strength, they play pivotal roles in maintaining global information flow and operational efficiency.
An integrated analysis reveals that nodes’ destructive impacts are intrinsically linked to their structural positions and functional attributes within networks. Trade volume predominantly governs network strength degradation, while topological positioning determines the nodes’ influence on global efficiency. These findings provide novel insights into node criticality in complex networks, offering strategic guidance for risk mitigation.
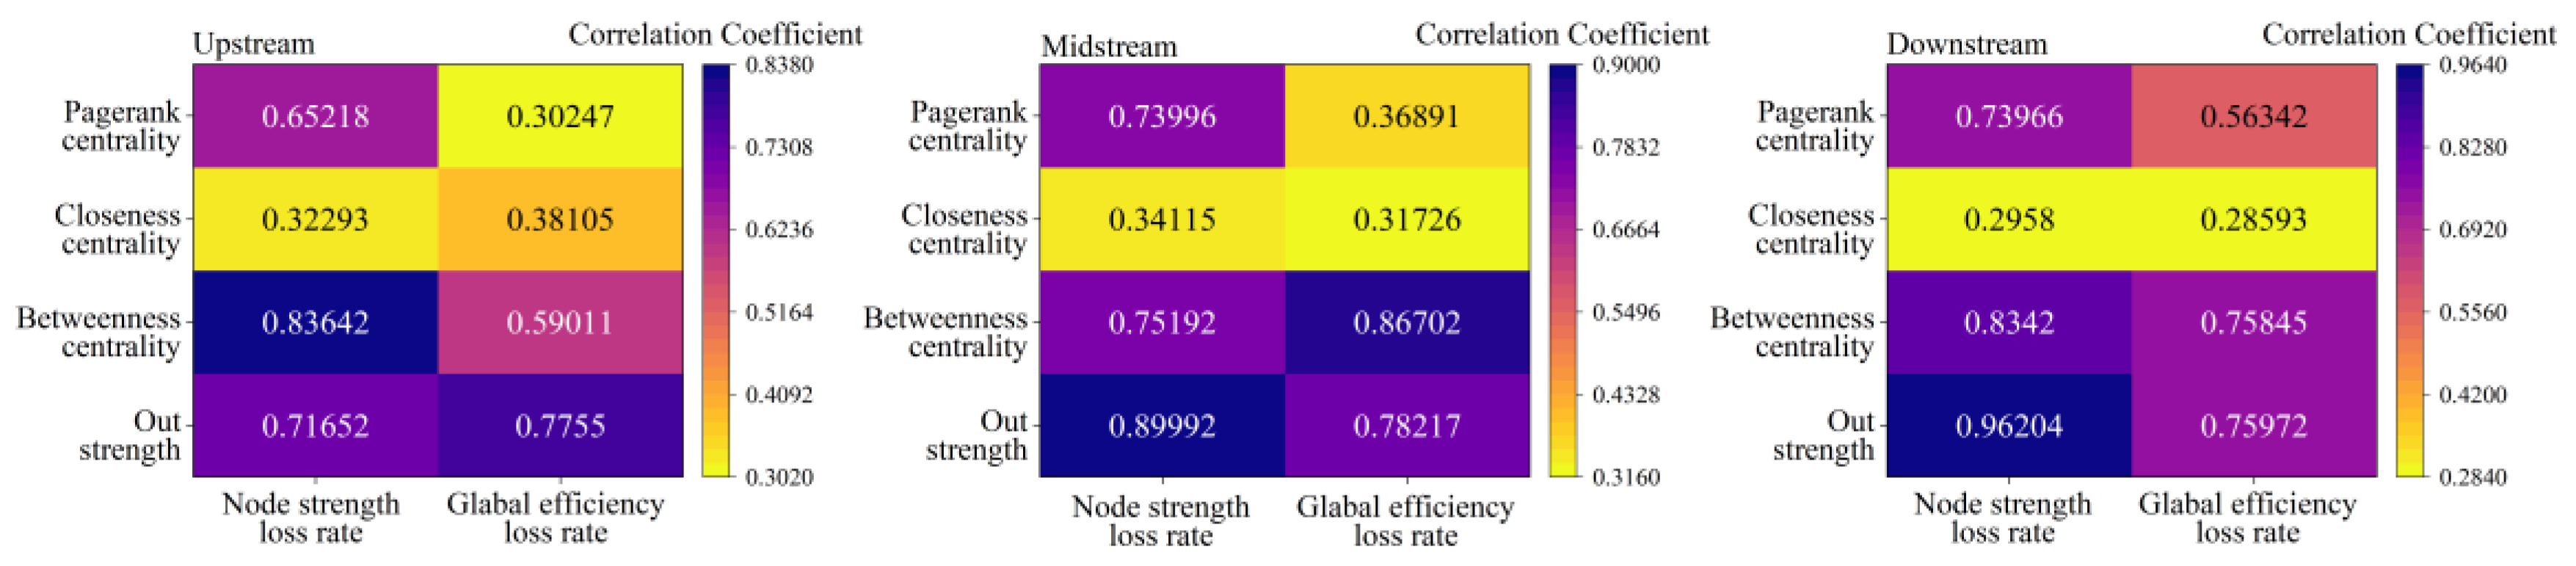
The scatterplot analysis demonstrates a general positive correlation between node centrality metrics and their disruption-induced network performance degradation, though correlation strengths vary across performance indicators. To quantify these relationships, we calculated Pearson correlation coefficients and visualized the interdependencies between node centrality and single-node disruption impacts, as illustrated in Figure 12.
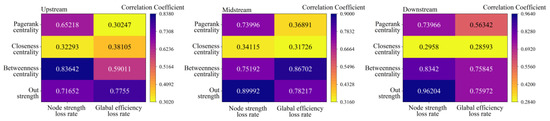
Figure 12.
Correlation coefficient chart of node centrality and the network performance loss rate.
The interpretation criteria for Pearson’s correlation coefficient (r) are as follows: |r| > 0.8 indicates an extremely strong correlation, 0.6 ≤ |r| < 0.8 represents a strong correlation, 0.4 ≤ |r| < 0.6 suggests a moderate correlation, 0.2 ≤ |r| < 0.4 denotes a weak correlation, and |r| < 0.2 signifies a very weak or negligible correlation. According to Figure 12, we can derive the following information: (1) node out-strength demonstrates strong correlations with all types of network performance loss rates, indicating that the out-strength of nodes significantly impacts the overall performance and stability of networks. Nodes with high out-strength may play crucial roles in information dissemination or resource allocation within networks. (2) Node betweenness centrality shows a strong correlation with the node total strength loss rate, suggesting that bridge nodes exert an important influence on node-level performance loss. In midstream and downstream networks, betweenness centrality also maintains strong correlations with the global efficiency loss rate, while its correlation weakens in upstream networks. This implies that upstream network structures and functions might be more complex, with node influence distributed more diffusely. (3) PageRank centrality exhibits strong correlations with the node total strength loss rate but only a moderate correlation with the global efficiency loss rate, indicating that nodes with high PageRank centrality primarily exert influence at local rather than global scales. (4) Although nodes with high closeness centrality possess shorter path lengths in networks, the correlations between node closeness centrality and both the node total strength loss rate and global efficiency loss rate remain moderate. This suggests that a node’s positional advantage in networks has relatively weak impacts on network performance and may not be a critical determinant of network performance degradation.
4.4. Analysis of Disruption Resilience Evolution Under Risk Propagation
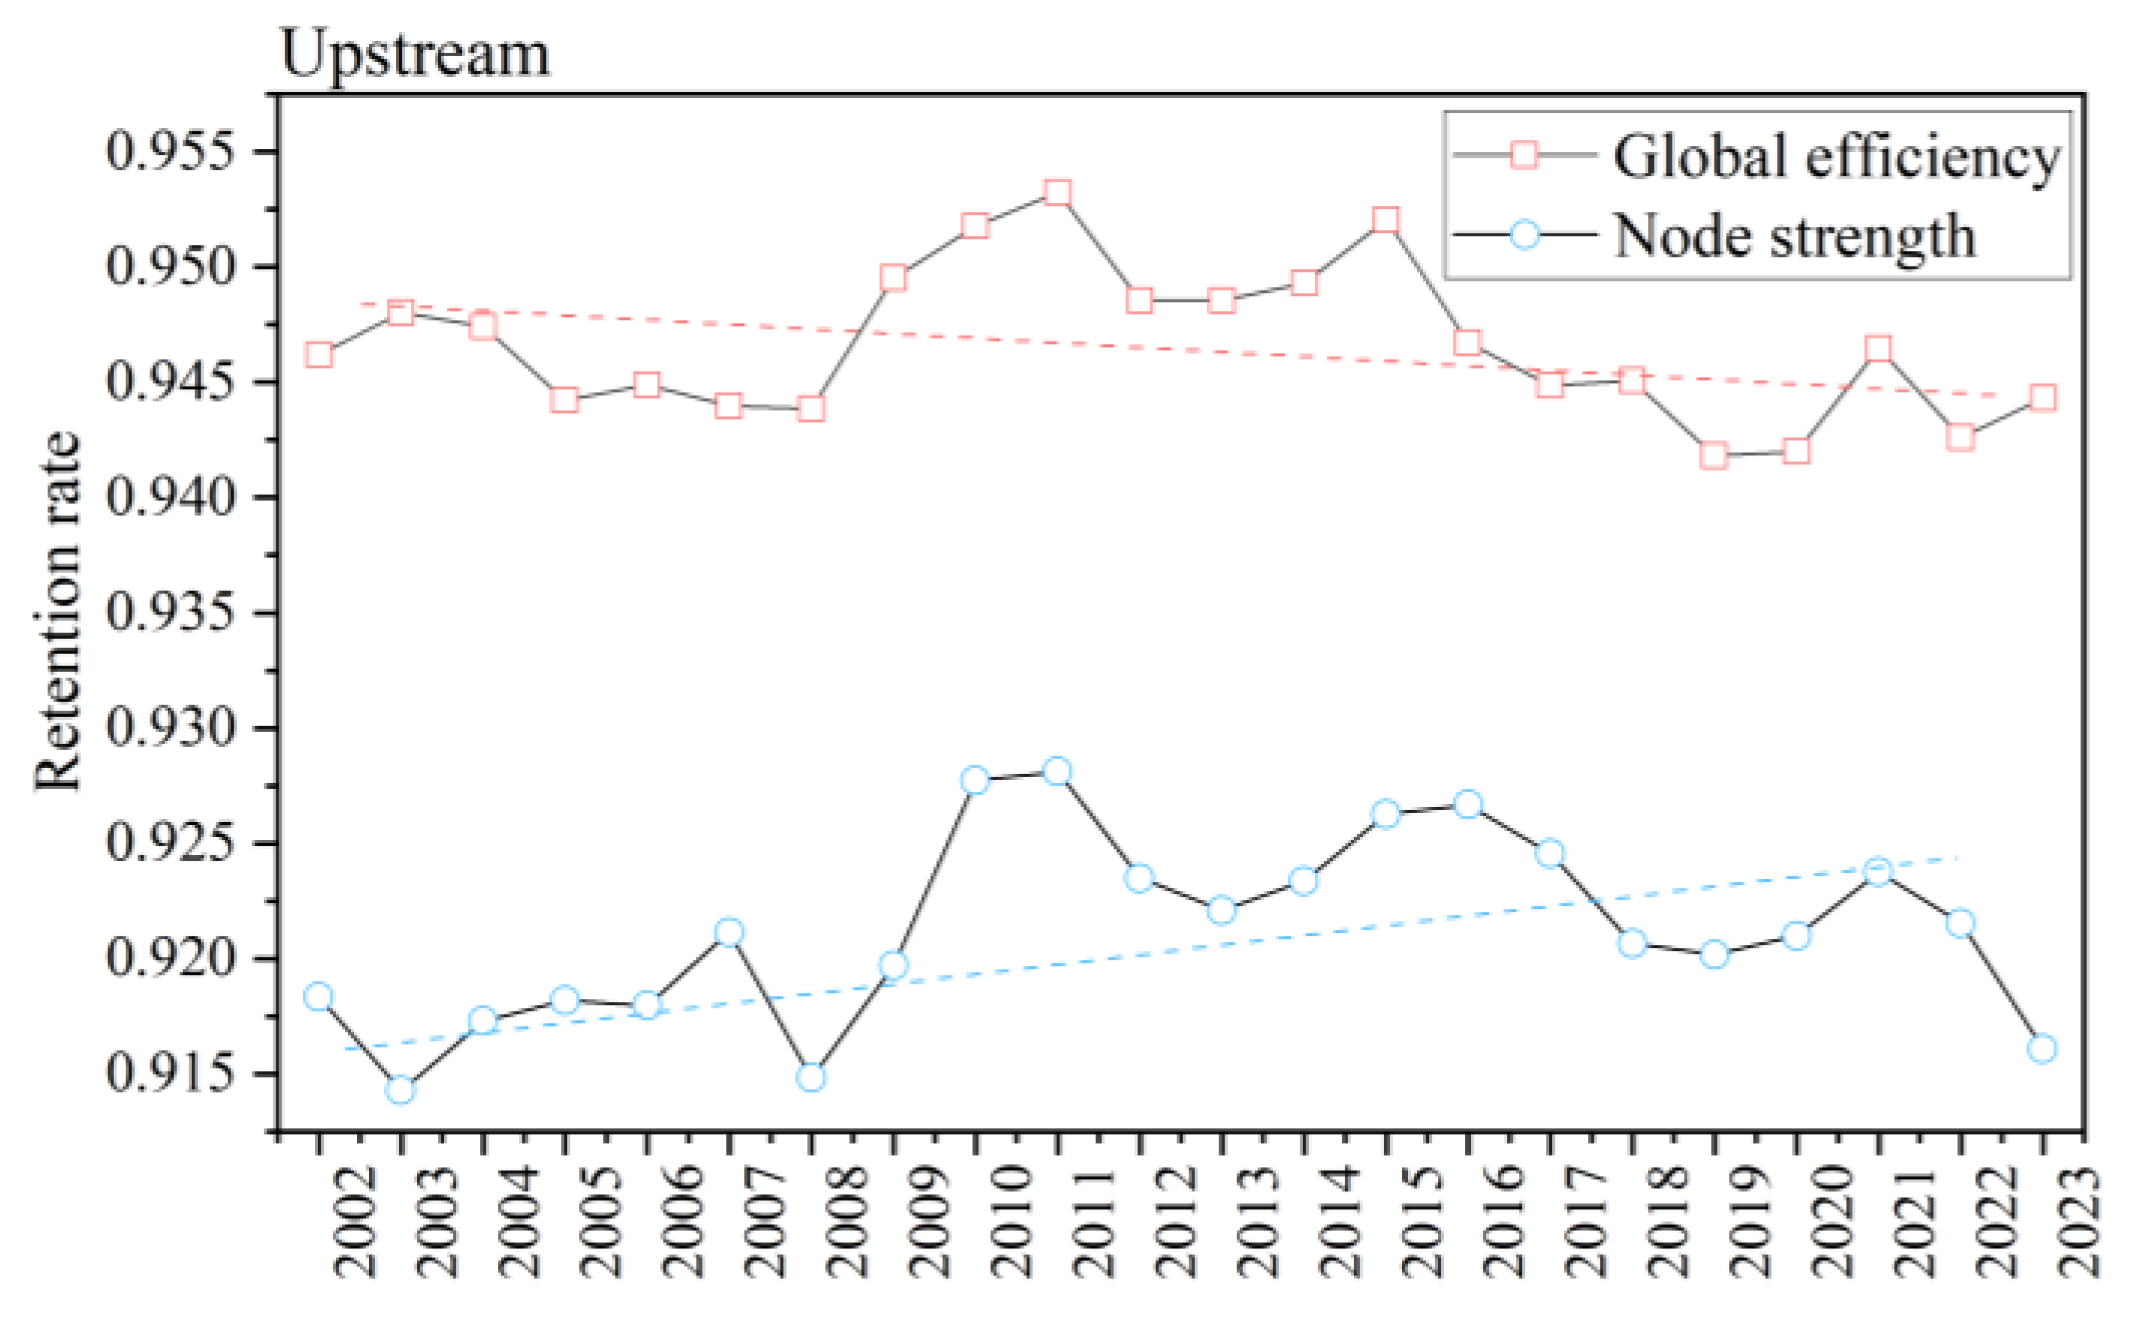
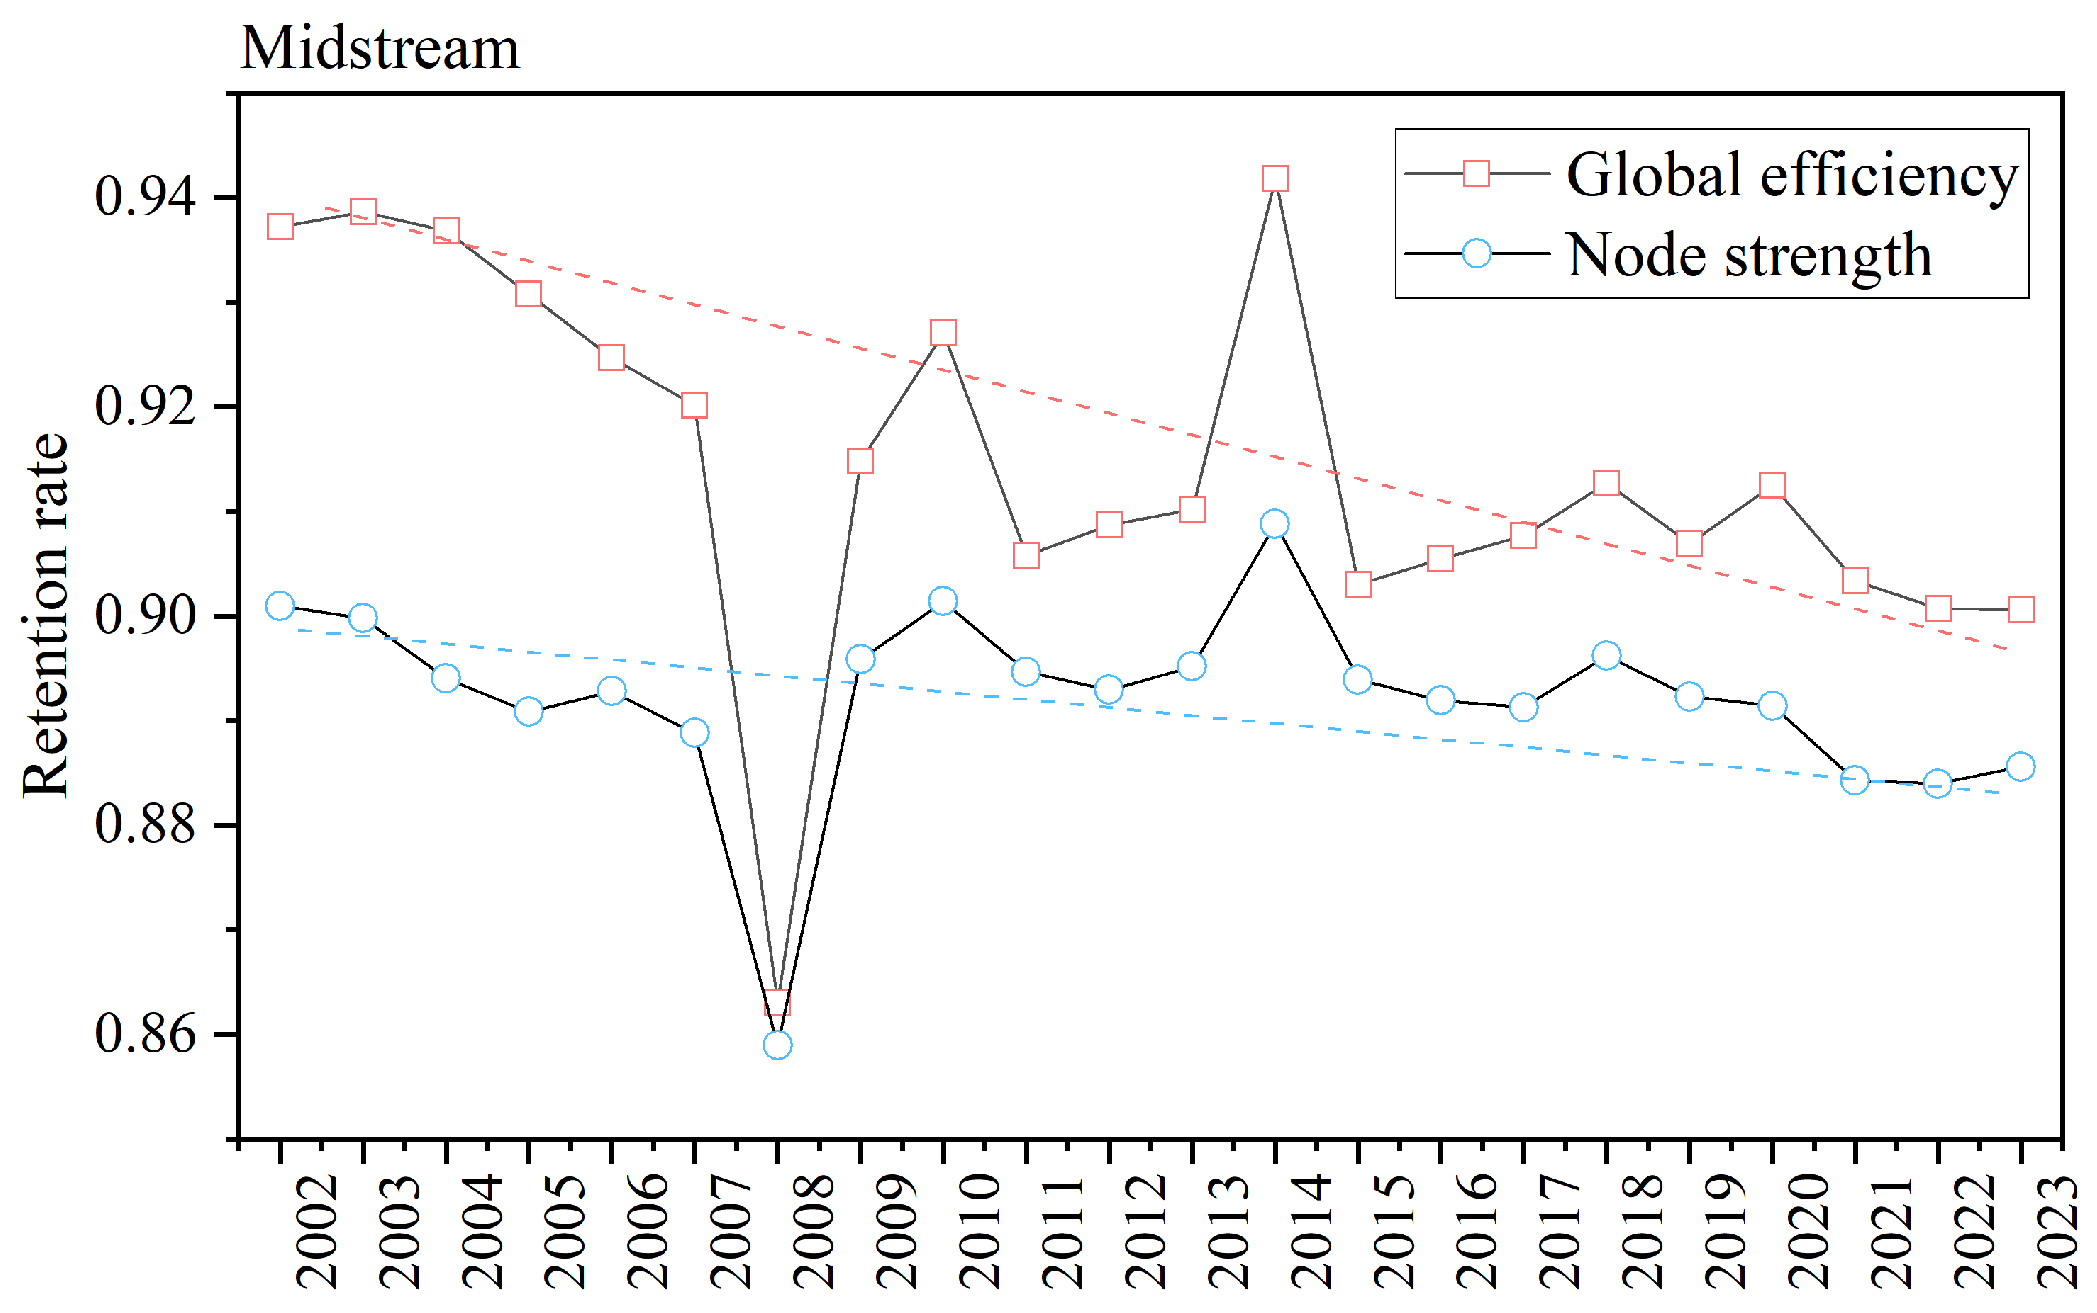
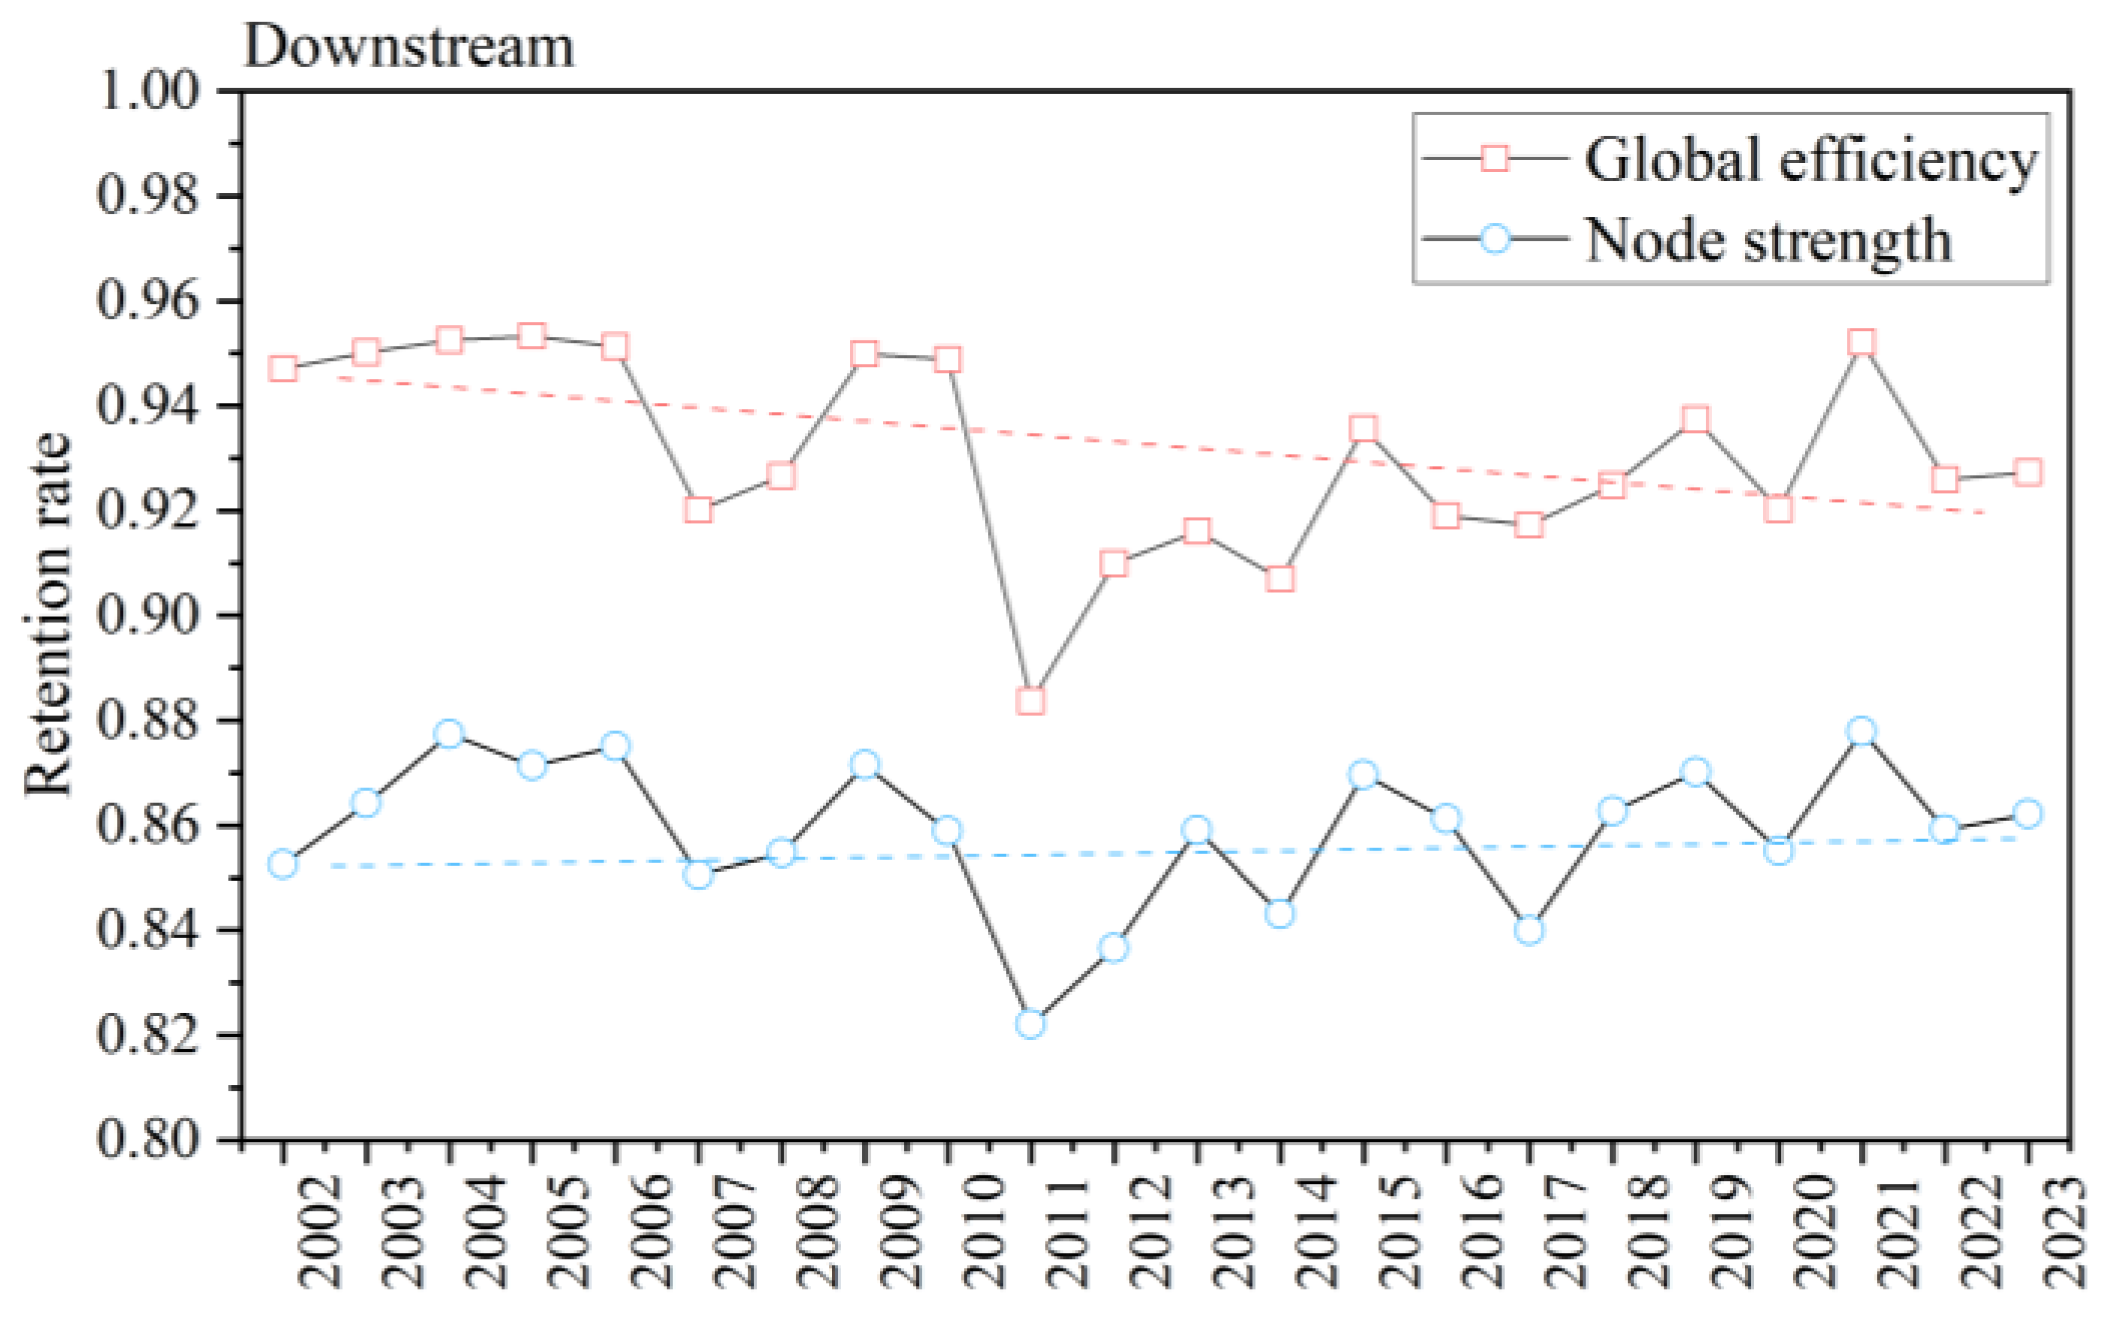
By conducting simulations of underload cascading failure triggered by single-node disruptions in the wood forest products trade network from 2002 to 2023, we calculated the average values of network performance retention rates during core node failures to evaluate disruption resilience. Figure 13, Figure 14 and Figure 15 visually demonstrate the dynamic evolution of disruption resilience.
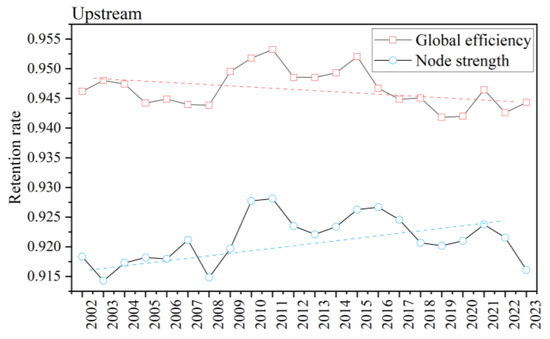
Figure 13.
Evolution of disruption resilience in the upstream wood forest products trade network (2002–2023).
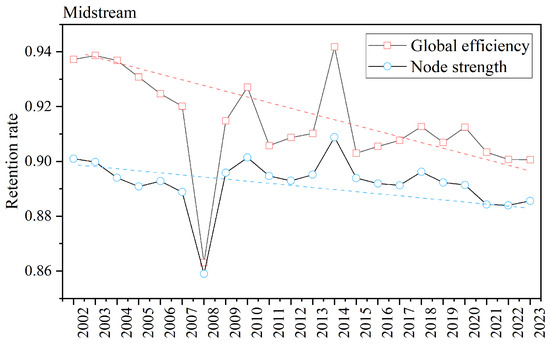
Figure 14.
Evolution of disruption resilience in the midstream wood forest products trade network (2002–2023).
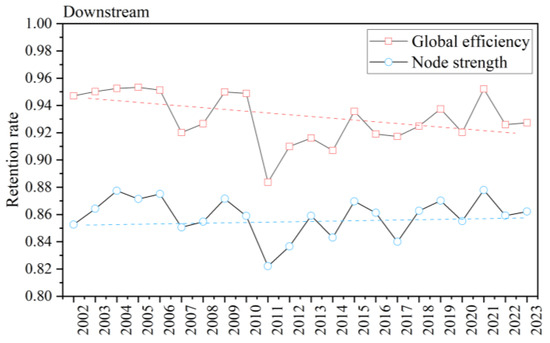
Figure 15.
Evolution of disruption resilience in the downstream wood forest products trade network (2002–2023).
As shown in Figure 13, the disruption resilience based on total node strength exhibited a significant upward trend in the upstream wood forest products trade network from 2002 to 2023, indicating that continuous network evolution and optimization have strengthened inter-node connectivity and diversity, thereby reducing dependency on high-strength nodes—a positive signal of enhanced robustness and resistance to deliberate disruptions. However, the disruption resilience based on global efficiency showed a slight decline, suggesting that failures of nodes with high betweenness prolonged the shortest paths and perpetuated bottlenecks and congestion, highlighting growing vulnerabilities in network connectivity and transmission efficiency. This reflects the complexities and challenges encountered during network expansion and upgrading.
Figure 14 reveals a continuous decline in midstream network disruption resilience from 2002 to 2023, implying heightened reliance on core nodes and weakened recovery capacity and robustness against failures or attacks. Notably, data from 2008 showed significant fluctuations, with a sharp drop in resilience metrics followed by a rapid rebound in 2009. This pattern aligns with the global financial crisis, which disrupted furniture manufacturing and triggered volatility in the disruption resilience of the midstream trade network dominated by wood-based panels.
Figure 15 demonstrates that, from 2002 to 2023, the disruption resilience based on global efficiency declined in the downstream network, while resilience based on node total strength displayed a marginal increase—a trend similar to the upstream network but with gentler slopes. This suggests that the downstream trade network, which is characterized by higher globalization, market maturity, and competitive intensity, exhibited more stable resilience evolution compared to the upstream network.
5. Conclusions and Discussion
This study comprises an in-depth analysis of the global wood forest products trade network from 2002 to 2023, exploring the evolution patterns of its disruption resilience under risk propagation scenarios. The main conclusions are as follows:
- (1)
- The global wood forest products trade network has shown fluctuating growth in terms of both trade volume and value during this period. Upstream products exhibit large trade volumes with low unit prices, while downstream products demonstrate higher trade values and unit prices, making significant contributions to the global economy. Network topology reveals that core countries including China, the United States, and Germany dominate global trade through stable trade chains. The network has grown increasingly complex and interconnected, with diversified trade relationships among countries/regions.
- (2)
- The simulation results indicate substantial variations in node disruption impacts across the network. Failures of core nodes significantly damage global efficiency and total node strength. Node centrality metrics (out-strength, betweenness centrality, etc.) generally correlate positively with network performance degradation, though correlation strengths differ by metric. This highlights the combined influence of the node position and attributes on network importance. Diverse evolution trends of disruption resilience across the network performance metrics provide multi-dimensional insights into network robustness.
- (3)
- From 2002 to 2023, global efficiency disruption resilience declined across all wood forest product trade networks, reflecting the growing influence of core nodes and weakening connectivity robustness after their disruptions. Total node strength resilience showed varied patterns: upstream networks demonstrated improved resilience through diversified connections, midstream networks displayed reduced resilience due to intensified core node dependence, and downstream networks maintained relatively stable resilience owing to mature supply chains and diversified trade channels [1].
This study provides critical policy insights for enhancing the resilience of the global wood forest products trade network. First, policymakers should focus on the stability of core nodes by diversifying supply channels, establishing regional backup nodes, and strengthening international cooperation to reduce dependence on single nodes and improve overall network resilience. Second, the continuous decline in midstream resilience highlights the risks in this segment, necessitating enhanced node robustness through optimized inventory strategies, increased redundancy, and intelligent management. Finally, the study reveals the close link between sustainable development and supply chain resilience. Policymakers should promote green supply chain initiatives, accelerate afforestation projects, and enhance domestic timber self-sufficiency to reduce reliance on imported timber, thereby strengthening node resilience and fostering sustainable forest resource utilization for economic and environmental benefits [64,65].
Future research should focus on resilience optimization strategies and investigate external factors including geopolitical factors, trade policies, climate change, and technological advancements to support the sustainable development of the global wood forest product trade.
Author Contributions
Conceptualization, X.H., Z.W. and Y.P.; methodology, X.H. and Z.W.; software, X.H., Y.P. and W.T.; validation, X.H. and W.T.; formal analysis, X.H.; investigation, X.H., Z.W. and Y.P.; resources, X.H. and Z.W.; data curation, X.H. and W.T.; writing—original draft, X.H.; writing—review & editing, X.H. and Z.W.; visualization, X.H.; funding acquisition, Z.W. and Y.P. All authors have read and agreed to the published version of the manuscript.
Funding
This research was funded by China National Social Science (22BGL114) and Hunan Provincial Key R&D Programme Project (2022GK2025).
Institutional Review Board Statement
Not applicable.
Informed Consent Statement
Not applicable.
Data Availability Statement
The data presented in this study are openly available in UN Comtrade Databaseat https://comtradeplus.un.org, reference number is as shown in Table 1.
Conflicts of Interest
The authors declare no conflict of interest.
References
- Cao, X.P.; Yang, S.; Huang, X.M.; Tong, J.X. Dynamic Decomposition of Factors Influencing the Export Growth of China’s Wood Forest Products. Sustainability 2018, 10, 16. [Google Scholar] [CrossRef]
- Long, T.; Pan, H.X.; Dong, C.; Qin, T.; Ma, P. Exploring the competitive evolution of global wood forest product trade based on complex network analysis. Phys. A Stat. Mech. Its Appl. 2019, 525, 1224–1232. [Google Scholar] [CrossRef]
- Corona, P.; Alivernini, A. Forests for the world. Ann. Silvic. Res. 2024, 49, 80–81. [Google Scholar]
- Köhl, M.; Lasco, R.; Cifuentes, M.; Jonsson, Ö.; Korhonen, K.T.; Mundhenk, P.; Navar, J.D.; Stinson, G. Changes in forest production, biomass and carbon: Results from the 2015 UN FAO Global Forest Resource Assessment. For. Ecol. Manag. 2015, 352, 21–34. [Google Scholar] [CrossRef]
- FAO. The State of the World’s Forests 2024; Technical Report; Food and Agriculture Organization of the United Nations: Rome, Italy, 2024. [Google Scholar]
- Cheng, B.D. Reflections on the issue of wood security in China. China For. Ind. 2022, 12, 34–37. [Google Scholar]
- Tian, G.; Jiang, Q.Q. Social Network Analysis on International Roundwood Trade Pattern in 2005—2014. World For. Res. 2016, 29, 87–91. [Google Scholar] [CrossRef]
- Pizzol, M.; Scotti, M. Identifying marginal supplying countries of wood products via trade network analysis. Int. J. Life Cycle Assess. 2017, 22, 1146–1158. [Google Scholar] [CrossRef]
- Lovric, M.; Da Re, R.; Vidale, E.; Pettenella, D.; Mavsar, R. Social network analysis as a tool for the analysis of international trade of wood and non-wood forest products. For. Policy Econ. 2018, 86, 45–66. [Google Scholar] [CrossRef]
- Wang, F.; Tian, M.H.; Yin, R.S.; Zhang, Z.Y. Change of global woody forest products trading network and relationship between large supply and demand countries. Resour. Sci. 2021, 43, 1008–1024. [Google Scholar] [CrossRef]
- Zhou, Y.Y.; Hong, Y.P.; Cheng, B.D.; Xiong, L.C. The Spatial Correlation and Driving Mechanism of Wood-Based Products Trade Network in RCEP Countries. Sustainability 2021, 13, 16. [Google Scholar] [CrossRef]
- Hou, F.M.; Xiao, J.X.; Zhang, F.J.; Xiao, H.; Chen, Y. The impact of global trade networks on the division of labor in value chains -based on wood forest products perspective. For. Econ. 2022, 44, 50–64. [Google Scholar] [CrossRef]
- Li, Y.X.; Tian, M.H.; Guo, L.Q.; Feng, Q.R.; Yu, M.Y. Social network analysis of the trade pattern of wood products. Issues For. Econ. 2022, 42, 63–72. [Google Scholar] [CrossRef]
- Wang, R.; Wu, H.M.; Zhe, R.; Zhang, Y.A. Complex network analysis of global forest products trade pattern. Can. J. For. Res. 2023, 53, 271–283. [Google Scholar] [CrossRef]
- Liu, L.; Chen, Y.; Yu, J.; Sun, Y. Study on the resilience of the global trade network for wood forest products. Issues For. Econ. 2024, 44, 218–224. [Google Scholar]
- Gao, L.; Pei, T.W.; Tian, Y. Trade Creation or Diversion?-Evidence from China’s Forest Wood Product Trade. Forests 2024, 15, 18. [Google Scholar] [CrossRef]
- Liu, X.M.; Li, D.Q.; Ma, M.Q.; Szymanski, B.K.; Stanley, H.E.; Gao, J.X. Network resilience. Phys. Rep. Rev. Sec. Phys. Lett. 2022, 971, 1–108. [Google Scholar] [CrossRef]
- Wei, Y.; Xiu, C. Study on the concept and analytical framework of city network resilience. Prog. Geogr. 2020, 39, 488–502. [Google Scholar] [CrossRef]
- Li, L.G.; Zhang, P.Y.; Tang, J.T.; Guan, H.M. Review on the evolution of resilience concept and research progress on regional economic resilience. Hum. Geogr. 2019, 34, 1–7+151. [Google Scholar] [CrossRef]
- Liu, W.; Song, Z.Y. Review of studies on the resilience of urban critical infrastructure networks. Reliab. Eng. Syst. Saf. 2020, 193, 16. [Google Scholar] [CrossRef]
- Akbarzadeh, M.; Memarmontazerin, S.; Derrible, S.; Reihani, S.F.S. The role of travel demand and network centrality on the connectivity and resilience of an urban street system. Transportation 2019, 46, 1127–1141. [Google Scholar] [CrossRef]
- Kharrazi, A.; Rovenskaya, E.; Fath, B.D. Network structure impacts global commodity trade growth and resilience. PLoS ONE 2017, 12, 13. [Google Scholar] [CrossRef] [PubMed]
- Mohammed, A.; Govindan, K.; Zubairu, N.; Pratabaraj, J.; Abideen, A.Z. Multi-tier supply chain network design: A key towards sustainability and resilience. Comput. Ind. Eng. 2023, 182, 18. [Google Scholar] [CrossRef]
- Kharrazi, A.; Akiyama, T.; Yu, Y.D.; Li, J. Evaluating the evolution of the Heihe River basin using the ecological network analysis: Efficiency, resilience, and implications for water resource management policy. Sci. Total Environ. 2016, 572, 688–696. [Google Scholar] [CrossRef]
- Kim, Y.; Chen, Y.S.; Linderman, K. Supply network disruption and resilience: A network structural perspective. J. Oper. Manag. 2015, 33–34, 43–59. [Google Scholar] [CrossRef]
- Gao, J.X.; Barzel, B.; Barabási, A.L. Universal resilience patterns in complex networks. Nature 2016, 530, 307–312. [Google Scholar] [CrossRef]
- Ji, G.J.; Zhong, H.L.; Nzudie, H.L.F.; Wang, P.; Tian, P.P. The structure, dynamics, and vulnerability of the global food trade network. J. Clean Prod. 2024, 434, 10. [Google Scholar] [CrossRef]
- Zhao, K.; Kumar, A.; Harrison, T.P.; Yen, J. Analyzing the Resilience of Complex Supply Network Topologies Against Random and Targeted Disruptions. IEEE Syst. J. 2011, 5, 28–39. [Google Scholar] [CrossRef]
- Ash, J.; Newth, D. Optimizing complex networks for resilience against cascading failure. Phys. A 2007, 380, 673–683. [Google Scholar] [CrossRef]
- Berche, B.; von Ferber, C.; Holovatch, T.; Holovatch, Y. Resilience of public transport networks against attacks. Eur. Phys. J. B 2009, 71, 125–137. [Google Scholar] [CrossRef]
- Bai, X.W.; Ma, Z.J.; Zhou, Y.M. Data-driven static and dynamic resilience assessment of the global liner shipping network. Transp. Res. Pt. E-Logist. Transp. Rev. 2023, 170, 19. [Google Scholar] [CrossRef]
- Li, J.X.; Nie, W.B.; Zhang, M.X.; Wang, L.N.; Dong, H.Y.; Xu, B. Assessment and optimization of urban ecological network resilience based on disturbance scenario simulations: A case study of Nanjing city. J. Clean Prod. 2024, 438, 16. [Google Scholar] [CrossRef]
- Kim, D.H.; Eisenberg, D.A.; Chun, Y.H.; Park, J. Network topology and resilience analysis of South Korean power grid. Phys. A 2017, 465, 13–24. [Google Scholar] [CrossRef]
- Sun, X.; Wei, Y.; Jin, Y.; Song, W.; Li, X.L. The evolution of structural resilience of global oil and gas resources trade network. Glob. Netw. 2023, 23, 391–411. [Google Scholar] [CrossRef]
- Li, Y.H.; Zobel, C.W.; Seref, O.; Chatfield, D. Network characteristics and supply chain resilience under conditions of risk propagation. Int. J. Prod. Econ. 2020, 223, 13. [Google Scholar] [CrossRef]
- Reggiani, A. Network resilience for transport security: Some methodological considerations. Transp. Policy 2013, 28, 63–68. [Google Scholar] [CrossRef]
- Gao, J.X.; Liu, X.M.; Li, D.Q.; Havlin, S. Recent Progress on the Resilience of Complex Networks. Energies 2015, 8, 12187–12210. [Google Scholar] [CrossRef]
- Herrera, M.; Abraham, E.; Stoianov, I. A Graph-Theoretic Framework for Assessing the Resilience of Sectorised Water Distribution Networks. Water Resour. Manag. 2016, 30, 1685–1699. [Google Scholar] [CrossRef]
- Yuan, X.J.; Ge, C.B.; Liu, Y.P.; Li, N.; Wang, Y. Evolution of Global Crude Oil Trade Network Structure and Resilience. Sustainability 2022, 14, 21. [Google Scholar] [CrossRef]
- Kilanitis, I.; Sextos, A. Integrated seismic risk and resilience assessment of roadway networks in earthquake prone areas. Bull. Earthq. Eng. 2019, 17, 181–210. [Google Scholar] [CrossRef]
- Artime, O.; Grassia, M.; De Domenico, M.; Gleeson, J.P.; Makse, H.A.; Mangioni, G.; Perc, M.; Radicchi, F. Robustness and resilience of complex networks. Nat. Rev. Phys. 2024, 6, 114–131. [Google Scholar] [CrossRef]
- Zhu, J.X.; Cai, J.F.; Jiang, T.T.; Lin, X.X. Study on the evaluation of emergency logistics network cascading failure invulnerability based on CI-TOPSIS fuzzy multi criteria group decision making tactics. Manag. Rev. 2018, 30, 229–238. [Google Scholar] [CrossRef]
- Mu, D.; Yue, X.P.; Ren, H.Y. Robustness of Cyber-Physical Supply Networks in Cascading Failures. Entropy 2021, 23, 18. [Google Scholar] [CrossRef] [PubMed]
- Jiang, W.J.; Liu, R.R.; Fan, T.L.; Liu, S.S.; Lü, L.Y. Overview of precaution and recovery strategies for cascading failures in multilayer networks. Acta Phys. Sin. 2020, 69, 11. [Google Scholar] [CrossRef]
- Crucitti, P.; Latora, V.; Marchiori, M. Model for cascading failures in complex networks. Phys. Rev. E 2004, 69, 4. [Google Scholar] [CrossRef]
- Wang, J.W.; Rong, L.L.; Zhang, L.; Zhang, Z.Z. Attack vulnerability of scale-free networks due to cascading failures. Phys. A 2008, 387, 6671–6678. [Google Scholar] [CrossRef]
- Wang, W.X.; Chen, G.R. Universal robustness characteristic of weighted networks against cascading failure. Phys. Rev. E 2008, 77, 5. [Google Scholar] [CrossRef]
- Dueñas-Osorio, L.; Vemuru, S.M. Cascading failures in complex infrastructure systems. Struct. Saf. 2009, 31, 157–167. [Google Scholar] [CrossRef]
- Mirzasoleiman, B.; Babaei, M.; Jalili, M.; Safari, M. Cascaded failures in weighted networks. Phys. Rev. E 2011, 84, 8. [Google Scholar] [CrossRef]
- Mukherjee, B.; Habib, M.F.; Dikbiyik, F. Network Adaptability from Disaster Disruptions and Cascading Failures. IEEE Commun. Mag. 2014, 52, 230–238. [Google Scholar] [CrossRef]
- Han, L.; Liu, B.; Deng, Y.; Wang, Q.Y.; Yin, R.R.; Liu, H.R. Cascading failure model of weighted scale-free networks. J. Softw. 2017, 28, 2769–2781. [Google Scholar] [CrossRef]
- Li, K.; He, Y.F.; Wu, W.; Liu, F.S. Reliability of complex hierarchical network for cascading failure. J. Huazhong Univ. Sci. Technol. 2018, 46, 45–51. [Google Scholar] [CrossRef]
- Cui, H.X.; Qiu, J.L.; Guo, M.; Zhang, R.F. Research on invulnerability of cascading failures in directed weighted supply chain networks. Control. Theory Appl. 2021, 38, 1828–1834. [Google Scholar]
- Li, C.; Wang, L.; Zhao, J.S.; Deng, L.C.; Yu, S.X.; Shi, Z.H.; Wang, Z. The collapse of global plastic waste trade: Structural change, cascading failure process and potential solutions. J. Clean Prod. 2021, 314, 9. [Google Scholar] [CrossRef]
- Hao, H.C.; Ma, Z.; Wang, A.J.; Xing, W.L.; Song, H.; Zhao, P.; Wei, J.Q.; Zheng, S.X. Modeling and assessing the robustness of the lithium global trade system against cascading failures. Resour. Policy 2023, 85, 14. [Google Scholar] [CrossRef]
- Fu, X.W.; Xu, X.J.; Li, W.F. Cascading failure resilience analysis and recovery of automotive manufacturing supply chain networks considering enterprise roles. Phys. A 2024, 634, 22. [Google Scholar] [CrossRef]
- Yin, X.X.; Tao, Y.W.; Zhao, X.Q.; Shi, L. Research on Crisis Propagation Effect in International Trade Network Based on Cascading Failure Model: Take Semiconductors as an Example. J. Syst. Sci. Math. Sci. 2024, 44, 1389–1411. [Google Scholar]
- Wang, C.; Yang, H.; Hu, X.; He, X.; Liu, J.; Liang, C.; Lim, M.K. Deciphering iron ore trade dynamics: Supply disruption risk propagation in global networks through an improved cascading failure model. Resour. Policy 2024, 95, 105157. [Google Scholar] [CrossRef]
- Ouyang, X.; Liu, L.T.; Chen, W.; Wang, C.; Sun, X.; He, C.F.; Liu, G. Systematic Risks of the Global Lithium Supply Chain Network: From Static Topological Structures to Cascading Failure Dynamics. Environ. Sci. Technol. 2024, 58, 22135–22147. [Google Scholar] [CrossRef]
- Wang, Y.C.; Xiao, R.B. Underload cascading failure model for supply chain networks. Comput. Integr. Manuf. Syst. 2020, 26, 1355–1365. [Google Scholar] [CrossRef]
- Huang, X.Y.; Wang, Z.W.; Pang, Y.; Tian, W.J.; Zhang, M. Static Resilience Evolution of the Global Wood Forest Products Trade Network: A Complex Directed Weighted Network Analysis. Forests 2024, 15, 24. [Google Scholar] [CrossRef]
- Newman, M.E.J. Fast algorithm for detecting community structure in networks. Phys. Rev. E 2004, 69, 5. [Google Scholar] [CrossRef] [PubMed]
- Blondel, V.D.; Guillaume, J.L.; Lambiotte, R.; Lefebvre, E. Fast unfolding of communities in large networks. J. Stat. Mech.-Theory Exp. 2008, 2008, P10008. [Google Scholar] [CrossRef]
- Chen, X.; Zhang, C. A dynamic analysis of a green closed-loop supply chain with different on-line platform smart recycling and selling models. Comput. Ind. Eng. 2025, 200, 110748. [Google Scholar] [CrossRef]
- Su, C.; Zha, X.; Ma, J.; Li, B.; Wang, X. Dynamic Optimal Control Strategy of CCUS Technology Innovation in Coal Power Stations Under Environmental Protection Tax. Systems 2025, 13, 193. [Google Scholar] [CrossRef]


Disclaimer/Publisher’s Note: The statements, opinions and data contained in all publications are solely those of the individual author(s) and contributor(s) and not of MDPI and/or the editor(s). MDPI and/or the editor(s) disclaim responsibility for any injury to people or property resulting from any ideas, methods, instructions or products referred to in the content. |
© 2025 by the authors. Licensee MDPI, Basel, Switzerland. This article is an open access article distributed under the terms and conditions of the Creative Commons Attribution (CC BY) license (https://creativecommons.org/licenses/by/4.0/).