Article

Spatial Effects of Financial Agglomeration and Green Technological Innovation on Carbon Emissions

by
Zhijie Hao
1,
Ziqian Zhao
2,
Zhiwei Pan
2,
Decai Tang
2,*,
Meiling Zhao
3,* and
Hui Zhang
3
1
Business School, Jiangsu Open University, Nanjing 210036, China
2
School of Management Science and Engineering, Nanjing University of Information Science and Technology, Nanjing 210044, China
3
Jiangsu Trendy Information Technology Co., Ltd., Nanjing 211800, China
*
Authors to whom correspondence should be addressed.
Sustainability 2025, 17(6), 2746; https://doi.org/10.3390/su17062746
Submission received: 18 January 2025 / Revised: 16 March 2025 / Accepted: 18 March 2025 / Published: 19 March 2025
(This article belongs to the Special Issue Achieving Sustainability: Role of Technology and Innovation)

Abstract

:
Financial agglomeration and green technology innovation are important measures to reduce carbon emissions and promote the development of a green economy. Based on the panel data of 30 provinces and cities in China from 2011 to 2020, this paper uses the locational entropy method and the carbon emission coefficient measurement method provided in the IPCC inventory guide to establish a spatial econometric model to explore the specific impact of financial agglomeration and green technology innovation on carbon emission. The results show that (1) both financial agglomeration and green technology innovation will reduce carbon emissions; (2) when considering the spatial effect, financial agglomeration and green technology innovation will effectively reduce carbon emissions; (3) the influence of financial agglomeration and green technology innovation on carbon emissions has regional heterogeneity. Only green technology innovation can significantly reduce carbon emissions in the eastern region. Financial agglomeration and green technology innovation in the central region can significantly reduce carbon emissions. Financial agglomeration in the western region can significantly reduce carbon emissions, but green technology innovation will lead to an increase in carbon emissions. This paper provides useful suggestions for optimizing the financial industry’s structure, improving the level of green technology, and alleviating environmental pollution.

1. Introduction

Reducing carbon emissions is closely related to promoting sustainable development. As the core environmental cost of human economic activities, carbon emissions pose significant challenges to the carrying capacity boundaries of Earth’s ecosystems and threaten the long-term stable development of the economy and society. Therefore, promoting carbon reduction can protect the environment and foster green ecological development, reduce energy consumption, improve resource utilization efficiency, and drive sustainable economic development. In this process, green technological innovation is a key element for achieving sustainable development. It enables economic growth while ensuring long-term environmental sustainability [1,2]. Green technology innovation can reduce the negative impact of economic activities on the environment by realizing a series of hard technological breakthroughs in energy saving and emission reduction technologies [3], clean energy utilization technologies (such as photovoltaic and wind energy) [4], carbon capture and storage, circular economy model, and other soft technological innovations in collaboration with digital energy efficiency management and green supply chain [5] while also creating new green industries. This promotes the development of a green, low-carbon, and sustainable economy. Since the reform and opening up, China’s rapid economic development has been remarkable to the world, but it has also spawned an increasingly prominent major contradiction problem: the resource and environmental constraints caused by the extensive non-green model development bring about the unsustainability of economic development, especially a series of harmful consequences, such as global warming caused by excessive carbon emissions [6], glacier melting, sea-level rise [7], and socio-economic challenges. In recent years, China’s average annual carbon dioxide emission level has been about 10 billion tons, about a quarter of the global total emissions. Such large emissions are mainly determined by China’s total energy consumption and energy consumption structure. China’s current total energy consumption is about 5 billion tons of standard coal, of which coal, oil, and natural gas combined account for nearly 85%, and other non-carbon energy accounts for only about 15%. Among the three types of fossil energy—coal, oil, and gas—coal, which has the highest carbon emission factor, accounts for nearly 70%, so China is in a state of non-equilibrium and non-ideal value in terms of energy consumption structure. With increasingly severe environmental issues, achieving carbon reduction targets and moving toward sustainable development has become urgent [8]. China, as the world’s top carbon emitter [9], wrote “carbon peak” and “carbon neutrality” for the first time in a government work report in 2021, thus bringing the “double carbon” strategic policy into the public eye. A series of subsequent documents jointly constitute the top-level designs throughout the two phases of carbon peaking and carbon neutrality, marking that China’s “double carbon” strategy has entered the substantive implementation stage [10]. The introduction of these policies also shows that China is taking continuous measures to control carbon emissions and achieve green advancement [11]. Under pressure from carbon emissions and the implementation of the “double carbon” strategic policy, the low-carbon development route is also particularly important [12].
Currently, promoting sustainable development is a top priority for countries worldwide. China’s carbon emission problem is in the infancy of advancement. With the change in economic advancement, the effect of innovation in science and technology and financial development on carbon emission is becoming closer. Moreover, with the advocacy of a high-quality, coordinated development path for the green economy and the continuous reform and development of financial and technological markets, research on the impact of financial agglomeration and technological innovation on carbon emissions holds significant value [13,14]. On the one hand, financial agglomeration is becoming more prominent in modern economic systems, gradually emerging as a key driver in reducing carbon emissions. Financial agglomeration injects continuous funds into green projects, such as R&D breakthroughs in the new energy sector and energy-saving and emission-reduction efforts in traditional industries, thereby driving industrial transformation, optimizing industrial structures, reducing coal-based fossil energy consumption, and mitigating carbon emissions and the greenhouse effect [15]. On the other hand, by increasing investment in the development of technology markets and research and development and improving the level of green technological innovation, energy efficiency can be significantly enhanced, clean energy substitution can be promoted, production processes can be optimized, and the widespread application of low-carbon technologies can be encouraged, all of which significantly reduce carbon emissions. However, the high investment, long cycle, and high risk associated with green technological innovation require long-term financial resources. Financial agglomeration can provide the necessary capital for green technological innovation. The interplay between the two on carbon emissions is of great significance for promoting sustainable development.
In this context, the issue of carbon emissions has also received more and more attention. Through the analysis of relevant studies, it is found that there are still the following shortcomings in existing studies on the relationship between financial agglomeration, green technology innovation, and carbon emission: (1) The existing studies have not formed a unified standard for measuring financial agglomeration, green technology innovation, and carbon emission. (2) There are few pieces of literature that integrate financial agglomeration, green technology innovation, and carbon emissions into a unified system for research. (3) Existing studies lack in-depth analysis of the impact of financial agglomeration and green technology innovation on the spatial effects of carbon emissions.
Analyzing carbon emissions in detail and actively promoting carbon emission reduction is conducive to stepping out of a road of ecological priority and green development. The purpose of this paper is to explore the impact mechanism of financial agglomeration and green technology innovation on carbon emissions. By collecting and analyzing multi-source data, it accurately quantifies the level of financial agglomeration and green technology innovation while providing insights into the various analyses and studies pertaining to the context of the study. The outcome provides a scientific basis for the regional formulation of energy conservation and emission reduction policies and development strategies and promotes the realization of carbon emission reduction and sustainable development goals. The following are this paper’s marginal contributions: Firstly, this paper enriches and improves the green technical innovation and the quantitative index systems of carbon emission. Secondly, this paper examines the impact of financial agglomeration and green technological innovation on carbon emissions and their spatial spillover effects from a dual perspective. It also conducts an analysis of the factors influencing carbon emissions, which holds certain theoretical significance. Finally, a baseline panel regression model and a space econometric model are established to unpack how financial agglomeration and green technical innovation impact carbon emission and the spatial spillover impact. Also, through heterogeneity analysis, the disparities among China’s eastern, central, and western parts are revealed. This improves the model system and the application field of spatial econometrics.
The following is how this article is organized: Part 2 is a literature review and research hypothesis, Part 3 is a measurement analysis of green technological innovation, financial agglomeration, and carbon emission level; Part 4 is a baseline regression analysis; Part 5 is a spatial econometric analysis; Part 6 is a discussion; and a conclusion and policy suggestions are in Part 7.

2. Literature Review and Research Hypothesis

2.1. Influencing Factors of Carbon Emission

Energy consumption structure [16], power industry [17], production activities [18], extreme weather [19], urban expansion [20,21], economic policy uncertainty [22], trade openness [23], population agglomeration, and industrialization structure [24] are important factors contributing to the increase in carbon emission levels. Digital infrastructure construction [25], urban rail transit [26], low-carbon finance [27], renewable resources utilization [28], carbon emission trading policy [29], interprovincial basin ecological compensation policy [30], foreign direct investment [31], artificial intelligence [32,33], and green technology innovation [34] can effectively reduce carbon emissions. In addition, Wang and Qiu [35] also found that farmer cooperatives can promote carbon emission reduction by reducing fertilizer inputs. Wang et al. [36] proved that the improvement of green finance can effectively inhibit carbon emissions and has a spatial spillover effect. Chen et al. [37] and Zhang et al. [38] concluded that digital transformation is conducive to the manufacturing industry to reduce carbon emissions and achieve the “double carbon goal”. Furthermore, financial agglomeration can effectively reduce carbon emissions, and when the regional industrial structure rationalization level and digital financial development level are higher, the carbon emission reduction effect of financial agglomeration is stronger [15]. Labor and capital clustering can also reduce carbon emissions by reducing energy consumption [39], and the impact of GDP on carbon emissions will turn positive to negative over time [24]. The impact of the digital economy on carbon emissions is characterized by non-linear and spatial spillover effects [40].

2.2. Financial Agglomeration and Carbon Emissions

As an important factor of carbon emission reduction, financial aggregation has different effects on carbon emission reduction [41,42]. It may be affected by factors such as the development scale of urban agglomerations, the development stage of cities, the population scale, the economic development stage, and the development scale of enterprises. Wang et al. [43] discovered that the economic and financial agglomeration of urban agglomerations can inhibit carbon emission intensity, and the inhibition effect is bidirectional. According to Yu et al. [44], at the beginning of the economic development process, the correlation of carbon emissions and financial agglomeration has an inverted U-shaped trend; in the later period, the impact of financial agglomeration on carbon emissions is U-shaped. However, when the scale of enterprises is too concentrated, their energy consumption will increase, and the emission of CO2 and other pollutants will also increase, eventually aggravating environmental pollution and the greenhouse effect [45]. In addition, digital economic agglomeration can also reduce carbon emissions by reducing energy intensity and curbing population size [46]. Liu et al. [47] also found that urban integration and environmental regulation can enhance the positive impact of green innovation on reducing carbon emissions.
Spatial econometric and endogenous growth models have been widely used in the study of the impact of financial aggregation on carbon emission reduction. Tian et al. [48] established a financial agglomeration index system covering three subsystems: economy, ecological environment, and green life, and analyzed the spatial effect to show that agglomeration of finance can support green economic growth and effectively alleviate carbon emissions and the greenhouse effect. Yan et al. [49] verified that improving the spatial structure of finance can significantly reduce local regional carbon emission intensity, while economic agglomeration and energy intensity will hinder carbon emission reduction via the Spatial Durbin Model (SDM). Yuan et al. [50], through an endogenous growth model based on environmental factors, found that financial agglomeration can indirectly restrain environmental pollution and the greenhouse effect through financial technology innovation and financial scale. At the same time, financial agglomeration can promote new energy R&D investment and use, improve the energy consumption structure, and thus cut CO2 emissions [51].

2.3. Green Technical Innovation and Carbon Emissions

Ecological innovation [52], different economic development conditions [53], different industrial chain development levels [54,55], and carbon transaction costs [56] also differ in the impact of green technology innovation on carbon emissions. Scholars mainly use threshold regression, quantile regression, synergistic effect, and other models in their studies. Du et al. [57] found that when the income level is below the threshold, green technology innovation has no significant effect on carbon emission reduction, while when the income level exceeds the threshold, green technology innovation has a significant effect on carbon emission mitigation. There is an asymmetric and fuzzy relationship between carbon emissions and green technology innovation, and green technology innovation can reduce carbon emissions only at a higher emission quantile level [58]. Habiba et al. [59] found a two-way causal relationship between green technology innovation, renewable energy use and carbon emissions, and green technology innovation and renewable energy use will be the main factors leading to the reduction of carbon emissions in the future. The positive impact of green sustainable technological innovation can reduce CO2 emissions during periods of economic prosperity [53]. The impact of green technology innovation on local pollution reduction in different industrial chain links is significantly different [54]. Meng et al. [60] and Li and Zhang [61] also found a negative correlation between green technology innovation and carbon emission levels in a recent study.

2.4. Financial Agglomeration, Green Technology Innovation and Carbon Emission

Financial aggregation can be achieved through environmental regulation, industrial upgrading [62,63], industrial structure effect, and FDI effect [64] to achieve carbon emission reduction. However, as a subdivision of technological innovation, green technology innovation has been widely considered by scholars. Financial agglomeration can drive green technology innovation [65], and the environment of green innovation can improve energy efficiency and reduce carbon emissions [66]. Li and Ma [14] concluded that financial agglomeration significantly inhibited green total factor energy efficiency, while technological innovation played a significant role in promoting it, and the interaction between the two had no significant impact on green total factor energy efficiency. Cao et al. [67] found that financial development negatively impacts local green growth, but scientific and technological innovation positively impacts local green growth. By taking advantage of the technology or knowledge spillover effect, the financial agglomeration of the central region can continuously improve the regional green total factor productivity [68]. However, Zhang and Liu [69] found that the synergistic effect of digital finance and green technology innovation can effectively improve carbon emission efficiency. In addition, digital finance can enhance green total factor productivity by promoting progress in local green technology [70]. Green finance can also improve energy efficiency by promoting green technology innovation and energy mix optimization [71]. The accumulation of the digital economy can promote energy conservation and emission reduction through technological innovation and scale effects [72]. In summary, green technology innovation and financial development will impact China’s carbon efficiency [73].

2.5. Evaluation of Existing Research Literature

Throughout existing studies, most pieces of literature have thoroughly studied the effects of financial concentration or green technical advancement on carbon emissions, forming fundamental study lines and prevailing ideologies. However, the following flaws still exist: First, the existing research’s green technological innovation and quantitative measures of carbon emissions lack a complete and standardized system. Second, a few works of literature’s analytical frameworks uniformly include financial agglomeration, green technical innovation, and carbon emission. Third, an in-depth examination of the effects of financial agglomeration and green technological innovation on the spatial impact of carbon emission is lacking in the existing research system. Under the current economic system, the effect of green technical advancement and financial aggregation on China’s carbon emissions is becoming increasingly close. To focus on examining factors that affect carbon emission, cater to the “dual carbon” strategic policy, and provide ideas for the carbon emission reduction path, this paper’s dual perspective on financial agglomeration and green technical innovation serves as its starting point. Moreover, how financial agglomeration and green technological innovation impact carbon emissions and the spillover impact in space are deeply studied, and corresponding conclusions are drawn.
This paper’s innovations are mainly reflected as follows: In terms of study content, most pieces of literature focus on the influence of unilateral factors of green technical innovation or financial agglomeration on carbon emissions. However, we explore its effect on carbon emissions based on green technological innovation and financial agglomeration to deeply analyze the specific effect mechanism and spillover impact in space among the three. Regarding the measurement of indicators and the selection of variables, various energy consumption variables are considered comprehensively, and the per capita carbon emission indicator is adopted as the explained variable to make the data more stable. Regarding the model system, this paper uses a panel regression model for the basic test, introduces a spatial econometric model for spatial effect analysis, and conducts a heterogeneous analysis of China’s eastern, central, and western parts. This makes the model system of the paper more complete.

2.6. Theoretical Analysis and Research Hypothesis

The new economic geography theory can explain the influence of financial agglomeration and green technology innovation on carbon emission well. Factors such as increasing returns to scale, market structure of monopolistic competition, and product transportation cost provide a unique perspective for understanding the impact of financial agglomeration and green technology innovation on carbon emissions. From this theoretical perspective, the study of the impact of financial agglomeration and green technology innovation on carbon emissions can also bring a new empirical basis and theoretical supplement for the deepening and expansion of this theory.
Under the framework of new economic geography theory, financial agglomeration, as the core force of modern economic development [41], can use the agglomeration and diffusion effects to jointly affect carbon emissions, promote the healthy competition of economies of scale and technology spillover [46], generate economies of scale while realizing energy conservation and emission reduction, and effectively promote the process of ecological efficiency. On the one hand, the economies-of-scale effect of financial agglomeration on carbon emissions means that financial agglomeration promotes the improvement of the economic level and the agglomeration of the labor market so that different industries can share labor force and promote the labor pool effect, thus reducing labor search costs and creating conditions for reducing carbon emissions. The industries within financial agglomerations can reduce resource waste from redundant construction and decrease carbon emissions by sharing green infrastructure, such as centralized power supply systems and green energy networks. Additionally, financial agglomeration is often accompanied by other types of agglomeration (e.g., financial institutions do not exist in isolation but collaborate symbiotically with other mature institutions in law, technology, information, etc.) Financial agglomeration is closely linked to other industries, adjusting the spatial layout of industries through capital allocation and forming a regional industrial chain loop. Financial agglomeration provides funding for green technological innovation, while surrounding mature institutions offer practical scenarios for the transformation of innovation outcomes, allowing green technological innovations to be better applied and disseminated across industries, promoting green transformation, and reducing carbon emissions. Furthermore, financial agglomeration guides nearby green investments, indirectly reducing transportation demand and lowering carbon emissions [49]. Accounts receivable financing, inventory pledging, smart contracts, and other supply chain finance tools can optimize corporate cash flow, reduce inventory accumulation, and shorten logistics turnaround time, effectively lowering fossil energy consumption during product transportation. Digital tools such as blockchain and cloud computing can reduce information asymmetry and friction in cross-regional transactions [74], shorten contract negotiation cycles, and reduce hidden costs. They can also improve capital flow efficiency, lower costs related to capital immobilization, accelerate technology diffusion [7], and reduce technology search and adaptation costs, thereby further cutting virtual transportation costs for products. On the other hand, the new economic theory emphasizes the key role of knowledge spillover in industrial agglomeration and economic development. The network effects of financial agglomeration facilitate the rapid dissemination of knowledge, such as technological innovation and management experience, among enterprises, fostering more innovation, improving innovation efficiency, and promoting the agglomeration of innovative resources. However, financial agglomeration may also lead to the rapid diffusion of risks, affecting the stability of technological innovation and consequently influencing carbon emissions. Therefore, this paper proposes the following hypothesis:
Hypothesis 1:
Financial agglomeration can effectively reduce carbon emissions.
Green technological innovation is an effective means to reduce carbon emissions and promote sustainable development [4,75]. The consensus on low-carbon sustainable development has been widely accepted globally, and companies can meet the green and low-carbon demands of their stakeholders through the social recognition brought about by green technological innovation [75]. From the perspective of spatial concentration, financial agglomeration generally also represents the concentration of talent and advanced knowledge, which effectively stimulates innovation, promotes the gathering of innovative resources, and attracts more R&D talent and funding. This directs more investment funds into green technological innovation, further expanding the production scale of green enterprises, forming innovation clusters, accelerating the R&D and promotion of green technologies, and improving energy efficiency [61]. Through green technological innovation, clean production technologies can be upgraded, traditional industry supply chains and value chains optimized, and high-energy-consuming and high-emission industries forced to undergo transformation and upgrading, thereby reducing energy consumption and establishing the scale effects of green industries. This reduces carbon emissions and promotes economic development. The spatial agglomeration of green technological innovation also facilitates the reduction in R&D result conversion costs through technological proximity, thereby enhancing regional energy efficiency. Furthermore, green technological innovation, by increasing economic output [76] and collaborating efficiently with carbon pricing [77], can significantly reduce carbon emissions. Therefore, this paper proposes the following hypothesis:
Hypothesis 2:
Green technology innovation can drive down carbon emissions.
In addition, the new economic theory focuses on the differences in the spatial distribution of economic activities. The degree of financial agglomeration and the level of green technological innovation in different regions are significantly influenced by factors such as economic development levels, policy environments, and geographical locations, leading to varying patterns of carbon emissions across regions. Due to the differences in factor endowment, technological input level, foreign investment level, and financial concentration level in the eastern, central and western regions of China [64], there are significant regional differences in carbon emissions among different regions [42]. However, foreign direct investment, economic infrastructure, and other factors impact the innovation ability of enterprises [34] and the level of regional financial agglomeration, which have different impacts on carbon emission reduction. That is, the impact of financial agglomeration and green technology innovation on carbon emission has regional heterogeneity. The interaction between digital finance and green technology innovation has spatial heterogeneity in carbon emissions [69]. The impact of green technology innovation on different types of cities is also heterogeneous [63]. Therefore, this paper proposes the following hypothesis:
Hypothesis 3:
The influence of financial agglomeration and green technology innovation on carbon emissions has regional heterogeneity.

3. Analysis of Level Measurement of Financial Agglomeration, Green Technological Innovation, and Carbon Emission

3.1. Analysis of Financial Agglomeration Level Measurement

3.1.1. Measurement Method

The degree of financial agglomeration quantifies the spatial concentration density of financial sector activities within a defined geographical area, encompassing both traditional financial institutions (e.g., commercial banks, securities firms, and insurance corporations) and emerging financial technology enterprises. At present, there are many measurement methods for agglomeration level, such as location entropy, Gini coefficient, Ellision–Glaeser index, etc. Due to research perspectives and problems being complex and diverse, a standard measurement method has not been established, and a lot of focus is placed on choosing measurement indicators. The advantage of location entropy is that it can measure the agglomeration level of a region, reflect the level of industrial sector specialization, and determine the standing and function of an area within a high-level region [78]. In the study of industrial structure, the location entropy index can be used to analyze the status of regionally advantageous industries. By calculating the location entropy of a certain regional industry, the advantageous industries with a certain status in the country can be found, and the specialization rate can be measured according to the location entropy value. For instance, Qu et al. [79] used the formula of location entropy to calculate different Chinese regional financial agglomeration levels. Wang et al. [80] and Zhang et al. [81] considered that location entropy is not affected by regional scale, so the degree of industrial agglomeration is assessed using the location entropy approach. Considering the above scholars’ experiences and the advantages of location entropy, we measure the financial agglomeration level using the location entropy formula. Its basic expression is as follows:
L Q ij = q i j / q j q i / q
L Q i j is industry i s national location entropy of region j , indicating regional financial agglomeration level; q i j is region j s added value to the financial industry; q j is the gross domestic product of region j ; q i is the country’s added value of the financial industry; q is the gross domestic product of the country.

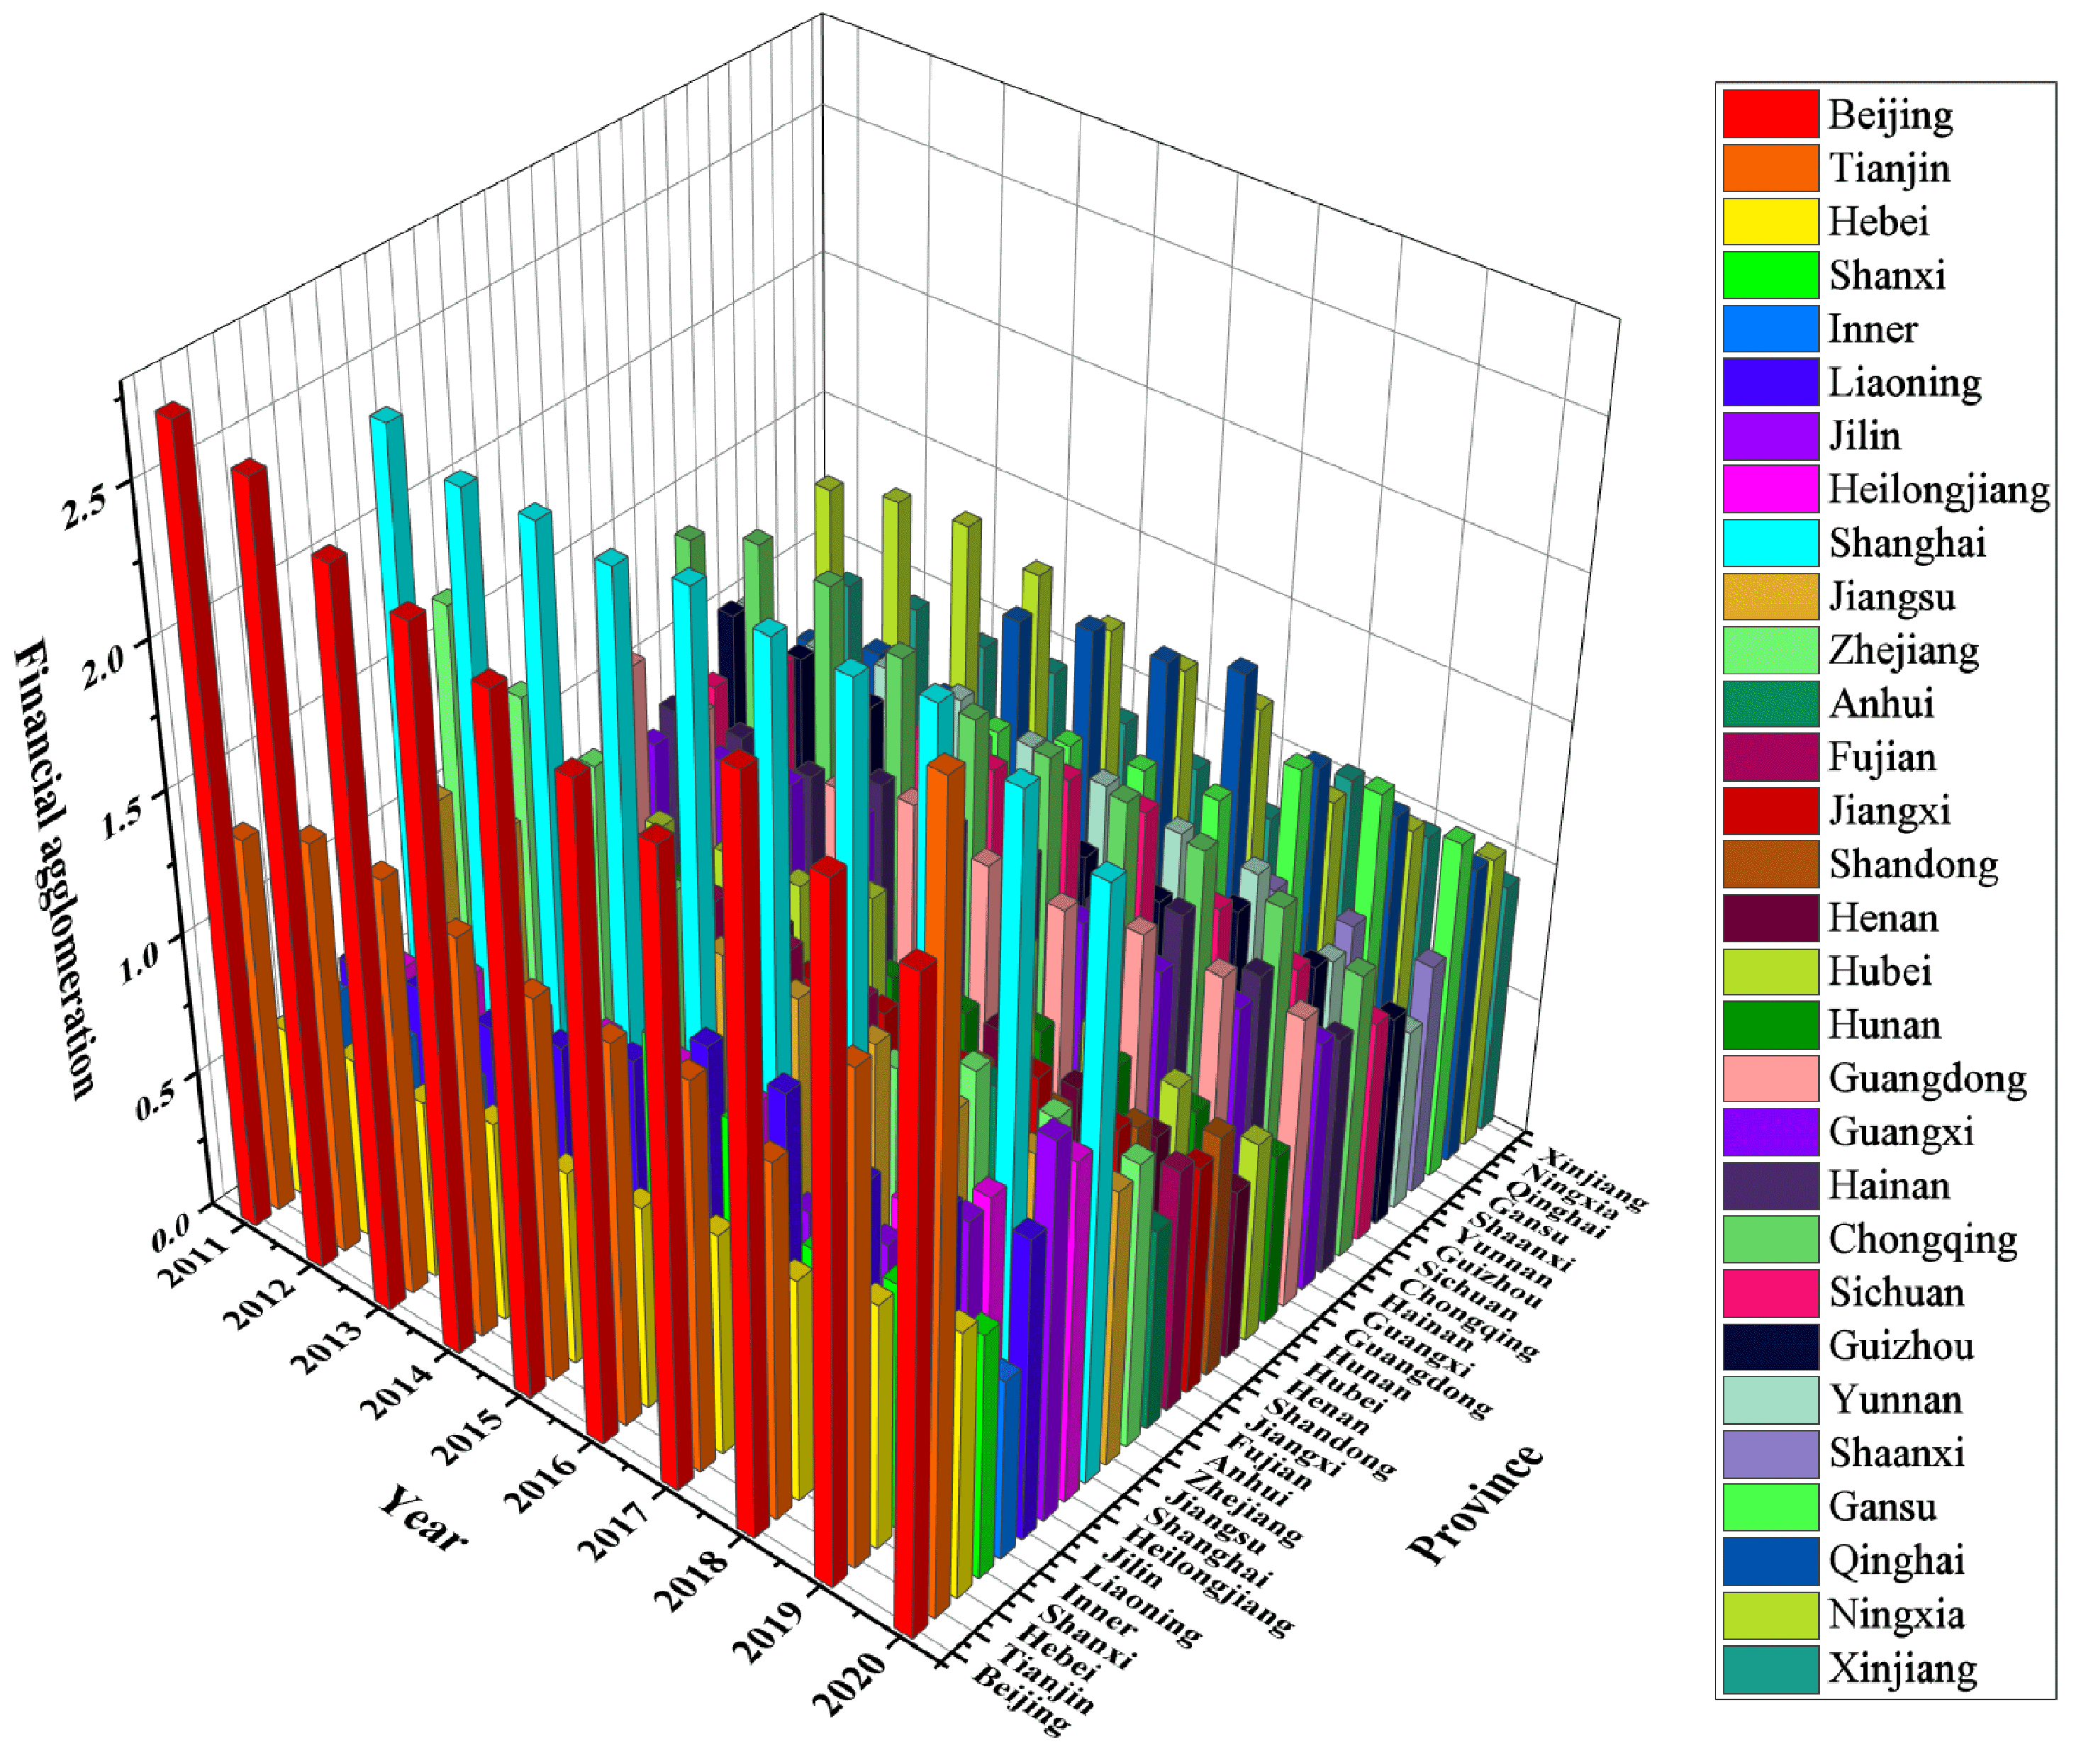
3.1.2. Evaluation of Financial Agglomeration Level

According to the formula of the location entropy method, our sample of 30 provinces and cities in China for 2011–2020′s financial agglomeration levels are measured, and we draw a panel accumulation diagram, as shown in Figure 1.
Each province’s financial agglomeration level presents a dynamic and stable development over time, and the financial agglomeration level in the area increases with the locational entropy value. The regional financial agglomeration level is higher when the locational entropy exceeds 1. Whenever the location entropy is below 1, the region’s financial agglomeration level is inferior to the national level. Beijing and Shanghai’s average location entropy is greater than 2, which is higher than other provinces. This indicates that Beijing and Shanghai, the two largest financially centered cities in China, attach great importance to their industries’ financial growth and attract an abundance of financial enterprises to settle in with their unique radiating power and influence. That is, eventually forming a huge financial industry chain and financial market trading system. Of course, the financial development levels of the provinces and cities surrounding these two cities are also relatively high. For instance, the financial agglomeration degree of Tianjin, Jiangsu, Zhejiang, and Shanxi is at the forefront of the country, indicating that a certain radiation effect exists between regions due to financial agglomeration. Additionally, the financial agglomeration level in Guangdong, Chongqing, Qinghai, and Ningxia is also at the nationally leading level, showing that these regions’ industry financial amount is relatively high and a certain phenomenon of financial agglomeration exists. However, the financial agglomeration level of Jilin, Inner Mongolia, Henan, and Hunan is too low, demonstrating that these provinces’ financial industry development slow rate lags behind the national level.

3.2. Analysis of Green Technological Innovation Level Measurement

3.2.1. Measurement Method for Green Technological Innovation

Green patent data can evaluate the level of green technology innovation [82]. Green patents can be divided into green invention and utility model patents [83]. The number of people in different regions will lead to the number of patents in different regions. Moreover, Zhang et al. [84], through studying the impact of OFDI on green finance, also proved that the number of green patent applications per 10,000 people can well measure the level of green technology innovation in each region. Therefore, this paper uses the number of green patent applications per 10,000 people to measure the level of green technology innovation in each region.

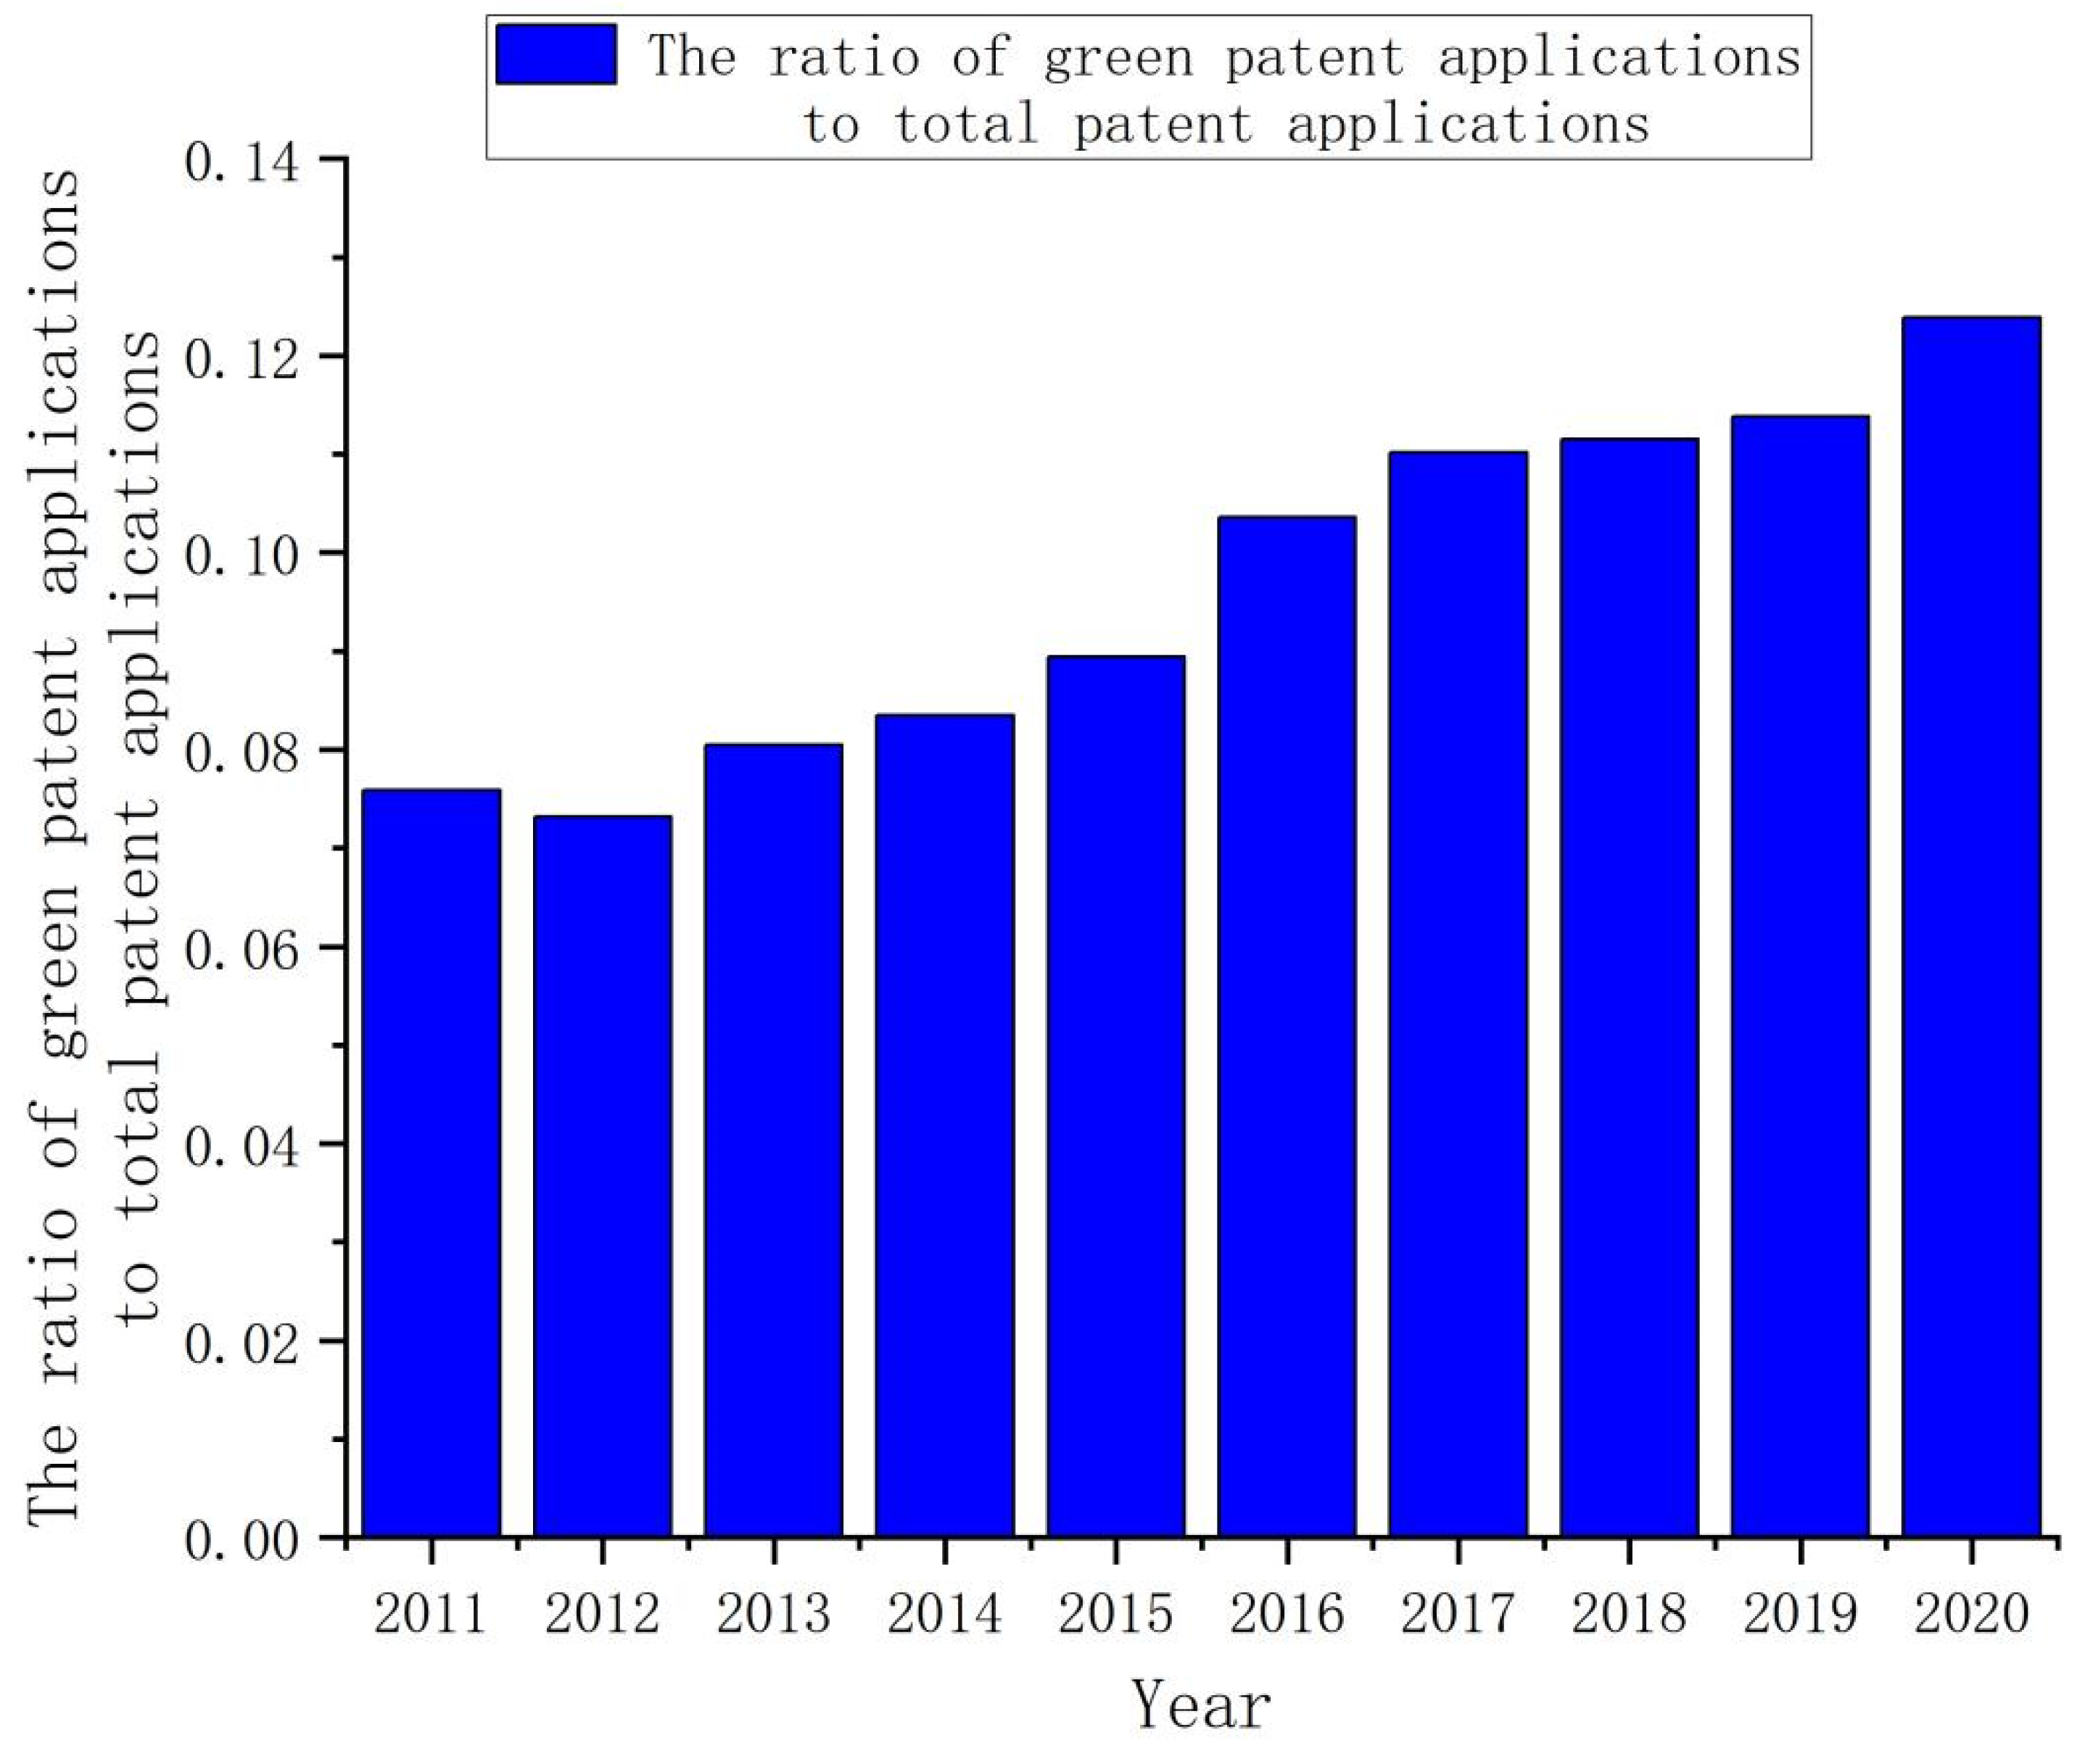
3.2.2. Green Technological Innovation Level and Dynamic Analysis

According to the above green technology innovation indicators, the green technology innovation level of each province and city from 2011 to 2020 is calculated, and Figure 2 is the panel stacking diagram drawn according to the calculated results.
The level of green technical innovation in Beijing, Tianjin, Jiangsu, Shanghai, and Guangdong is relatively high. This is because these regions have better economic technology, human resources, geographical location, higher level of resource allocation, relatively high support for green technology, and large scale and level of development of green enterprises. However, the level of green technology innovation in Ningxia, Xinjiang, and Qinghai is relatively stable and low, which is caused by the weak development of high-tech. To improve the level of green innovation, it is important to promote logical resource allocation and increase corresponding research and development investment to make up for the shortage in technology. From the perspective of the whole country, the level of green technology innovation is high in the eastern region and low in the western region.
To further explore the dynamic link of national green technological innovation levels, this paper calculates the number of green patent applications in the country from 2011 to 2020 and judges the degree of green technology advancement, as shown in Figure 3.
On the whole, the number of green patent applications in China is increasing. The number of green patent applications from 2011 to 2015 shows a steady upward trend, but the number of green patent applications from 2015 to 2019 increased significantly, indicating that China’s technical development has considerably improved from 2015 to 2019. Although the number of green patent applications may have fallen briefly in 2020 due to the impact of COVID-19 and economic development, it is still at a high level. Overall, the number of green patent applications in 2019 is about 5 times that of 2011, and the number of patent applications in 2020 is also about 3 times that of 2011, which shows that China’s green technological level has developed rapidly and improved.
To control for potential exogenous effects of factors such as business cycles and demand changes, we also compared the ratio of green patents to the total number of patents [85,86]. The ratio between the number of green patent applications and the total number of patent applications in China is shown in Figure 4. It can be found that the ratio of the number of green patent applications to the total number of patent applications is on the rise, which also indicates that the level of green technology innovation in China is constantly improving.

3.3. Analysis of Carbon Emission Level Measurement

3.3.1. Measurement and Analysis Method of Carbon Emission

The primary source of carbon emission is burning fossil fuels. Because there are not any direct monitoring statistics, the carbon emission coefficient published by the IPCC (2006) is what most researchers utilize to estimate total carbon emissions [87]. Taking data availability into account, eight energy sources, namely natural gas, fuel oil, diesel, kerosene, gasoline, crude oil, coke, and raw coal, are selected in this paper to measure carbon emission [88]. The specific formula for the calculation is listed below.
T C = ( i = 1 8 E i ×   C E F i ) / P O P
C E F i = H i × C H i × C O R i × 44 12 × 10 ( 6 )
where E i is the eight fossil fuel sources’ total consumption, P O P represents the total population in the region, T C represents per capita carbon emissions, C E F i is energy i s carbon emission coefficient, H i is the average low calorific value of energy i , C H i is the carbon content per unit calorific value of energy i , and C O R i is the carbon oxidation rate of energy i ; 44/12 is the amount of carbon converted into CO2, and Table 1 shows the final calculated carbon emission coefficient.

3.3.2. Measurement of per Capita Carbon Emission Level

The paper measures the per capita carbon emission of the provinces of the country according to the above formula, collects the data, and draws the carbon emission level into a panel columnar accumulation chart, which is convenient for an intuitive examination of each province and city’s carbon emission level and change features (Figure 5).
The national carbon emissions have been in a state of steady growth from 2011 to 2020, among which the per capita carbon emissions of Inner Mongolia and Ningxia are China’s top two regions. Considering the geographical location of various Chinese provinces, the regions with higher carbon emissions are primarily the old industrial bases in Northeast China and some coastal cities in Eastern China and Xinjiang. The southern regional carbon emissions level is generally lower than that of the northern region. In addition, over time, higher carbon emission areas can impact the neighboring areas as well, resulting in a rise in surrounding areas’ carbon emissions, and for lower carbon emission areas’ surrounding areas, a fall in carbon emissions. Therefore, it is evident that carbon emissions have a spatial spillover impact among different regions in the country, and it is essential to study its spatial effect further.

4. Baseline Regression Analysis

4.1. Research Design

4.1.1. Variable Selection

According to the research object of this paper, financial agglomeration (AGG) and green technological innovation (TECH) are selected as explanatory variables, and per capita carbon emission (TC) is selected as the explained variable. Furthermore, because various variables affect carbon emissions, including economic, environmental, and social factors, the following variables are used in this paper as control variables based on literature review analysis.
(1)
Industry structure (a1): The main component of the social and economic system is industry structure. The main factor affecting regional carbon emissions and the key direction of pollution control is the secondary industry, so the resource allocation of industrial structures can affect carbon emissions [89].
(2)
Urbanization rate (a2): Different urban agglomerations’ carbon emissions rise as the urbanization rate rises, but the increase rate is different, so urbanization rate and carbon emissions are inextricably linked [90].
(3)
Foreign direct investment (a3): Malik et al. [91] believe that foreign direct investment (FDI) can support various nations’ economic advancement. However, the impact of FDI on the environment is also rising due to climate change. Hence, it is essential to further research and analyze their relationship in more detail.
(4)
Environmental regulation (a4): Reasonable implementation of environmental regulations and efforts to improve carbon productivity are realistic choices for China to cope with climate change. At present, environmental regulation and carbon emission interact and influence each other. Consequently, while examining the factors influencing carbon emissions, the importance of environmental regulation cannot be disregarded [92].
(5)
Government intervention (a5): To fulfill the objectives of the “double carbon” strategy and foster green economic growth, it is not only possible to rely on the free market to address the issue of carbon emission and global warming but also the coordination and control of the government. Therefore, this paper also sets government intervention as a control variable to research its effect on carbon emissions.
This paper quantifies the control variables, and Table 2 shows its specific calculation formula.

4.1.2. Data Sources

The inter-provincial panel data for 2011–2020 were chosen as the data for this article, among which the data of the patents granted is from CNRDS database, and the data of other variables are from the EPS database, the National Bureau of Statistics, and the statistical yearbook of each province and city.

4.1.3. Descriptive Statistics

Table 3 displays the descriptive statistical findings for each variable.

4.1.4. Model Establishment

Due to the high data requirements of spatial analyses, baseline regression is performed before exploring the spatial effects of financial agglomeration and green technology innovation on carbon emissions. To determine whether there is a relationship between financial agglomeration, green technology innovation, and carbon emissions, the basic model is set as follows:
T C i t = β 0 + β 1 A G G i t + β 2 G T E C H i t + i = 1 5 λ i a i t + ε i t
where T C i t represents per capita carbon emissions; A G G i t represents financial agglomeration level; T E C H i t represents green technological innovation efficiency; a i t represents control variables, including industrial structure, urbanization rate, FDI level, environmental regulation, and government intervention; i represents province; t represents year; β 0 is a constant term; β i and λ i are regression coefficients; and ε i t is the random disturbance term.

4.1.5. Model Test

A Hausman test was carried out on the panel regression model, and the result indicated that the benchmark regression model’s p-value was 0.0000 (Table 4), passing the 1% level of significance and leading to the fixed-effect model being chosen [97].

4.2. Baseline Regression

4.2.1. Results of Baseline Regression

Proceeding, this paper conducts a basic significance test and analysis for each variable, and Table 5 displays the specific outcomes.
The results are analyzed as follows: According to the model’s findings, financial agglomeration and green technological innovation have a markedly negative regression coefficient, indicating that both financial agglomeration and green technological innovation can reduce carbon emissions. The coefficient of financial agglomeration is −1.3102, indicating that carbon emissions are negatively impacted by financial agglomeration, and every unit increase in financial agglomeration will reduce carbon emission by 1.3102 units. Green technological innovation’s coefficient is −0.8659, showing that carbon emissions will decrease by 0.8659 units for every unit rise in the green technological innovation level. This may be because the improved level of financial agglomeration realizes the cross-regional allocation of credit resources, the level of green technology innovation improves energy utilization efficiency, and guides production factors, especially capital factors, to lean toward green and low-carbon industries, reducing regional carbon emission intensity. As for the control variables, both industrial structure and environmental regulation have passed the significance test, and their regression coefficients are negative, testifying that service industries’ development, such as tertiary industry and environmental regulations, can effectively reduce carbon emissions [89,98], assisting in the coordinated growth of a green economy. However, the urbanization rate and government intervention’s coefficients are markedly positive, testifying that promoting urbanization and government intervention will increase carbon emissions [90], resulting in a certain greenhouse effect. The tertiary industry’s dependence on energy is relatively small, and the country has strengthened the governance of the industrial environment and improved environmental regulations, coupled with the transformation of modern enterprises and the enhancement of consumers’ awareness of environmental protection, reducing the carbon emissions of the whole society.

4.2.2. Robustness Test of Baseline Regression

In this paper, all explanatory variables are tested for robustness with a one-stage lag, and the regression results are shown in Table 6. It can be found that both financial agglomeration and green technology innovation can promote carbon emission reduction, which is consistent with the baseline regression results. Therefore, the model established in this paper passes the robustness test.

5. Spatial Econometric Analysis

5.1. Model Selection

5.1.1. Spatial Autocorrelation

A spatial econometric model is based on regional interaction, so a spatial autocorrelation test should be conducted before spatial econometric analysis [99]. The spatial autocorrelation analysis can determine whether a variable is spatially related and how correlated it is, and it quantitatively describes the spatial dependence of things [100]. The commonly used analysis method for the spatial autocorrelation test is Moran’s I significance test. Moran’s I can be used to reflect the spatial correlation between a province and other adjacent regions, divided into global and local Moreland indices [42,101]. In this study, the spatial autocorrelation of carbon emission levels is measured using Moran’s I. Global Moran’s I is used to judge the spatial correlation of data on the whole, and its specific formula is as follows:
M o r a n s   I = n i = 1 n j = 1 n w i j ( x i x ¯ ) ( x j x ¯ ) S 2 i = 1 n j = 1 n w i j
The local Moran’ I mainly explores the spatial agglomeration form between different regions, which is usually combined with scatter plots to assay spatial correlation. Its formula is as listed.
M o r a n s   I = ( x i x ¯ ) S 2 j = 1 n w i j ( x i x ¯ )
In Formulas (8) and (9), x i and x j represent region i s and region j s observed values, respectively, n represents the total number of regions, S 2 = i = 1 n ( x i x ¯ ) 2 / n is the sample variance, x ¯ represents the average value and w i j represents the spatial weight matrix.
Since the research object of this paper is 30 provinces in China, covering a land area of about 9.6 million square kilometers, geographical distance has become an important factor for the large gap between provinces and cities, and the study of inter-regional or provincial interconnections is based on the geographical characteristics of different regions. The spatial weight matrix of geographical distance is a spatial weight matrix set according to the reciprocal of geographical distance between two regions. As such, we adopt the spatial weight matrix of geographical distance.
w i j = 1 / d i j ,   i j 0 ,   i = j
where d i j represents the geographical distance between two regions.
The Moran’s I value lies between −1 and 1. A positive spatial autocorrelation is present when the Moran index is greater than 0. When Moran’s I is below 0, there is a negative spatial autocorrelation. There is not any geographical association when the Moran’s I is zero.

5.1.2. Spatial Model Selection

If there are different degrees of spatial correlation, then it is necessary to analyze using a spatial econometric model. At present, the most widely used spatial panel models include spatial error model (SEM), spatial autoregressive model (SAR) and spatial Durbin model (SDM). SAR considers the impact of the surrounding region’s explained factors on the study region’s explained variables and adds the model as a spatial lag term. The model can be expressed as follows:
y i t = ρ j = 1 n w i j y j t + β x i t + μ i + ε i t
SEM takes into account the influence of explanatory variables in the surrounding area on those in the study area and adds the spatial error term to the model of the measurement equation to show the overflow degree of regional variables to the surrounding area. The expression is shown as follows:
y i t = β x i t + μ i + λ t + φ i t
φ i t = γ j = 1 n w i j φ j t + ε i t
SDM is a combined extension form of the spatial lag model and spatial error term model, which can be set up by adding corresponding constraints to the spatial lag model and spatial error model. SDM reveals the spatial spillover effect of explained variables in neighboring regions and studies the influence of explanatory variables in neighboring regions on explained variables in the study region. This is a common model for empirical testing of spatial spillover effects. The expression of the SDM is as follows:
y i t = ρ j = 1 n w i j y j t + β x i t + θ j = 1 n w i j x j t + μ i + λ t + ε i t
where y i t and y j t represent the explained variables in various areas, x i t and x j t represent explanatory variables for different regions, w i j is the spatial weight matrix, j = 1 n w i j y j t represents the explained variable’s spatial lag term, i and j represent different provinces, t represents the year, ρ represents the spatial autoregressive coefficient, β are the regression coefficients, μ i represents the individual fixed term, λ t represents the time effect. φ i t represents the residuals with spatial correlation, which depends on the residuals φ j t of adjacent spatial units and a white noise process ε i t , and γ represents the autoregressive coefficient of the residuals.
For model selection, the LM test is first used to determine which spatial econometric model to choose. Secondly, the Hausman test selects a fixed or random effect model, and the appropriate spatial model can be selected.

5.2. Spatial Autocorrelation Test

This paper uses Moran’s I to test China’s carbon emissions level’s spatial correlation, and Table 7 displays the test findings. As can be observed, the value of Moran’s I is significantly positive, showing that different locations’ carbon emissions correlate positively in space. Thus, when a local area produces more carbon emissions, its surrounding areas likewise produce more carbon emissions. In a situation where a local area produces fewer carbon emissions, its surrounding regions likewise produce fewer carbon emissions, showing that the carbon emissions between neighboring areas present “the same high and the same low” traits, and a spatial spillover impact exists.
The local Moran index test helps us to further understand whether spatial heterogeneity in carbon emission levels exists in some provinces and cities. The Moran scatter plot divides all provinces and cities into four quadrants. The first quadrant is the high–high accumulation area (H-H), suggesting that the local area and the surrounding region’s carbon emissions are relatively high. The second quadrant is the low–high aggregation area (L-H), suggesting that the local area’s carbon emissions level is lower in the local area but higher in the surrounding area. The third quadrant is the low–low accumulation region (L-L), suggesting that the local and the surrounding regions’ carbon emissions are lower. The fourth quadrant is the high–low aggregation zone (H-L), representing that the local area’s carbon emissions level is higher but lower in the surrounding region. In this paper, local Moran scatter plots of 2011, 2014, 2017, and 2020 are selected for specific analysis (Figure 6).
As can be found, more than two-thirds of provinces are evenly distributed in the H-H and L-L agglomeration regions, indicating that the carbon emissions level in most regions is affected by the surrounding regions; that is, the carbon emissions among provinces and cities have convergence and a positive spatial autocorrelation. Some regions are distributed in low-to-high concentration areas, indicating that these regions have implemented strong carbon reduction measures and are unaffected by the surrounding areas. In addition, a few regions show high–low characteristics, showing that these provinces have higher carbon emission levels than their surrounding regions, and spatial heterogeneity exists.

5.3. Analysis of Regressive Results

The geographical autocorrelation test reveals that the carbon emissions level exhibits spatial dependency, making it appropriate for a spatial econometric assay. According to Elhorst [102], the LM test is first used to determine which spatial measurement model to choose. Table 8 displays the LM test findings. The findings indicate that both the SEM and the SAR pass the traditional LM test, but the SEM fails the robust LM test, so the SAR is the optimal model.
Second, the findings indicate that the p-value of the Hausman test of the SAR is 0.0163 (Table 9), which is significant at the 5% level, so we chose the fixed-effect model, and the test results are shown in Table 10.
This paper finally selects the spatial autoregressive model of double fixed effect for spatial econometric analysis. On the whole, ρ is significantly positive, demonstrating that the intensity of carbon emissions has a positive spatial spillover impact. The regression coefficients of green technical innovation and financial agglomeration at 1% and 5% levels, respectively, are significantly negative, showing that under the spatial effect, improving financial agglomeration and green technological innovation levels will also reduce carbon emissions and foster a low-carbon economic growth, which roughly agrees with the baseline panel regression model’s results. Among the control variables, both environmental regulation and industrial structure passed the significance test, and the regression coefficients were negative, indicating that both environmental regulation and industrial structure can effectively curb carbon emissions and drive sustainable development.

5.4. Robustness Test of Spatial Regression

To ensure the reliability of the findings regarding how financial agglomeration and green technological innovation affect carbon emissions, this paper adopts tail-reduction treatment (1%, 99% tail-reduction) to conduct robustness tests. The specific regression results are shown in Table 11. It can be found that the coefficient of financial agglomeration and technological innovation is negative, and both pass the significance test, indicating that financial agglomeration and technological innovation can promote carbon emission reduction and green economy under the effect of spatial effect, which is also consistent with the conclusion drawn above.

5.5. Heterogeneity Analysis

China has a vast geographical area, and the eastern coast differs greatly from the western and central areas [103]. The overall spatial measurement inevitably fails to explore the spatial relationship among financial agglomeration, green technological innovation, and carbon emissions within the various regions. Therefore, this paper conducts a spatial measurement analysis from the eastern, central, and western parts (Table 12).
The findings in Table 12 show that the influencing factors for carbon emissions in the eastern, central, and western areas differ. As green technological innovation grows in the eastern region, carbon emissions will decline since the coefficient of green technological innovation is significantly negative. Given that financial agglomeration’s coefficient failed the significance test, the growth of financial agglomeration in the eastern region has no bearing on carbon emissions. As for the control variables, the urbanization rate passed the significance test, and its coefficient is significantly positive, showing that the urbanization rate can significantly raise carbon emissions.
Green technical innovation and financial agglomeration in central areas have a very detrimental impact on carbon emissions, showing that the central areas improving financial agglomeration and green technological innovation levels can reduce carbon emissions and foster a green and low-carbon economy. Among the control variables, the industrial structure passed the significance test in the central region, indicating that upgrading the industrial structure in the central region is conducive to reducing carbon emissions.
Financial agglomeration in the western region has a significantly negative impact on carbon emissions, while green technology innovation has a significantly positive impact on carbon emissions. This indicates that financial agglomeration in the western region can reduce carbon emissions, but green technology innovation and development will lead to an increase in carbon emissions. This is because the production capacity in western China is relatively backward, and it is difficult to meet the requirements of green technology innovation and development. Therefore, in the short term, green technology innovation will increase carbon emissions. Among the control variables, urbanization rate, foreign direct investment, environmental regulation, and government intervention all passed the significance test, but the direction of influence was different. The development of urbanization processes and environmental regulations can contribute to reducing carbon emissions and slow down the greenhouse effect. An increase in FDI level and government intervention can cause a rise in carbon emissions.

6. Discussion

In contrast to Wan et al. [104], who used China’s CO2 emission accounting databases (CEADs) to measure carbon emissions across different provinces, this paper estimates total carbon emissions according to the carbon emissions coefficient offered by the IPCC (2006) and finds that the national carbon emissions showed a steady growth trend from 2010 to 2020. This is consistent with the carbon emissions from the infrastructure construction calculated by Zhao et al. [105]. Moreover, it can be found that carbon emissions vary greatly among provinces in China [106,107]. Ningxia and Inner Mongolia have much higher carbon emissions than developed regions, such as Beijing and Shanghai. This study employs the location entropy method to measure the level of financial agglomeration. The findings reveal that the financial agglomeration level exhibits a dynamic and stable developmental state, demonstrating a certain degree of agglomeration. These results align with the findings of Wan et al. [104], who measured financial agglomeration using the entropy method.
Furthermore, this study investigates the spatial effects of financial agglomeration on carbon emissions. In contrast to Wan et al. [104], who exclusively examined the spatial spillover effects of financial agglomeration on carbon emissions along with the mediating roles of energy consumption and technological market development, this work innovatively incorporates green technological innovation as an explanatory variable to explore the spatial effects of financial agglomeration and green innovation on carbon reduction. This paper demonstrates that financial agglomeration and green technology innovation can effectively promote carbon emission reduction. This will help enrich empirical research on agglomeration economy and environmental impact in the new economic theory and provide a theoretical basis for the connection between financial agglomeration and sustainable development. It also expands the application of new economic theory in the field of industrial upgrading and sustainable development and opens up new ideas for the cross-study of technological innovation and environmental economy. In addition to financial agglomeration, green technological innovation and industrial structure, policy orientation, social development, and living needs could also impact the total amount of carbon emissions [107]. For example, through information technology, environmental decentralization, and industry structure effects, the New Energy Demonstration City Program (NEDC) can reduce carbon emissions [108]. Similarly to the heterogeneous effects of green circular economy, high-speed rail, and other factors on carbon reduction [106,109], this paper also finds that while increasing financial agglomeration and technological innovation levels can reduce carbon emissions, their carbon reduction effects exhibit regional heterogeneity. Specifically, the carbon reduction effect of financial agglomeration in the eastern region is not significant, while an increase in financial agglomeration levels in the central and western regions can significantly reduce carbon emissions. Moreover, green technological innovation in the eastern and central regions can significantly reduce carbon emissions, whereas, in the western region, it may lead to an increase in carbon emissions. This finding contrasts with that of Wan et al. [104], who suggested that financial agglomeration in the eastern and central regions significantly reduces carbon emissions, while it increases emissions in the western region.
Contrary to the general assumption that underdevelopment leads to reduced carbon emissions, implying that a decrease in financial agglomeration should also reduce overall carbon emissions, the results of this study show the opposite. This is because the carbon reduction effect of financial agglomeration arises from the interaction between regional heterogeneity and spatial spillover mechanisms. In the western region, financial agglomeration can suppress regional carbon emissions by optimizing the energy investment structure and curbing the expansion of high-carbon industries. However, in the eastern region, where market maturity is higher, the marginal carbon reduction effect of financial agglomeration has already saturated. When financial agglomeration decreases overall, the western region is the first to lose its ability to allocate funds, leading to a resurgence of high-carbon industries such as thermal power. In contrast, while the eastern region can maintain some carbon reduction through existing green technological innovation, it cannot offset the scale effect of the rebound in carbon emissions from the western region. Crucially, the weakening of financial support in the western region forces high-carbon enterprises to move to the central region, where environmental regulations are more lenient, thereby partially offsetting the carbon reduction effects of green technological innovation in the central region. This ultimately leads to an overall increase in national carbon emissions rather than a decrease. Therefore, it is essential to establish a differentiated regional financial policy and technology innovation coordination mechanism.

7. Conclusions and Policy Recommendations

7.1. Conclusions

We explored the influence mechanism by which green technological innovation and financial agglomeration affect carbon emissions and analyzed the spatial impacts of each variable in detail. Heterogeneity analysis was introduced to investigate the differences between the eastern, central, and western areas. Specific findings are listed:
Firstly, the improvement of financial agglomeration and green technological innovation levels can promote carbon reduction and drive both environmental and economic sustainability. Secondly, when the spatial impact is considered, financial agglomeration and green technical innovation still have some inhibitory effect on carbon emissions. This indicates that financial agglomeration and technological innovation have spatial effects on carbon emissions. This is because financial agglomeration enables geographically clustered financial institutions to leverage external economic effects, share infrastructure and specialized services, mitigate information asymmetry, and accelerate the diffusion of green technologies. Adjacent regions benefit from knowledge spillover effects, which enhance green technology adoption, optimize energy utilization, reduce carbon emissions, improve environmental quality, and ultimately promote environmentally sustainable development. Finally, the influence of financial agglomeration and innovation in green technology on carbon emissions has regional heterogeneity. The green technological innovation in the eastern region can foster the reduction of carbon emissions, but the influence of financial agglomeration on carbon emissions is not significant. The central region may greatly reduce carbon emissions through financial agglomeration and green technological innovation. The improvement of financial agglomeration in the western region can foster the reduction of carbon emissions, while the innovation of green technology will lead to increased carbon emissions. This is because there are structural differences between financial agglomeration and green technology innovation in different regions. The level of financial agglomeration in the eastern region has been relatively saturated, which has a limited effect on carbon emissions. The western region is dominated by energy and heavy industry, and the level of green technology innovation is obviously lower than that of the eastern and central regions. The enhancement of green technology innovation will increase carbon emissions in the short term.

7.2. Policy Recommendations

To sum up, both financial agglomeration and innovation in green technology have an inhibitory impact on carbon emissions. To realize the strategic objective of the “double carbon” and to advance the coordinated, sustainable, and green growth of the economy, we put forward the following suggestions based on the above conclusions:
Firstly, from a nationwide perspective, considering that promoting a green regional economy relies heavily on financial agglomeration, suggestions and guidance can be carried out in two stages. In the initial stage of financial agglomeration, accelerated cross-regional and multi-industry financial center construction is needed. Economic activity concentration should be improved, and the construction of urban agglomerations should be strengthened. Financial center areas should be shaped to boost regional economic integration and remove intercity trade barriers. In the later stage of financial agglomeration, a regional gradient financial development network should be built to avoid repeated construction of the core area of financial agglomeration. Continuously improving policies such as carbon pricing and tax incentives can guide financial institutions towards green transformation and promote sustainable development. Additionally, green technological innovation can also significantly reduce the level of carbon emissions. Therefore, governments should first develop more regulations to promote green technology innovation [110], encourage local businesses to expand institutional infrastructure, training spending, and research and development budgets and establish technology transfer routes between regions to facilitate the flow of advanced technology and expertise toward a low-carbon economy. Secondly, enterprises could develop technology industries related to improving energy intensity, carry out additive manufacturing [111], pay attention to R&D inputs, play the regulating role of green technological innovation, improve energy efficiency levels [112], reduce carbon emissions intensity, reduce the greenhouse effect, and promote sustainable development.
Secondly, there are great differences in economic development and resource endowment among different regions. The impact of financial agglomeration and green technology innovation on carbon emissions is also different. Therefore, it is necessary to formulate carbon emission reduction policies according to local conditions. For the eastern regions dominated by high-tech industries, such as the Beijing–Tianjin–Hebei region and the Yangtze River Delta region, the level of green technology innovation is the main factor affecting their carbon emissions. Carbon emission reduction should be focused on reasonable guidance of green technology innovation to meet the capital needs of enterprises and industries in energy transformation, green technology innovation, and cleaner production [113]. At the same time, foreign direct investment should be strengthened, exchanges and cooperation between local and well-known foreign enterprises should be promoted, and the development experience of low-carbon and strategic emerging industries should be learned from. Encourage the capital market to build a reasonable urbanization system, accelerate the upgrading and transformation of the industrial structure in the eastern region [114], reduce the proportion of the primary industry in national income, accelerate the low-carbon development of the secondary industry, constantly highlight and develop the advantages of the tertiary industry, optimize its internal structure, improve the overall level and quality of the service industry, and implement the sustainable urbanization development strategy. Take the road of green and low-carbon development and achieve the goals of the “dual carbon” strategy.
The western region should strictly control carbon emissions and promote the division of labor and cooperation among provinces with the help of regional cooperation to achieve the optimal combination of resources and reduce carbon emissions [40]. In addition, it is necessary to optimize the regional functional layout, promote the construction of low-carbon cities, and achieve regional carbon balance. As industries in the eastern region move to the central and western regions, the western provinces of Inner Mongolia, Ningxia, and Xinjiang, and the central provinces of Shanxi have high carbon emissions and must strictly control carbon emission intensity. In areas dominated by energy and heavy industry, such as the Qinghai–Tibet Plateau and the Hubao Eyu region, energy structure and utilization efficiency are the main factors affecting carbon emissions. Therefore, it is necessary to focus on optimizing the energy structure and introducing new and high-tech green technologies to promote carbon emission reduction and improve the level of clean carbon utilization [115]. Vigorously develop clean energy, such as hydropower, solar energy, and wind energy. Moreover, steadily promote the reduction in the use of energy with high carbon emission coefficients, such as coal, implement a high carbon tax policy [116], vigorously carry out the construction of new energy infrastructure, and strengthen the control of carbon emissions in key urbanized areas.
In the central regions dominated by light industry and tourism, such as Central China, Anhui River region, Central Plains city cluster, etc., carbon emission reduction should focus on adjusting industrial structure, accelerating the elimination of backward production capacity and equipment in energy-consuming industries [117], enhancing independent innovation capacity, and increasing efforts to cultivate an industrial system with low-carbon as the core. Establish and improve the transformation mechanism of green and low-carbon achievements, establish a service platform for green technology industrialization, create green technology innovation demonstration enterprises and green industry clusters, give full play to the incentive role of government financial funds [118], guide and promote enterprises to realize the accurate docking of innovation chain and industrial chain to give play to the positive externalities of green technology. Agriculture, forestry, and tourism should be vigorously developed with special characteristics to enhance the carbon absorption capacity of natural ecosystems [35].

7.3. Limitations

Although the conclusions and suggestions provide insights, this paper still has some shortcomings that will be addressed in future studies. First, although the article explores the impact mechanisms of financial agglomeration and green technological innovation on carbon emissions from a dual perspective, carbon emissions are essentially a multi-level nested system. Its actual dynamic evolution is influenced not only by factors mentioned in this paper, such as industrial structure, urbanization rate, foreign direct investment levels, environmental regulation, and government intervention, but also by the interaction of multiple factors, including energy consumption structure (e.g., coal dependence), public awareness of environmental protection, and institutional environment (e.g., maturity of carbon trading markets). Second, while the article establishes an indicator system to measure the specific values of variables, this system, though based on the experiences of previous scholars, still carries some subjectivity. For instance, the measurement of financial agglomeration does not differentiate the contributions of traditional finance and green finance; the level of green technological innovation is measured by the number of green patent applications per ten thousand people, but the number of green patents filed does not necessarily reflect the actual application of those patents. This might introduce some errors in measuring the level of green technological innovation. Additionally, the carbon emissions measurement mainly focuses on fossil energy emissions and does not include non-energy emissions. However, financial agglomeration and green technological innovation are beneficial for reducing carbon emissions. Third, due to the limitation of obtaining statistical data, this paper lacks relevant data on Tibet, Hong Kong, Macao, and Taiwan during the research process, so it only conducts research and analysis based on the panel data of 30 provinces and cities in China. At the same time, considering the availability of data, it fails to use the data of prefecture-level cities in the country for research and analysis. As a result, this study does not reveal the carbon reduction effects of financial agglomeration and green technological innovation at the municipal scale, which may affect the implementation of local carbon reduction policies. However, this does not impact the significance of the results, and the findings of this paper remain meaningful. In the future, when municipal-level data become more readily available, spatiotemporal geographic weighted regression (GTWR) can be used to deepen the analysis of spatial heterogeneity across regions in China. Therefore, in future research, these aspects will be considered, and the factors that affect carbon emissions will be studied in more detail. Furthermore, vigorously advancing scientific and technological innovation, promoting artificial intelligence development, and fostering sustainable development constitute contemporary imperatives. In particular, green technological innovation serves as the core driving force for achieving sustainable development goals. Green technological innovation can enhance the pricing efficiency of environmental factors, which in turn strengthens the low-carbon allocation of financial capital, promotes the green upgrade of industries, enhances corporate competitiveness, and drives sustained and healthy economic development. It also effectively reduces environmental pollution, protects ecological balance, and provides strong support for achieving sustainable development goals. Therefore, future work will further explore the role of green technological innovation in sustainable development, as well as strengthen the support of financial agglomeration for green technological innovation, thereby maximizing the leading role of green technological innovation in the sustainable development process.

Author Contributions

Conceptualization, Z.H. and D.T.; methodology, Z.Z.; software, Z.Z.; validation, Z.H., D.T. and Z.Z.; formal analysis, Z.H., Z.Z. and D.T.; investigation, Z.Z., Z.P., M.Z. and H.Z.; resources, Z.P., M.Z. and H.Z.; data curation, Z.H. and Z.Z.; writing—original draft preparation, Z.H., Z.Z. and Z.P.; writing—review and editing, D.T., M.Z. and H.Z.; visualization, M.Z. and H.Z.; supervision, D.T.; project administration, D.T. All authors have read and agreed to the published version of the manuscript.

Funding

This research received no external funding.

Institutional Review Board Statement

Not applicable.

Informed Consent Statement

Not applicable.

Data Availability Statement

Data will be made available on request.

Conflicts of Interest

Authors Meiling Zhao and Hui Zhang were employed by the company Jiangsu Trendy Information Technology Co., Ltd. The remaining authors declare that the research was conducted in the absence of any commercial or financial relationships that could be construed as a potential conflict of interest.

References

  1. Min, X.; Shen, L.; Ren, X. The Role of Clothing Technology in Supporting Sustainable Fashion in the Post-COVID-19 Era. Sustainability 2024, 16, 8287. [Google Scholar] [CrossRef]
  2. Sun, H.; Li, W.; Guo, X.; Wu, Z.; Mao, Z.; Feng, J. How Does Digital Inclusive Finance Affect Agricultural Green Development? Evidence from Thirty Provinces in China. Sustainability 2025, 17, 1449. [Google Scholar] [CrossRef]
  3. Wei, L.; Zeng, B. Research on the Effects of Carbon Emissions from China’s Technology Transfer: Domestic and International Perspectives. Economies 2025, 13, 44. [Google Scholar] [CrossRef]
  4. Nie, J.; Shen, J.; Ren, X. Digital Infrastructure, New Digital Infrastructure, and Urban Carbon Emissions: Evidence from China. Atmosphere 2025, 16, 199. [Google Scholar] [CrossRef]
  5. Do, M.-H.; Huang, Y.-F.; Hoang, T.-T. Blockchain Adoption in Green Supply Chains: Analyzing Key Drivers, Green Innovation, and Expected Benefits. J. Theor. Appl. Electron. Commer. Res. 2025, 20, 39. [Google Scholar] [CrossRef]
  6. Zhang, C.-Y.; Zhao, L.; Zhang, H.; Chen, M.-n.; Fang, R.-y.; Yao, Y.; Zhang, Q.-p.; Wang, Q. Spatial-temporal characteristics of carbon emissions from land use change in Yellow River Delta region, China. Ecol. Indic. 2022, 136, 108623. [Google Scholar] [CrossRef]
  7. Zhang, W.; Liu, X.; Zhao, S.; Tang, T. Does green finance agglomeration improve carbon emission performance in China? A perspective of spatial spillover. Appl. Energy 2024, 358, 122561. [Google Scholar] [CrossRef]
  8. Fang, Z.; Liu, Z. Digital Innovations Driving Urban Sustainability: Key Factors in Reducing Carbon Emissions. Sustainability 2025, 17, 2186. [Google Scholar] [CrossRef]
  9. Liu, X.; Zhang, X. Industrial agglomeration, technological innovation and carbon productivity: Evidence from China. Resour. Conserv. Recycl. 2021, 166, 105330. [Google Scholar] [CrossRef]
  10. Zhang, W.; Li, G.; Guo, F. Does carbon emissions trading promote green technology innovation in China? Appl. Energy 2022, 315, 119012. [Google Scholar] [CrossRef]
  11. Qian, L.; Xu, X.; Sun, Y.; Zhou, Y. Carbon emission reduction effects of eco-industrial park policy in China. Energy 2022, 261, 125315. [Google Scholar] [CrossRef]
  12. Wang, Y.; Su, Z.; Cai, X.; Yu, J. The Dual Carbon Emission Effects of Digital Economy: Evidence from China. Heliyon 2025, 11, e42554. [Google Scholar] [CrossRef] [PubMed]
  13. Liu, J.; Cheng, Z.; Zhang, H. Does industrial agglomeration promote the increase of energy efficiency in China? J. Clean. Prod. 2017, 164, 30–37. [Google Scholar] [CrossRef]
  14. Li, X.; Ma, D. Financial agglomeration, technological innovation, and green total factor energy efficiency. Alex. Eng. J. 2021, 60, 4085–4095. [Google Scholar] [CrossRef]
  15. Liu, L.; Zhang, L.; Li, B.; Wang, Y.; Wang, M. Can financial agglomeration curb carbon emissions reduction from agricultural sector in China? Analyzing the role of industrial structure and digital finance. J. Clean. Prod. 2024, 440, 140862. [Google Scholar] [CrossRef]
  16. Li, S.; Yao, L.; Zhang, Y.; Zhao, Y.; Sun, L. China's provincial carbon emission driving factors analysis and scenario forecasting. Environ. Sustain. Indic. 2024, 22, 100390. [Google Scholar] [CrossRef]
  17. Ding, N.; Guo, P.; Xi, Y.; Zhang, A.; Lei, X. Low-carbon development in power systems based on carbon emission analysis models: A comprehensive review. Sustain. Energy Technol. Assess. 2024, 65, 103774. [Google Scholar] [CrossRef]
  18. Shangguan, D.; Yang, L.; Wang, J.; Li, D.; Li, P.; Zhang, Y.; Zhou, X. Case study on carbon emission of a traditional Chinese medicine pharmaceutical enterprise toward carbon neutrality. J. Clean. Prod. 2024, 450, 141600. [Google Scholar] [CrossRef]
  19. Zhao, L.; Zhang, C.; Wang, Q.; Yang, C.; Suo, X.; Zhang, Q. Climate extremes and land use carbon emissions: Insight from the perspective of sustainable land use in the eastern coast of China. J. Clean. Prod. 2024, 452, 142219. [Google Scholar] [CrossRef]
  20. Ming, L.; Wang, Y.; Chen, X.; Meng, L. Dynamics of urban expansion and form changes impacting carbon emissions in the Guangdong-Hong Kong-Macao Greater Bay Area counties. Heliyon 2024, 10, e29647. [Google Scholar] [CrossRef]
  21. Wang, Z.; Zhu, C. Does Urban Sprawl Lead to Carbon Emission Growth?—Empirical evidence based on the perspective of local land transfer in China. J. Clean. Prod. 2024, 455, 142319. [Google Scholar] [CrossRef]
  22. Farid, S.; Zafar, Q. Impact of Economic Policy Uncertainty on Global Carbon Emissions. Res. Econ. 2024, 78, 100961. [Google Scholar] [CrossRef]
  23. Ahmed, K.; Rehman, M.U.; Ozturk, I. What drives carbon dioxide emissions in the long-run? Evidence from selected South Asian Countries. Renew. Sustain. Energy Rev. 2017, 70, 1142–1153. [Google Scholar] [CrossRef]
  24. Zhang, J.; Lu, H.; Peng, W.; Zhang, L. Analyzing carbon emissions and influencing factors in Chengdu-Chongqing urban agglomeration counties. J. Environ. Sci. 2024, 151, 640–651. [Google Scholar] [CrossRef]
  25. Liao, K.; Liu, J. Digital infrastructure empowerment and urban carbon emissions: Evidence from China. Telecommun. Policy 2024, 48, 102764. [Google Scholar] [CrossRef]
  26. Li, J.; Wang, P.; Ma, S. The impact of different transportation infrastructures on urban carbon emissions: Evidence from China. Energy 2024, 295, 131041. [Google Scholar] [CrossRef]
  27. Lu, J.; Li, H.; Yang, R. Low carbon finance drives corporate carbon emissions reduction: A perspective from issuing carbon neutral bonds. Technol. Forecast. Soc. Chang. 2024, 203, 123404. [Google Scholar] [CrossRef]
  28. Xiao, J.; Chen, S.; Han, J.; Tan, Z.; Mu, S.; Jiayi, W. The carbon emission reduction effect of renewable resource utilization: From the perspective of green innovation. Atmos. Pollut. Res. 2024, 15, 102121. [Google Scholar] [CrossRef]
  29. Feng, X.; Zhao, Y.; Yan, R. Does carbon emission trading policy has emission reduction effect?—An empirical study based on quasi-natural experiment method. J. Environ. Manag. 2024, 351, 119791. [Google Scholar] [CrossRef]
  30. Yang, Q.; Yang, Z.; Chen, Y. The impact of trans-provincial watershed eco-compensation policy on carbon emissions: Evidence from China. Econ. Anal. Policy 2024, 82, 784–802. [Google Scholar] [CrossRef]
  31. Derindag, O.F.; Maydybura, A.; Kalra, A.; Wong, W.-K.; Chang, B.H. Carbon emissions and the rising effect of trade openness and foreign direct investment: Evidence from a threshold regression model. Heliyon 2023, 9, e17448. [Google Scholar] [CrossRef] [PubMed]
  32. Wang, Q.; Zhang, F.; Li, R.; Sun, J. Does artificial intelligence promote energy transition and curb carbon emissions? The role of trade openness. J. Clean. Prod. 2024, 447, 141298. [Google Scholar] [CrossRef]
  33. Tu, C.; Zang, C.; Wu, A.; Long, H.; Yu, C.; Liu, Y. Assessing the impact of industrial intelligence on urban carbon emission performance: Evidence from China. Heliyon 2024, 10, e30144. [Google Scholar] [CrossRef] [PubMed]
  34. Chang, K.; Liu, L.; Luo, D.; Xing, K. The impact of green technology innovation on carbon dioxide emissions: The role of local environmental regulations. J. Environ. Manag. 2023, 340, 117990. [Google Scholar] [CrossRef]
  35. Wang, H.; Qiu, T. The effects of farmer cooperatives on agricultural carbon emissions reduction: Evidence from rural China. J. Clean. Prod. 2024, 450, 141881. [Google Scholar] [CrossRef]
  36. Wang, C.; Liu, P.; Ibrahim, H.; Yuan, R. The temporal and spatial evolution of green finance and carbon emissions in the Pearl River Delta region: An analysis of impact pathways. J. Clean. Prod. 2024, 446, 141428. [Google Scholar] [CrossRef]
  37. Chen, J.; Guo, Z.; Lei, Z. Research on the mechanisms of the digital transformation of manufacturing enterprises for carbon emissions reduction. J. Clean. Prod. 2024, 449, 141817. [Google Scholar] [CrossRef]
  38. Zhang, C.; Fang, J.; Ge, S.; Sun, G. Research on the impact of enterprise digital transformation on carbon emissions in the manufacturing industry. Int. Rev. Econ. Financ. 2024, 92, 211–227. [Google Scholar] [CrossRef]
  39. Tao, M.; Wen, L.; Sheng, M.S.; Yan, Z.J.; Poletti, S. Dynamics between energy intensity and carbon emissions: What does the clustering effect of labor and capital play? J. Clean. Prod. 2024, 452, 142223. [Google Scholar] [CrossRef]
  40. Bai, L.; Guo, T.; Xu, W.; Liu, Y.; Kuang, M.; Jiang, L. Effects of digital economy on carbon emission intensity in Chinese cities: A life-cycle theory and the application of non-linear spatial panel smooth transition threshold model. Energy Policy 2023, 183, 113792. [Google Scholar] [CrossRef]
  41. Cui, S.; Wang, Z. The impact and transmission mechanisms of financial agglomeration on eco-efficiency: Evidence from the organization for economic co-operation and development economies. J. Clean. Prod. 2023, 392, 136219. [Google Scholar] [CrossRef]
  42. Xu, J.; Wang, J.; Wang, T.; Li, C. Impact of industrial agglomeration on carbon emissions from dairy farming—Empirical analysis based on life cycle assessmsent method and spatial durbin model. J. Clean. Prod. 2023, 406, 137081. [Google Scholar] [CrossRef]
  43. Wang, Y.; Yin, S.; Fang, X.; Chen, W. Interaction of economic agglomeration, energy conservation and emission reduction: Evidence from three major urban agglomerations in China. Energy 2022, 241, 122519. [Google Scholar] [CrossRef]
  44. Yu, Q.; Li, M.; Li, Q.; Wang, Y.; Chen, W. Economic agglomeration and emissions reduction: Does high agglomeration in China’s urban clusters lead to higher carbon intensity? Urban Clim. 2022, 43, 101174. [Google Scholar] [CrossRef]
  45. Fan, W.; Wang, F.; Liu, S.; Chen, T.; Bai, X.; Zhang, Y. How does financial and manufacturing co-agglomeration affect environmental pollution? Evidence from China. J. Environ. Manag. 2023, 325, 116544. [Google Scholar] [CrossRef]
  46. Wang, L.; Chen, L. Impacts of digital economy agglomeration on carbon emission: A two-tier stochastic frontier and spatial decomposition analysis of China. Sustain. Cities Soc. 2023, 95, 104624. [Google Scholar] [CrossRef]
  47. Liu, K.; Dong, S.; Han, M. Exploring the impact of green innovation on carbon emission intensity in Chinese metropolitan areas. Ecol. Indic. 2023, 156, 111115. [Google Scholar] [CrossRef]
  48. Tian, Y.; Wang, R.; Liu, L.; Ren, Y. A spatial effect study on financial agglomeration promoting the green development of urban agglomerations. Sustain. Cities Soc. 2021, 70, 102900. [Google Scholar] [CrossRef]
  49. Yan, B.; Wang, F.; Dong, M.; Ren, J.; Liu, J.; Shan, J. How do financial spatial structure and economic agglomeration affect carbon emission intensity? Theory extension and evidence from China. Econ. Model. 2022, 108, 105745. [Google Scholar] [CrossRef]
  50. Yuan, H.; Zhang, T.; Hu, K.; Feng, Y.; Feng, C.; Jia, P. Influences and transmission mechanisms of financial agglomeration on environmental pollution. J. Environ. Manag. 2022, 303, 114136. [Google Scholar] [CrossRef]
  51. Chen, S.; Ding, D.; Shi, G.; Chen, G. Digital economy, industrial structure, and carbon emissions: An empirical study based on a provincial panel data set from China. Chin. J. Popul. Resour. Environ. 2022, 20, 316–323. [Google Scholar] [CrossRef]
  52. Wang, Z.; Sami, F.; Khan, S.; Alamri, A.M.; Zaidan, A.M. Green innovation and low carbon emission in OECD economies: Sustainable energy technology role in carbon neutrality target. Sustain. Energy Technol. Assess. 2023, 59, 103401. [Google Scholar] [CrossRef]
  53. Khattak, S.I.; Ahmad, M.; Haq, Z.U.; Shaofu, G.; Hang, J. On the goals of sustainable production and the conditions of environmental sustainability: Does cyclical innovation in green and sustainable technologies determine carbon dioxide emissions in G-7 economies. Sustain. Prod. Consum. 2022, 29, 406–420. [Google Scholar] [CrossRef]
  54. Kuang, H.; Akmal, Z.; Li, F. Measuring the effects of green technology innovations and renewable energy investment for reducing carbon emissions in China. Renew. Energy 2022, 197, 1–10. [Google Scholar] [CrossRef]
  55. Sun, Y.; Hao, S.; Long, X. A study on the measurement and influencing factors of carbon emissions in China’s construction sector. Build. Environ. 2023, 229, 109912. [Google Scholar] [CrossRef]
  56. Chen, H.; Yi, J.; Chen, A.; Peng, D.; Yang, J. Green technology innovation and CO2 emission in China: Evidence from a spatial-temporal analysis and a nonlinear spatial durbin model. Energy Policy 2023, 172, 113338. [Google Scholar] [CrossRef]
  57. Du, K.; Li, P.; Yan, Z. Do green technology innovations contribute to carbon dioxide emission reduction? Empirical evidence from patent data. Technol. Forecast. Soc. Chang. 2019, 146, 297–303. [Google Scholar] [CrossRef]
  58. Razzaq, A.; Wang, Y.; Chupradit, S.; Suksatan, W.; Shahzad, F. Asymmetric inter-linkages between green technology innovation and consumption-based carbon emissions in BRICS countries using quantile-on-quantile framework. Technol. Soc. 2021, 66, 101656. [Google Scholar] [CrossRef]
  59. Habiba, U.; Xinbang, C.; Anwar, A. Do green technology innovations, financial development, and renewable energy use help to curb carbon emissions? Renew. Energy 2022, 193, 1082–1093. [Google Scholar] [CrossRef]
  60. Meng, Y.; Wu, H.; Wang, Y.; Duan, Y. International trade diversification, green innovation, and consumption-based carbon emissions: The role of renewable energy for sustainable development in BRICST countries. Renew. Energy 2022, 198, 1243–1253. [Google Scholar] [CrossRef]
  61. Li, Y.; Zhang, Y. What is the role of green ICT innovation in lowering carbon emissions in China? A provincial-level analysis. Energy Econ. 2023, 127, 107112. [Google Scholar] [CrossRef]
  62. Fang, G.; Gao, Z.; Wang, L.; Tian, L. How does green innovation drive urban carbon emission efficiency? —Evidence from the Yangtze River Economic Belt. J. Clean. Prod. 2022, 375, 134196. [Google Scholar] [CrossRef]
  63. Lin, B.; Ma, R. Green technology innovations, urban innovation environment and CO2 emission reduction in China: Fresh evidence from a partially linear functional-coefficient panel model. Technol. Forecast. Soc. Chang. 2022, 176, 121434. [Google Scholar] [CrossRef]
  64. Xu, L.; Fan, M.; Yang, L.; Shao, S. Heterogeneous green innovations and carbon emission performance: Evidence at China’s city level. Energy Econ. 2021, 99, 105269. [Google Scholar] [CrossRef]
  65. Wu, F.; Yang, X.; Chen, Y. Research on innovative mechanisms of financial agglomeration enabling green coordinated development in the Yangtze River Delta of China. Heliyon 2023, 9, e14172. [Google Scholar] [CrossRef]
  66. Chen, Y.; Zhao, C.; Chen, S.; Chen, W.; Wan, K.; Wei, J. Riding the green rails: Exploring the nexus between high-speed trains, green innovation, and carbon emissions. Energy 2023, 282, 128955. [Google Scholar] [CrossRef]
  67. Cao, J.; Law, S.H.; Bin Abdul Samad, A.R.; Binti, W.; Mohamad, W.N.; Wang, J.; Yang, X. Effect of financial development and technological innovation on green growth—Analysis based on spatial Durbin model. J. Clean. Prod. 2022, 365, 132865. [Google Scholar] [CrossRef]
  68. Xie, R.; Fu, W.; Yao, S.; Zhang, Q. Effects of financial agglomeration on green total factor productivity in Chinese cities: Insights from an empirical spatial Durbin model. Energy Econ. 2021, 101, 105449. [Google Scholar] [CrossRef]
  69. Zhang, M.; Liu, Y. Influence of digital finance and green technology innovation on China’s carbon emission efficiency: Empirical analysis based on spatial metrology. Sci. Total Environ. 2022, 838, 156463. [Google Scholar] [CrossRef]
  70. Cheng, Y.; Lv, K.; Zhu, S. How does digital financial inclusion promote green total factor productivity in China? An empirical analysis from the perspectives of innovation and entrepreneurship. Process Saf. Environ. Prot. 2023, 174, 403–413. [Google Scholar] [CrossRef]
  71. Lee, C.-C.; Wang, C.-s.; He, Z.; Xing, W.-w.; Wang, K. How does green finance affect energy efficiency? The role of green technology innovation and energy structure. Renew. Energy 2023, 219, 119417. [Google Scholar] [CrossRef]
  72. Yu, H.; Wang, J.; Xu, J. Assessing the role of digital economy agglomeration in energy conservation and emission reduction: Evidence from China. Energy 2023, 284, 128667. [Google Scholar] [CrossRef]
  73. Ozkan, O.; Sharif, A.; Mey, L.S.; Tiwari, S. The dynamic role of green technological innovation, financial development and trade openness on urban environmental degradation in China: Fresh insights from carbon efficiency. Urban Clim. 2023, 52, 101679. [Google Scholar] [CrossRef]
  74. Chu, S.; Chen, L.; Liu, Y. Does industrial agglomeration curb corporate carbon emissions? A perspective of financial constraints. Int. Rev. Econ. Financ. 2024, 96, 103673. [Google Scholar] [CrossRef]
  75. Zhao, B.; Lv, L.; Luo, X.; Huang, X. The Impact of Multidimensional Relational Network Embedding on the Carbon Emission Reductions of Manufacturing Enterprises: From the Mediating and Regulating Roles of Technological Innovation. Sustainability 2025, 17, 1655. [Google Scholar] [CrossRef]
  76. Li, W.; Wang, W.; Wang, Y.; Qin, Y. Industrial structure, technological progress and CO2 emissions in China: Analysis based on the STIRPAT framework. Nat. Hazards 2017, 88, 1545–1564. [Google Scholar] [CrossRef]
  77. Chen, M.; Wang, K. The combining and cooperative effects of carbon price and technological innovation on carbon emission reduction: Evidence from China's industrial enterprises. J. Environ. Manag. 2023, 343, 118188. [Google Scholar] [CrossRef]
  78. Peng, D.; Li, R.; Shen, C.; Wong, Z. Industrial agglomeration, urban characteristics, and economic growth quality: The case of knowledge-intensive business services. Int. Rev. Econ. Financ. 2022, 81, 18–28. [Google Scholar] [CrossRef]
  79. Qu, C.; Shao, J.; Shi, Z. Does financial agglomeration promote the increase of energy efficiency in China? Energy Policy 2020, 146, 111810. [Google Scholar] [CrossRef]
  80. Wang, Y.; Bai, Y.; Quan, T.; Ran, R.; Hua, L. Influence and effect of industrial agglomeration on urban green total factor productivity—On the regulatory role of innovation agglomeration and institutional distance. Econ. Anal. Policy 2023, 78, 1158–1173. [Google Scholar] [CrossRef]
  81. Zhang, L.; He, X.; Jia, Z. Industrial agglomeration, public services and city size: Evidence from 286 cities in China. Land Use Policy 2023, 131, 106758. [Google Scholar] [CrossRef]
  82. Hara, K.; Kuroda, M.; Yabar, H.; Kimura, M.; Uwasu, M. Historical development of wastewater and sewage sludge treatment technologies in Japan—An analysis of patent data from the past 50 years. Environ. Dev. 2016, 19, 59–69. [Google Scholar] [CrossRef]
  83. Zheng, Y.; Zhang, Q. Digital transformation, corporate social responsibility and green technology innovation- based on empirical evidence of listed companies in China. J. Clean. Prod. 2023, 424, 138805. [Google Scholar] [CrossRef]
  84. Zhang, W.; Zhang, S.; Chen, F.; Wang, Y.; Zhang, Y. Does Chinese companies' OFDI enhance their own green technology innovation? Financ. Res. Lett. 2023, 56, 104113. [Google Scholar] [CrossRef]
  85. Yabar, H.; Uwasu, M.; Hara, K. Tracking environmental innovations and policy regulations in Japan: Case studies on dioxin emissions and electric home appliances recycling. J. Clean. Prod. 2013, 44, 152–158. [Google Scholar] [CrossRef]
  86. Singh, R.K.; Yabar, H.; Nozaki, N.; Niraula, B.; Mizunoya, T. Comparative study of linkage between environmental policy instruments and technological innovation: Case study on end-of-life vehicles technologies in Japan and EU. Waste Manag. 2017, 66, 114–122. [Google Scholar] [CrossRef]
  87. Bai, C.; Feng, C.; Yan, H.; Yi, X.; Chen, Z.; Wei, W. Will income inequality influence the abatement effect of renewable energy technological innovation on carbon dioxide emissions? J. Environ. Manag. 2020, 264, 110482. [Google Scholar] [CrossRef]
  88. Zhao, P.; Zeng, L.; Li, P.; Lu, H.; Hu, H.; Li, C.; Zheng, M.; Li, H.; Yu, Z.; Yuan, D.; et al. China’s transportation sector carbon dioxide emissions efficiency and its influencing factors based on the EBM DEA model with undesirable outputs and spatial Durbin model. Energy 2022, 238, 121934. [Google Scholar] [CrossRef]
  89. Hu, J.; Chen, H.; Dinis, F.; Xiang, G. Nexus among green finance, technological innovation, green fiscal policy and CO2 emissions: A conditional process analysis. Ecol. Indic. 2023, 154, 110706. [Google Scholar] [CrossRef]
  90. Shi, X.; Li, X. Research on three-stage dynamic relationship between carbon emission and urbanization rate in different city groups. Ecol. Indic. 2018, 91, 195–202. [Google Scholar] [CrossRef]
  91. Malik, M.Y.; Latif, K.; Khan, Z.; Butt, H.D.; Hussain, M.; Nadeem, M.A. Symmetric and asymmetric impact of oil price, FDI and economic growth on carbon emission in Pakistan: Evidence from ARDL and non-linear ARDL approach. Sci. Total Environ. 2020, 726, 138421. [Google Scholar] [CrossRef] [PubMed]
  92. Hu, W.; Wang, D. How does environmental regulation influence China’s carbon productivity? An empirical analysis based on the spatial spillover effect. J. Clean. Prod. 2020, 257, 120484. [Google Scholar] [CrossRef]
  93. Tang, D.; Li, J.; Zhao, Z.; Boamah, V.; Lansana, D.D. The influence of industrial structure transformation on urban resilience based on 110 prefecture-level cities in the Yangtze River. Sustain. Cities Soc. 2023, 96, 104621. [Google Scholar] [CrossRef]
  94. Wojewodzki, M.; Wei, Y.; Cheong, T.S.; Shi, X. Urbanisation, agriculture and convergence of carbon emissions nexus: Global distribution dynamics analysis. J. Clean. Prod. 2023, 385, 135697. [Google Scholar] [CrossRef]
  95. Zheng, H.; He, Y. How does industrial co-agglomeration affect high-quality economic development? Evidence from Chengdu-Chongqing Economic Circle in China. J. Clean. Prod. 2022, 371, 133485. [Google Scholar] [CrossRef]
  96. Mehmood, S.; Zaman, K.; Khan, S.; Ali, Z.; Khan, H.U.R. The role of green industrial transformation in mitigating carbon emissions: Exploring the channels of technological innovation and environmental regulation. Energy Built Environ. 2023, 5, 464–479. [Google Scholar] [CrossRef]
  97. Wang, F.; Wang, R.; He, Z. The impact of environmental pollution and green finance on the high-quality development of energy based on spatial Dubin model. Resour. Policy 2021, 74, 102451. [Google Scholar] [CrossRef]
  98. Hou, S.; Yu, K.; Fei, R. How does environmental regulation affect carbon productivity? The role of green technology progress and pollution transfer. J. Environ. Manag. 2023, 345, 118587. [Google Scholar] [CrossRef]
  99. Zhu, Q.; Xu, C.; Chen, Q.; Wu, L. Oil price distortion and its impact on green economic efficiency in China’s transportation: A spatial effect perspective. Renew. Sustain. Energy Rev. 2024, 191, 114148. [Google Scholar] [CrossRef]
  100. Rong, J.; Hong, J.; Guo, Q.; Fang, Z.; Chen, S. Path mechanism and spatial spillover effect of green technology innovation on agricultural CO2 emission intensity: A case study in Jiangsu Province, China. Ecol. Indic. 2023, 157, 111147. [Google Scholar] [CrossRef]
  101. Wang, B.-Q.; Yang, B.; Yang, H.-C.; Wang, J.-Y.; Hu, S.; Gao, Y.-S.; Bu, X.-Y. MicroRNA-499a decelerates glioma cell proliferation while accelerating apoptosis through the suppression of Notch1 and the MAPK signaling pathway. Brain Res. Bull. 2018, 142, 96–106. [Google Scholar] [CrossRef]
  102. Elhorst, J.P. Applied Spatial Econometrics: Raising the Bar. Spat. Econ. Anal. 2010, 5, 9–28. [Google Scholar] [CrossRef]
  103. Li, C.J.; Razzaq, A.; Irfan, M.; Luqman, A. Green innovation, environmental governance and green investment in China: Exploring the intrinsic mechanisms under the framework of COP26. Technol. Forecast. Soc. Chang. 2023, 194, 122708. [Google Scholar] [CrossRef]
  104. Wan, J.; Li, C.; Yang, Z.; Wu, L.; Yue, M. Dynamic spatial spillover effects of financial agglomeration on CO2 emissions: The case of China. Humanit. Soc. Sci. Commun. 2025, 12, 178. [Google Scholar] [CrossRef]
  105. Zhao, Y.; Duan, X.; Yu, M. Calculating carbon emissions and selecting carbon peak scheme for infrastructure construction in Liaoning Province, China. J. Clean. Prod. 2023, 420, 138396. [Google Scholar] [CrossRef]
  106. Di, K.; Chen, W.; Zhang, X.; Shi, Q.; Cai, Q.; Li, D.; Liu, C.; Di, Z. Regional unevenness and synergy of carbon emission reduction in China's green low-carbon circular economy. J. Clean. Prod. 2023, 420, 138436. [Google Scholar] [CrossRef]
  107. Lu, J.; Yang, R.; Chen, B.; Zhang, Y. Variation, Determinants and prediction of carbon emissions in Guizhou, a new economic growth pole in southwest China. J. Clean. Prod. 2023, 417, 138049. [Google Scholar] [CrossRef]
  108. Che, S.; Wang, J.; Chen, H. Can China’s decentralized energy governance reduce carbon emissions? Evidence from new energy demonstration cities. Energy 2023, 284, 128665. [Google Scholar] [CrossRef]
  109. Zhang, W.; Zeng, M.; Zhang, Y.; Su, C.-W. Reducing carbon emissions: Can high-speed railway contribute? J. Clean. Prod. 2023, 413, 137524. [Google Scholar] [CrossRef]
  110. Yabar, H.; Hara, K.; Uwasu, M. Comparative assessment of the co-evolution of environmental indicator systems in Japan and China. Resour. Conserv. Recycl. 2012, 61, 43–51. [Google Scholar] [CrossRef]
  111. Wu, H.; Yabar, H. Impacts of additive manufacturing to sustainable urban—Rural interdependence through strategic control. Results Control. Optim. 2021, 5, 100066. [Google Scholar] [CrossRef]
  112. Zhou, Q.; Yabar, H.; Mizunoya, T.; Higano, Y. Exploring the potential of introducing technology innovation and regulations in the energy sector in China: A regional dynamic evaluation model. J. Clean. Prod. 2016, 112, 1537–1548. [Google Scholar] [CrossRef]
  113. Liao, T.; Yan, J.; Zhang, Q. The impact of green technology innovation on carbon emission efficiency: The intermediary role of intellectual capital. Int. Rev. Econ. Financ. 2024, 92, 520–532. [Google Scholar] [CrossRef]
  114. Zhang, R.; Wu, K.; Cao, Y.; Sun, H. Digital inclusive finance and consumption-based embodied carbon emissions: A dual perspective of consumption and industry upgrading. J. Environ. Manag. 2023, 325, 116632. [Google Scholar] [CrossRef] [PubMed]
  115. Wu, L.; Sun, L.; Qi, P.; Ren, X.; Sun, X. Energy endowment, industrial structure upgrading, and CO2 emissions in China: Revisiting resource curse in the context of carbon emissions. Resour. Policy 2021, 74, 102329. [Google Scholar] [CrossRef]
  116. Li, Z.; Dai, H.; Sun, L.; Xie, Y.; Liu, Z.; Wang, P.; Yabar, H. Exploring the impacts of regional unbalanced carbon tax on CO2 emissions and industrial competitiveness in Liaoning province of China. Energy Policy 2018, 113, 9–19. [Google Scholar] [CrossRef]
  117. Guo, Y.; Tong, Z.; Chen, H.; Wang, Z.; Yao, Y. Heterogeneity study on mechanisms influencing carbon emission intensity at the county level in the Yangtze River Delta urban Agglomeration: A perspective on main functional areas. Ecol. Indic. 2024, 159, 111597. [Google Scholar] [CrossRef]
  118. Yu, H.; Wang, J.; Hou, J.; Yu, B.; Pan, Y. The effect of economic growth pressure on green technology innovation: Do environmental regulation, government support, and financial development matter? J. Environ. Manag. 2023, 330, 117172. [Google Scholar] [CrossRef]
Figure 1. Financial agglomeration level.
Sustainability 17 02746 g001
Figure 2. Green technological innovation level.
Sustainability 17 02746 g002
Figure 3. Total number of green patent applications in China from 2011 to 2020.
Sustainability 17 02746 g003
Figure 4. Ratio of green patent applications to total patent applications.
Sustainability 17 02746 g004
Figure 5. Carbon emission level.
Sustainability 17 02746 g005
Figure 6. Local Moran scatter plots.
Sustainability 17 02746 g006
Table 1. Carbon emission coefficients.
Energy TypeAverage Low Calorific ValueCarbon Content per Unit Calorific ValueCarbon Oxidation RateCarbon Emission Coefficient
Coal20,908 kJ/kg26.37 tC/TJ0.941.9003 kgCO2/kg
Coke28,435 kJ/kg29.5 tC/TJ0.932.8604 kgCO2/kg
Crude oil41,816 kJ/kg20.1 tC/TJ0.983.0202 kgCO2/kg
Gasoline43,070 kJ/kg18.9 tC/TJ0.982.9251 kgCO2/kg
Kerosene43,070 kJ/kg19.5 tC/TJ0.983.0179 kgCO2/kg
Diesel oil42,652 kJ/kg20.2 tC/TJ0.983.0959 kgCO2/kg
Fuel oil41,816 kJ/kg21.1 tC/TJ0.983.1705 kgCO2/kg
Natural gas38,931 kJ/m315.3 tC/TJ0.992.1622 kgCO2/m3
Table 2. Control variables.
Control VariablesCalculation Formula
a1Tertiary Industry added value/Secondary Industry added value [89,93]
a2Urban population/Total population [94]
a3FDI/Gross domestic product [95,96]
a4Amount of industrial environmental pollution control/Industrial added value
a5Government expenditure/GDP
Table 3. Descriptive statistics.
VariablesObsMeanStd. Dev.MinMax
TC30011.078.023.7243.60
AGG3001.010.440.392.74
GTECH3000.92071.1690.047.50
a13001.220.700.525.30
a23000.590.120.350.90
a33000.020.020.000.12
a43000.400.330.000.03
a53000.250.100.110.64
Table 4. Hausman test.
VariablesFixed Effect
(b)
Random Effect
(B)
Difference Value
(b-B)
Sqrt (diag (V_b-V_B)
S.E.
AGG−1.3102−1.39240.08220.2047
GTECH−0.8659−0.6757−0.19020.2705
a1−1.5961−1.0767−0.51930.6015
a2−7.695512.5717−20.267211.5700
a31.7298−7.86659.59633.2566
a4−1.3687−0.3043−1.06450.1185
a5−0.3210−0.66280.34180.3910
chi2(8)87.77
Prob>chi20.0000
Table 5. Results of panel regression model.
VariablesModel
AGG−1.3102 *
(−1.9328)
GTECH−0.8659 ***
(−2.5965)
a1−1.5961 **
(−2.0761)
a2−7.6955
(−0.7111)
a31.7298
(0.1763)
a4−1.3687 ***
(−2.7773)
a5−0.3210
(−0.1857)
Constant20.2722 ***
(2.8390)
adj. R20.961
F-value132.21
Note: ***, **, and * denote significance at the 1%, 5%, and 10% levels, respectively; the t statistical value of each variable coefficient is in parentheses.
Table 6. Robustness test of baseline regression.
VariablesModel
L.AGG−2.2767 **
(−2.2467)
L.GTECH−0.9195 ***
(−2.9262)
L.a1−0.3325
(−0.4301)
L.a216.0197 ***
(−2.6248)
L.a3−11.5456
(−1.0060)
L.a40.9362
(−1.6207)
L.a5−3.1114
(−1.4479)
Constant5.6456 *
(−1.7371)
Note: ***, **, and * denote significance at the levels of 1%, 5%, and 10%, respectively; the t statistical value of each variable coefficient is in parentheses.
Table 7. Global Moran’s I for carbon emission levels.
YearsMoran’s Iz-Valuep-Value
20110.202 ***2.6410.008
20120.203 ***2.6410.008
20130.200 ***2.5830.010
20140.198 ***2.5690.010
20150.188 **2.4590.014
20160.186 **2.4330.015
20170.174 **2.3180.020
20180.178 **2.3910.017
20190.169 **2.3020.021
20200.171 **2.3080.021
Note: *** and ** denote significance at the 1% and 5% levels, respectively.
Table 8. LM test.
Table 8. LM test.
SEMSAR
LM11.592 ***38.514 ***
Robust LM0.06426.986 ***
Note: *** denotes significance at the 1% level.
Table 9. Results of the Hausman test.
VariableFixed Effect
(b)
Random Effect
(B)
Difference Value
(b-B)
Sqrt (diag(V_b-V_B))
S.E.
AGG−1.44−1.580.14
GTECH−0.87−0.42−0.450.20
a1−1.69−0.57−1.120.49
a2−9.4514.02−23.479.25
a31.47−7.839.301.32
a4−1.38−1.02−0.360.11
a5−0.230.17−0.400.87
chi2(7)17.18
Prob>chi20.0163
Table 10. Results of SAR.
Double Fixed ModelIndividual Fixed ModelTime-Fixed Model
AGG−1.4439 **
(−2.3334)
−1.5073 **
(−2.4469)
−4.5229 ***
(−3.5608)
GTECH−0.8735 ***
(−2.8814)
−0.3827 *
(−1.7984)
−2.3560 ***
(−4.7121)
a1−1.6938 **
(−2.4195)
−0.5086
(−1.0677)
−1.1802
(−1.6291)
a2−9.4575
(−0.9586)
13.4607 ***
(3.9933)
49.8849 ***
(10.5621)
a31.4756
(0.1654)
−6.3465
(−0.7516)
−48.0730 **
(−2.5500)
a4−1.3804 ***
(−3.0810)
−1.1981 ***
(−2.9243)
15.2354 ***
(15.1152)
a5−0.2397
(−0.1525)
0.1692
(0.1356)
−3.4582
(−1.0082)
ρ 0.3878 **
(2.3710)
0.4688 ***
(3.5024)
0.6507 ***
(6.6915)
Error term2.0985 ***
(12.1579)
2.1420 ***
(12.1468)
26.3012 ***
(12.0480)
Log-likelihood−538.2895−542.2693−921.4120
Province YesYesNo
Year YesNoYes
N300300300
Note: ***, **, and * denote significance at the 1%, 5%, and 10% levels, respectively; the Z-statistical value of each variable coefficient is in parentheses.
Table 11. Robustness test of spatial regression.
Double Fixed ModelIndividual Fixed ModelTime-Fixed Model
AGG−1.5836 **
(−2.4610)
−1.6748 ***
(−2.6443)
−4.3378 ***
(−3.5830)
GTECH−0.7594 **
(−2.5023)
−0.4484 **
(−2.0684)
−2.2706 ***
(−4.8095)
a1−1.0192
(−1.3792)
−0.3696
(−0.6923)
−1.7620 **
(−2.4875)
a21.9589
(0.2156)
14.1847 ***
(−3.9957)
52.2227 ***
(−11.7393)
a3−1.8639
(−0.2084)
−6.4276
(−0.7587)
−45.9669 **
(−2.5578)
a4−0.7375
(−1.2872)
−0.7271
(−1.4215)
19.5229 ***
(−17.1973)
a5−0.0776
(−0.0495)
0.2869
(−0.2328)
−3.0569
(−0.9513)
ρ 0.3479 **
(2.0327)
0.4522 ***
(−3.3082)
0.6312 ***
(−6.3028)
Error term2.0330 ***
(12.1667)
2.0445 ***
(−12.1547)
22.8319 ***
(−12.0647)
Log-likelihood−533.1147−535.0878−899.7331
Province YesYesNo
Year YesNoYes
N300300300
Note: *** and ** denote significance at the 1% and 5% levels, respectively; the Z-statistical value of each variable coefficient is in parentheses.
Table 12. Heterogeneity analysis results.
Eastern RegionCentral RegionWestern Region
AGG−0.1662
(−0.5302)
−4.8292 ***
(−4.9839)
−5.1368 ***
(−3.3219)
GTECH−0.3658 ***
(−2.7464)
−3.9287 ***
(−2.7943)
9.2982 ***
(5.2176)
a1−0.3696
(−1.1277)
−1.6188 *
(−1.7643)
−2.1573
(−1.1901)
a29.4964 **
(2.0306)
−18.0909
(−1.0435)
−1.5 × 10² ***
(−6.2302)
a3−2.2369
(−0.6358)
−35.5389
(−1.2332)
107.1801 **
(2.4160)
a40.1983
(0.6173)
0.9292
(0.6295)
−1.5878 ***
(−2.6423)
a50.8827
(0.9122)
−0.1392
(−0.0659)
6.7678 **
(2.4101)
ρ −0.7350 ***
(−2.8883)
−0.9296 ***
(−4.5801)
0.2470
(1.2161)
Error term0.2050 ***
(7.2989)
0.7646 ***
(5.5917)
2.3700 ***
(7.4120)
Log-likelihood−70.3419−109.5234−204.3413
ProvinceYesYesYes
YearYesYesYes
N11080110
Note: ***, **, and * denote significance at the 1%, 5%, and 10% levels, respectively; the Z-statistical value of each variable coefficient is in parentheses.
Disclaimer/Publisher’s Note: The statements, opinions and data contained in all publications are solely those of the individual author(s) and contributor(s) and not of MDPI and/or the editor(s). MDPI and/or the editor(s) disclaim responsibility for any injury to people or property resulting from any ideas, methods, instructions or products referred to in the content.

