Article

Reducing Carbon Emissions: A Multi-Objective Approach to the Hydropower Operation of Mega Reservoirs

1
State Key Laboratory of Water Resources Engineering and Management, Wuhan University, Wuhan 430072, China
2
Bureau of Hydrology, Changjiang Water Resources Commission, Wuhan 430010, China
3
Department of Bioenvironmental Systems Engineering, National Taiwan University, Taipei 10617, Taiwan
4
Department of Geosciences, University of Oslo, P.O. Box 1047, N-0316 Oslo, Norway
*
Authors to whom correspondence should be addressed.
Sustainability 2025, 17(6), 2770; https://doi.org/10.3390/su17062770
Submission received: 17 January 2025 / Revised: 14 March 2025 / Accepted: 18 March 2025 / Published: 20 March 2025
(This article belongs to the Section Sustainable Management)

Abstract

:
Optimizing the joint drawdown operation of mega reservoirs presents a significant opportunity to enhance the comprehensive benefits among hydropower output, water release, and carbon emission reduction. However, achieving the complementary drawdown operation of mega reservoirs while considering reservoir carbon emissions poses a notable challenge. In this context, this study introduces an innovative multi-objective optimization framework tailored for the joint drawdown operation of mega reservoirs. Firstly, a multi-objective optimization model, leveraging an intelligent evolutionary algorithm, is developed to minimize reservoir carbon emissions (Objective 1), maximize hydropower output (Objective 2), and maximize water release (Objective 3). Subsequently, a multi-criteria decision-making approach to search for the optimal scheme is employed. The proposed framework is applied to seven mega reservoirs within the Hanjiang River basin, China. The results show that the framework is effective in promoting comprehensive benefits, improving hydropower production by 8.3%, reservoir carbon emission reduction by 5.6%, and water release by 6.2% from the optimal solution under wet scenarios, compared to standard operation policies. This study not only provides a fresh perspective on the multi-objective drawdown operation of mega reservoirs but also offers valuable support to stakeholders and decision-makers in formulating viable strategic recommendations that take potential carbon emissions and advantages into account.

1. Introduction

China stands as a significant contributor to global greenhouse gas (GHG) emissions, with its electricity sector representing a substantial portion of this output. According to a report published by the International Energy Agency (IEA) in 2021, China is the world’s largest energy consumer and carbon emitter, accounting for one-third of the global total carbon dioxide emissions [1]. In a pivotal move toward sustainability, the Chinese government unveiled ambitious targets in 2020, endeavoring to achieve carbon dioxide emission peaks before 2030 and become carbon neutral by 2060, thereby advocating a shift toward green and low-carbon development strategies. Notably, China’s electricity generation predominantly relies on coal-fired, photovoltaic, wind, and conventional hydropower sources. Against the backdrop of transitioning toward a low-carbon electricity system, there has been a notable surge in the installed capacity of non-fossil fuels, particularly conventional hydropower, in recent years [1,2]. At the beginning of 2023, China’s conventional hydropower generation had reached an installed capacity of 370 gigawatts (GW), constituting 14.3% of the nation’s total installed capacity and accounting for 15% of the nation’s total power output at 1.31 million GW·h [3]. This substantial expansion in hydropower plant development amplifies the proportion of non-fossil fuel-based electricity generation and underscores the pressing need for initiatives to reduce reservoir carbon emissions.
Optimizing the drawdown operation of reservoirs represents a crucial non-engineering strategy aimed at enhancing comprehensive benefits among water supply, hydropower generation, and ecological preservation. Paredes and Lund [4] established a refill-drawdown operation model of reservoirs to comprehensively optimize water quantity and quality objectives. Eum et al. [5] established a sampling stochastic dynamic programming model to formulate hedging rules to achieve the optimal drought management of reservoirs during the drawdown period. Isaac and Eldho [6] applied the hydraulic model to improve the sediment scouring of reservoirs in the drawdown period. Beshavard et al. [7] derived optimal reservoir operation rules for irrigation in the drawdown period of a drought by integrating simulation and optimization operation models. Jurevicius et al. [8] analyzed the fish spawning condition of the Kaunas hydropower station during the drawdown period and proposed suggestions for improving fish spawning habitats and hydropower generation. Lin et al. [9] proposed a seasonal drought-limited water level (DLWL) operation framework for simultaneously improving hydropower generation and mitigating drought defense pressure. However, despite these efforts, there has been a notable gap in considering carbon emission reduction in drawdown operations [10,11]. Reservoir carbon emissions during drawdown periods significantly contribute to the annual volume due to the expansion of water level drawdown areas resulting from reductions in water levels. Consequently, reducing carbon emissions in reservoirs during drawdown periods is imperative and cannot be overlooked.
In recent years, as concerns regarding climate change have escalated, the GHG emissions associated with reservoirs have garnered significant attention [12,13,14,15]. Fearnside’s assertion equating reservoir GHG emissions to those of thermal power plants has sparked debates over the cleanliness of hydroelectricity [16]. Numerous studies have delved into experiments examining reservoir carbon emissions from various perspectives, including emission pathways and spatiotemporal characteristics [17,18,19,20]. Indeed, a growing body of research suggests reservoirs serve as notable sources of GHG emissions [21,22,23]. Carbon dioxide, nitrous oxide, and methane emerge as predominant GHGs, with reservoir impoundment leading to carbon dioxide decomposition and release, nitrification and denitrification processes causing nitrous oxide emissions, and methanogenic bacteria generating methane in anaerobic environments [24]. Reservoirs’ GHG emissions occur through four primary pathways: water–air interface diffusion, soil–air interface diffusion in drawdown areas, bubble-mediated gas exchange, and degassing from spillways and turbines [10], with the former two representing the primary mechanisms [25,26,27]. Scholars have utilized carbon flux data to estimate reservoirs’ global carbon emissions, with Deemer et al. [28] pioneering such efforts by linking carbon emission flux to reservoir surface areas. Interestingly, they found distinct carbon emission patterns between drawdown areas and surface areas, with higher carbon dioxide emissions flux observed in drawdown areas. Addressing this phenomenon, Keller et al. [29] re-estimated the carbon emissions of global reservoirs, highlighting water level management as a key strategy for mitigating reservoir carbon emissions. To date, various models incorporating different variables have been proposed for estimating reservoir carbon emissions. However, due to limitations in the availability of carbon emission monitoring data, this study adopts the product of carbon flux and surface area to calculate reservoir carbon emissions.
Artificial intelligence techniques, including the non-dominated sorting genetic algorithm-II (NSGA-II), differential evolution, and particle swarm optimization, are commonly applied to tackle the multi-objective joint management of cascade reservoirs. These algorithms effectively navigate the objective function space, generating a set of diverse Pareto-optimal solutions to offer decision-makers a spectrum of operation alternatives [30]. However, these alternatives yield varying performance levels across multiple objectives, necessitating multi-criteria decision analysis methods for selecting the most beneficial alternative. Multi-criteria decision analysis encompasses a range of analytical techniques designed to tackle intricate decision-making problems involving various criteria. Common approaches include the technique for order preference by similarity to an ideal solution, the Vlse Kriterijumska Optimizacija-kompromisno Resenje (VIKOR), the analytic hierarchy process, and fuzzy comprehensive evaluation. Each method possesses unique characteristics tailored to different decision-making problems, enabling decision-makers to assess trade-offs among alternatives and make informed choices [31]. When optimization involves three objectives (e.g., hydropower generation, water release, and carbon reduction), standard operation policy-based or system dynamics-based simulation and bi-objective intelligent optimization technologies are common approaches [32]. Typically, simulation and bi-objective intelligent optimization technologies transform a tri-objective optimization task into several sub-optimization tasks with either one objective or two objectives rather than directly addressing the tri-objective intelligent optimization operation.
Previous studies have predominantly focused on the emission characteristics, spatiotemporal distribution, and environmental influential factors of reservoir greenhouse gases while little attention has been given to assessing emissions from the perspective of reservoir operation. To address this research gap, we propose an innovative multi-objective optimization framework tailored for the joint drawdown operation of mega reservoirs, relying upon three key aspects. Firstly, we develop a drawdown operation model utilizing NSGA-II to efficiently minimize reservoir surface carbon emissions, maximize hydropower output, and maximize water release (tri-objective optimization), thereby enhancing comprehensive benefits among reservoir carbon, energy, and water. Secondly, we employ a multi-criteria decision-making method to determine optimal joint drawdown operation schemes across variable hydrological scenarios. Lastly, we rigorously evaluate these optimal schemes using criteria related to hydropower production, water release, and carbon emission reduction. The seven mega reservoirs (with regulation capacity over 100 million m3) within China’s Hanjiang River basin form a case study. This holistic framework aims to boost comprehensive benefits and provide decision-makers and stakeholders with well-informed strategies for reservoirs’ joint drawdown operation, meeting the sustainability goals of water and hydropower.

2. Study Area and Materials

2.1. Study Area

The Hanjiang River, stretching 1577 km long and covering 15.9 × 10⁴ km2 in basin size, stands as the longest tributary of China’s Yangtze River. Characterized by a subtropical monsoon climate, this river basin exhibits an average annual temperature of 15 °C and precipitation of 700–1100 mm [33]. Its main stem winds through Shaanxi and Hubei Provinces, and its tributaries extend into Gansu, Sichuan, and Chongqing Provinces. Serving as an important water source, the Hanjiang River makes significant contributions to promoting basin-wide economic development. The Hanjiang River basin features a higher elevation in the west and a lower elevation in the east, with medium and low mountains dominating the western region and hills and plains characterizing the eastern region [34]. Several reservoirs have been built for flood prevention, hydropower production, and water supply throughout the river basin. This study focuses on seven reservoirs within the basin, i.e., Shiquan (SQ), Ankang (AK), Pankou (PK), Huanglongtan (HLT), Danjiangkou (DJK), Yahekou (YHK), and Sanliping (SLP) Reservoirs (as shown in Figure 1). The largest water project within the Hanjiang River basin is the Danjiangkou Reservoir, catering to comprehensive water resource utilization and serving as a key source for the South-to-North Water Diversion Project (SNWDP). The SNWDP facilitates an average annual water transfer volume of 95 × 108 m3, with a designed water transfer flow ranging between 350 and 400 m3/s. The key attributes of reservoirs within the Hanjiang River basin are outlined in Table 1.

2.2. Data Collection

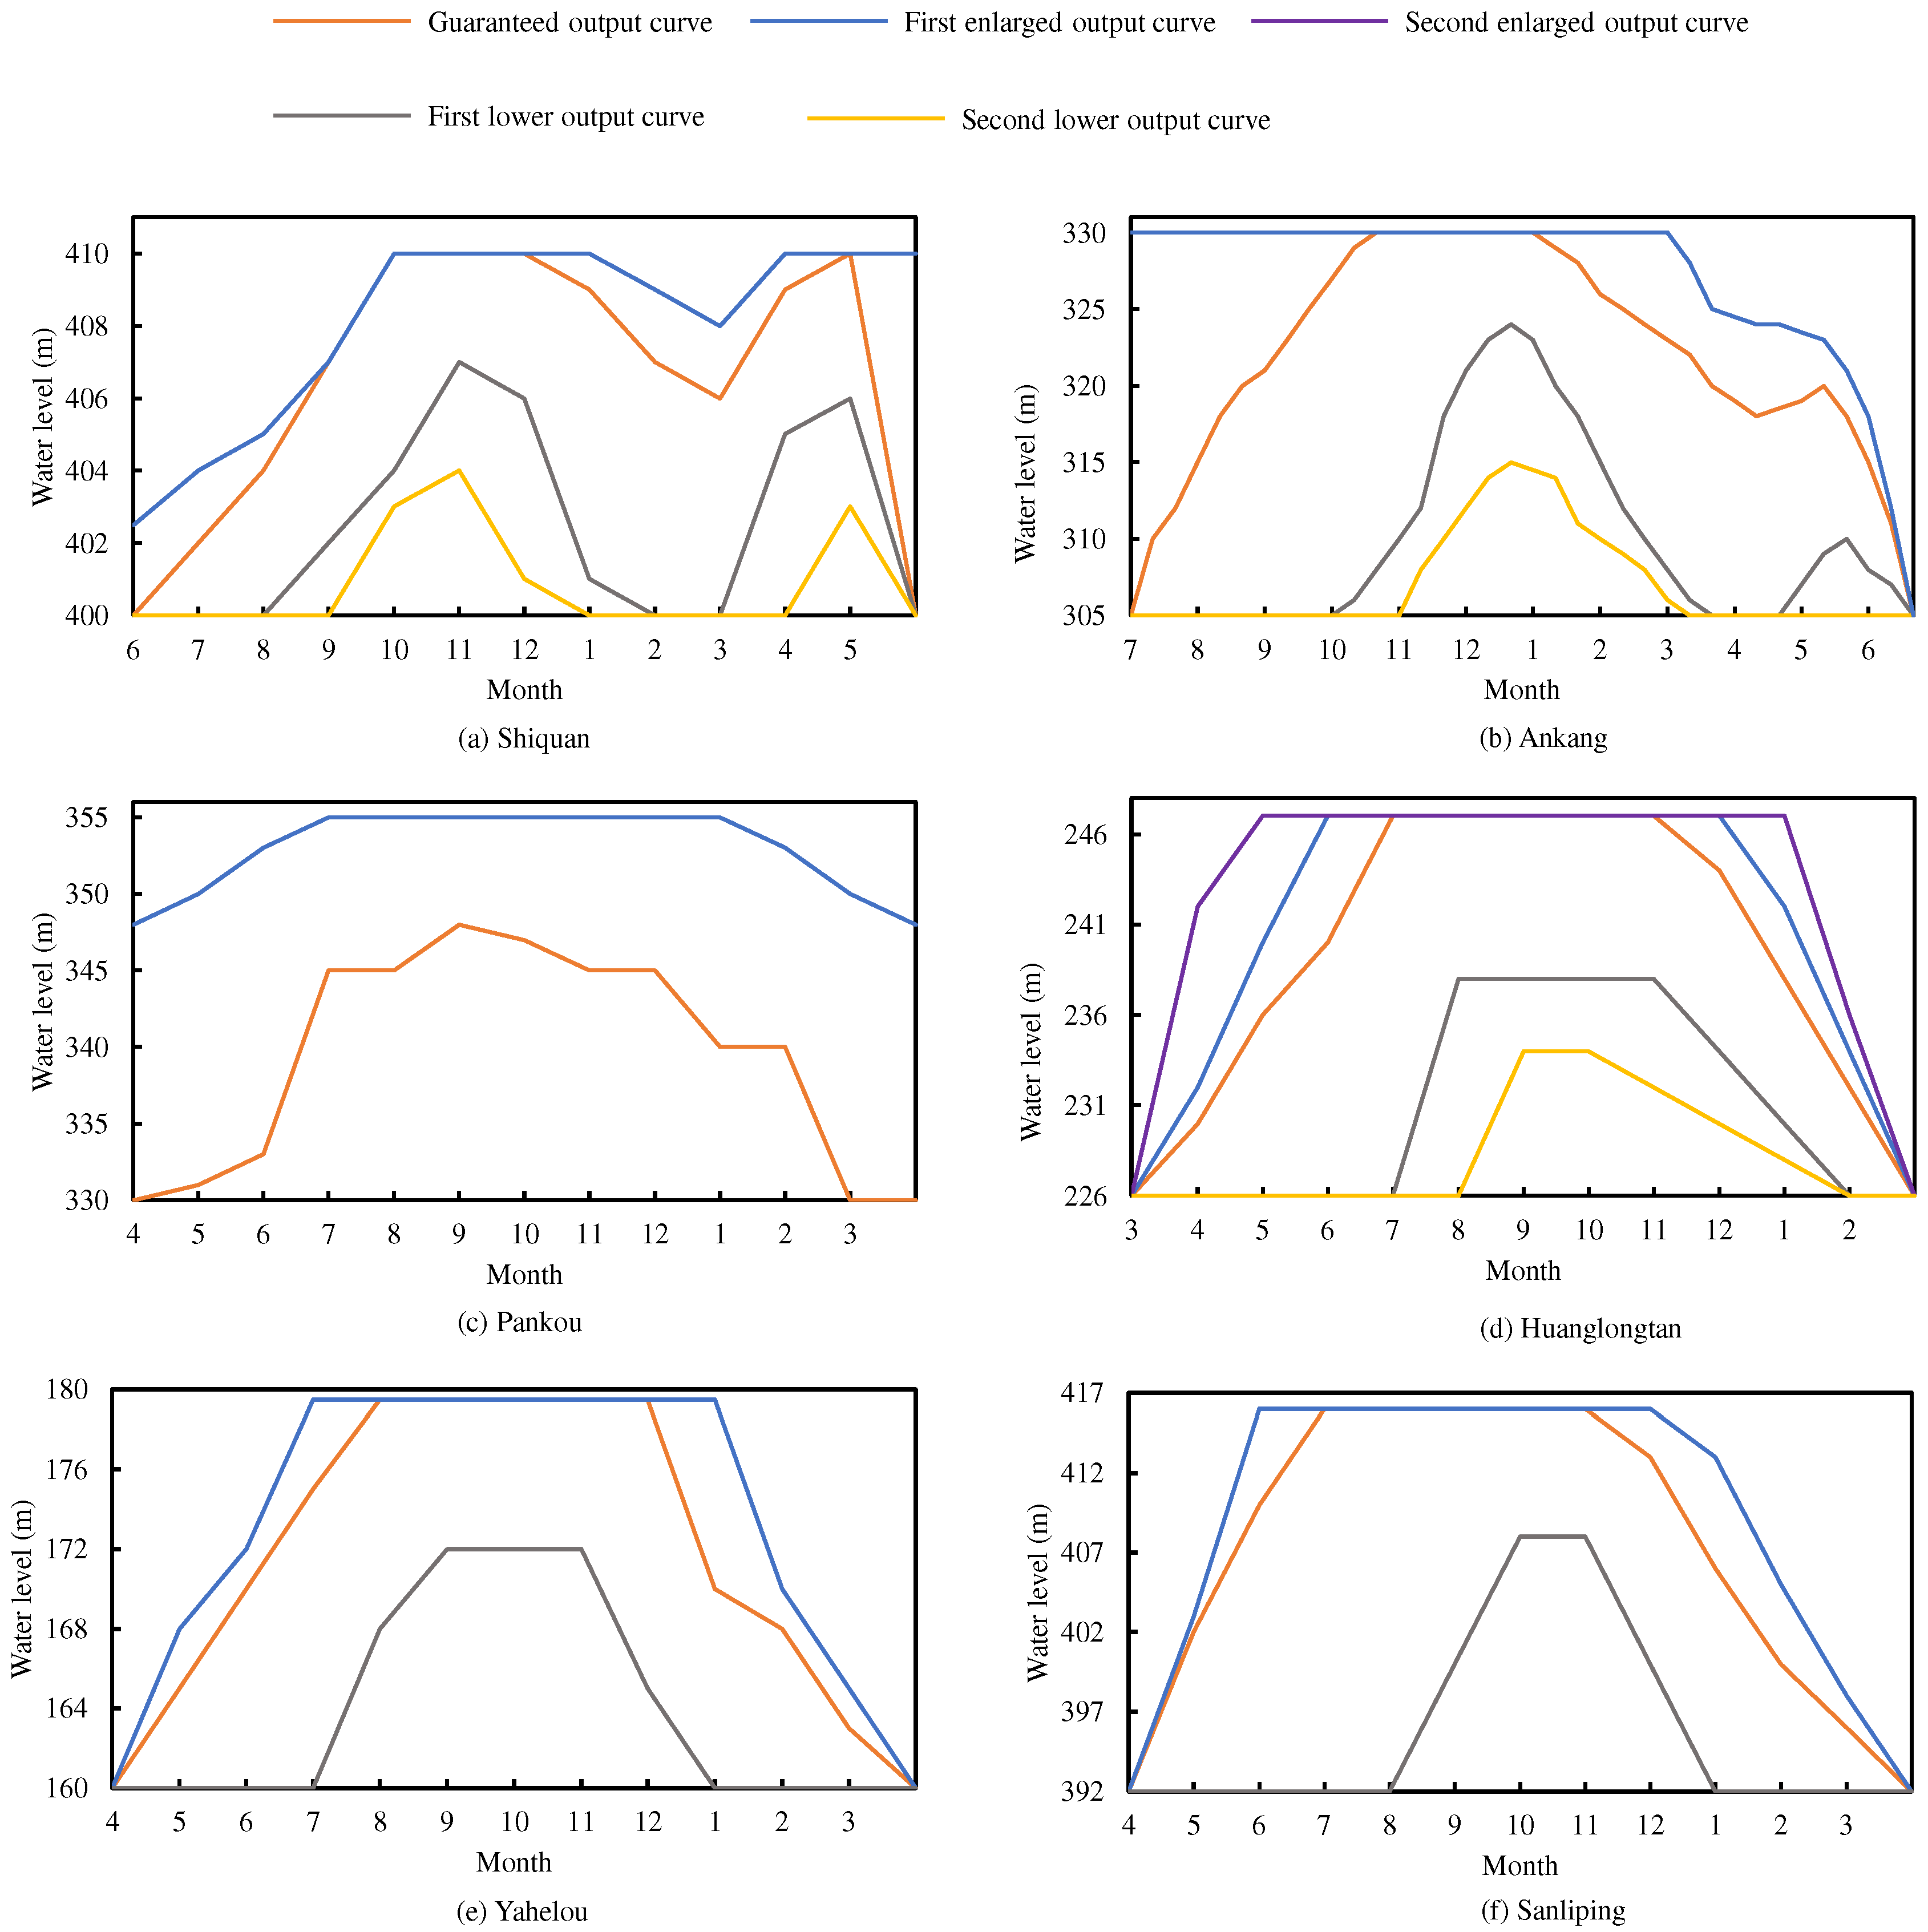
To verify the effectuality of the proposed methods, this study collected data from the Hanjiang River basin regarding the inflow of reservoirs and the streamflow of hydrological stations during the drawdown period (December to next May, during the non-flood period) spanning from 1954 to 2022. In China, the drawdown timings of reservoirs in the same river basin are similar, whereas the initial water levels of reservoir drawdown operation vary with hydrological scenarios (e.g., wet, normal and dry). The emission objective varies with different scheduling schemes, primarily due to the impact of water level fluctuations on the carbon emissions from the reservoirs. Three hydrological scenarios (wet, normal, and dry) were delineated according to daily inflow data. Initial reservoir storages for each scenario were determined based on the water abundance therein (the initial storage equals the total capacity under the wet scenario, while it amounts to 90% and 80% of that capacity under the normal and dry scenarios, respectively). The simulation period of this study is the drawdown period (from December to next May) at a ten-day scale. Three representative hydrological scenarios (wet, normal, and dry) were considered as inputs to the reservoir operation simulations. The hydraulic connections between two successive reservoirs were simulated with balance equations (Equations (7a) and (7b)). Since the reservoir simulation model was constructed for middle and long-term operations based on a ten-day time step, rather than for short-term operations at an hourly or daily scale, the travel time of water released from the upstream to the downstream reservoir in a single time step can be neglected in the simulation model. Carbon emission factors were sourced from reservoirs within the Hanjiang River basin [35,36,37,38,39], as detailed in Table A1. Reservoir operation is mimicked by the Standard Operation Policy (SOP), which serves as a guiding framework for reservoir operation [33,40], illustrated in Figure A1 and Figure A2.

3. Methods

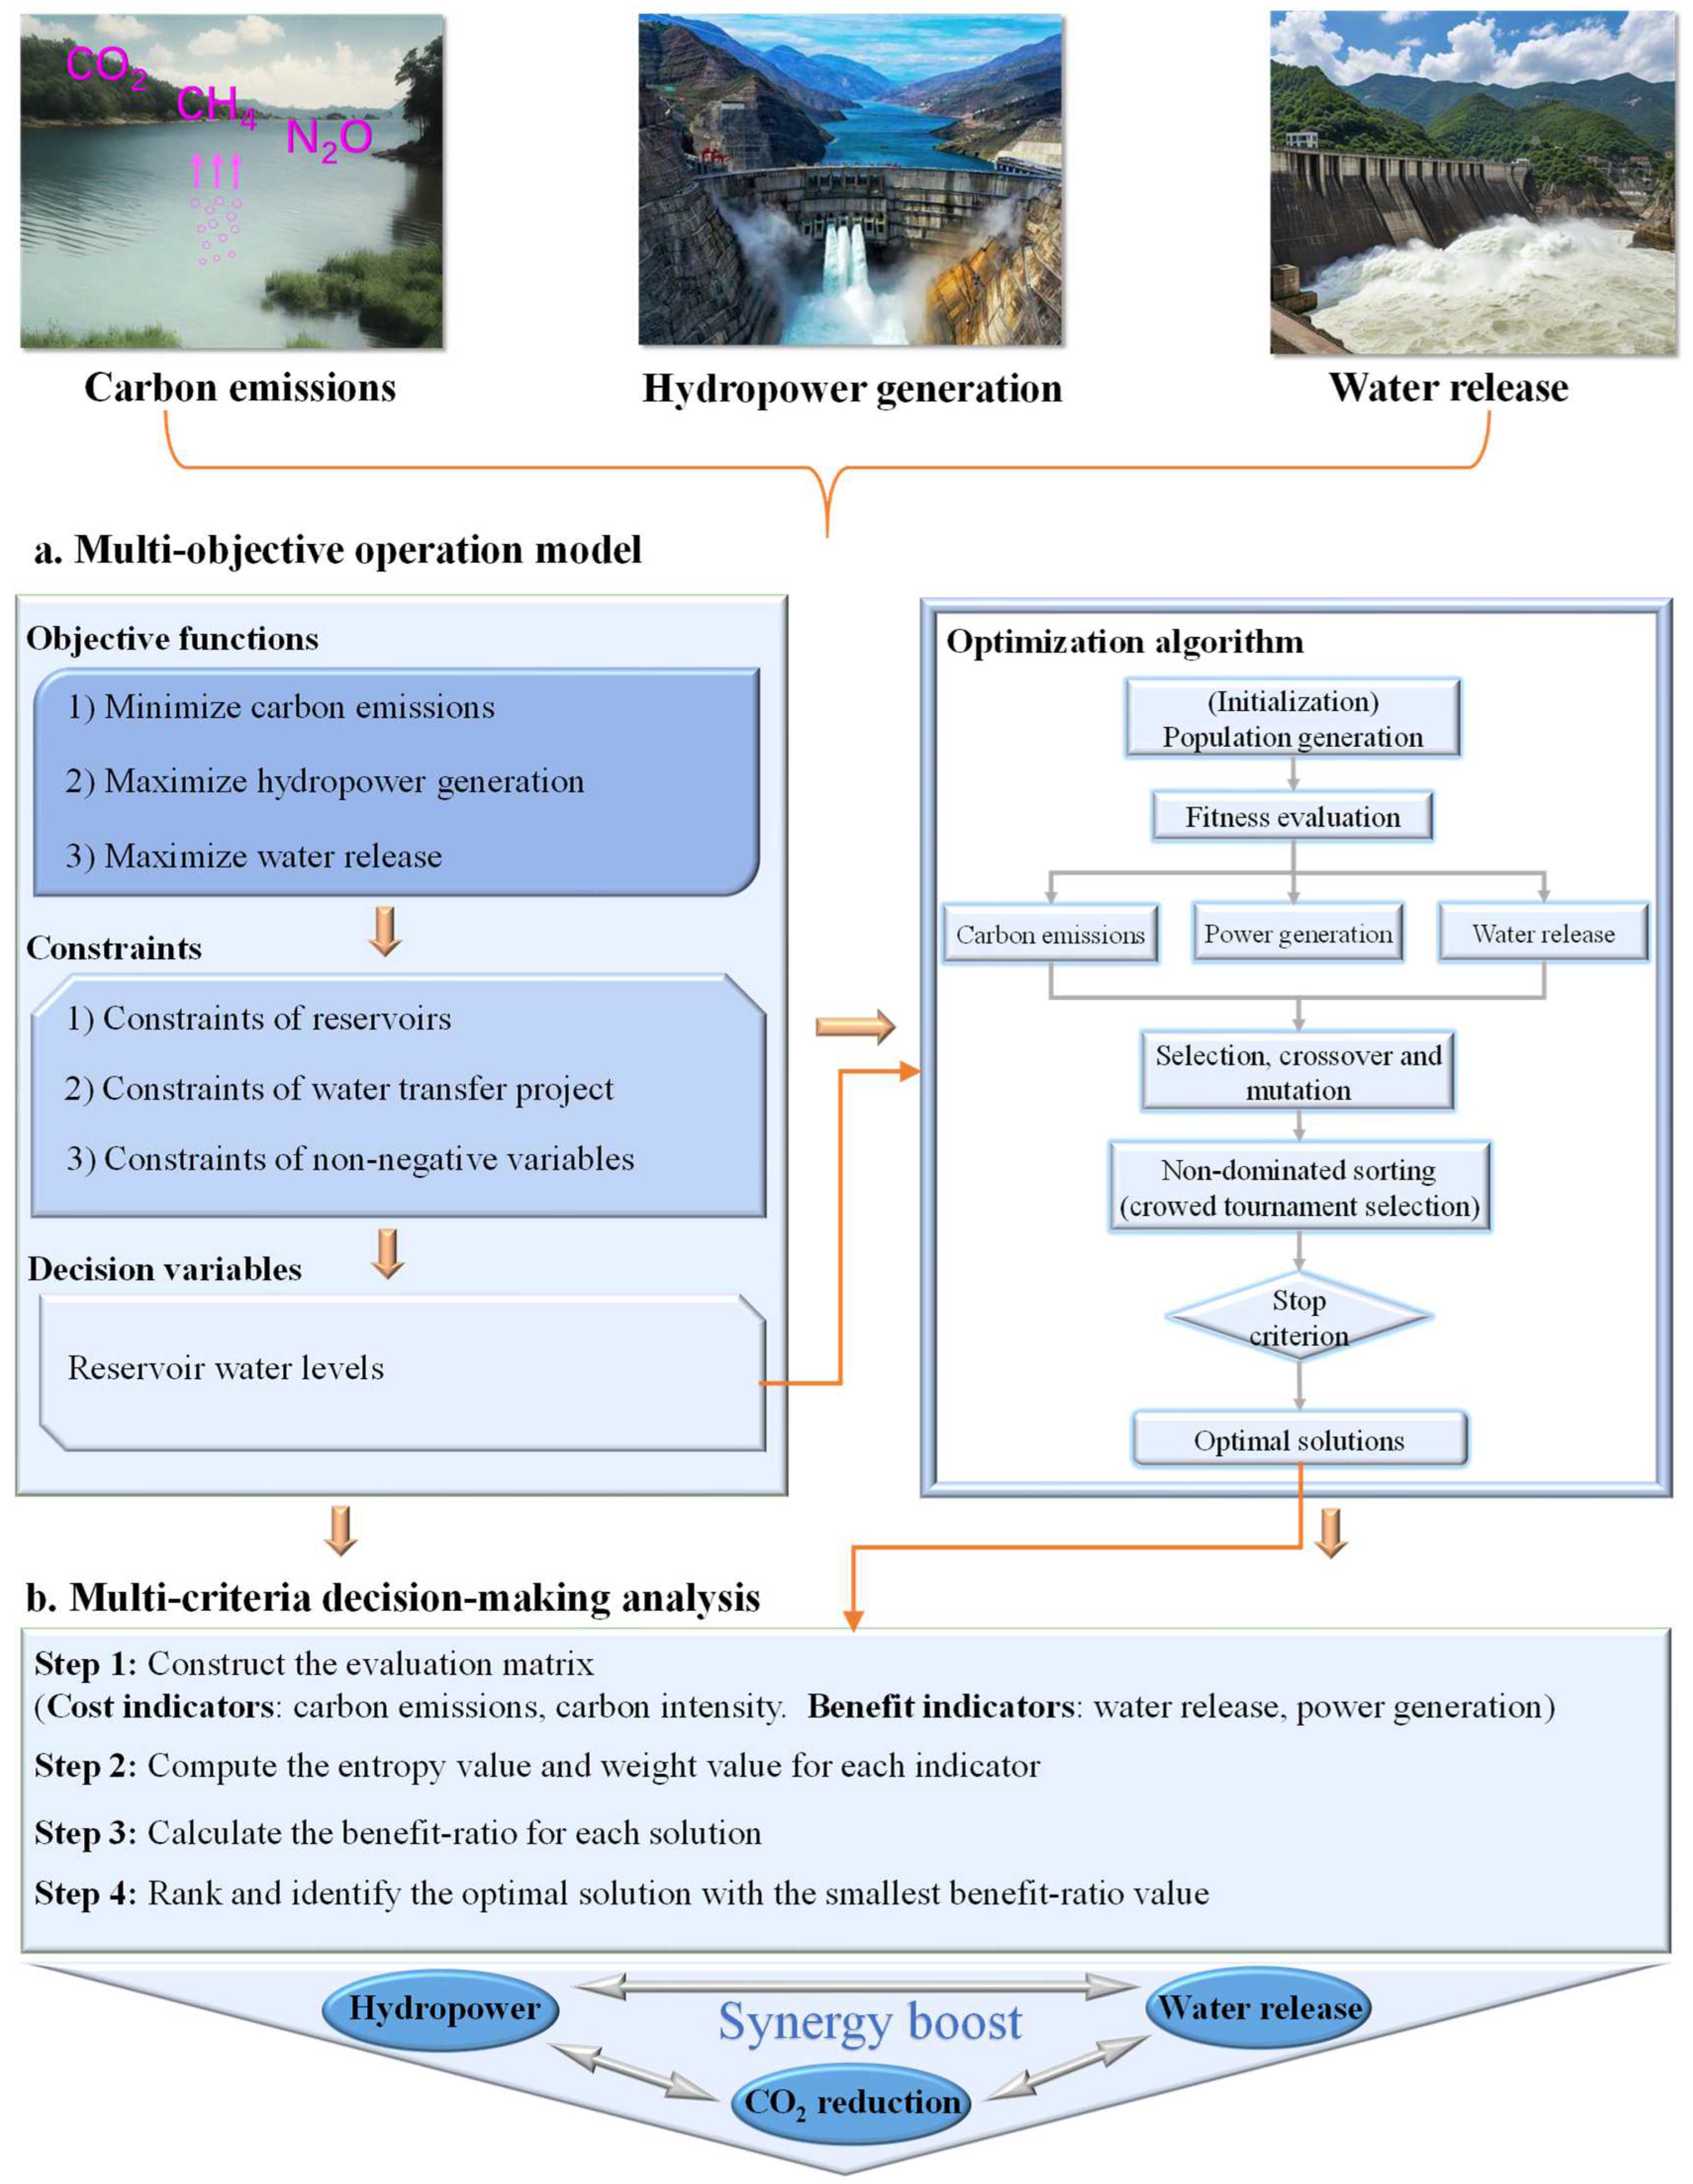
This study uses an intelligent evolutionary algorithm to investigate the joint drawdown operation of mega reservoirs to enhance the collaborative comprehensive benefits across carbon emission reduction, hydropower production, and water release. The proposed multi-objective optimization framework presented in Figure 2 contains two parts. Initially, the joint drawdown operation of mega reservoirs was configured by three objectives and relevant constraints to increase the comprehensive reservoir carbon, energy, and water benefits, using NSGA-II. Then, the optimal operational schemes were efficiently identified by evaluating reservoir carbon, energy, and water, using the VIKOR-based multi-criteria decision-making method. A brief introduction to the adopted methods is presented below.

3.1. Joint Drawdown Operation Model

3.1.1. Operation Objective

We established a joint drawdown operation model to deal with reservoirs’ carbon emissions and boost comprehensive benefits between water release and hydropower generation. As the drawdown period (December to next May) of the Hanjiang River basin is the non-flood season, the flood control objective was not considered in this study. The aim is to achieve Objective 1: minimization of reservoir carbon emissions; Objective 2: maximization of hydropower generation; and Objective 3: maximization of the water release.
In this study, the assessment of greenhouse gas emissions from reservoirs focuses on emissions from both the water surface and the drawdown area. For a given reservoir, during each time period, the greenhouse gas emissions from the water surface and the drawdown area are determined by multiplying the respective areas by their emission fluxes [41]. Over the entire operational period, the total greenhouse gas emissions from the reservoir are the sum of the emissions from both regions across all time periods. The greenhouse gas emission fluxes used in this study are detailed in Table A1.
The formula is given below.
Objective 1 (O1): minimize the carbon emissions (CEs) of seven mega reservoirs
f 1 = m i n n = 1 N t = 1 T C e m i , n ( t ) C e m i , n ( t ) = M C O 2 , n ( t ) + λ M M C H 4 , n ( t ) + λ N M N 2 O , n ( t )
where Cemi,n(t) denotes the nth reservoir’s carbon emissions at time t.  M C O 2 , n t , M C H 4 , n t , and M N 2 O , n t are the nth reservoir’s CO2, CH4, and N2O emissions, respectively, at time t. λ M and λ N are global warming potentials on a 100-year horizon, which are utilized to convert the reservoir’s CO2, CH4, and N2O emissions into the greenhouse gas equivalent of CO2. The global warming potential of CO₂ is 1. N and T are the total number of reservoirs and calculation time periods, respectively.
M C O 2 , n ( t ) = C C O 2 , n ( t ) m C O 2 / m C M C H 4 , n ( t ) = C C H 4 , n ( t ) m C H 4 / m C M N 2 O , n ( t ) = N N 2 O , n ( t ) m N 2 O / 2 m N
where C C O 2 , n ( t ) , C C H 4 , n t , and N N 2 O , n ( t ) are the mass of the carbon and nitrogen elements in the nth reservoir’s CO2, CH4 and N2O emissions, respectively, at time t. m C and m N represent the relative atomic mass of carbon and nitrogen elements, respectively. m C O 2 , m C H 4 , and m N 2 O are the relative molecular masses of CO2, CH4, and N2O, respectively.
C C O 2 , n t = A surf , n t r sC O 2 + A draw , n t r d C O 2 C C H 4 , n ( t ) = A surf , n t · r sC H 4 + A draw , n t r d C H 4 N N 2 O , n t = A surf , n t · r s N 2 O + A draw , n t r d N 2 O
A draw , n ( t ) = A m a x , n A surf , n t A surf , n t = f Z - A ( Z n ( t ) )
where A surf , n t and A draw , n t denote the nth reservoir’s surface and drawdown areas, respectively, at time t. r sC O 2 and r sC H 4 are the emission fluxes of CO2 and CH4, respectively, from the reservoir surface. r d C O 2 and r d C H 4 are the respective emission fluxes of CO2 and CH4 from the reservoir drawdown zones. r s N 2 O and r d N 2 O are the emission fluxes of N2O from the reservoir surface and drawdown zones, respectively. A m a x , n is the nth reservoir’s maximum surface area. f Z - A ( Z n ( t ) ) represents the nth reservoir’s water level–area curve.
O2: maximize the hydropower generation (PG) of the seven mega reservoirs
f 2 = m a x n = 1 N t = 1 T k n · Q fd , n t · H n t · Δ t
where kn represents the nth reservoir’s power output coefficient. Qfd,n(t) represents the nth reservoir’s water release through turbines at time t. Hn(t) represents the nth reservoir’s hydraulic head at time t. Δt represents the time interval.
O3: maximize the water release (WR) of the mega reservoirs
f 3 = m a x n = 1 N t = 1 T O n ( t )
where On(t) denotes the nth reservoir’s water release at time t. Since water users are commonly distributed in the reservoir downstream area, more reservoir outflows can better satisfy the water demands of water users.

3.1.2. Constraints

The joint drawdown operation model must satisfy physical constraints and non-negative variables during the drawdown operation period, as shown below.
(1)
Water balance:
V n t + 1 = V n t + I n t O n t · Δ t V n , l o s s t
where V n t represents the nth reservoir’s storage at time t. V n , l o s s t represents the nth reservoir’s water loss at time t. In(t) and On(t) are the nth reservoir’s inflow and outflow at time t. The water transfer volume of the SNWDP should be considered, which can be calculated as follows.
V d t + 1 = V d t V d , l o s s t + I d t O d t Q d t Δ t
where Qd(t) represents the SNWDP’s water transfer volume at time t. V d t , V d , l o s s t , Id(t), and Od(t) represent the Danjiangkou reservoir’s storage, water loss, inflow, and outflow, respectively, at time t.
(2)
Water level constraints of reservoirs:
Z n min Z i t Z n max
where Zn(t) represents the nth reservoir water level at time t; Znmin and Znmax are the nth reservoir’s minimal and maximal water levels, respectively.
(3)
Hydropower generation limitation:
P n min P n ( t ) P n max P n t = k n · Q fd , n t · H n t  
where Pn(t) is the nth reservoir’s hydropower output at time t; P n min and P n max represent the nth reservoir’s minimal and maximal hydropower outputs, respectively, which are determined according to the rated power of the turbine, disabled capacity, and the requirements of peak load regulation in the power grid.
(4)
Limitations of reservoir outflow:
O n m i n O n t O n m a x
where Onmax and Onmin represent the nth reservoir’s maximum and minimum allowable outflows. The minimum allowable outflow is determined by water demands from hydropower generation, the river eco-environment, and downstream water users.
(5)
Limitations of the start and end-of-operation water levels:
Z n 1 = Z n s t a r t   Z n T + 1 = Z n e n d
where Znstart and Znend are the nth reservoir’s initial and end-of-operation water levels.
(6)
Constraints of hydraulic connections:
I n + 1 t = O n t + Q q j , n + 1 t
where Qqj,n+1(t) is the n + 1 reservoir’s lateral flow at time t.
(7)
Constraints of the SNWDP water diversion:
Q d m i n Q d t Q d m a x
where Qdmin and Qdmax represent the SNWDP’s minimal and maximal water transfer volumes.

3.2. Non-Dominated Sorting Genetic Algorithm II (NSGA-II)

NSGA-II is a mature intelligent algorithm capable of efficiently handling multi-objective problems. By incorporating an elitist strategy and a crowding distance algorithm, NSGA-II not only maintains a diverse solution set but also achieves rapid convergence. With its robust performance, NSGA-II has been widely applied to address challenges in complex engineering operation and management problems [42,43,44]. This study uses NSGA-II to obtain the optimal solutions to the proposed model. In reservoir optimization operations, reservoir water levels are commonly represented as discrete values. The difference between two successive discrete water level values facilitates the resolution of inherent nonlinear relationships and various constraints within the model while substantially reducing the state space and enhancing computational efficiency. To deal with complicated constraints and obtain reasonable solutions, the water levels of reservoirs are selected as decision variables, which are u = {Z1(1), Z1(2),…, Z1(T),…, ZN(T)}. NSGA-II is implemented using the MATLAB optimization toolbox (Version number: R2020b, 9.9.0.1467703). The implementation procedure of NSGA-II is introduced below.
Step 1: Input inflows of mega reservoirs and later flows, characteristics of mega reservoirs, and fluxes of greenhouse gas emissions.
Step 2: Initialize model parameters, including population size NP, maximal iteration number G, crossover probability pc, and mutation probability pm. Define the parent and offspring populations as Dg and Fg, respectively.
Step 3: Assign 1 to the iteration number g and randomly initialize parent population Dg. Simulate reservoir operation processes according to the decision variables and constraints (7)–(13) and compute the fitness values of three objectives according to the functions (1)–(6). Then, use the fast non-dominated sorting method to re-sort each solution of the Dg set.
Step 4: Create an offspring population Fg of size NP utilizing three genetic algorithm operators.
Step 5: Combine populations Dg and Fg to form a population Lg. Use the fast non-dominated sorting method to re-sort each solution of the Lg set again and calculate the solutions’ crowding distances.
Step 6: Choose the new parent population Dg+1 from the population Lg. Then, create the offspring population Fg+1 using these three genetic algorithm operators again. Compute the three objectives’ fitness values using the functions (1)–(6). Then g = g + 1.
Step 7: Repeat Steps 5 and 6 until reaching the stopping computation criteria. Then, save the Pareto solutions and output the optimal operation results.
In this study, a total of 378 datasets (=7 reservoirs × 18 times (10-day time step) × 3 years) are utilized to assess the proposed methods, suggesting that the model has 378 decision variables as well as 3024 constraints (=8 equations × 378 decision variables). NSGA-II’s parameters are configured by intensive trial-and-error procedures (population size NP = 600; G = 300; pc = 0.8; and pm = 0.1).

4. Results and Discussion

We evaluate the optimal drawdown operation schemes for seven mega reservoirs in the Hanjiang River basin of China. These reservoirs collectively have an installed power capacity of 3069 MW and a regulatable storage capacity of about 20.8 billion m3 (Figure 1 and Table 1). We further explore a multi-objective drawdown operation model for enhancing these reservoirs’ comprehensive benefits of carbon emission reduction, hydropower output, and water release.

4.1. Flood Risk Analysis of Reservoir Impoundment Operation

Figure 3 displays NSGA-II’s Pareto front and the outcome of the SOP under three hydrological scenarios (wet, normal, and dry). This means that the three objectives can be converged on the Pareto frontier by utilizing NSGA-II. Clearly, the SOP outcome deviates from the Pareto frontier. The optimal solutions of the Pareto frontier demonstrate extensive coverage and exceptional diversity across three objectives, along with remarkable convergence capability. The reasons are that NSGA-II’s fast non-dominated sorting mechanism, elite preservation strategy, and crowding distance comparison operator enable the search for and approximation to the optimal non-dominated solutions in the multi-objective optimization.
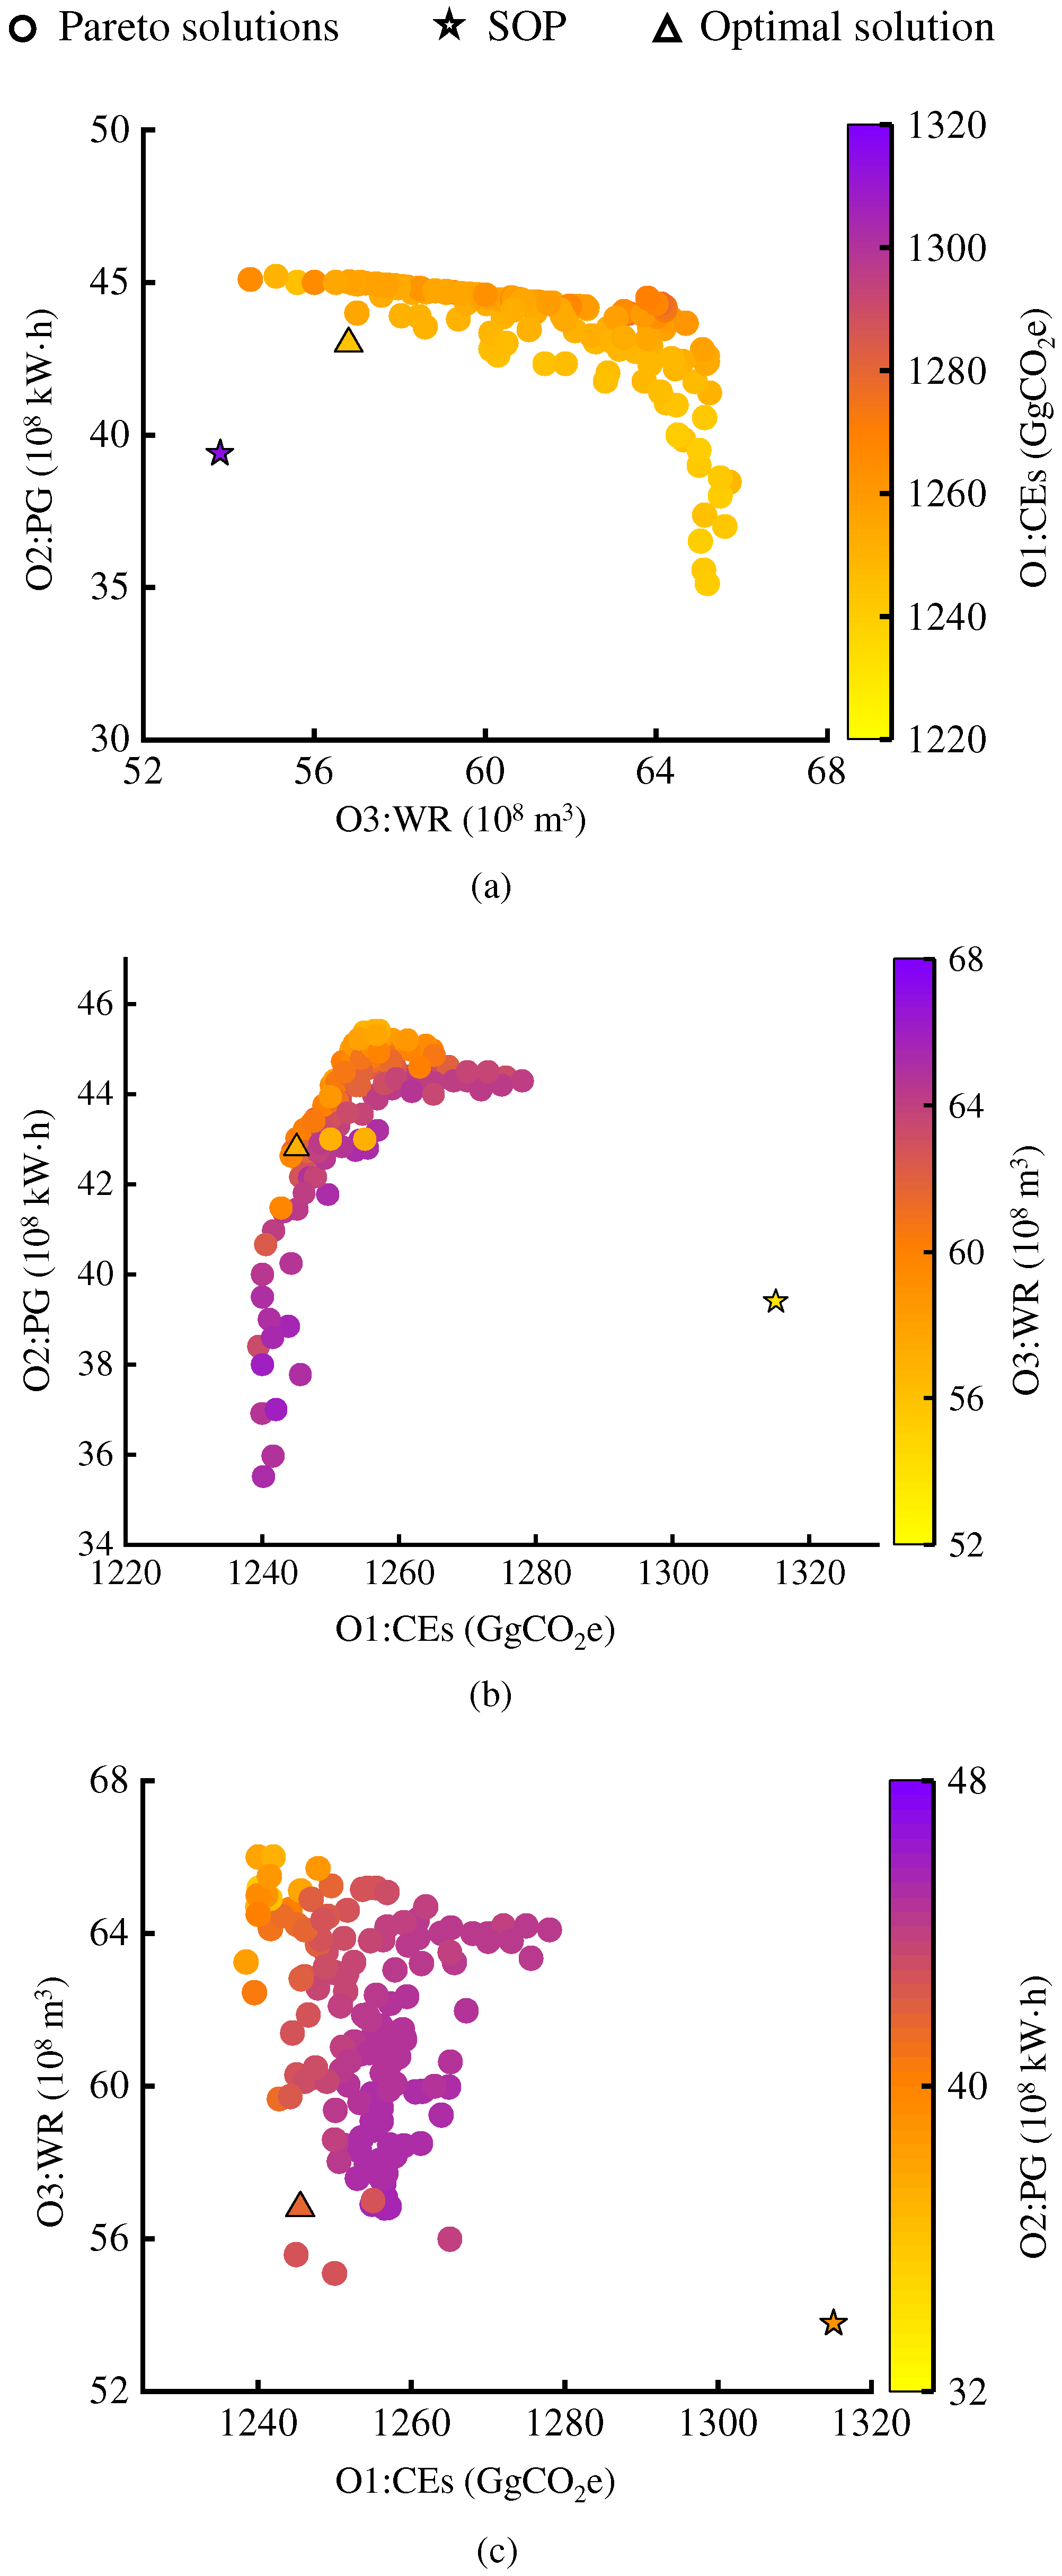
Taking the dry scenario as an example, Figure 4 displays a two-dimensional projection of the Pareto frontier and the SOP outcome to better illustrate the positive or negative relationship among the three objectives. Figure 4a shows a negative relationship between O2 and O3. As water release increases, there is a declining trend in hydropower generation. Notably, as the Hanjiang River basin’s largest reservoir, the Danjiangkou Reservoir contributes significantly to overall hydropower generation. Consequently, increasing the water release diminishes the hydraulic head for hydroelectricity from the Danjiangkou Reservoir. In Figure 4b, the relationship between O1 and O2 is not very strong. The minimization of carbon emissions exhibits a negative stance with O2, suggesting reservoir carbon emissions tend to increase when hydropower generation escalates.
The rationale behind this lies in the fact that more water release for hydroelectricity boosts the hydropower output mean while lowering reservoir water levels, consequently expanding drawdown areas and resulting in more carbon emissions. Figure 4c reveals no obvious positive or negative relationship between O1 and O3, exhibiting a planar shape of the scattered dots alongside the Pareto frontier. As hydropower production increases—a major negative flux that significantly influences water levels—GHG emissions also rise. Conversely, water release acts as a minor negative flux, having a smaller influence on water levels.

4.2. Assessment of the Comprehensive Benefits of Carbon Emission Reduction, Hydropower Production, and Water Release

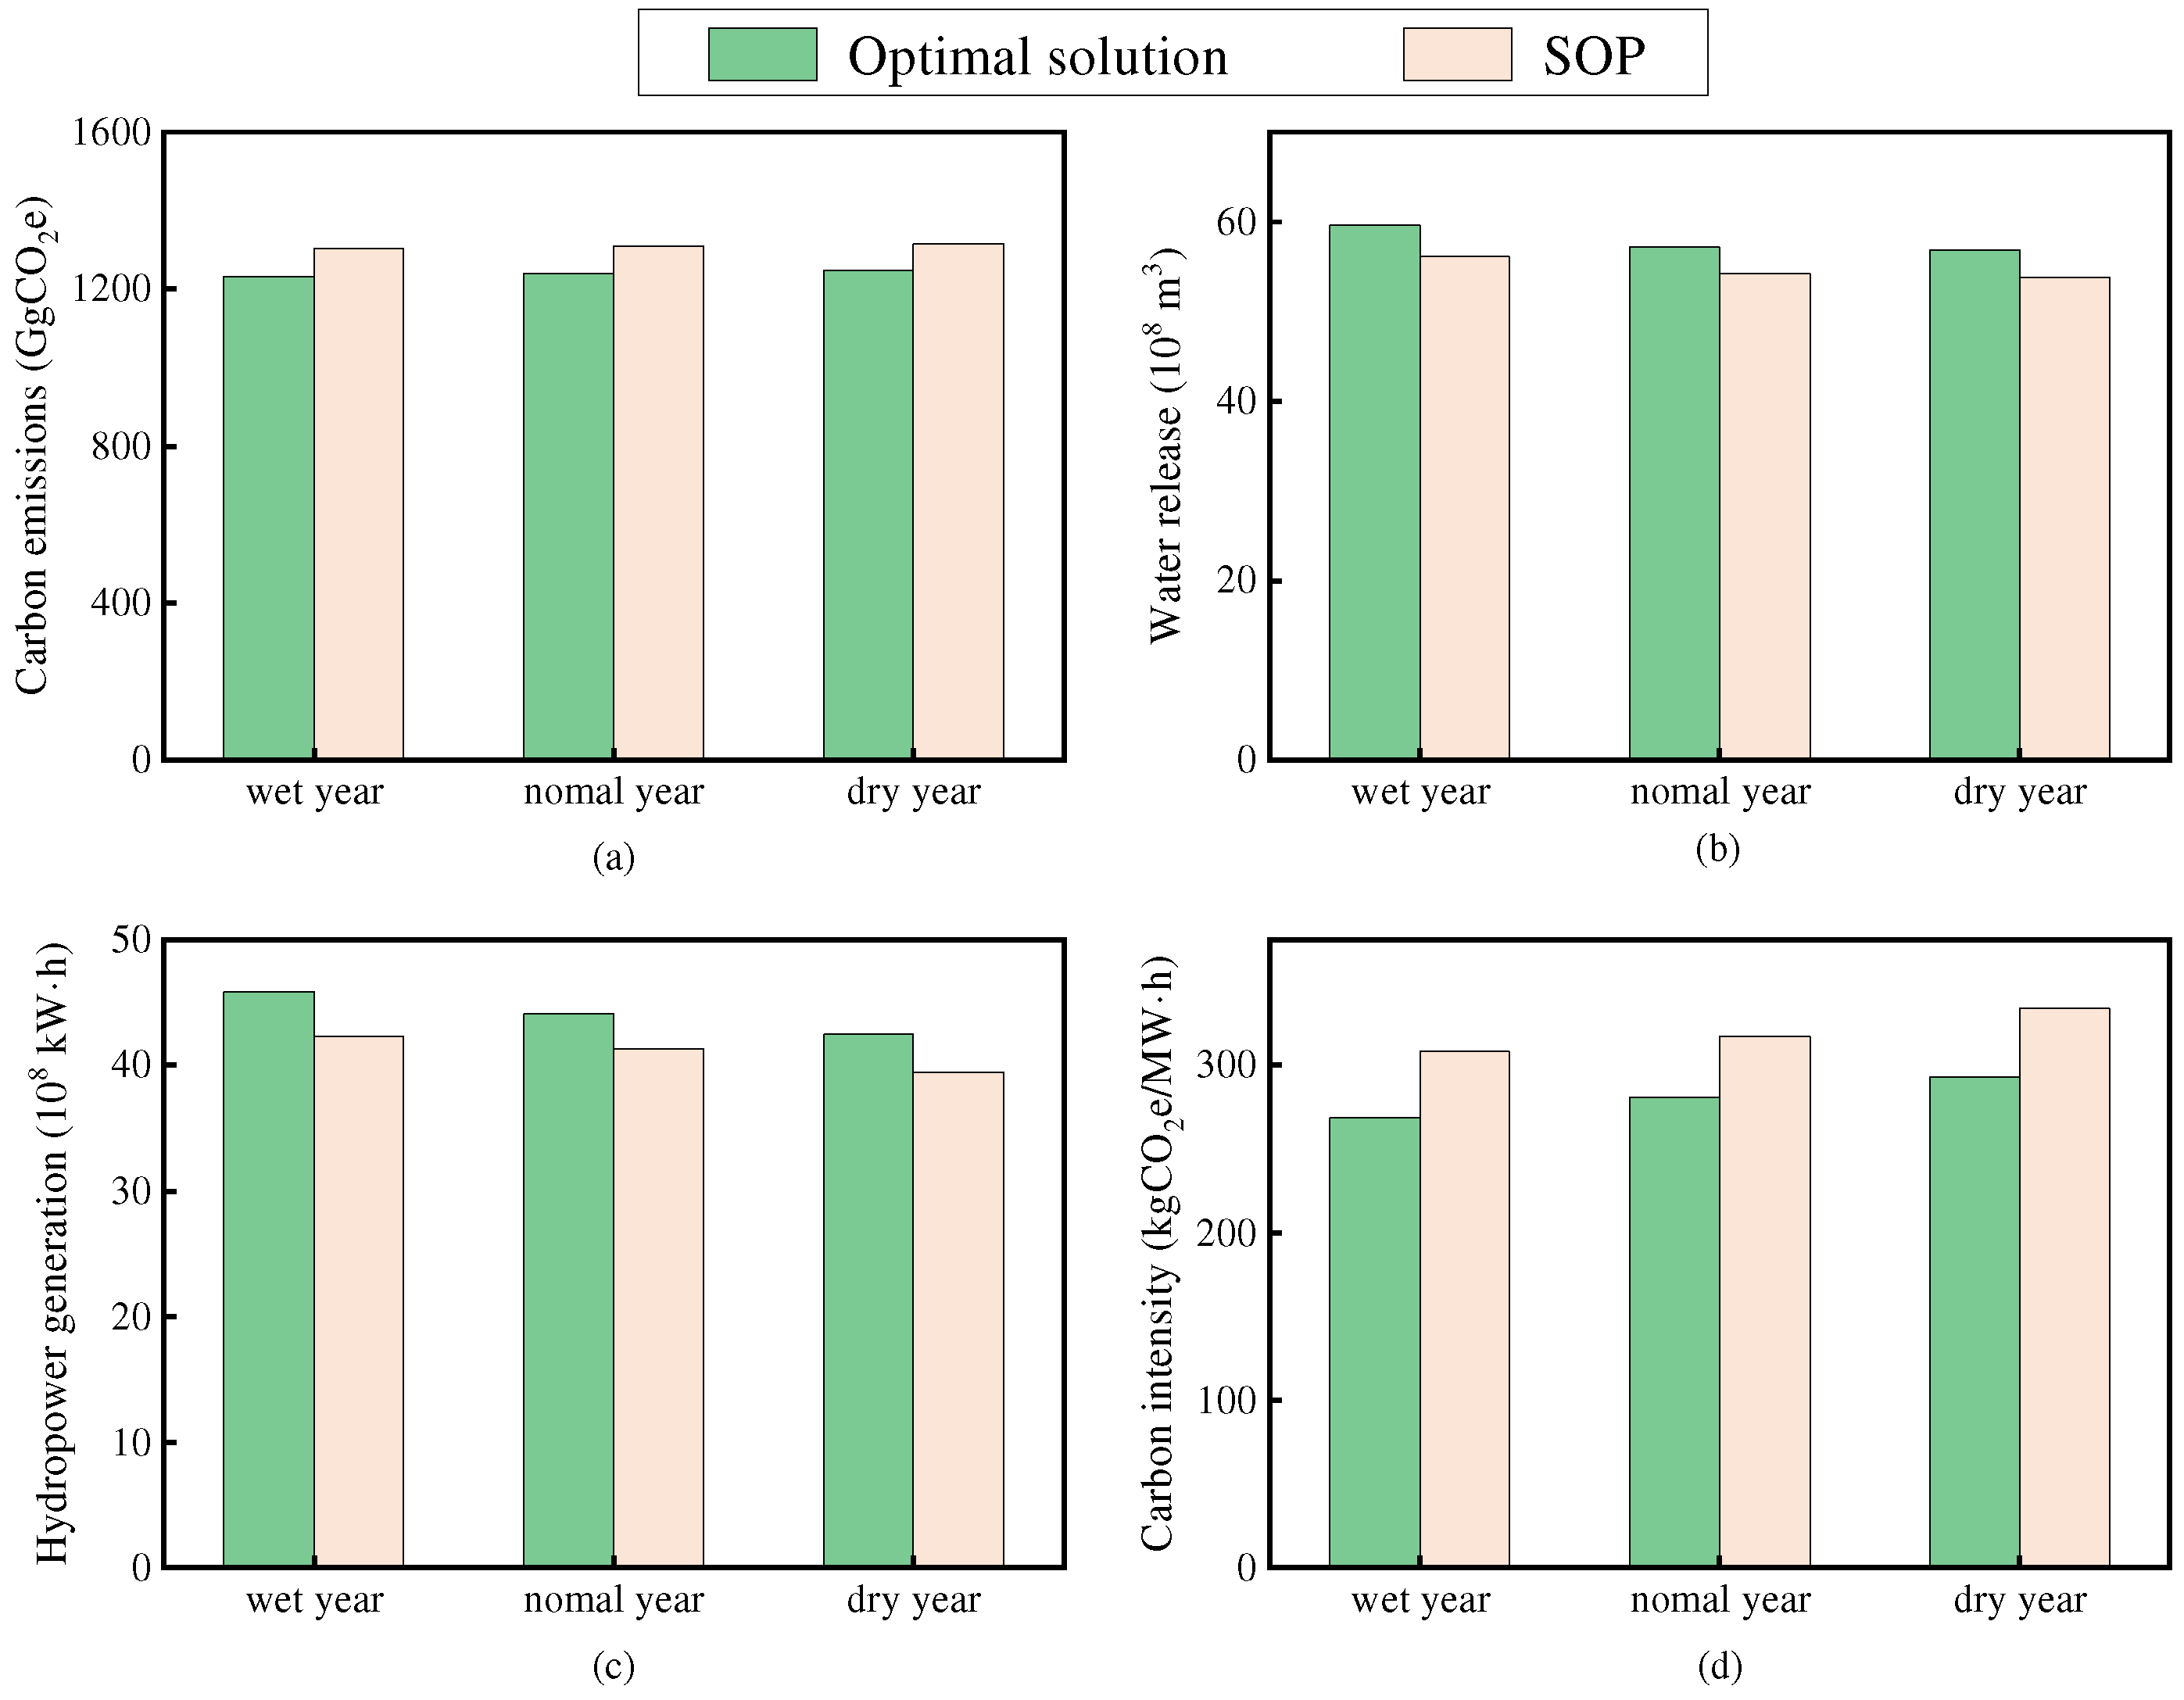
This study applied the VIKOR-based multi-criteria decision-making method for selecting the optimal solution generating the largest benefit-ratio value from the Pareto frontier solutions generated by NSGA-II. Figure 5 presents a comparison between the optimal solution from NSGA-II and the outcome of the SOP based on evaluation indicators. For the three hydrological scenarios, the optimal solution outperforms the SOP outcome in terms of all indicators. Notably (Table 2), the maximum improvement rates for water release and hydropower generation can reach 6.2% and 8.3%, respectively, while the maximum reduction rates for carbon emissions and intensity can reach 5.6% and 12.8%, respectively. This highlights how optimal operation boosts comprehensive benefits among carbon emission reduction, water release, and hydropower generation in reservoirs, consequently promoting cleaner hydroelectricity. In addition, the carbon intensity of the optimal solution meets the sustainable development goal raised by the International Energy Agency (IEA) during World Energy Outlook 2017, aiming to reduce the carbon dioxide emissions of global power generation to 330 kgCO2e/MW·h by 2040 [45]. However, the dry year’s carbon intensity calculated by the SOP exceeds this threshold (330 kgCO2e/MW·h). This suggests that the reduction of carbon emissions should gain greater attention when formulating the operating rules for reservoirs, particularly during dry periods, to mitigate increased carbon emissions from reservoirs.

4.3. Joint Drawdown Operation Processes of Mega Reservoirs Under the Dry Scenario

Figure 6 illustrates the operation processes of reservoirs using the optimal solution NSGA-II and the outcome from the SOP in the dry year. Notably, the reservoir water levels under the optimal solution tend to be higher than those under the SOP outcome for the majority of the time. Moreover, a significant relationship is observed between reservoir carbon emissions and water levels. Specifically, reservoir carbon emissions tend to be higher when water levels are lower and vice versa. This is because higher water levels result in smaller drawdown areas, thereby reducing carbon emissions during reservoir operation periods, and the water levels are determined by reservoir operation schemes, which implies that carbon emissions from the reservoir can be reduced by implementing a well-designed operation scheme. Consequently, the optimal solution focuses on maintaining high water levels to mitigate reservoir carbon emissions. However, achieving this in dry or extremely dry years poses challenges due to limited inflow. In addition, the Danjiangkou Reservoir’s carbon emissions are higher than those of the other reservoirs primarily due to its larger area, which inherently leads to more carbon emissions.
In summary, the optimal solution emphasizes maintaining high water levels to reduce reservoir carbon emissions. Factors such as inflow conditions and surface areas must be carefully considered when designing reservoir operation rules to ensure effective implementation.

4.4. Discussion

The reservoir carbon emissions calculated using Equations (2)–(4) are assumed to originate from the reservoir surface and drawdown zones. As the reservoir water level decreases, more water is released, leading to an increase in greenhouse gas emissions. Additionally, while greater water releases boost the water release, they also result in a decline in hydraulic heads, which consequently reduces hydropower generation during the drawdown period.
The carbon emission factors utilized in this study for estimating reservoir carbon emissions introduce uncertainties. These uncertainties originate from two primary sources. Firstly, the uncertainty in the monitoring data of reservoir carbon emission factors arises due to the complex causes of GHG production in reservoirs and unclear emission characteristics. Reservoir carbon emission fluxes may show high heterogeneity in time and space [46]. Therefore, comprehensive and continuous monitoring is essential for acquiring reliable data on emission factors [47,48,49,50]. Secondly, incomplete consideration of carbon emission pathways is another source of uncertainty. While this study primarily focuses on water–air and soil–air interface diffusion as carbon emission pathways, bubble-mediated gas exchange and degassing flux from spillways and turbines are also significant pathways [51,52]. Further research is necessary for a more accurate and comprehensive estimation of reservoir carbon emissions and to consider the variations of GHG emission rates in the operation model establishment.
Additionally, empirical models can be developed to estimate reservoir carbon emissions using various characteristics of reservoir carbon emissions [53,54]. An empirical model integrating carbon emission flux, climate, geography, soil, and hydrological conditions proves to be an effective estimation method for reservoir carbon emissions [55,56]. Further exploration would involve integrating the empirical model of reservoir carbon emission with the proposed multi-objective operation model [57,58], offering novel solutions for reservoir carbon emission reduction [59,60].

5. Conclusions

This study delved into multi-objective optimization operations aimed at reducing reservoir carbon emissions through optimal operations and analyzing reservoir operation processes. This study estimated reservoir carbon emissions by considering emission pathways through water–air interface diffusion and soil–air interface diffusion, along with data on reservoir carbon emission flux from existing research. The Hanjiang River basin formed the case study. A multi-objective optimization operation model was constructed using NSGA-II to concurrently optimize the objectives of carbon emission reduction, water release, and hydropower generation during the drawdown period, where the relationships among different objectives were explored. The VIKOR-based multi-criteria decision-making method was adopted for selecting the optimal solution from the Pareto frontier generated by NSGA-II. Comparative analysis with the standard operation policies (SOPs) yielded several key findings:
  • Hydropower generation and water release have a negative relationship, with increased water release leading to decreased hydropower output. Reservoir carbon emissions show a negative relationship with hydropower generation but no relationship with water release.
  • The optimal solution reduced reservoir carbon emissions, with carbon intensity increasing as inflow decreased. Across three hydrological scenarios, the optimal solution surpassed the SOP outcome in terms of various indicators, where maximum improvement rates in water release and hydropower generation reached 6.2% and 8.3%, respectively, while carbon emissions and carbon intensity were reduced by up to 5.6% and 12.8%, respectively. Under the dry scenario, reservoir carbon emissions and intensity were higher, necessitating greater attention to carbon emission reduction in formulating operation rules.
  • The optimal solution reduced reservoir carbon emissions by maintaining high water levels, thereby minimizing drawdown areas and subsequent carbon emissions.
Balancing carbon emission reduction with other reservoir functions like water supply, hydropower generation, and navigation during drawdown periods poses challenges. Future endeavors could integrate physically based carbon emission models with the proposed multi-objective operation model to devise innovative solutions for reservoir carbon emission reduction.

Author Contributions

Conceptualization, Q.L. and Y.Z.; methodology, F.-J.C., C.-Y.X. and Y.Z.; software, Q.L., Y.L. and D.Z.; validation, D.Z.; formal analysis, Q.L., Y.L. and D.Z.; investigation, F.-J.C., C.-Y.X. and Y.Z.; resources, Y.Z.; data curation, Q.L., Y.L. and D.Z.; writing—original draft preparation, Q.L. and D.Z.; writing—review and editing, F.-J.C., C.-Y.X. and Y.Z.; visualization, Q.L., Y.L. and D.Z.; supervision, Y.Z.; project administration, Y.Z.; funding acquisition, Y.Z. All authors have read and agreed to the published version of the manuscript.

Funding

This research was funded by the National Key Research and Development Program of China (grant number 2021YFC3200303) and the Major Science and Technology Project of the Ministry of Water Resources of the People’s Republic of China (grant number SKS-2022038).

Institutional Review Board Statement

Not applicable.

Informed Consent Statement

Not applicable.

Data Availability Statement

The authors do not have the rights to share the data.

Acknowledgments

Thanks go to the Bureau of Hydrology in the Changjiang Water Resources Commission for compiling the data in this paper. The authors would like to thank the editors and anonymous reviewers for their valuable and constructive comments related to this manuscript.

Conflicts of Interest

The authors declare no conflict of interest.

Appendix A

Table A1. Greenhouse gas emission factors.
PathwayGHGMeansRangeReferences
Water–air interface
(Water surface)
r sC O 2 (mg C/m2/d)1154300–2100[38]
r sC H 4 (mg C/m2/d)4.14−1.8–40.13[35]
r s N 2 O (mg N/m2/d)0.1070.061–0.145[37]
Soil–air interface
(Drawdown area)
r d C O 2 (mg C/m2/d)1805ND a[39]
r d C H 4 (mg C/m2/d)2.160.9–3.6[36]
r d N 2 O (mg N/m2/d)0.1070.061–0.145[37]
a ND, no data.
Figure A1. Standard operation rule curves of the Danjiangkou Reservoir.
Sustainability 17 02770 g0a1
Figure A2. Standard operation rule curves of the mega reservoirs (af).
Sustainability 17 02770 g0a2

Appendix B

Vlse Kriterijumska Optimizacija-Kompromisno Resenje (VIKOR)-Based Multi-Criteria Decision-Making Analysis

In this study, we employed the VIKOR-based multi-criteria decision-making method to identify optimal solutions from the Pareto frontier [61]. Among the four indicators calculated by Equations (A1)–(A4), water release and hydropower generation are considered benefit-type indicators, while carbon emissions and carbon density are cost-type indicators. Our goal is to find an alternative that maximizes benefit-type indicators and minimizes cost-type indicators. Therefore, we use the VIKOR method to seek a compromise solution among multiple conflicting evaluation indicators.
The VIKOR method evaluates alternatives based on group-benefit values, individual-regret values, and benefit-ratio values. The group-benefit value represents the overall deviation of an alternative from the ideal solution, characterized by the best values of the evaluation indicators (maximum for benefit-type indicators and minimum for cost-type indicators). The individual-regret value represents the maximum deviation of an alternative from the ideal values for each evaluation indicator. The benefit-ratio value integrates the overall performance of each alternative across all evaluation indicators, considering its performance under the worst conditions. This helps decision-makers find a compromise optimal alternative under multiple evaluation indicators. Additionally, VIKOR incorporates a parameter (v) that reflects the decision-makers’ risk preference, making it adaptable to diverse decision-making needs [62]. Moreover, VIKOR incorporates a parameter (v) reflecting the decision-makers risk preference, making it adaptable to diverse decision-making needs [62].
The procedure of VIKOR-based multi-criteria decision-making analysis is introduced briefly as follows.
(1)
Construct evaluation indicators
Four evaluation indicators are illustrated to assess the effects of Pareto frontier solutions.
a. Water release (WR):
W R = n = 1 N t = 1 T O n ( t )
where WR represents reservoirs’ water release throughout the whole operation period.
b. Hydropower generation (PG):
P G = i = 1 N t = 1 T k i · Q fd , i ( t ) · H i ( t ) · Δ t
where PG represents reservoirs’ hydropower generation throughout the whole operation period.
c. Carbon emissions (CEs):
C E s = i = 1 N t = 1 T C emi , i ( t )
where CEs represent reservoirs’ total carbon emissions throughout the whole operation period.
d. Carbon intensity (CI):
C I = C E P G
where CI represents carbon intensity, which represents the emissions of carbon dioxide equivalents per unit of power generation. This indicator compares the carbon emissions from projects of different scales and power sources [63].
(2)
Evaluation procedure
① Based on the m Pareto frontier solutions and four indicators, normalize the evaluation matrix X = [xij]4 as Y = [yij]4 to make it dimensionless, which can be calculated as follows:
For the benefit-type indicator:
y i j = x i j min x j max x j min x j
where x i j is the ith Pareto frontier solution’s jth indicator. y i j   is the ith Pareto frontier solution’s jth normalized indicator.
For the cost-type indicator:
y i j = max x j x i j max x j min x j
② Compute the entropy values of indicators:
b i j = y i j i = 1 m y i j
e j = 1 ln m i = 1 m b i j · ln b i j
where b i j is the proportion of the ith Pareto frontier solution’s jth indicator e j is the jth indicator’s entropy.
③ Compute the entropy weight values for every indicator:
w j = 1 e j j = 1 4 ( 1 e j )
where w j is the jth indicator’s entropy weight.
④ Determine the ideal solution yj+ and anti-ideal solution yj-:
y j + = m a x i ( y i j )
y j = m i n i ( y i j )
where y j + is the ideal solution related to the jth indicator. y j is the anti-ideal solution related to the jth indicator.
⑤ Compute the ith Pareto frontier solution’s group-benefit value Si and individual-regret value Ri:
S i = j = 1 4 [ w j · ( y j + y i j ) ( y j + y j ) ]
R i = m a x i [ w j · ( y j + y i j ) ( y j + y j ) ]
where S i and R i are the ith Pareto frontier solution’s group-benefit value and individual-regret value, respectively.
⑥ Calculate the benefit-ratio value Bi of the ith alternative:
B i = v · S i min S i ( max S i min S i ) + ( 1 v ) · R i min R i ( max R i min R i )
where v∈[0, 1] represents the decision coefficient, commonly equal to 0.5. Bi is the benefit-ratio value of the ith alternative.
⑦ Rank all the Pareto frontier solutions according to the value of Bi and select the one with the smallest benefit-ratio value as the optimal solution.

References

  1. Zhou, Y.; Ning, Z.; Huang, K.; Guo, S.; Xu, C.Y.; Chang, F.J. Sustainable energy integration: Enhancing the complementary operation of pumped-storage power and hydropower systems. Renew. Sustain. Energy Rev. 2025, 210, 115175. [Google Scholar] [CrossRef]
  2. Rashid, M.U.; Abid, I.; Latif, A. Optimization of hydropower and related benefits through cascade reservoirs for sustainable economic growth. Renew. Energy 2022, 185, 241–254. [Google Scholar] [CrossRef]
  3. EPPEI. 2023 China Power Development Report; People’s Daily Press: Beijing, China, 2023; Available online: http://www.eppei.ceec.net.cn (accessed on 28 September 2023).
  4. Paredes, J.; Lund, J. Refill and Drawdown Rules for Parallel Reservoirs: Quantity and Quality. Water Resour. Manag. 2016, 20, 359–376. [Google Scholar] [CrossRef]
  5. Eum, H.; Kim, Y.; Palmer, R. Optimal Drought Management Using Sampling Stochastic Dynamic Programming with a Hedging Rule. J. Water Resour. Plan. Manag. 2011, 137, 113–122. [Google Scholar] [CrossRef]
  6. Isaac, N.; Eldho, T. Sediment management of run-of-river hydroelectric power project in the Himalayan region using hydraulic model studies. Sadhana Acad. Proc. Eng. Sci. 2017, 42, 1193–1201. [Google Scholar] [CrossRef]
  7. Beshavard, M.; Adib, A.; Ashrafi, S.; Kisi, O. Establishing effective warning storage to derive optimal reservoir operation policy based on the drought condition. Agric. Water Manag. 2022, 274, 107948. [Google Scholar] [CrossRef]
  8. Jurevicius, L.; Punys, P.; Kasiulis, E.; Silinis, L. Surveying Dewatered Areas in the Fish Spawning Sites During Short-Term Drawdown Operations: Case Study of a Large Hydropower Plant Reservoir in the Lowland Area, Lithuania. Energies 2022, 15, 8574. [Google Scholar] [CrossRef]
  9. Lin, F.; Zhou, Y.; Ning, Z.; Xiong, L.; Chen, H. Exploring a novel reservoir drawdown operation framework for boosting synergies of hydropower generation and drought defense. Sustain. Energy Technol. 2023, 60, 103562. [Google Scholar] [CrossRef]
  10. Ai, Y.; Huang, T.; Duan, C.; Huang, D.; Gong, Y.; Cheng, H. Knowledge domain of greenhouse gas emissions from hydropower reservoirs: Hotspots, frontiers and future perspectives. Front. Environ. Sci. 2022, 10, 1055891. [Google Scholar] [CrossRef]
  11. Saab, S.; Othman, F.; Tan, C.; Allawi, M.; El-Shafie, A. Review on generating optimal operation for dam and reservoir water system: Simulation models and optimization algorithms. Appl. Water Sci. 2022, 12, 73. [Google Scholar] [CrossRef]
  12. Ran, L.S.; Yue, R.; Shi, H.Y.; Meng, X.D.; Chan, C.N.; Fang, N.F.; Shi, Z.H. Seasonal and diel variability of CO2 emissions from a semiarid hard-water reservoir. J. Hydrol. 2022, 608, 127652. [Google Scholar] [CrossRef]
  13. Wang, X.F.; Liu, T.T.; He, Y.X.; Chen, H.; Wu, S.N.; Wang, J.L.; Li, H.; Que, Z.Y.; Yuan, X.Z. Greenhouse gases concentrations and emissions from a small subtropical cascaded river-reservoir system. J. Hydrol. 2022, 612, 128190. [Google Scholar] [CrossRef]
  14. Leng, P.F.; Li, Z.; Zhang, Q.Y.; Koschorreck, M.; Li, F.D.; Qiao, Y.F.; Xia, J. Deciphering large-scale spatial pattern and modulators of dissolved greenhouse gases (CO2, CH4, and N2O) along the Yangtze River, China. J. Hydrol. 2023, 623, 129710. [Google Scholar] [CrossRef]
  15. Haider, A. The Determinants of Greenhouse Gas Emissions: Empirical Evidence from Canadian Provinces. Sustainability 2024, 16, 2498. [Google Scholar] [CrossRef]
  16. Fearnside, P. Hydroelectric Dams in the Brazilian Amazon as sources of greenhouse gases. Environ. Conserv. 1995, 22, 7–19. [Google Scholar] [CrossRef]
  17. Prairie, Y.; Alm, J.; Beaulieu, J.; Barros, N.; Battin, T.; Cole, J. Greenhouse Gas Emissions from Freshwater Reservoirs: What Does the Atmosphere See? Ecosystems 2018, 21, 1058–1071. [Google Scholar] [CrossRef]
  18. Jiang, T.; Shen, Z.; Liu, Y.; Hou, Y. Carbon Footprint Assessment of Four Normal Size Hydropower Stations in China. Sustainability 2018, 10, 2018. [Google Scholar] [CrossRef]
  19. Li, X.; Jiang, C.; Ni, X.; Chen, S.; Hao, Q. Diffusive greenhouse gases fluxes from the surface of the Three Gorges Reservoir: Study at a site in Fuling. Acta Ecol. Sin. 2021, 41, 79–87. [Google Scholar] [CrossRef]
  20. Li, X.; Gui, F.; Li, Q. Can Hydropower Still Be Considered a Clean Energy Source? Compelling Evidence from a Middle-Sized Hydropower Station in China. Sustainability 2019, 11, 4261. [Google Scholar] [CrossRef]
  21. Ion, I.; Ene, A. Evaluation of Greenhouse Gas Emissions from Reservoirs: A Review. Sustainability 2021, 13, 11621. [Google Scholar] [CrossRef]
  22. Liu, X.; Xiao, S.; Pan, H.; Zheng, X.; Han, W.; Huang, C.; Deng, S. Optimizing hydropower plants based on carbon-water-energy-ecosystem nexus. Energy Convers. Manag. 2022, 270, 116191. [Google Scholar] [CrossRef]
  23. Ning, Z.; Zhou, Y.; Lin, F.; Zhou, Y.; Luo, Q. Exploring a Novel Reservoir Impoundment Operation Framework for Facilitating Hydropower Sustainability. Sustainability 2023, 15, 13400. [Google Scholar] [CrossRef]
  24. Liang, W.T.; Liu, X.Y.; Lu, X.X.; Yu, R.H.; Qi, Z.; Xue, H. Impact of dam decommissioning on greenhouse gas emissions from a reservoir: An example from the Inner Mongolia grassland region, China. J. Hydrol. 2024, 631, 130750. [Google Scholar] [CrossRef]
  25. Hansen, C.; Pilla, R.; Matson, P.; Skinner, B.; Griffiths, N.; Jager, H. Variability in modelled reservoir greenhouse gas emissions: Comparison of select US hydropower reservoirs against global estimates. Environ. Res. Commun. 2023, 4, 121008. [Google Scholar] [CrossRef]
  26. Huang, J.; Li, Z. Carbon emissions affected by real-time reservoir operation: A hydrodynamic modeling approach coupled with air-water mass transfer. Water Res. 2023, 241, 120118. [Google Scholar] [CrossRef]
  27. Shi, W.; Maavara, T.; Chen, Q.; Zhang, J.; Ni, J.; Tonina, D. Spatial patterns of diffusive greenhouse gas emissions from cascade hydropower reservoirs. J. Hydrol. 2023, 619, 129343. [Google Scholar] [CrossRef]
  28. Deemer, B.; Harrison, J.; Li, S.; Beaulieu, J.; DelSontro, T.; Barros, N.; Neto, J.; Powers, S.; Santos, M.; Vonk, J. Greenhouse Gas Emissions from Reservoir Water Surfaces: A New Global Synthesis. Bioscience 2016, 66, 949–964. [Google Scholar] [CrossRef]
  29. Keller, P.; Marcé, R.; Obrador, B.; Koschorreck, M. Global carbon budget of reservoirs is overturned by the quantification of drawdown areas. Nat. Geosci. 2021, 14, 402–408. [Google Scholar] [CrossRef]
  30. Harada, T. Parallel cooperative multiobjective coevolutionary algorithm for constrained multiobjective optimization problems. Appl. Soft Comput. 2024, 153, 111290. [Google Scholar] [CrossRef]
  31. Feng, Y.; Hong, Z.; Tian, G.; Li, Z.; Tan, J.; Hu, H. Environmentally friendly MCDM of reliability-based product optimisation combining DEMATEL-based ANP, interval uncertainty and Vlse Kriterijumska Optimizacija Kompromisno Resenje (VIKOR). Inf. Sci. 2018, 442, 128–144. [Google Scholar] [CrossRef]
  32. Zhu, Y.; Zhou, Y.; Xu, C.Y.; Chang, F.J. Optimizing complementary operation of mega cascade reservoirs for boosting hydropower sustainability. Sustain. Energy Technol. Assess. 2024, 64, 103719. [Google Scholar] [CrossRef]
  33. Zhou, Y.; Guo, S. Incorporating ecological requirement into multipurpose reservoir operating rule curves for adaptation to climate change. J. Hydrol. 2013, 498, 153–164. [Google Scholar] [CrossRef]
  34. Zhou, X.; Chen, W.; Liu, Q.; Shen, H.; Cai, S.; Lei, X. Future runoff forecast in Hanjiang River Basin based on Wetspa model and CMIP6 model. Front. Environ. Sci. 2022, 10, 980949. [Google Scholar] [CrossRef]
  35. Chen, H.; Yuan, X.; Chen, Z.; Wu, Y.; Liu, X.; Zhu, D.; Wu, N.; Zhu, Q.; Peng, C.; Li, W. Methane emissions from the surface of the Three Gorges Reservoir. J. Geophys. Res. 2011, 116, D21306. [Google Scholar] [CrossRef]
  36. Yang, L.; Lu, F.; Wang, X.; Duan, X.; Song, W.; Sun, B.; Chen, S.; Zhang, Q.; Hou, P.; Zheng, F.; et al. Surface methane emissions from different land use types during various water levels in three major drawdown areas of the Three Gorges Reservoir. J. Geophys. Res. 2012, 117, D10109. [Google Scholar] [CrossRef]
  37. Zhu, D.; Chen, H.; Yuan, X.; Wu, N.; Gao, Y.; Wu, Y.; Zhang, Y.; Peng, C.; Zhu, Q.; Yang, G.; et al. Nitrous oxide emissions from the surface of the Three Gorges Reservoir. Ecol. Eng. 2013, 60, 150–154. [Google Scholar] [CrossRef]
  38. Zhao, Y.; Wu, B.; Zeng, Y. Spatial and temporal patterns of greenhouse gas emissions from Three Gorges Reservoir of China. Biogeosciences 2013, 10, 1219–1230. [Google Scholar] [CrossRef]
  39. Zhou, S.; He, Y.; Yuan, X.; Peng, S.; Yue, J. Greenhouse gas emissions from different land-use areas in the Littoral Zone of the Three Gorges Reservoir, China. Ecol. Eng. 2017, 100, 316–324. [Google Scholar] [CrossRef]
  40. Xu, Z.; Cai, X.; Yin, X.; Su, M.; Wu, Y.; Yang, Z. Is water shortage risk decreased at the expense of deteriorating water quality in a large water supply reservoir? Water Res. 2019, 165, 114984. [Google Scholar] [CrossRef]
  41. Li, Z.; Sun, Z.; Chen, Y.; Li, C.; Pan, Z.; Harby, A.; Lv, P.; Chen, D.; Guo, J. The net GHG emissions of the Three Gorges Reservoir in China: II. Post-impoundment GHG inventories and full-scale synthesis. J. Clean. Prod. 2020, 277, 123961. [Google Scholar] [CrossRef]
  42. Deb, K.; Pratap, A.; Agarwal, S.; Meyarivan, T. A fast and elitist multi-objective genetic algorithm: NSGA-II. IEEE Trans. Evol. Comput. 2002, 6, 182–197. [Google Scholar] [CrossRef]
  43. Zhou, Y.; Guo, S.; Chang, F.; Xu, C. Boosting hydropower output of mega cascade reservoirs using an evolutionary algorithm with successive approximation. Appl. Energy 2018, 228, 1726–1739. [Google Scholar] [CrossRef]
  44. Zhou, Y.; Chang, L.; Uen, T.; Guo, S.; Xu, C.; Chang, F. Prospect for small-hydropower installation settled upon optimal water allocation: An action to stimulate synergies of water-food-energy nexus. Appl. Energy 2019, 238, 668–682. [Google Scholar] [CrossRef]
  45. EPA. AVERT, U.S. 2017 National Weighted Average CO2 Marginal Emission Rate, Year 2016 Data; U.S. Environmental Protection Agency: Washington, DC, USA, 2017. Available online: https://www.epa.gov/energy (accessed on 25 August 2017).
  46. Jager, H.I.; Griffiths, N.A.; Hansen, C.H.; King, A.W.; Matson, P.G.; Singh, D.; Pilla, R.M. Getting lost tracking the carbon footprint of hydropower. Renew. Sustain. Energy Rev. 2022, 162, 112408. [Google Scholar] [CrossRef]
  47. Barros, N.; Cole, J.; Tranvik, L. Carbon emission from hydroelectric reservoirs linked to reservoir age and latitude. Nat. Geosci. 2011, 4, 593–596. [Google Scholar] [CrossRef]
  48. Kosten, S.; Van, S.; Mendonça, R.; Paranaíba, J.; Roland, F.; Sobek, S.; Hoek, J.; Barros, N. Extreme drought boosts CO2 and CH4 emissions from reservoir drawdown areas. Inland Waters 2018, 8, 329–340. [Google Scholar] [CrossRef]
  49. Keller, P.S.; Catalán, N.; von Schiller, D.; Grossart, H.-P.; Koschorreck, M.; Obrador, B.; Frassl, M.A.; Karakaya, N.; Barros, N.; Howitt, J.A.; et al. Global CO2 emissions from dry inland waters share common drivers across ecosystems. Nat. Commun. 2020, 11, 2126. [Google Scholar] [CrossRef]
  50. Aguirrezabala, T.; Gonzalez, R.; Cervantes, F.; Thalasso, F. Overall spatiotemporal dynamics of greenhouse gasses and oxygen in two subtropical reservoirs with contrasting trophic states. Water Res. 2021, 196, 117056. [Google Scholar] [CrossRef]
  51. Bastviken, D.; Cole, J.; Pace, M.; Tranvik, L. Methane emissions from lakes: Dependence of lake characteristics, two regional assessments, and a global estimate. Glob. Biogeochem. Cycles 2004, 18, GB4009. [Google Scholar] [CrossRef]
  52. Wik, M.; Thornton, B.; Bastviken, D.; Uhlbäck, J.; Crill, P. Biased sampling of methane release from northern lakes: A problem for extrapolation. Geophys. Res. Lett. 2016, 43, 1256–1262. [Google Scholar] [CrossRef]
  53. Resende, J.; Mannich, M.; Fernandes, C. Calibration of a management-oriented greenhouse gas emission model for lakes and reservoirs under different distribution of environmental data. Sci. Total Environ. 2020, 734, 138791. [Google Scholar] [CrossRef] [PubMed]
  54. Rust, F.; Bodmer, P.; Giorgio, P. Modeling the spatial and temporal variability in surface water CO2 and CH4 concentrations in a newly created complex of boreal hydroelectric reservoirs. Sci. Total Environ. 2022, 815, 152459. [Google Scholar] [CrossRef] [PubMed]
  55. Harrison, J.; Prairie, Y.; Mercier, S.; Soued, C. Year-2020 global distribution and pathways of reservoir methane and carbon dioxide emissions according to the greenhouse gas from reservoirs (G-res) model. Glob. Biogeochem. Cycles 2021, 35, e2020GB006888. [Google Scholar] [CrossRef]
  56. Prairie, Y.; Mercier, S.; Harrison, J.; Soued, C.; Giorgio, P.; Harby, A.; Harrison, J.; Mercier-Blais, S.; Serça, D.; Sobek, S.; et al. A new modelling framework to assess biogenic GHG emissions from reservoirs: The G-res tool. Environ. Model. Softw. 2021, 143, 105117. [Google Scholar] [CrossRef]
  57. He, W.; Zhang, X.; Zhang, J.; Xu, H.; Zhou, H. Regulating outflow temperature for multi-objective operation of cascade reservoirs: A case study. Renew. Energy 2023, 211, 155–165. [Google Scholar] [CrossRef]
  58. Xie, Y.; Guo, S.; Zhong, S.; He, Z.; Liu, P.; Zhou, Y. Optimal allocation of flood prevention storage and dynamic operation of water levels to increase cascade reservoir hydropower generation. Renew. Energy 2024, 228, 120676. [Google Scholar] [CrossRef]
  59. Stevens, K.A.; Tang, T.; Hittinger, E. Innovation in complementary energy technologies from renewable energy policies. Renew. Energy 2023, 209, 431–441. [Google Scholar] [CrossRef]
  60. Wu, Y.; Liao, S.; Liu, B.; Cheng, C.; Zhao, H.; Fang, Z.; Lu, J. Short-term load distribution model for cascade giant hydropower stations with complex hydraulic and electrical connections. Renew. Energy 2024, 232, 121067. [Google Scholar] [CrossRef]
  61. Yang, S.; Wei, Y.; Chen, J.; Wang, Y.; Liang, R.; Li, K. Multi-objective optimization and coordination of power generation, ecological needs, and carbon emissions in reservoir operation. Water Resour. Manag. 2023, 38, 123–136. [Google Scholar] [CrossRef]
  62. Chatterjee, P.; Chakraborty, S. A comparative analysis of VIKOR method and its variants. Decis. Sci. Lett. 2016, 5, 469–486. [Google Scholar] [CrossRef]
  63. Almeida, R.; Shi, Q.; Gomes-Selman, J.; Wu, X.; Xue, Y.; Angarita, H.; Barros, N.; Forsberg, B.; Villacorta, G.; Hamilton, S.; et al. Reducing greenhouse gas emissions of Amazon hydropower with strategic dam planning. Nat. Commun. 2019, 10, 4281. [Google Scholar] [CrossRef] [PubMed]
Figure 1. The locations of seven mega reservoirs in the Hanjiang River basin of China.
Sustainability 17 02770 g001
Figure 2. The multi-objective optimization framework of joint drawdown operation of mega reservoirs. (a) Joint drawdown operation model. (b) VIKOR-based multi-criteria decision-making analysis.
Sustainability 17 02770 g002
Figure 3. Pareto frontier across three objectives (O1–O3) for the multi-objective optimization case based on three hydrological scenarios (wet, normal, and dry) in the drawdown period (December to next May). O1: Minimization of the carbon emissions (CEs) of seven mega reservoirs. O2: Maximization of the hydropower generation (PG) of seven mega reservoirs. O3: Maximization of the water release (WR) of seven mega reservoirs. SOP stands for standard operation policy.
Sustainability 17 02770 g003
Figure 4. Competition between objectives in pairs under the dry scenario. The optimal solution was selected by the VIKOR-based multi-criteria decision-making method. (a) O2 versus O3, (b) O1 versus O2, (c) O1 versus O3. O1: Minimization of the carbon emissions (CEs) of seven mega reservoirs. O2: Maximization of the hydropower generation (PG) of seven mega reservoirs. O3: Maximization of the water release (WR) of seven mega reservoirs. SOP is the standard operation policy.
Sustainability 17 02770 g004
Figure 5. Comparison between NSGA-II’s optimal solution and the standard operation policy’s (SOP) outcome based on four evaluation indicators (ad).
Sustainability 17 02770 g005
Figure 6. Drawdown operation processes of mega reservoirs (ag) using the optimal solution NSGAII and the outcome from SOP under the dry scenario. SOP stands for standard operation policy.
Sustainability 17 02770 g006
Table 1. Characteristics of seven mega reservoirs of the Hanjiang River, China.
ReservoirBasin Area
(km2)
Normal Water Level
(m)
Total Storage
(106 m3)
Flood-Limited Water Level
(m)
Dead Water Level
(m)
Dead Storage
(106 m3)
Installed Capacity
(MW)
Output CoefficientFunctions Besides Flood Control and Power Generation
Shiquan (SQ)23,4004103244054001402258.5Ecological water supply
Ankang (AK)35,700330258532530511138508.4Ecological water supply
Pankou (PK)89503551970347.63308505007.9Ecological water supply
Huanglongtan
(HLT)
11,140247787.2247226344.15107.6Ecological water supply
Danjiangkou
(DJK)
95,20017029,050160/163.514512,6909007.6Water supply
Yahekou
(YHK)
3030179.51220175.7160180147.6Ecological water supply
Sanliping (SLP)6497416472403/412392262708.5Ecological water supply
Table 2. Improvement rates of benefit indicators and reduction rates of cost indicators.
ScenarioIndicatorsTypeImprovement Rate (%) aReduction Rate (%) b
Wet yearCarbon emission (GgCO2e)Cost5.6
Water release (108 m3)Benefit6.2
Hydropower generation (108 kW·h)Benefit8.3
Carbon intensity (kgCO2e/MW·h)Cost12.8
Normal yearCarbon emission (GgCO2e)Cost5.4
Water release (108 m3)Benefit5.5
Hydropower generation (108 kW·h)Benefit6.8
Carbon intensity (kgCO2e/MW·h)Cost11.4
Dry yearCarbon emission (GgCO2e)Cost5.3
Water release (108 m3)Benefit5.6
Hydropower generation (108 kW·h)Benefit7.9
Carbon intensity (kgCO2e/MW·h)Cost12.2
a  I m p r o v e m e n t r a t e = I n d i c a t o r O p t i m a l s o l u t i o n I n d i c a t o r S O P I n d i c a t o r S O P × 100 % for benefit indictors. b  R e d u c t i o n r a t e = I n d i c a t o r S O P I n d i c a t o r O p t i m a l s o l u t i o n I n d i c a t o r S O P × 100 % for cost indicators.
Disclaimer/Publisher’s Note: The statements, opinions and data contained in all publications are solely those of the individual author(s) and contributor(s) and not of MDPI and/or the editor(s). MDPI and/or the editor(s) disclaim responsibility for any injury to people or property resulting from any ideas, methods, instructions or products referred to in the content.