Abstract
As a key initiative to integrate economic growth and green development in the era of the digital economy, the environmental effects of China’s Cross-border E-commerce Comprehensive Pilot Zone (CBEC-PZ) policy are not yet clear. Based on city-level data from 2014 to 2021 in China and leveraging the CBEC-PZ policy as a quasi-natural experiment, this study reveals that the CBEC-PZ policy has significantly enhanced local air quality, with particularly pronounced effects in eastern regions. While the policy did not degrade air quality in surrounding areas, spatial correlations of air quality levels among regions were observed due to atmospheric circulation dynamics. These findings underscore the importance of emphasizing regional coordination in green development within urban governance frameworks. The CEBC-PZ promotes the transformation of the energy structure and the improvement of air quality through reverse innovation, an ecological competitive advantage, and an agile governance mechanism. It is recommended to help synergize sustainable development and high-quality development in terms of strengthening reverse innovation and institutional innovation, expanding cross-regional synergistic governance, and deepening digital-real integration.
1. Introduction
Air pollution is a serious challenge for cities, especially in developing economies where rapid industrialization and urbanization are exacerbating environmental pressures [1]. According to the World Bank, the health costs of air pollution amount to at least USD 8.1 trillion, accounting for over 6% of global GDP, with 95% of these losses borne by developing countries. China recognized the importance of air pollution management earlier, and the report of the 20th Party Congress noted that “promoting the greening and decarbonization of economic and social development is a key link to achieving high-quality development” and that it is necessary to “synergistically push forward carbon reduction, pollution reduction, greening and growth”. As China’s economic and social development enters the stage of high-quality development with accelerated greening and low carbonization, how to improve air quality under the constraints of the economic growth target and “carbon peak” and “carbon neutrality” (referred to as the “dual-carbon”) targets and how to improve air quality and promote the development of the environmental economy are key issues.
The rapid development of cross-border e-commerce (CBEC) has transformed global trade patterns, driven economic integration and industrial transformation [2,3], and provided a new impetus to reduce industrial pollution [4]. China’s timely launch of CBEC-PZs is an innovative strategy that promotes economic growth while aligning with Sustainable Development Goals. The CBEC-PZ policy demonstrates robust cross-departmental ecological synergy, encompassing multiple coordinated objectives, including digital infrastructure construction, green sustainability concept leadership, and convenient public services, whereas traditional policies typically focus on a single domain. Amid the global proliferation of Internet technology and the evolution of consumption patterns, the CBEC-PZ policy acts as a catalyst for corporate digital transformation and industrial restructuring. By accelerating the shift from China’s traditional heavy industries to modern service-oriented sectors, it reduces reliance on non-renewable energy sources, drives energy structure optimization, and aligns with the principles of environmental economics in the digital era. The CBEC-PZ policy exemplifies how strategic initiatives can harmonize economic modernization with sustainable development. However, while the economic benefits of the policy have been widely recognized, limited attention has been paid to its environmental impacts, especially on urban air quality.
Although the assessment of the environmental effects of the CBEC-PZ policy has been very limited, there have been studies that empirically tested the effects of CBEC, a digital trade mode, and provide insights for this paper to explore the environmental impacts of the CBEC-PZ policy. As the world’s largest e-commerce market, China’s rapid expansion of CBEC has drawn attention to its environmental externalities. Some scholars have argued that digital trade can promote green innovation and improve resource efficiency [5], while others have emphasized the risk of environmental degradation associated with increased energy consumption [6]. These contrasting perspectives highlight the need for empirical tests to determine the net impact of the CBEC-PZ policy on air quality. Furthermore, it is crucial to explore the role of sustainable natural resources in promoting sustainable cities. However, due to the lack of city-level energy consumption data in China, few studies have empirically examined the structure of energy consumption at the city level. This paper refers to the city-level renewable and non-renewable resource consumption data compiled by Yang et al. in 2024 [7] and utilizes a Multi-period Difference-in-Differences model (multi-period DID) to explore the structural effects of the CBEC-PZ policy for the first time and make recommendations for the promotion of sustainable urban construction by the CBEC-PZ policy from the perspectives of the energy structure and the sustainable development of the city, thus filling this research gap. Moreover, as the CBEC-PZ policy was rolled out in batches across pilot cities and air quality is often influenced by atmospheric circulation and wind patterns—thereby generating spatial effects—this study further employs spatial econometric models to examine the spatial effects of the CBEC-PZ policy. Additionally, a Difference-in-Difference-in-Difference (DDD) model is applied to investigate the heterogeneous performance of the policy across different regions in China.
Specifically, this paper has three main marginal contributions. First, given China’s vital impact on world environmental–economic processes and CBEC, helping China’s transition to clean energy through the development of digital trade is a crucial contribution to bolstering worldwide economic sustainability. The CBEC-PZ policy is an important environmental–economic initiative for China to integrate its economic development with the construction of sustainable cities, and understanding whether the policy can promote urban energy structure transformation and reduce pollution emissions will provide an important experiential reference for developing countries to realize economic transformation and high-quality development. Second, from a theoretical perspective, this study proposes three core mechanisms through which the CBEC-PZ policy affects urban air quality. Competitive pressures triggered by the policy stimulate reverse innovation, prompting firms to develop cost-effective solutions to reduce pollutant emissions [8]. The CBEC-PZ policy helps to build a complete industry chain and ecosystem of CBEC relying on digital technology, thus promoting the formation of an eco-competitive advantage. Through institutional innovation, management innovation, service innovation, and synergistic development, the policy has effectively cracked the deep-rooted conflicts and institutional difficulties in CBEC development, leading to an agile governance mechanism that enables local governments to strengthen environmental monitoring and implement stricter pollution control [9]. Together, these mechanisms suggest that the CBEC-PZ policy can be a catalyst for improving the urban environment. Third, methodologically, this study employs an integrated analytical framework combining multi-period DID, spatial econometric models, and the DDD approach to systematically assess the impacts of the CBEC-PZ policy on air quality in both targeted cities and surrounding regions. Innovatively leveraging city-level data, it evaluates the role of the policy in catalyzing clean energy transitions and the construction of sustainable cities. Additionally, this research rigorously examines spatial heterogeneity in policy outcomes, aiming to elucidate the interplay between governance mechanisms, innovation-driven strategies, and environmental sustainability in shaping a low-carbon urban future.
The rest of this paper is organized as follows. Section 2 reviews the relevant literature, focusing on three key theoretical frameworks: reverse innovation, eco-competitive advantage, and agile governance. Section 3 and Section 4 provide an overview of the data sources used in this study, the research design, and the analysis of the results. Section 5 is an extended analysis that further explores the spatial effects of the CBEC-PZ policy using spatial econometric modeling, while Section 6 presents feasible policy recommendations and an outlook on future research in light of the findings.
2. Literature Review
2.1. Agile Governance Effects Driven by Institutional Innovation
Agile governance is a new governance model designed to respond to complex, uncertain, and rapidly changing environments. Its core principles include rapid perception, flexible response, multi-party participation, and continuous coordination. It emphasizes collaboration and co-governance among different actors, such as government, markets, and society. By optimizing governance structures and processes, agile governance improves the efficiency of policy implementation and is better able to adapt to the evolving social needs of emerging industries [10]. Agile governance in environmental management involves the use of digital technologies, data, and innovative policy tools to drive decision-making to achieve the Sustainable Development Goals (SDGs). These approaches are increasingly being used to address the environmental challenges posed by rapid industrialization, urbanization, and e-commerce expansion. For example, agile governance enables local governments to dynamically adjust environmental policies, set up real-time emission monitoring systems, and facilitate cooperation among stakeholders [11].
The CBEC-PZ policy is a practical application of agile governance principles in China [12]. The expansion of CBEC activities has brought about tremendous environmental pressure, especially air pollution caused by logistics and transportation. The core of the CBEC-PZ policy lies in policy experimentation and institutional innovations, such as customs clearance facilitation. These institutional innovations have empowered and driven the green transformation of trade models, reducing traditional foreign trade activities characterized by high pollution and energy consumption. Simultaneously, by optimizing supply chain efficiency, promoting clean energy applications, and implementing localized logistics layouts, they have effectively decreased non-renewable energy consumption and pollutant emissions, thereby contributing to improved air quality. The CBEC-PZ policy also forces enterprises to adopt more efficient and low-carbon operating models by connecting to international standards and introducing foreign investment. It integrates agile governance mechanisms through institutional and management innovation to mitigate environmental challenges and promote sustainable urban development. This paper will discuss how agile governance mechanisms affect urban air quality from three perspectives: data-driven environmental monitoring, adaptive policy implementation, and stakeholder collaboration.
Data-driven decision-making is at the heart of agile governance, enabling the real-time monitoring and assessment of environmental performance [13]. The CBEC-PZ policy employs advanced digital technologies, such as the Internet of Things (IoT), big data analytics, and Geographic Information Systems (GISs), to monitor emissions from logistics and industrial activities in real time. These tools enable decision-makers to identify pollution points and implement targeted interventions. For example, major cities in CBEC-PZs have deployed IoT-based air quality sensors to monitor real-time pollution levels. These sensors provide data on pollutants such as PM2.5, SO2, and NOX, enabling local governments to track emissions during e-commerce logistics operations [14]. Big data analytics can identify cyclicality in emissions behavior (e.g., pollution peaks during high-demand holidays such as China’s 11.11 shopping festival or Black Friday) [15,16]. Such data insights allow policymakers to dynamically adjust regulatory measures, such as traffic control or industry entry standards, to reduce pollution emissions during that period. Other examples include restricting the use of high-emission vehicles during peak pollution periods or encouraging the use of low-carbon transportation alternatives. Empirical studies have shown that data-driven environmental monitoring is very effective in improving urban air quality. For example, the implementation of digital monitoring systems in CBEC-PZ cities such as Hangzhou and Shenzhen resulted in significant reductions in PM2.5 concentrations, as local governments were able to impose stricter pollution controls on logistics companies [17,18].
Agile governance mechanisms emphasize flexibility in policy design and implementation, enabling governments to respond quickly to emerging environmental challenges. In the context of the CBEC-PZ, adaptive policies include dynamic pricing of pollution permits, tiered subsidies for green logistics technologies, and real-time adjustments to environmental regulations. Local governments can dynamically adjust these standards based on air quality data, providing economic incentives to companies that adopt cleaner energy sources [19,20]. This adaptive approach ensures that government regulations remain effective in reducing emissions while minimizing disruptions to the e-commerce supply chain. Furthermore, the CBEC-PZ policy synergizes with carbon emission trading (CET) market policies to dynamically adjust carbon emission costs in real time through a responsive carbon pricing mechanism. During periods of high air pollution, the cost of carbon emissions increases, thus providing a financial incentive for logistics companies to reduce their environmental impacts. Studies have shown that this mechanism significantly reduces carbon emissions from transportation and warehousing activities and contributes to improved urban air quality [21].
Collaboration among stakeholders is another hallmark of agile governance. The CBEC-PZ framework facilitates collaboration among local governments, e-commerce platforms, logistics companies, and research institutions to address environmental challenges. For example, local governments in CBEC-PZ cities have worked closely with e-commerce giants such as Alibaba and JD.com to develop sustainable logistics solutions. These collaborations have led to the adoption of environmentally friendly packaging materials, the optimization of distribution routes to minimize fuel consumption, and the sharing of warehousing facilities to reduce emissions from transportation [22]. In addition, research institutes and Non-Governmental Organizations (NGOs) play a critical role in assessing the environmental impacts of CBEC activities and recommending policy improvements. For example, a recent study by the China Academy of Environmental Planning (CAEP) emphasizes the need for greater investment in green infrastructure, such as EV charging stations and renewable-energy-powered warehouses, to support the CBEC-PZ policy [23].
Empirical studies provide strong evidence of the positive impact of agile governance mechanisms on urban air quality under the CBEC-PZ framework. For example, a quasi-natural experiment in 12 pilot cities found that the CBEC-PZ policy reduced PM2.5 concentrations by an average of 15% over three years, with the largest reductions occurring in cities with strong data-driven monitoring systems and adaptive policies [24]. In addition, cities that fostered close collaboration among stakeholders achieved greater reductions in NOX and SO2 emissions than cities that relied solely on top-down regulations [25]. These findings emphasize the importance of incorporating agile governance mechanisms into environmental policies to address the complex challenges posed by CBEC. Accordingly, we hypothesize the following:
H1:
The CBEC-PZ policy can improve regional air quality.
2.2. Reverse Innovation Effects of CBEC-PZs
Reverse innovation is the process by which innovations initially developed in resource-limited environments in emerging markets are later adopted and diffused in developed markets. This concept challenges the traditional “trickle-down” innovation paradigm, wherein innovations typically flow from developed to developing economies. Reverse innovation emphasizes the use of local resource endowments and idiosyncrasies to address global challenges [26,27], and its key features include the following: (1) cost-effectiveness: developing affordable solutions without compromising quality; (2) accessibility: ensuring that solutions are adaptable and inclusive across socio-economic boundaries. Reverse innovation plays a crucial role in environmental governance, i.e., addressing global challenges such as urban air pollution through resource-efficient and sustainable innovation [28,29].
China’s CBEC-PZ policy, which is based on promoting CBEC development, facilitates the development and diffusion of green technologies and equipment by facilitating interfaces between pilot cities and global markets, providing an ecosystem that fosters reverse innovation. This policy enables companies to employ reverse innovation mechanisms to positively impact urban air quality through targeted strategies. The mechanism primarily works by compelling innovation via alignment with international standards and guiding innovation through environmental regulations. CBEC-PZ cities typically exhibit a higher level of openness. Many Chinese companies have pushed themselves to conduct green technology R&D and optimize production processes in order to adapt to the high environmental standards of the international market, which in turn feeds back into the domestic market and creates an environmentally friendly economic model. For example, in order to adapt to the European market’s strict regulations on the carbon footprint of products, enterprises in CBEC-PZs have invested more funds in the research and development of low-carbon technologies or the use of clean energy, and such technologies are further applied to the domestic industrial chain, thereby promoting clean energy consumption and reducing overall pollution emissions. At the same time, the current non-tariff technical barriers set by the international community to the green technology standards or ecological footprints covered in imported products—green trade barriers—have increasingly become an important means for countries to seize the global market [30]. Therefore, enterprises that realize green technological innovation can not only realize sustainable competitive advantages [31] but also break green trade barriers, and once these barriers are broken, they will gain access to a broad market that is beyond the reach of enterprises in the same industry so as to obtain higher profits, make up for the initial green technology R&D capital investment, and promote the development and growth of green industry industries in CBEC-PZs. A robust body of research demonstrates that advancing investments in scientific innovation and prioritizing the development of energy-saving, emission-reduction, and renewable energy technologies significantly curtail industrial pollutants, which not only enhance environmental governance but also catalyze sustainable economic growth aligned with green economy principles [32,33,34].
In terms of environmental regulations driving innovation, CBEC-PZ cities guide energy structure transformation across the entire lifecycle of CBEC. With the advancement of modern Internet technologies, digital solutions are being applied to achieve energy conservation and emission reduction throughout all processes. Such external policies reshape market dynamics and return rates of investments in renewable energy utilization technologies, promoting clean energy innovation and China’s transition to an environmentally friendly economy. The Chinese government consistently prioritizes advancing global sustainable economic development as a key responsibility. China’s massive-scale CBEC market has spawned numerous innovative environmental regulatory practices that balance ecological protection with economic growth. These initiatives have catalyzed corporate innovations in operational management models and production technologies while driving the dissemination of such innovations to developed markets worldwide. In logistics, CBEC-PZs encourage the adoption of electric and automated delivery vehicles, which significantly reduces greenhouse gas and particulate emissions. Studies have shown that the adoption of electric vehicles (EVs) in logistics can reduce emissions in urban areas by 30% [35,36]. In warehousing, the CBEC-PZ policy encourages green warehousing innovations, such as the use of solar energy and sustainable materials for buildings, thereby reducing the carbon footprint of warehousing operations [37]. In addition, packaging is a major contributor to urban waste and air pollution and is an issue that must be addressed in the large Chinese CBEC market. The CBEC-PZ policy has led to the development of sustainable packaging solutions by encouraging reverse innovation. Companies in CBEC-PZs have adopted biodegradable materials for packaging, reducing landfill and incineration emissions [38]. Some pilot cities have enacted eco-packaging standards that mandate the use of reusable materials. Studies have shown that these standards can reduce packaging waste by 15–20% annually [39]. These products were initially designed to meet environmental requirements in the vast CBEC market, yet they also effectively address environmental challenges faced by both developed and developing countries. It has been shown that innovative products such as energy-efficient air conditioners and refrigerators have been diffused through CBEC, reducing energy consumption and carbon emissions [40]. Chinese photovoltaic products and waste-to-energy power generation technologies have entered European markets, significantly benefiting Europe’s green energy transition. At the consumer level, the pilot cities encourage consumers to participate in recycling programs through monetary incentives and awareness campaigns, which have been shown to be effective in reducing municipal packaging waste [41]. For example, the CBEC-PZ policy encourages enterprises to obtain green certification, thereby assuring consumers of the eco-friendliness of the products they purchase. Certified products tend to be in greater demand, thus promoting a market for green innovations focused on sustainable development [42]. With the development of modern Internet technology, China’s CBEC-PZs encourage the application of digital technology to CBEC to save energy and reduce emissions throughout the entire process. Such environmental regulations have fostered green innovations in China’s new energy technologies, photovoltaic systems, waste-to-energy power generation, and related fields while driving operational and management model innovations among CBEC enterprises. Ultimately, these advancements are channeled through CBEC—a critical global dissemination platform—to facilitate the outward diffusion of reverse innovation.
In summary, with the support of the CBEC-PZ policy, reverse innovation offers a practical and scalable approach to improving urban air quality. Through low-carbon logistics, sustainable packaging, and eco-friendly product innovation, the CBEC-PZ policy facilitates a two-way flow of renewable-energy-oriented green innovation, benefiting both emerging and developed markets simultaneously. Incorporating incentives for green reverse innovation into environmental governance strategies will help cities achieve environmentally and economically sustainable growth. Accordingly, we hypothesize the following:
H2:
The CBEC-PZ policy improves air quality by promoting the consumption of renewable energy in the region.
2.3. Eco-Competitive Advantage Based on Digitalization
Eco-competitive advantage refers to the sustainable value creation ability of system participants in the economic ecosystem that exceeds the traditional internal competitive advantage by integrating and coordinating external resources and partnerships. This advantage not only relies on the core competence of the system participants themselves but also emphasizes the synergistic effect with other participants in the ecosystem (suppliers, complementary enterprises, users, etc.) so as to realize multi-subject symbiosis in the dynamic environment. Compared with the unidirectional value transfer in the traditional value chain, the ecological competitive advantage is more dependent on the multi-directional interaction of the value network. Since the implementation of the CBEC-PZ policy, the government has regarded the construction of an open, shared, and mutually beneficial sustainable CBEC ecosystem as an important task and has built a multifaceted and synergistic CBEC industry chain and ecosystem through institutional innovation, management innovation, service innovation, and synergistic development. Furthermore, relying on the rapid development of technologies such as big data, IoT, and Artificial Intelligence (AI), CBEC-PZs have become an ecosystem linking many enterprises, related organizations, and users through digital technology. This ecosystem will achieve unprecedented efficiency in reducing traditional energy consumption, improving air quality, and advancing sustainable urban development, surpassing the capabilities of previous models.
The ecosystem breaks down the exclusivity and monopoly of each subject and reorganizes the way resources are allocated; this advantage is public in nature, and the extent to which enterprises benefit from the ecosystem depends on the efficiency with which they take advantage of the ecosystem’s advantages. Therefore, for CBEC-PZ enterprises in CBEC-PZs, the CBEC-PZ policy is public, but the key role of the policy is to generate a pervasive effect, and the enterprises within the scope of the pilot zone want to improve the efficiency of utilizing the pervasive advantages of the ecosystem so as to build their own core competitive advantages. At this point, the CBEC-PZ government’s environmental regulations have more traction and direction, and Porter and Linde argue that properly designed environmental regulations can stimulate innovation, increase efficiency, and create competitive advantages for firms by driving the adoption of cleaner technologies [43]. Environmental policies can stimulate innovation by internalizing environmental costs and creating market demand for green technologies [44]. The CBEC-PZ government facilitates corporate efforts to reduce traditional energy consumption and transition their energy structures by providing financial incentives, regulatory support, and international market access. For example, the CBEC-PZ encourages firms to develop low-emission technologies and cleaner production processes with R&D subsidies [45] and combines economic incentives with environmental objectives by encouraging firms to adopt low-carbon business models. Low-carbon business models prioritize the reduction in greenhouse gas and air pollutant emissions across all business activities, from product design to after-sales service [46]. By implementing green marketing strategies to promote environmentally friendly products and services, companies attract environmentally conscious customers [47]. These strategies often include carbon labeling, providing consumers with information on the carbon footprint of products, etc., thus encouraging sustainable consumption patterns. Companies that respond to these policies not only reduce their environmental impacts but also gain a competitive advantage in the international marketplace, where sustainability is increasingly emphasized [48]. As a result, companies in CBEC-PZs have a stronger incentive to invest in green technologies and reduce their consumption of traditional non-renewable energy sources, as they seek to differentiate themselves in the highly competitive international marketplace. These technologies typically improve urban air quality by reducing emissions of air pollutants such as sulfur dioxide (SO2), nitrogen oxides (NOx), and particulate matter (PM2.5) [45]. It has been shown that businesses adopting low-carbon business models under the CBEC-PZ policy significantly reduce emissions of air pollutants, including PM2.5 and volatile organic compounds (VOCs), which are major contributors to urban air pollution [45]. At the same time, adopting a low-carbon business model increases a company’s resilience to changes in environmental regulations and markets, ensuring a long-term competitive advantage [49]. Research shows that e-commerce companies operating within CBEC-PZs are more likely to adopt EVs and renewable-energy-powered warehouses, which significantly reduces their carbon footprint [50].
Modern digital technologies have significantly accelerated the digital integration and industrial transformation of traditional sectors. Leveraging the multiplier effect of data elements, their spatial independence and physical detachment enable the efficient circulation and allocation of resources. This facilitates the real-time intelligent monitoring and management of resource consumption while substantially reducing reliance on conventional chemical-based energy sources. At present, the construction of green industry chains and sustainable supply chains with digital technology has become an important element for pilot cities to coordinate economic development and green development and to form an ecological competitive advantage. Sustainable supply chain management integrates environmental considerations into procurement, production, distribution, and logistics to minimize the environmental impact of supply chain activities [51]. CBEC-PZs facilitate the adoption of sustainable supply chain management practices by providing companies with digital tools, data analytics platforms, and international trade networks that enable them to optimize supply chain operations, reduce waste, and lower emissions associated with cross-border logistics. For instance, under the CBEC-PZ policy, technologies like the IoT, sensors, and real-time data analytics are deployed to enable precision monitoring of energy, water, and raw material usage. Enterprises can leverage digital simulations to optimize energy-intensive processes (e.g., in steel and chemical industries), minimizing fossil fuel waste and reducing non-renewable resource consumption. In the construction sector, smart building systems powered by digital technologies dynamically adjust heating, lighting, and refrigeration energy usage, thereby decreasing reliance on coal and natural gas. The Hangzhou CBEC-PZ supports enterprises to optimize supply chain management using AI and blockchain technologies, reduce energy consumption in warehousing and logistics, and enable carbon emission monitoring through a digital platform. Research shows that e-commerce companies within the scope of the CBEC-PZ policy are more likely to adopt energy-efficient warehousing and transportation systems, thereby significantly reducing carbon emissions and improving urban air quality [44]. In addition, the digitization of the supply chain under the CBEC-PZ policy has improved transparency and traceability, enabling companies to monitor the environmental performance of the entire supply chain, which has provided incentives for suppliers and logistics companies to adopt more environmentally friendly practices, such as the use of biodegradable packaging materials and the optimization of transport routes, to reduce fuel consumption and emissions [45]. For example, Suqian City promotes the “CBEC+ industrial belt” model, which guides traditional manufacturing enterprises to optimize their production processes through data-driven optimization to reduce energy consumption and waste emissions per unit of output value. Transitioning to sustainable production and supply patterns not only reduces air pollution but also meets the growing demand of environmentally conscious consumers and complies with international trade regulations on carbon neutrality [50].
In addition, the CBEC-PZ eco-competitive advantage formed on the basis of digitization promotes green innovation cooperation among enterprises, especially introducing small and microenterprises (SMEs) into the green R&D process. Within the ecosystem relying on modern digital intelligence technology, enterprises are able to cooperate in green technology R&D at a lower cost and optimize the deployment of resources through digital technology. For example, the non-competitive nature of AI based on data elements reduces the cost of using green technologies for enterprises, and many SMEs are able to fulfill green visions that were originally difficult to realize due to cost constraints and achieve green technology introduction and technical cooperation with stronger ecosystem connectivity to realize green transformation. The profitability of green technologies has markedly increased, with their application scenarios becoming replicable and scalable. This dynamic revitalizes the green technology market, accelerates the transition of energy structures toward renewables, and reduces dependence on non-renewable energy sources. Some studies have shown that companies adopting green innovations can save costs by improving energy efficiency, reducing waste, and complying with international environmental standards, thus further strengthening their eco-competitive advantages [45]. Smart manufacturing driven by technological innovation can reduce PM2.5 emissions in Chinese cities [52]. Based on the CBEC-PZ ecosystem, which is widely linked to domestic and foreign resources, the advanced technology and technology spillover brought by FDI can improve the utilization of energy and resources and the cleanliness of production through the demonstration effect [53]. At the same time, the competition effect can stimulate enterprises in host countries to increase R&D investment, improve the level of clean technology innovation, and reduce energy consumption and pollutant emissions [54]. Therefore, the CBEC-PZ policy pulls the industrial chain from downstream to upstream, and upstream innovation leads the downstream, realizes an overall systematic effect, promotes green innovation, establishes an environmentally friendly resource allocation mode under the complementary effect of each main body, creates policy effects that reduce the consumption of traditional non-renewable resources, and eliminates the traditional crude negative externality development mode, which is totally dependent on the exclusive possession of a certain place to realize economic growth.
In conclusion, the ecological competitive advantage serves as the key mechanism linking the CBEC-PZ policy to urban air quality improvement. By fostering green innovation, enhancing supply chain sustainability, and cultivating low-carbon business models, the CBEC-PZ policy significantly reduces non-renewable resource consumption, decreases air pollutant emissions, and improves the economic–environmental performance of participating enterprises. This underscores the importance of integrating the ecological competitive advantage into CBEC-PZ policy considerations to achieve urban sustainability and environmental enhancement. Accordingly, we hypothesize the following:
H3:
The CBEC-PZ policy improves air quality by promoting the consumption of renewable energy in the region.
3. Data and Statistics
3.1. Data
3.1.1. CBEC-PZs
CBEC-PZs are pilot city areas representative of the comprehensive nature of CBEC, and the implementation of the policy is conducive to promoting the development of regional CBEC. Since 2015, China has gradually implemented the policy in all pilot cities, so this paper first adopts a multi-period DID method to assess the policy effect. Specifically, this paper constructs the policy shock dummy variable , where cities implementing the policy are assigned a value of 1 for the policy shock year and subsequent years, while cities not implementing the policy and in pre-implementation periods are assigned a value of 0. The confirmation of CBEC-PZs mainly comes from the Chinese government website, and the data are manually organized.
3.1.2. Air Quality Index Data
The main explanatory variable in this paper is the urban air quality index (AQI), which is derived from the daily AQI of each city in China published by the China Research Data Service Platform (CNRDS), and is averaged to obtain the average annual AQI value to measure urban air quality. The index takes into account the pollution levels of six pollutants: PM2.5, PM10, SO2, NO, CO, and O3. The AQI is calculated by determining the Individual Air Quality Index (IAQI) for each pollutant based on its concentration level, referencing the graded concentration thresholds outlined in China’s Ambient Air Quality Standards [55,56] (GB 3095-2012 and HJ633-2012). The daily AQI value is then derived by selecting the highest IAQI among the six monitored pollutants. An increase in AQI values indicates a rise in overall pollution levels. When the AQI is greater than 50, the air quality has some impact on the general public, and when the AQI is greater than 100, the city is facing different levels of pollution.
3.1.3. Renewable and Non-Renewable Resource Data
The structure of resource use is an important factor affecting regional air quality, but the lack of data on final energy consumption at the city level in China hinders the effective investigation of city-level energy policies in China. Yang et al. [6] compiled data on the structure of energy consumption at the city level in China in 2024. In order to further explore the role of CBEC-PZs in affecting air quality, this paper explores two types of energy consumption affected by CBEC-PZs: the final energy consumption of renewable and non-renewable resources at the city level derived by Yang et al. [6]. Renewable energy resources primarily include wind power, hydroelectric power, and solar energy in end-use consumption, while non-renewable resources mainly consist of coal, oil, natural gas, etc., in the final energy demand.
3.1.4. Socio-Economic Data
Due to data availability, this paper examines the policy effects on 156 cities from 2014 to 2021. In order to accurately identify the effects of the CBEC-PZ policy on regional air quality, this paper adds a series of city-level economic and social data as control variables, mainly from China’s Urban Statistical Yearbook and local statistical bureaus. Specifically, this paper uses the logarithm of GDP per capita to measure the level of regional economic development, the proportion of value added by the secondary industry in total value added to measure the regional industrial structure, the logarithm of the current year’s exports of goods to measure the level of regional trade, the logarithm of the number of patent applications to measure the level of regional innovation, the ratio of local education expenditures to local general budgetary expenditures to measure the degree of importance attached to regional education, the logarithm of total investment in fixed assets to measure the level of material capital investment, and the logarithm of the number of cell phone subscribers at the end of the year to measure the level of digitalization in the region. The definitions of the main variables and summary statistics are provided in Table 1 and Table 2, respectively.

Table 1.
Definitions of main variables.
Table 2.
Summary statistics.
4. Research Methodology
4.1. Modeling
The current empirical research literature on the effects of policy implementation generally adopts the DID model. This method distinguishes research subjects into an experimental group (areas where the policy is implemented) and a control group (areas where the policy is not implemented), and by comparing the changes in the results of the experimental and control groups before and after the implementation of the policy and by eliminating the influencing factors that change over time, as well as those that are unobservable, the effect of the policy is extracted from a number of factors so as to identify the net effect of the policy. However, the CBEC-PZ policy was not carried out at a certain point in time but has been implemented year by year in each pilot city since 2015, so there are multiple points in time in this study, and the traditional DID method cannot achieve an accurate estimation. In order to separate the effect of the CBEC-PZ policy from those of confounding factors and determine its impact on China’s air quality, this paper adopts a multi-period DID model, and the specific model setting is as follows:
where represents the city, represents the year, is the coefficient of the core explanatory variable to be estimated, are control variables, is the time fixed effect, is the individual fixed effect, and is the random disturbance term. The coefficient of the core explanatory variable represents the effect of the CBEC-PZ policy on air quality. In addition, this paper clusters the standard errors at the city level to control for the effects of autocorrelation and heteroskedasticity in the model.
In order to further explore the factors through which the CBEC-PZ affects regional air quality, this paper explores the compound effect of the CBEC-PZ and resource use structure from the perspectives of renewable and non-renewable resources so as to summarize the specific mechanism of action of the CBEC-PZ effect on air quality. Specifically, this paper incorporates an interaction term between the CBEC-PZ policy and the final energy consumption of renewable resources to measure the effect of the CBEC-PZ on renewable resources and incorporates an interaction term between the CBEC-PZ and the final energy consumption of non-renewable resources to measure the effect of the CBEC-PZ on non-renewable resources.
4.2. Empirical Analysis
In this study, the effect of the CBEC-PZ policy on urban air quality is analyzed in depth. The regression results are shown in Table 3. Model 1 contains control variables and introduces time and city fixed effects to ensure that the effect of the CBEC-PZ policy on air quality can be verified under stricter control conditions. The coefficient estimate for the CBEC-PZ policy is quantified as −0.0194 and was statistically significant at the 5% level, revealing a statistically significant negative association with the local AQI; H1 is proved. As mentioned earlier, the lower the regional AQI, the better the air quality of the region, so the results of Model 1 imply that the air quality level of the area is significantly improved and that the CBEC-PZ policy makes a positive contribution to the regional air quality.
Table 3.
Multi-period DID model regression results.
In order to further explore the specific mechanism of the role of the CBEC-PZ in air quality enhancement, this paper further incorporates the final energy consumption of renewable and non-renewable resources as a mechanism variable, and the results are shown in Table 3, Columns (2)–(3), respectively. In Model 2, it can be concluded that the coefficient estimate for the composite effect of the CBEC-PZ policy and regional renewable resource energy consumption is −0.0198, indicating that CBEC itself makes the business model of regional enterprises more dependent on renewable resources. Compared to traditional industries that rely on resources such as oil and coal, the digital attributes of CBEC lead to CBEC companies using more renewable resources, which significantly improves the local air quality. In addition, according to Model 3, it can be concluded that the coefficient estimate for the compound effect of the CBEC-PZ policy and the regional non-renewable resource energy consumption is −0.0233, which is significantly conducive to the improvement of the regional air quality, and the CBEC-PZ policy not only effectively promotes the optimization of the energy structure by promoting the use of renewable resources but also reduces the negative effect of non-renewable resource consumption on the air quality; H2 and H3 are proved. The observed outcomes can be attributed to the comprehensive approaches of the CBEC-PZ policy to fostering regional industrial ecosystems through institutional, management, and service innovations alongside synergistic development. By enhancing operational synergy among enterprises, advancing green logistics and supply chain practices, and implementing intelligent warehousing and automated distribution systems, the initiative effectively curtails dependence on traditional energy sources, streamlines operational processes, and minimizes redundant energy consumption. At the same time, through digital transformation, the CBEC-PZ has facilitated the transformation and upgrading of the heavy industrial sector to modern service industries, effectively reducing the dependence on traditional non-renewable resources for demand. However, this may raise another concern, that is, whether the CBEC-PZ will make the heavy industry sector move to neighboring areas, thus reducing the air quality level of neighboring areas. This paper incorporates the spatial effect model to further answer the above question in Section 5.
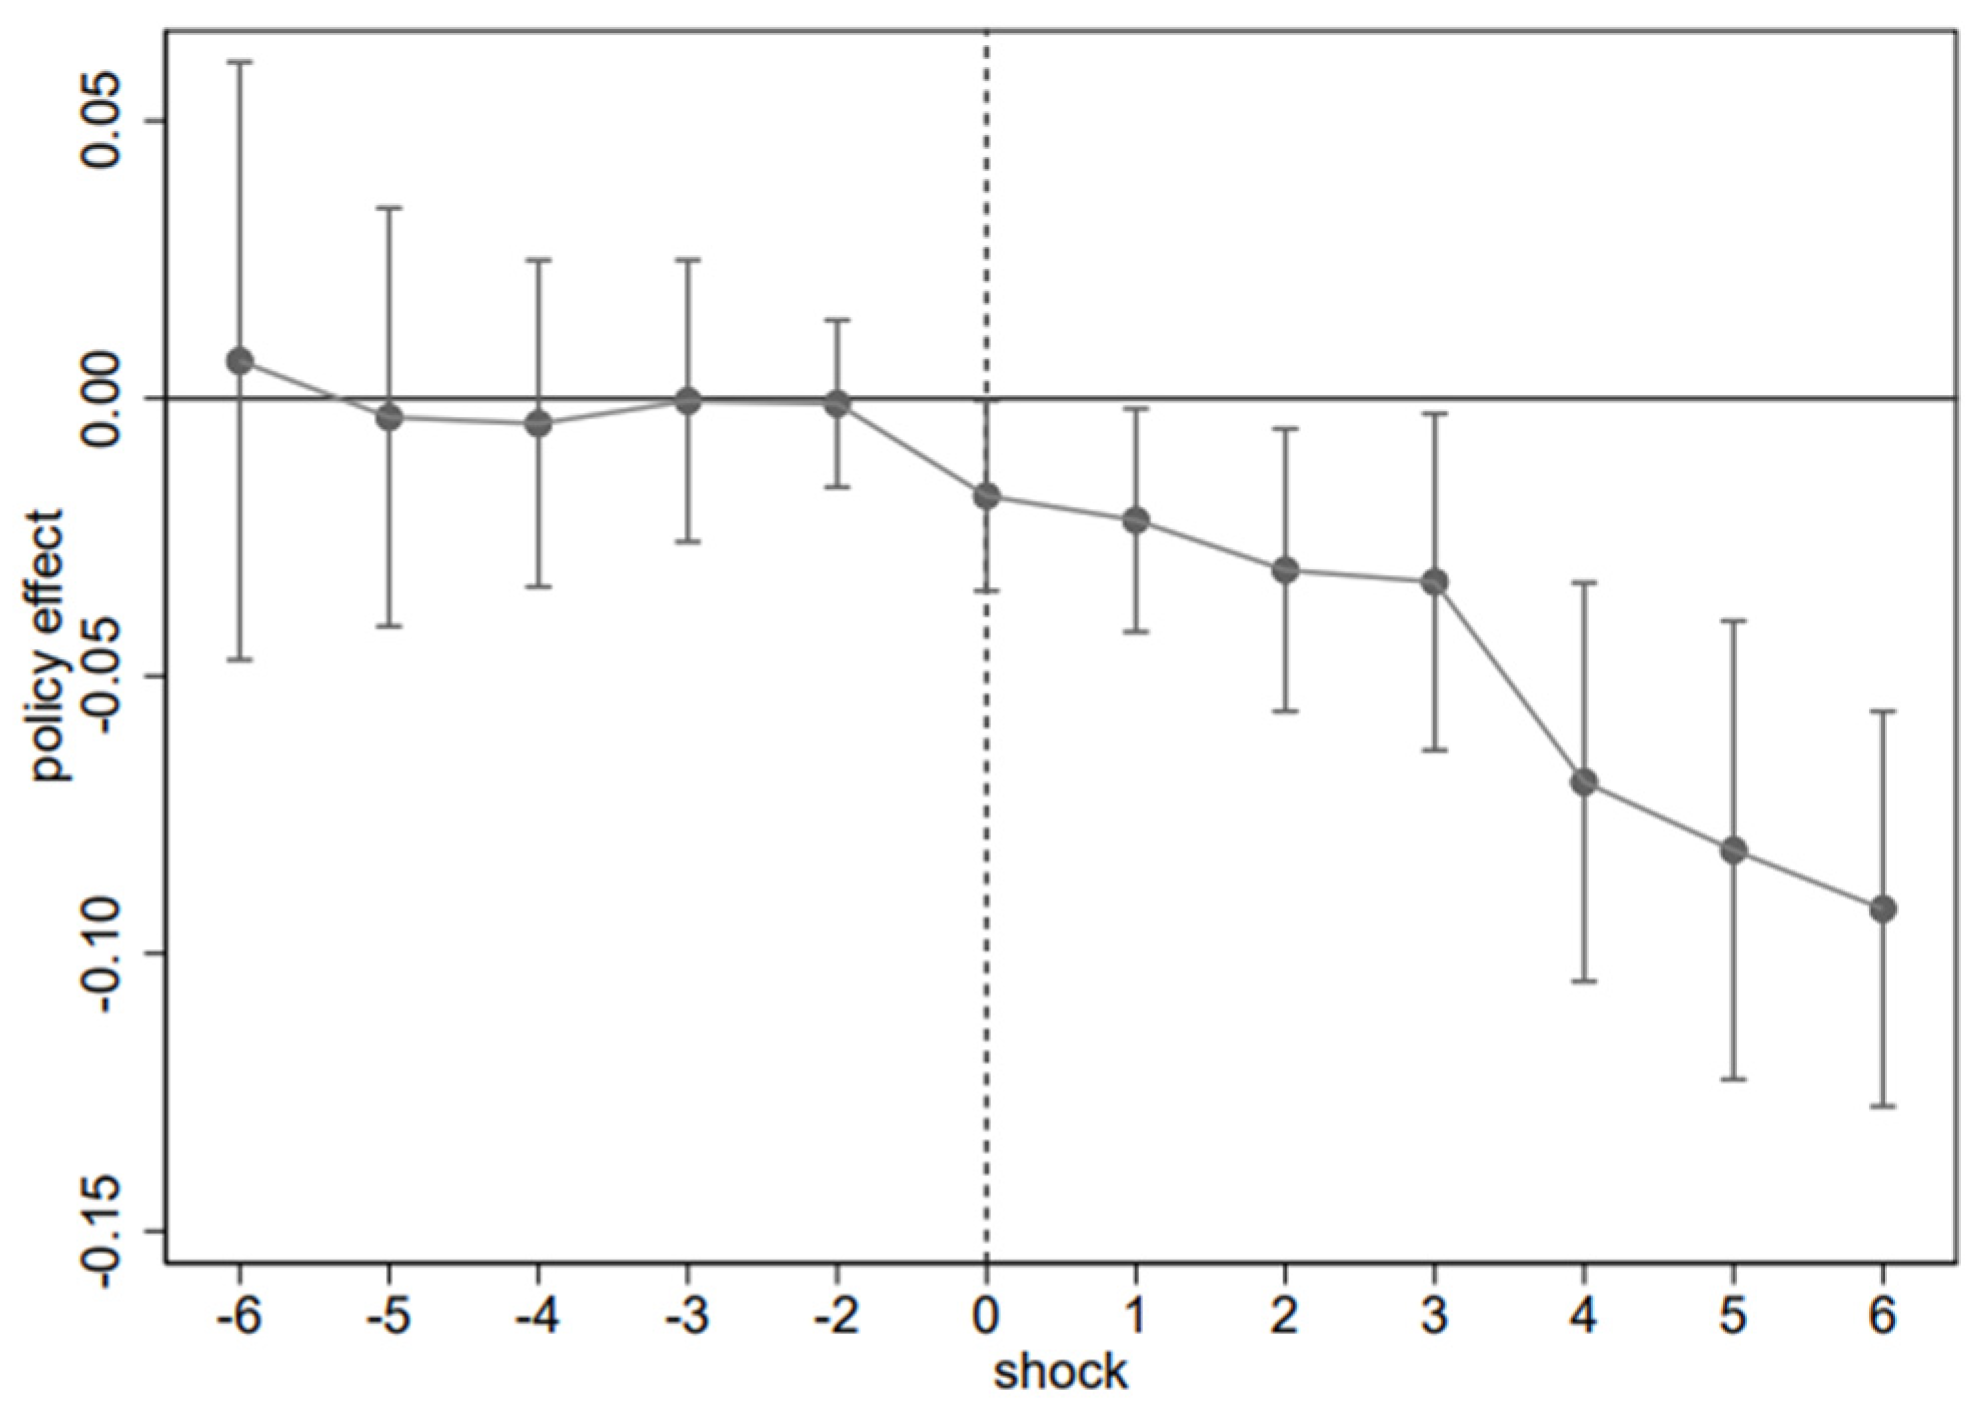
The key premise of applying the multi-period DID model for policy assessment is the parallel-trend assumption; i.e., the trends in air quality effects in pilot and non-pilot cities should be parallel without a significant difference before the implementation of the CBEC-PZ policy while showing a significant downward trend after its implementation. In this paper, the year before the implementation of the policy is used as the base period to re-estimate the policy effect, and the model is set as follows:
The results of the parallel-trend test on regional air quality are shown in Figure 1. It can be observed that the effect before the CBEC-PZ policy shock on air quality did not pass the significance test, while after the policy shock, the CBEC-PZ policy significantly reduced the regional air quality index, i.e., improved the regional air quality, which is in line with the conditions of the parallel-trend test.
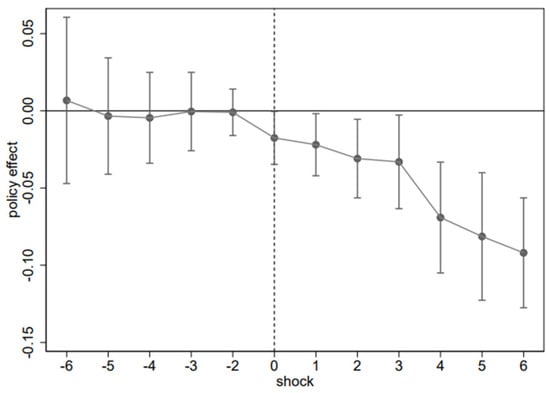
Figure 1.
Parallel-trend test.
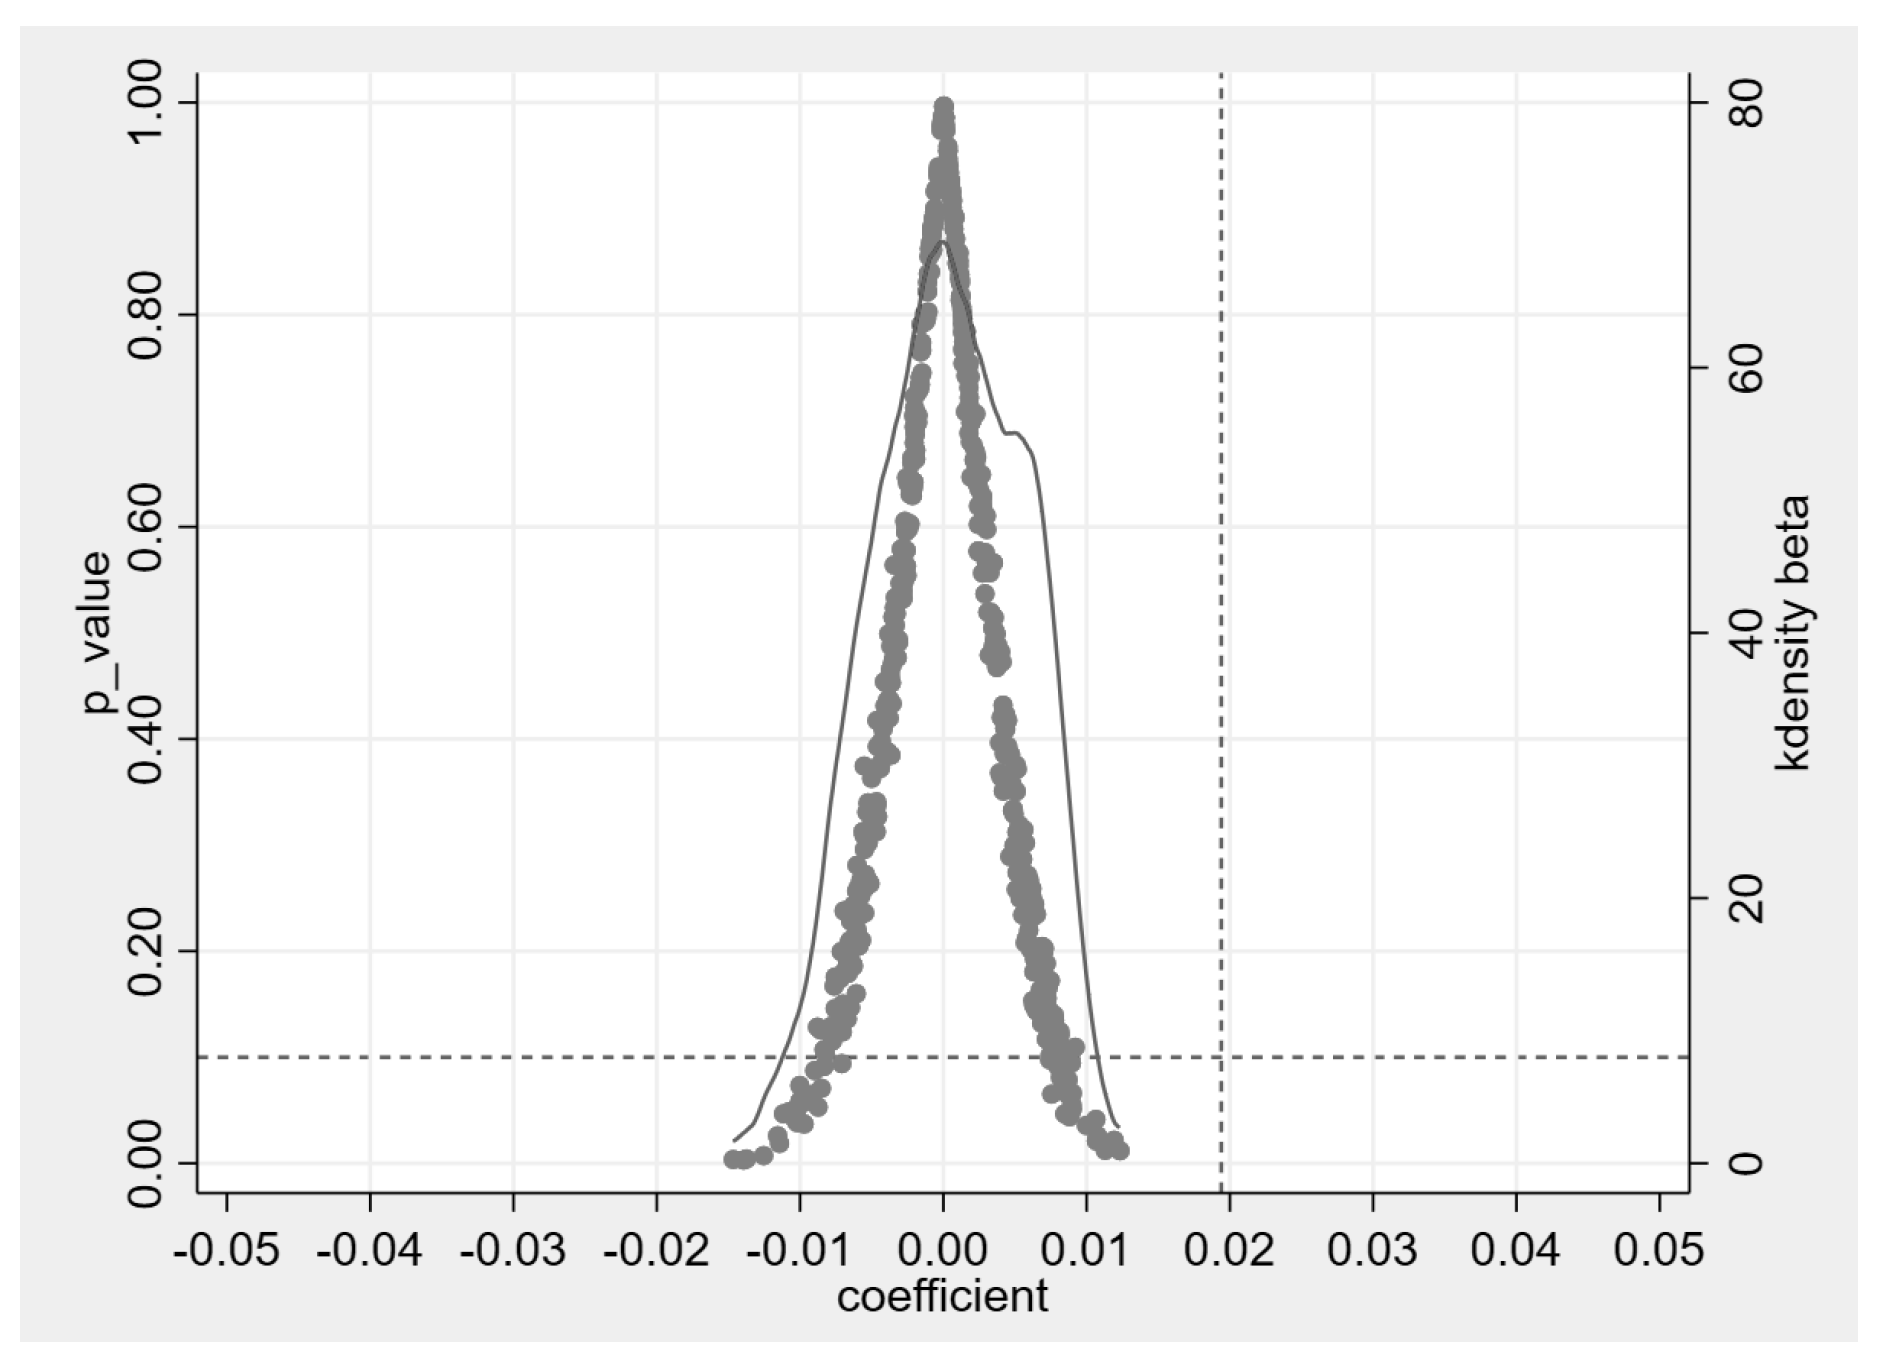
In the baseline regression part, this paper introduces city and time fixed effects to eliminate the endogeneity problem caused by differences in characteristics between cities, as well as time-dependent common shocks, in addition to the inclusion of numerous city-level control variables to exclude their effects on air quality. However, to further avoid the effects of other unobservable factors, this paper used a placebo test for further validation. Specifically, this paper randomly generated the experimental group and conducted 500 repetitions of Bootstrap sampling, and the results are shown in Figure 2. The estimated coefficients of the placebo test obey the normal distribution at x = 0, while the estimated coefficients of the actual treatment group are significantly different from those of the randomized treatment group, and the placebo test is passed.
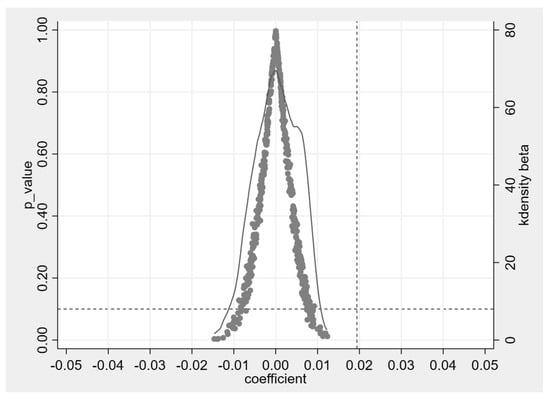
Figure 2.
Placebo test.
4.3. Heterogeneity Analysis
Regional economic development levels in China exhibit significant variation, with the easternmost city and the westernmost city in China being about 5000 km apart. These cities have great differences in endowment resources, industrialization, and environmental development levels. To enhance the precision of policy effect evaluation for the CBEC-PZ, this study employs a DDD approach to comparatively analyze its impacts across China’s regional divisions—specifically examining implementation disparities between eastern and central–western regions, as well as northern and southern cities of the Yangtze River. The specific model setting is as follows:
where distinguishes the pilot cities in CBEC-PZs, and is a dummy variable for eastern and central–western China, with a value of 1 for eastern China and 0 otherwise. In this model, the main focus is on the value of the coefficient . The DDD model for cities in the northern and southern Yangtze River is specified as follows:
where has the same meaning as in Equation (3). is a dummy variable for the northern and southern regions of the Yangtze River in China, with a value of 1 for northern cities of the Yangtze River and 0 otherwise. In this model, the main concern is the value of the coefficient .
From column (1) of Table 4, it can be concluded that the air quality enhancement effect of the CBEC-PZ is more obvious in eastern China, which may be due to the fact that policy support and infrastructure are relatively well developed in the eastern part of China, and the policy effect of the CBEC-PZ tends to be more obvious. At the same time, the eastern region has a better transportation base and innovation base, and the industrial structure has a relatively high proportion of high-tech industries and services, which is more conducive to industrial structure upgrading, thus reducing pollutant emissions. From column (2) of Table 4, we can conclude that there is no obvious difference between the policy effects of the CBEC-PZ in southern and northern cities of the Yangtze River, which is related to the relatively balanced development of China’s northern and southern regions.
Table 4.
DDD model regression results.
5. Expanded Analysis
As mentioned earlier, the establishment of a CBEC-PZ has the potential to cause the relocation of heavy industries and highly polluting industries to neighboring areas. In order to explore the spatial effects of China’s CBEC-PZs, this paper further utilizes spatial econometric modeling to analyze the impact of the CBEC-PZ on air quality. Since the spatial Durbin model (SDM) can simultaneously consider both spatial error and spatial lag effects, this paper firstly constructs an SDM model and, at the same time, employs a spatial lag model (SAR) as well as a spatial error model (SEM) for auxiliary estimation to test the robustness of the results. The SDM model’s specific settings are as follows:
The definitions of , , and remain consistent with the previous text; , , and are coefficients to be estimated; and denote control variables. Additionally, W stands for the spatial weight. In the SDM model, the coefficient of the core explanatory variable indicates the impact of the CBEC-PZ on local air quality; the coefficient of the variable indicates the impact of the CBEC-PZ on the air quality of the neighboring cities, reflecting the spatial spillover effect. In this paper, the spatial inverse distance weight matrix is constructed to carry out the spatial correlation test.
First, Moran’s I global spatial autocorrelation coefficient is used to reflect the degree of spatial dependence of air quality among Chinese prefectural-level cities, which is calculated as follows:
As can be seen from Table 5, the global Moran’s I values of air quality levels in prefecture-level cities in China are all significantly positive at the 1% level. This indicates that there is a significant spatial dependence of air quality levels in each prefecture-level city, so this paper further uses spatial econometric modeling to investigate the mechanism of air quality impacts in each city in China.
Table 5.
Global Moran test.
This paper plots Moran scatter plots of air quality levels in 2017 and 2020 for prefecture-level cities in China (Figure 3). In the Moran scatter plots, the majority of cities are in the first and third quadrants, which indicates significant clustering effects among cities with higher air quality levels, while those with lower levels also exhibit similar spatial aggregation tendencies.
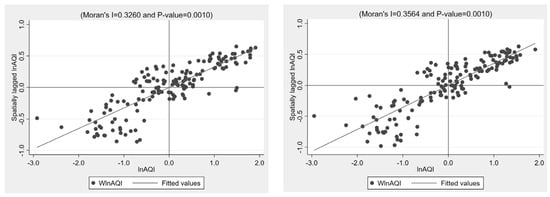
Figure 3.
Moran scatter plots of air quality levels in 2017 and 2020.
In this paper, the spatial and temporal double fixed-effects SDM model is used for the spatial effect test, and the SAR and SEM models are used for auxiliary regression; the results are shown in Table 6. Column (3) shows the regression results of the SDM model, and the estimated coefficient of the CBEC-PZ policy is −0.0179, which is significantly negative at the 1% level, indicating that the CBEC-PZ policy is conducive to improving local air quality. Moreover, within the spatial econometric framework, both the SAR model and SEM model specifications robustly confirm the treatment effects, yielding coefficient estimates of −0.0182 and −0.0205, respectively. These parameters demonstrate statistically significant negative associations at the 1% significance level, with the effect magnitudes aligning closely across spatial econometric models. Therefore, the above empirical findings collectively substantiate the robustness of the conclusion of Model 1, demonstrating that the CBEC-PZ policy implementation generates statistically significant improvements in ambient air quality within the target regions. Under the weight matrix, the policy coefficient is not significant; i.e., the CBEC-PZ policy does not have a significant spillover effect on neighboring regions, which does not result in the relocation of high-energy-consuming enterprises, and the CBEC-PZ policy has a significant advantage. However, the coefficient is significantly positive, indicating that the air quality of each region has a significant spatial correlation, and an improvement in the air quality index in this region will cause improvements in the air quality indices of neighboring regions. The reason for this is that when the concentration of pollutants in the region increases, the transmission of pollutants from the region to neighboring regions will also increase through atmospheric circulation and wind. Therefore, air quality management requires regional synergy to benefit the surrounding areas through the linkage effect of the ecosystem and further emphasizes the holistic and synergistic nature of air quality management.
Table 6.
Spatial regression results.
This paper further decomposes the spatial effects, and the results are shown in Table 7. In terms of direct effects, the regression coefficient of the CBEC-PZ policy is significantly negative, which indicates that the policy plays a significant role in enhancing the air quality level of the area. The indirect effect is not significant, indicating that China’s CBEC-PZs have a certain superiority and do not negatively affect the air quality of neighboring areas.
Table 7.
The decomposition of spatial effects in the spatial–temporal double-fixed-effects spatial Durbin model.
The regional energy consumption structure plays an important role in regional air quality, and interregional energy transfer is often carried out, resulting in spatial correlations between the region and neighboring regions. Therefore, this study further investigates whether the implementation of the CBEC-PZ policy in the region may lead to a “siphon effect”, absorbing renewable energy resources and their outputs from surrounding areas, thereby hindering their energy transition efforts. This paper further explores the spatial effect of the CBEC-PZ policy on the energy consumption structure using the SDM model, and the results are shown in Table 8. Observing Model 9, it can be concluded that the estimated coefficient for the compound effect of the CBEC-PZ policy and regional renewable energy consumption is −0.0184, which further verifies the conclusion based on Model 2 that the CBEC-PZ promotes the transformation of the business model of enterprises in the region, and energy consumption is more reliant on renewable resources, which significantly improves the local air quality. Meanwhile, the combined effect of the CBEC-PZ policy weighted by the spatial matrix and regional renewable energy consumption is not statistically significant. This indicates that the region’s renewable energy consumption has not negatively impacted the energy consumption structure of neighboring areas. Specifically, the increase in renewable energy consumption in this region has not reduced renewable energy usage in surrounding areas, nor has it affected their air quality. Furthermore, based on Model 10, the estimated coefficient for the combined effect of the CBEC-PZ policy and regional non-renewable energy consumption is −0.0151. This improvement in air quality further validates the conclusions drawn from Model 3. The CBEC-PZ policy establishes an integrated industrial–ecological system through multidimensional innovations in institutional frameworks, governance mechanisms, and service ecosystems. This synergistic model enhances operational efficiency by reducing reliance on conventional energy sources, drives industrial structural upgrading through digital transformation, optimizes production processes by eliminating redundant supply chain intermediaries, and accelerates energy transition through improved resource allocation efficiency.
Table 8.
Spatial regression results for energy structure.
6. Conclusions
This paper investigates the effects of China’s CBEC-PZ policy on urban air quality through the lenses of reverse innovation, eco-competitive advantage, and agile governance. Treating the CBEC-PZ as a quasi-natural experiment, we utilized city-level data from 2014 to 2021 to analyze its effects on local and neighboring cities’ energy structure transformation, pollution reduction, and air quality improvement while controlling for external city-level factors. For pilot cities, the CBEC-PZ policy significantly improved air quality, this effect is more pronounced in eastern China, with no significant differences observed between the northern and southern regions of the Yangtze River. The CBEC-PZ policy also enhances regional energy structure upgrading by increasing renewable energy consumption and decreasing non-renewable energy use, thereby improving air quality. For neighboring areas, the policy shows no adverse impact on air quality, confirming its effectiveness. However, due to atmospheric circulation, urban air quality exhibits inherent spatial dependence, highlighting the need for cross-regional ecosystems to achieve coordinated air quality management and energy consumption planning.
Based on our findings, we propose focusing on three key areas to enhance the CBEC-PZ initiative: strengthening reverse innovation and institutional innovation, expanding cross-regional synergistic governance, and deepening digital–real-world integration. These measures aim to accelerate the sustainable development of Chinese cities. First, the CBEC-PZ has demonstrated its ability to rapidly identify problems and implement solutions through agile governance mechanisms, leading to numerous innovative policies that harmonize economic growth with urban sustainability. The core driver of the CBEC-PZ lies in institutional innovation. To further advance sustainable development, it is essential to leverage the strengths of institutional innovation within the CBEC-PZ framework. This includes designing policies and institutions that incentivize green technology innovation and energy structure transformation. For instance, establishing “Green Technology Cooperation Demonstration Zones” and implementing initiatives such as “Green Innovation Enterprise Income Tax Credits” can encourage more enterprises to actively engage in green innovation. These efforts will facilitate the upgrading of industrial and energy structures, ultimately driving green development through systemic innovation.
Secondly, CBEC-PZ cross-regional collaborative governance should be enhanced, relying on the national-level big data platform, to build a blockchain environmental data-sharing system covering the targeted cities and the surrounding regions to ensure that the data are not tampered with and are synchronized in real time. This research reveals that the CBEC-PZ policy helps to improve air quality; therefore, the radiation effect of the CBEC-PZ policy should be enhanced, and the pilot coverage area should be expanded in an orderly manner. Considering the spatial interdependence of regional air quality, a comprehensive evaluation of each city’s location and resource endowments should be conducted to build cross-city eco-competitive advantages under the CBEC-PZ framework. This involves fostering intercity green innovation networks, facilitating the diffusion of policy and technological innovations to neighboring areas, and breaking down geographically driven technological barriers, particularly those related to green technologies. The government should create a resource-sharing platform for green development with a regionally coordinated development strategy; encourage small, medium, and microenterprises to participate in green innovation; and build a diversified, synergistic, and inclusive CBEC ecosystem. In terms of regional coordination, consideration could be given to allocating special funds from the “special funds for the prevention of air pollution” of the central government to support the purchase of environmental monitoring equipment in less developed regions in central and western China.
Finally, digital technology, with its high efficiency and wide connectivity, has become an important tool for promoting the accelerated implementation of the radiation effects of the CBEC-PZ policy and connecting domestic and international markets. Therefore, the “leverage effect” of digital technology should be fully utilized to deepen the combination of CBEC and digital technology in a sustainable development-oriented manner. In terms of logistics, a cross-border green supply chain platform driven by blockchain technology should be constructed, and a carbon footprint management system for the whole life cycle of “commodities–logistics–warehousing” should be set up in the comprehensive test area. Appropriate financial subsidies will be given to CBEC enterprises that adopt digital technology to optimize operation and management processes and reduce carbon emissions. At the same time, the role of market-based mechanisms will be strengthened to accelerate the linkage with the CET policy.
This paper provides factual support for the concept of developing an environmental economy in developing countries to build sustainable cities in the digital age. However, this study still has several shortcomings. First, although this paper extends the study of renewable energy consumption to the city level, it does not go down to the firm level due to data availability, which may affect the generalizability of the findings. Second, although Chinese CBEC-PZ cities were selected for observation, visualization techniques were not applied for geographic presentation. Therefore, future extended research at the firm level and further visualization are directions that can be advanced.
Author Contributions
Conceptualization, L.Q., D.H. and T.S.; data curation, L.Q., D.H. and T.S.; formal analysis, L.Q., D.H., Z.Z., T.S., L.M. and Z.W.; funding acquisition, L.Q. and D.H.; investigation, L.Q., D.H., Z.Z., T.S., L.M. and Z.W.; methodology, L.Q., D.H. and T.S.; project administration, L.Q., D.H. and T.S.; resources, L.Q., D.H. and T.S.; software, L.Q., D.H. and T.S.; supervision, L.Q., D.H., Z.Z. and T.S.; validation, L.Q., D.H., Z.Z. and T.S.; visualization, L.Q., D.H. and T.S.; writing—original draft, L.Q., D.H., Z.Z., T.S., L.M. and Z.W.; writing—review and editing, L.Q., D.H., T.S., Z.Z., L.M. and Z.W. All authors have read and agreed to the published version of the manuscript.
Funding
This research was funded by the General Project of Beijing Social Science Foundation in 2024, 24JCC093, and the National Social Science Foundation General Project “Research on Economic Effects of Trade Friction on Cross-border E-commerce under the COVID-19 Epidemic and Countermeasures”, 20BJL055.
Institutional Review Board Statement
Not applicable.
Informed Consent Statement
Not applicable.
Data Availability Statement
In this study, the data were mainly obtained from the China Research Data Service Platform, the China Government Network, Yang et al. (2024) [6], and regional statistical offices.
Acknowledgments
The authors made equal contributions to this research work. This research was funded by the General Project of Beijing Social Science Foundation in 2024, 24JCC093, and the National Social Science Foundation General Project “Research on Economic Effects of Trade Friction on Cross-border E-commerce under the COVID-19 Epidemic and Countermeasures”, 20BJL055.
Conflicts of Interest
The authors declare no conflicts of interest.
References
- Barbier, E. The Policy Challenges for Green Economy and Sustainable Economic Development. Nat. Resour. Forum 2011, 35, 233–245. [Google Scholar] [CrossRef]
- Begović, B. The Great Convergence: Information Technology and the New Globalization by Richard Baldwin. Panoeconomicus 2017, 64, 645–655. [Google Scholar]
- World Trade Organization. Digital Trade for Development; World Trade Organization: Geneva, Switzerland, 2023. [Google Scholar] [CrossRef]
- Song, L.; Yuan, J.; Li, T. Harmonizing digital trade for sustainable stride: Unveiling the industrial pollution reduction effect of China’s cross-border E-commerce comprehensive pilot zones. J. Environ. Manag. 2024, 370, 122834. [Google Scholar] [CrossRef]
- Sun, Y.; Gao, P.; Tian, W.; Guan, W. Green Innovation for Resource Efficiency and Sustainability: Empirical Analysis and Policy. Resour. Policy 2023, 81, 103369. [Google Scholar] [CrossRef]
- Heeks, R.; Ospina, A.V.; Foster, C.; Gao, P.; Han, X.; Jepson, N.; Schindler, S.; Zhou, Q. China’s Digital Expansion in the Global South: Systematic Literature Review and Future Research Agenda. Inf. Soc. 2024, 40, 69–95. [Google Scholar] [CrossRef]
- Yang, G.; Zhang, G.; Cao, D.; Gao, D.; Wang, X.; Yang, S.; Jiang, P.; Zha, D.; Shan, Y. A comprehensive city-level final energy consumption dataset including renewable energy for China, 2005–2021. Sci. Data 2024, 11, 738. [Google Scholar] [CrossRef]
- Alamelu, R.; Rengarajan, V.; Dinesh, S.; Nalini, R.; Shobhana, N.; Amudha, R. Sustainable Supply Chain Practices with Reverse Innovation in Healthcare Start-Ups—A Structural Equation Model (SEM) Approach. Mater. Today Proc. 2022, 52, 882–887. [Google Scholar] [CrossRef]
- Wasistiono, S.; Anggraini, W. Three Paradigms in Government (Good Governance, Dynamic Governance, and Agile Governance). Int. J. Kybernol. 2019, 4, 79–91. [Google Scholar]
- Xue, L.; Zhao, J. Toward Agile Governance: Exploring the Development and Regulatory Models of Emerging Industries. China Public Adm. 2019, 28, 28–34. [Google Scholar]
- Denfanapapol, S.; Setthasuravich, P.; Rattanakul, S.; Pukdeewut, A.; Kato, H. The Digital Divide, Wealth, and Inequality: An Examination of Socio-Economic Determinants of Collaborative Environmental Governance in Thailand Through Provincial-Level Panel Data Analysis. Sustainability 2024, 16, 4658. [Google Scholar] [CrossRef]
- Chen, N. Analysis of the Correlation Between Cross-Border E-Commerce and Economic Growth Based on Hierarchical Multilevel Gray Evaluation Model. J. Math. 2022, 2022, 8455404. [Google Scholar] [CrossRef]
- Bibri, S.E. Data-Driven Smart Eco-Cities and Sustainable Integrated Districts: A Best-Evidence Synthesis Approach to an Extensive Literature Review. Eur. J. Futures Res. 2021, 9, 16. [Google Scholar] [CrossRef]
- Barata, S.F.; Ferreira, F.A.; Carayannis, E.G.; Ferreira, J.J. Determinants of E-Commerce, Artificial Intelligence, and Agile Methods in Small-and Medium-Sized Enterprises. IEEE Trans. Eng. Manag. 2023, 71, 6903–6917. [Google Scholar] [CrossRef]
- Schlæger, J.; Zhou, J. Digital Environmental Monitoring in Urban China. In Greening China’s Urban Governance; Delman, J., Ren, Y., Luova, O., Burell, M., Almén, O., Eds.; ARI—Springer Asia Series; Springer Nature: Singapore, 2019; Volume 7, pp. 131–149. ISBN 9789811307393. [Google Scholar]
- Chen, S.; Zhao, X.; Zhou, L. Which Works Better? Comparing the Environmental Outcomes of Different Forms of Intergovernmental Collaboration in China’s Air Pollution Control. J. Environ. Pol. Plan. 2023, 25, 16–28. [Google Scholar] [CrossRef]
- Du, X.; Wang, N.; Lu, S.; Zhang, A.; Tsai, S.-B. Sustainable Competitive Advantage under Digital Transformation: An Eco-Strategy Perspective. Chin. Manag. Stud. 2024. ahead-of-print. [Google Scholar] [CrossRef]
- Kawa, A.; Pierański, B. Green Logistics in E-Commerce. LogForum 2021, 17, 183–192. [Google Scholar] [CrossRef]
- Neto, J.Q.F.; Bloemhof-Ruwaard, J.M.; van Nunen, J.A.; van Heck, E. Designing and Evaluating Sustainable Logistics Networks. Int. J. Prod. Econ. 2008, 111, 195–208. [Google Scholar] [CrossRef]
- Olasehinde-Williams, G.; Folorunsho, A. Environmental Policy, Green Trade and Sustainable Development in Europe: New Perspective on the Porter Hypothesis. Energy Environ. 2023. [Google Scholar] [CrossRef]
- Isik, M. Incentives for Technology Adoption Under Environmental Policy Uncertainty: Implications for Green Payment Programs. Environ. Resour. Econ. 2004, 27, 247–263. [Google Scholar] [CrossRef]
- Yang, Z.; Tauseef Ali, S.; Ali, F.; Sarwar, Z.; Khan, M.A. Outward Foreign Direct Investment and Corporate Green Innovation: An Institutional Pressure Perspective. S. Afr. J. Bus. Manag. 2020, 51, 12. [Google Scholar] [CrossRef]
- Antonioli, D.; Borghesi, S.; Mazzanti, M. Are Regional Systems Greening the Economy? Local Spillovers, Green Innovations and Firms’ Economic Performances. Econ. Innov. New Technol. 2016, 25, 692–713. [Google Scholar] [CrossRef]
- Escursell, S.; Llorach-Massana, P.; Roncero, M.B. Sustainability in E-Commerce Packaging: A Review. J. Cleaner Prod. 2021, 280, 124314. [Google Scholar] [CrossRef]
- Aldieri, L.; Carlucci, F.; Vinci, C.P.; Yigitcanlar, T. Environmental Innovation, Knowledge Spillovers and Policy Implications: A Systematic Review of the Economic Effects Literature. J. Cleaner Prod. 2019, 239, 118051. [Google Scholar] [CrossRef]
- Schuster, T.; Govindarajan, V.; Trimble, C. Reverse Innovation: Create Far from Home, Win Everywhere, Harvard Business Review Press, 2012. Manag. Int. Rev. 2014, 54, 277–282. [Google Scholar] [CrossRef]
- Bhatti, Y.A.; Ventresca, M. How Can ‘Frugal Innovation’ Be Conceptualized? 2013. Available online: https://papers.ssrn.com/sol3/papers.cfm?abstract_id=2203552 (accessed on 27 January 2025).
- Hart, S.L.; Christensen, C.M. The Great Leap: Driving Innovation from the Base of the Pyramid. MIT Sloan Manag. Rev. 2002, 44, 51. [Google Scholar]
- Zeschky, M.; Widenmayer, B.; Gassmann, O. Frugal Innovation in Emerging Markets. Res.-Technol. Manag. 2011, 54, 38–45. [Google Scholar] [CrossRef]
- Wood, J.; Wu, J.; Li, Y.; Jang, H. The Economic Impact of SPS Measures on Agricultural Exports to China: An Empirical Analysis Using the PPML Method. Soc. Sci. 2017, 6, 51. [Google Scholar] [CrossRef]
- Fernando, Y.; Jabbour, C.J.C.; Wah, W.-X. Pursuing Green Growth in Technology Firms Through the Connections Between Environmental Innovation and Sustainable Business Performance: Does Service Capability Matter? Resour. Conserv. Recycl. 2019, 141, 8–20. [Google Scholar] [CrossRef]
- Ashford, N.A.; Zwetsloot, G. Encouraging inherently safer production in European firms: A report from the field. J. Hazard. Mater. 2000, 78, 123–144. [Google Scholar] [CrossRef]
- Baldwin, J.; Lin, Z. Impediments to advanced technology adoption for Canadian manufacturers. Res. Policy 2002, 31, 1–18. [Google Scholar] [CrossRef]
- Lefebvre, E.; Lefebvre, L.A.; Talbot, S. Determinants and impacts of environmental performance in SMEs. R&D Manag. 2003, 3, 263–283. [Google Scholar] [CrossRef]
- Srivastava, S.K. Green Supply-Chain Management: A State-of-the-Art Literature Review. Int. J. Manag. Rev. 2007, 9, 53–80. [Google Scholar] [CrossRef]
- Yuan, H.; Zhou, P.; Zhou, D. What Is Low-Carbon Development? A Conceptual Analysis. Energy Procedia 2011, 5, 1706–1712. [Google Scholar] [CrossRef]
- Dutta, P.; Mishra, A.; Khandelwal, S.; Katthawala, I. A Multiobjective Optimization Model for Sustainable Reverse Logistics in Indian E-Commerce Market. J. Clean. Prod. 2020, 249, 119348. [Google Scholar] [CrossRef]
- Ren, X. Biodegradable Plastics: A Solution or a Challenge? J. Clean. Prod. 2003, 11, 27–40. [Google Scholar] [CrossRef]
- Immelt, J.R.; Govindarajan, V.; Trimble, C. How GE Is Disrupting Itself. Harv. Bus. Rev. 2009, 87, 56–65. [Google Scholar]
- Ibrahim, I.D.; Hamam, Y.; Sadiku, E.R.; Ndambuki, J.M.; Kupolati, W.K.; Jamiru, T.; Eze, A.A.; Snyman, J. Need for Sustainable Packaging: An Overview. Polymers 2022, 14, 4430. [Google Scholar] [CrossRef]
- Sinha, R. Reverse Innovation: A Gift from Developing Economy to Developed Economy. Bus. Perspect. Res. 2013, 2, 69–78. [Google Scholar] [CrossRef]
- Oduro, S.; Maccario, G.; De Nisco, A. Green Innovation: A Multidomain Systematic Review. Eur. J. Innov. Manag. 2022, 25, 567–591. [Google Scholar] [CrossRef]
- Porter, M.E.; Linde, C.V.D. Toward a New Conception of the Environment-Competitiveness Relationship. J. Econ. Perspect. 1995, 9, 97–118. [Google Scholar] [CrossRef]
- Yang, L.; Liu, J.; Yang, W. Impacts of the Sustainable Development of Cross-Border e-Commerce Pilot Zones on Regional Economic Growth. Sustainability 2023, 15, 13876. [Google Scholar] [CrossRef]
- Li, Y.; Zheng, Z.; Zhao, M.; Liu, Z. How Does Digital Trade Impact Urban Carbon Emissions Efficiency? Evidence from China’s Cross-Border e-Commerce Pilot Zones. J. Clean. Prod. 2024, 456, 142363. [Google Scholar] [CrossRef]
- Dallocchio, M.; Lambri, M.; Sironi, E.; Teti, E. The Role of Digitalization in Cross-Border e-Commerce Performance of Italian SMEs. Sustainability 2024, 16, 508. [Google Scholar] [CrossRef]
- Yuan, Q.; Ji, Y.; Zhang, W.; Lei, T. Cross-Border E-Commerce and Urban Entrepreneurial Vitality—A Quasi-Natural Experiment Evidence from China. Sustainability 2024, 16, 1802. [Google Scholar] [CrossRef]
- He, Y.; Wang, Z.; Liu, S.; Du, X. Construction and Implementation of Cross-Border e-Commerce Supply Chain System Under the Background of Green and Low-Carbon. J. Internet Digit. Econ. 2024, 4, 1–11. [Google Scholar] [CrossRef]
- Leng, Y.; Huang, C.; Lu, R.; Gao, X.; Zou, Y. A Proposed Framework of the Impact of Knowledge Management and Green Innovation on the Sustainable Development of Cross-Border E-Commerce Enterprises: The Moderating Role of Artificial Intelligence. Acad. J. Bus. Manag. 2023, 5, 178–184. [Google Scholar] [CrossRef]
- Wen, L.; Ma, S.; Zhao, G.; Liu, H. The Impact of Environmental Regulation on the Regional Cross-Border E-Commerce Green Innovation: Based on System GMM and Threshold Effects Modeling. Pol. J. Environ. Stud. 2024, 34, 1347–1362. [Google Scholar] [CrossRef]
- Zhou, F.; Liu, Y. Blockchain-Enabled Cross-Border e-Commerce Supply Chain Management: A Bibliometric Systematic Review. Sustainability 2022, 14, 15918. [Google Scholar] [CrossRef]
- Shen, Y.; Zhang, X. Intelligent manufacturing, green technological innovation and environmental pollution. J. Innov. Knowl. 2023, 8, 100384. [Google Scholar] [CrossRef]
- Girma, S.; Gong, Y.; Görg, H. Foreign direct investment, access to finance and innovation activity in Chinese enterprises. World Bank Econ. Rev. 2008, 22, 367–382. [Google Scholar] [CrossRef]
- Zhao, M.; Liu, F.; Song, Y.; Geng, J. Impact of Air Pollution Regulation and Technological Investment on Sustainable Development of Green Economy in Eastern China: Empirical Analysis with Panel Data Approach. Sustainability 2020, 12, 3073. [Google Scholar] [CrossRef]
- Ambient Air Quality Standards. Available online: https://www.mee.gov.cn/ywgz/fgbz/bz/bzwb/dqhjbh/dqhjzlbz/201203/t20120302_224165.shtml (accessed on 27 January 2025).
- Technical Regulation on Ambient Air Quality Index (on Trial). Available online: https://www.mee.gov.cn/ywgz/fgbz/bz/bzwb/jcffbz/201203/t20120302_224166.shtml (accessed on 27 January 2025).

Disclaimer/Publisher’s Note: The statements, opinions and data contained in all publications are solely those of the individual author(s) and contributor(s) and not of MDPI and/or the editor(s). MDPI and/or the editor(s) disclaim responsibility for any injury to people or property resulting from any ideas, methods, instructions or products referred to in the content. |
© 2025 by the authors. Licensee MDPI, Basel, Switzerland. This article is an open access article distributed under the terms and conditions of the Creative Commons Attribution (CC BY) license (https://creativecommons.org/licenses/by/4.0/).