Article

Effectiveness of Agricultural Technology Services on Fertilizer Reduction in Wheat Production in China

Agricultural Economics and Development Research Institute, Chinese Academy of Agricultural Sciences, Beijing 100081, China
*
Author to whom correspondence should be addressed.
Sustainability 2025, 17(7), 2840; https://doi.org/10.3390/su17072840
Submission received: 21 February 2025 / Revised: 19 March 2025 / Accepted: 21 March 2025 / Published: 22 March 2025

Abstract

:
Under the intensifying constraints of resources and environment, reducing fertilizer use while enhancing efficiency in China’s grain production has become imperative. This study empirically analyzes the effect of agricultural technical services on fertilizer reduction in wheat production using 2024 micro-survey data. Agricultural technical services exert a significantly negative influence on the fertilization intensity among wheat growers. In comparison with non-adopters, adopters achieve a reduction in fertilization amounting to 8.351 kg/mu (equivalent to 125.265 kg/ha) and realize a decrease in chemical fertilizer costs of CNY 26.735/mu (or USD 56.625/ha). Additionally, from the perspective of service components heterogeneity, soil testing, formula fertilization, mechanical fertilization, and straw returning significantly contribute to fertilizer reduction. From the perspective of service model heterogeneity, if farmers participating in market-oriented, cooperative, and industrialized services discontinue participation, their fertilizer application intensity would increase by 5.43%, 7.96%, and 12.79%, respectively. Finally, this study calls on the government to further leverage the technological dissemination advantages of agricultural technology service institutions, guide farmers to reduce the use of chemical fertilizers, so as to accelerate the realization of more sustainable agriculture.

1. Introduction

As a critical input for agricultural production, chemical fertilizers are intrinsically linked to national food security [1]. China has achieved remarkable success in feeding nearly 20% of the global population with only 9% of the world’s arable land and 6% of its freshwater resources [2,3]. Chemical fertilizers have played a pivotal role in enhancing soil fertility and boosting crop yields per unit area, thereby safeguarding China’s food security. However, driven by pressures to increase grain production [4], coupled with challenges such as low baseline soil fertility, high land-use intensity, fragmented smallholder farming systems, imbalanced fertilization practices, outdated agricultural techniques, and inadequate fertilizer management policies [5], China faces systemic issues of excessive, inefficient, and indiscriminate fertilizer use in agricultural practices. Current fertilizer application rates far exceed economically optimal levels [6,7]. According to data from the Food and Agriculture Organization of the United Nations (FAO), China’s fertilizer application intensity reached 336.24 kg/ha in 2022, representing 2.97 times the global average, 3.12 times that of the United States, 3.58 times the European Union average, and 1.49 times the internationally recognized safe upper limit. Wheat, as one of China’s three staple crops, is predominantly cultivated in the North China Plain, which is a vital national production base [8]. This region exhibits severe over-application of fertilizers in wheat cultivation, with average application intensities in Henan, Shandong, Hebei, and Jiangsu provinces exceeding 1.5 times the recommended upper thresholds [9].
The Chinese government has called for strengthened comprehensive management of agricultural non-point source pollution and deeper implementation of fertilizer reduction initiatives. However, China’s agricultural sector continues to grapple with persistent extensive farming practices, while land pollution remains a critical challenge [10,11]. The United Nations’ 2030 Agenda for Sustainable Development outlines key targets including Sustainable Development Goal (SDG) 2 (Zero Hunger) and SDG 12 (Responsible Consumption and Production). Therefore, while maintaining fundamental balance in agricultural supply–demand dynamics and ensuring food security, China must fully account for environmental carrying capacity and accelerate the transition toward green agricultural production systems.
Decentralized smallholder farming remains the predominant mode of agricultural production in China, yet farmers’ cultivation decisions face multiple constraints—including production resource availability, agricultural product sales volumes, and operational scale—manifesting “bounded rationality” in agricultural decision-making [12]. Smallholders generally prioritize immediate planting returns, demonstrating limited enthusiasm for adopting new technologies or crop varieties and weak awareness of sustainable production through fertilizer reduction [13]. Concurrently, due to farmers’ relatively low scientific literacy, mismatches between fertilizer types and soil requirements persist, with prevalent improper practices such as surface-level fertilizer application. The rapid development of China’s secondary and tertiary industries has intensified rural labor shortages, driven by non-agricultural employment opportunities and an aging rural population. To address production demands, farmer cooperatives and professional agricultural technology service providers now offer specialized technical services including fertilization, seeding, plant protection, and harvesting. By the end of 2023, China hosted 1.07 million agricultural technology service organizations, assisting over 91 million smallholder households. This institutional innovation presents new pathways for achieving fertilizer reduction targets in Chinese agriculture [14].
Agricultural technology has increasingly become a critical driver of agricultural development [15,16,17]. Empirical studies demonstrate that agricultural technology service organizations contribute to reduced fertilizer application intensity through precision field operations enabled by advanced technologies and machinery, including mechanized fertilization, soil testing-based formula fertilization, deep tillage, and straw incorporation [18]. In selected Chinese regions, these organizations provide comprehensive land trusteeship services, managing entire crop production cycles for smallholder farmers. Capitalizing on their technical expertise and distribution networks, these entities supply farmers with high-efficiency green agricultural inputs and deliver customized advisory services, effectively correcting suboptimal fertilization practices. This institutional innovation generates dual economic–environmental dividends through optimized resource allocation and yield improvements [19]. Consequently, agricultural technology services have become a vital pathway to overcome the limitations of smallholder systems in advancing sustainable agricultural transformation [20].
Currently, although existing studies have analyzed the fertilizer reduction effects of agricultural technical services, there remains a research gap regarding wheat cultivation in China’s North China Plain given the country’s vast territory and significant variations among different crops and varieties. Previous research has neither focused specifically on wheat production in this region nor thoroughly investigated the impact of agricultural technical service models on farmers’ fertilizer application. In-depth research on the influence of agricultural technical services on fertilizer inputs in China’s grain crops, particularly wheat, holds practical significance for expanding fertilizer reduction models, improving agricultural service evaluations, and ensuring food security.
Based on this, this study utilizes micro-level survey data collected in 2024 from 926 wheat-growing households across five provinces in China’s North China Plain. It investigates the current status of fertilizer application and agricultural technical services in wheat cultivation, while comprehensively exploring how agricultural technical services affect fertilizer use. The research further examines the differential effects of various service stages and models on fertilizer reduction. Ultimately, this study aims to provide references for accelerating policy research on green transformation in agricultural practices, particularly for developing countries represented by China.
The marginal contributions of this study are threefold. First, utilizing the latest 2024 household survey data from the wheat-producing regions of the North China Plain, this research provides timely and region-specific insights into the pivotal role of agricultural technical services in reducing fertilizer use in wheat cultivation. Second, departing from conventional holistic evaluations of agricultural technical services, this study pioneers a dual-dimensional heterogeneity analysis from the perspectives of “service segments–service models”. It systematically identifies the fertilizer reduction efficacy of key service segments such as soil testing and formula fertilization and mechanized fertilization, while revealing the comparative advantages among market-oriented, cooperative, and industrialized service models. These findings significantly deepen the theoretical understanding of agricultural technical services. Third, to address endogeneity arising from self-selection bias in agricultural technology adoption, this study innovatively employs Endogenous Switching Regression (ESR) and multiple ESR models. By constructing a counterfactual analytical framework, it effectively mitigates sample selection bias, thereby enhancing the robustness of fertilizer reduction effect estimations. This methodological advancement establishes a novel paradigm for future research on agricultural technology adoption.
In addition to the introduction, the second section presents the theoretical analysis and research hypotheses. The third section describes the materials and methods. The fourth section reports the empirical results. The fifth section discusses the findings, and the final section (sixth) concludes the study and provides policy recommendations.

2. Theoretical Analysis and Research Hypotheses

2.1. Mechanism of the Impact of Agricultural Technology Services on Fertilizer Application

The diffusion of innovations theory emphasizes the spread and adoption of new technologies within socio-economic systems [21]. A lack of scientific and technological knowledge is one of the key reasons for excessive fertilizer application by farmers [22,23]. Agricultural technology service organizations, as important disseminators of agricultural technologies, possess technical advantages and professional expertise. They diffuse advanced fertilizer application techniques, such as soil testing and formula fertilization, controlled-release fertilizer applications, straw returning, and other agronomic practices, to a broad range of farmers. Once farmers adopt these technologies, they not only improve fertilizer use efficiency and reduce waste and environmental pollution but also promote the transition of agricultural production towards greener and more sustainable practices [24]. This process of technology diffusion helps to enhance the overall technological level of the agricultural sector and strengthens its capacity for sustainable development.
According to the theory of externalities, the actions of economic agents can impact other economic agents, either positively or negatively [25]. Agricultural technology service organizations that promote advanced fertilizer application techniques generate significant positive technological spillovers. On the one hand, these services enhance fertilizer use efficiency and reduce the environmental pollution caused by excessive fertilizer application, thereby improving the agricultural ecosystem. This not only benefits current agricultural production but also supports future sustainable development, representing an intergenerational positive externality. On the other hand, when farmers adopt these services, they not only reduce their own fertilizer use but also influence neighboring farmers to do the same. This imitation effect can lead to broader regional improvements in agricultural practices, creating a positive externality at the regional level. Conversely, in the absence of guidance from agricultural technology service organizations, farmers may engage in irrational fertilizer application practices, leading to soil degradation and reduced agricultural product quality [26]. These negative externalities can be mitigated by the technical expertise of service organizations, which helps to ensure the sustainable development of agriculture.
Based on the above analysis, the following research hypothesis is proposed:
Hypothesis 1 (H1).
Agricultural technology services can promote the reduction in fertilizer application among farmers.

2.2. Mechanism of the Impact of Agricultural Technology Services with Different Components on Farmers’ Fertilizer Application

2.2.1. Soil Testing and Formula Fertilization Services

Agricultural technology services can be segmented into various technical components, and those related to fertilizer application can have differential impacts on final fertilizer input. Soil testing and formula fertilization is based on soil analysis and field trials, optimizing the application of nitrogen, phosphorus, potassium, and secondary and micronutrients according to crop nutrient requirements, soil fertility, and fertilizer efficacy. This service corrects the traditional imbalanced fertilizer application structure that overemphasizes nitrogen and phosphorus while neglecting potassium and micronutrients, thereby reducing the incidence of over-fertilization. Research indicates that when fertilizer application is below the optimal level for maximum yield, significant yield increases can be achieved. However, excessive fertilization not only reduces yields but also degrades soil quality, hindering long-term productivity goals. Soil testing and formula fertilization follows the principle of “supplementing deficiencies and supplying according to needs”, optimizing nutrient ratios to help farmers balance yield, income, and ecological benefits. This approach enhances fertilizer use efficiency [27], reduces fertilizer application rates, and promotes sustainable agricultural development.
Therefore, the following research hypothesis is proposed:
Hypothesis 2 (H2).
The use of soil testing and formula fertilization services can effectively reduce the intensity of chemical fertilizer application.

2.2.2. Mechanical Fertilization Services

In contexts where fertilizer application primarily relies on manual labor and labor inputs are substitutable with fertilizer use, farmers often opt for high-volume, low-frequency fertilizer application to reduce labor intensity and costs [28]. This practice frequently leads to excessive fertilizer use. Modern agricultural technology services offer practical solutions for mechanization, making mechanical fertilization accessible to small-scale farmers. Mechanical fertilization effectively addresses the irregularities and inefficiencies associated with manual fertilizer application. Utilizing precision tools like fertilizer spreaders, it enhances fertilizer application efficiency and supports fertilizer reduction [29]. Specifically, mechanical fertilization offers two key advantages. First, the optimized spreading mechanisms of mechanical devices ensure even fertilizer distribution across fields. Second, compared to manual application, mechanical fertilization follows standardized operational procedures, minimizing human-induced variability in fertilizer distribution.
Therefore, the following research hypothesis is proposed:
Hypothesis 3 (H3).
The use of mechanical fertilization services can effectively reduce the intensity of chemical fertilizer application.

2.2.3. Straw Returning Services

As a major agricultural country, China has abundant crop straw resources. In the era of traditional smallholder economies, crop straw was primarily used for domestic cooking and heating [30]. However, with the transformation of rural lifestyles and agricultural practices, open burning and disposal of straw have become common due to their efficiency and low cost. Open burning of crop straw is one of the significant sources of particulate pollution [31]. Not only does straw burning waste valuable resources, but it also causes severe environmental pollution. To control open burning, the Chinese government has enacted various laws and regulations prohibiting the practice. Additionally, financial subsidies and tax incentives have been implemented to promote the comprehensive utilization of straw. With coordinated efforts at all government levels, open burning of straw has been effectively curbed. Straw returning to the field has become a primary method for straw management. Straw returning increases soil organic matter content, retains soil moisture, enhances soil biological activity, and promotes soil aggregation, thereby reducing the need for chemical fertilizers [32,33]. This practice not only prevents environmental degradation caused by straw burning but also achieves effective resource utilization [34]. Of course, in order to ensure the effective conversion of crop straw into organic matter, it is necessary to supplement a small amount of straw composting agent or nitrogen fertilizer to accelerate the straw decomposition process. But compared to fertilization, the amount of fertilizer introduced into the soil is relatively small.
Therefore, the following research hypothesis is proposed:
Hypothesis 4 (H4).
The use of straw returning services can effectively reduce the intensity of fertilizer application.

2.3. The Impact Mechanism of Agricultural Technology Services with Different Service Models on Farmers’ Fertilizer Application

Different service organization models have distinct production philosophies, operation methods, and levels of organization. Therefore, the effectiveness of reducing fertilizer application by farmers varies under different organizational models.

2.3.1. Market-Oriented Service Model

In this model, the relationship between farmers and their upstream and downstream traders is entirely based on market transactions, lacking any cooperative or contractual relationships. The main operators in this model are typically ordinary farmers and large-scale growers who do not participate in any form of economic organization, primarily engage in family-based production, and directly connect with the market. Market service organizations, such as agricultural machinery service providers, integrate farmers into the social division of labor by offering paid services. The service price, location, and timing are not fixed by any contractual agreement but are flexibly determined based on market conditions. The service content usually focuses on a single link in agricultural production, and the service transaction relationship is relatively loose.

2.3.2. Cooperative-Oriented Service Model

In the cooperative service model, farmers join cooperatives as members and receive partial services, such as the supply of agricultural inputs and technical services, provided by the cooperatives [35]. Members of the cooperatives are entitled to preferential service prices when purchasing services from their own cooperatives. In this study, the main operating entity of this model is the “cooperative + farmer” structure. The service content typically focuses on multiple links in agricultural production, and the service transaction relationships are relatively tight.

2.3.3. Industrialized-Oriented Service Model

In the industrialized service model, agricultural enterprises, through both formal contracts and relational bonds, collaborate with village collectives or intermediary organizations to provide farmers with integrated services covering pre-production, production, and post-production stages. Farmers receive agricultural inputs and technical services from the service organizations and are required to produce agricultural products that meet the specified quantity and quality standards set by the organizations. These products are then sold back to the organizations according to the contract [36]. In this study, the main operating entity of this model is the “agricultural enterprise + village collective + farmer” structure. The service content essentially covers all stages of agricultural production, and the service transaction relationships are highly integrated and tight.
From the market-oriented service model to the cooperative service model and then to the industrialized service model, the service providers shift from market-oriented entities such as agricultural machinery households to joint operations involving multiple entities, including farmers’ professional cooperatives and agricultural enterprises. The form of service transactions evolves from market-based transactions to contractual and integrated collaborative transactions. The vertical cooperation between service providers and farmers becomes increasingly tight. Under the market-oriented organizational model, farmers find it difficult to regulate their own behavior and often make decisions based on maximizing their individual interests, which may lead to over-fertilization. In contrast, under the tight cooperative organizational models, farmers establish stable connections with service organizations, and their behaviors related to reducing fertilizer application are regulated through strict contractual constraints, mechanisms for profit distribution, and risk mitigation [37].
Therefore, the following research hypothesis is proposed:
Hypothesis 5 (H5).
Compared to the market-oriented service model, the cooperative service model and the industrialized service model have a greater effect on reducing farmers’ fertilizer application.

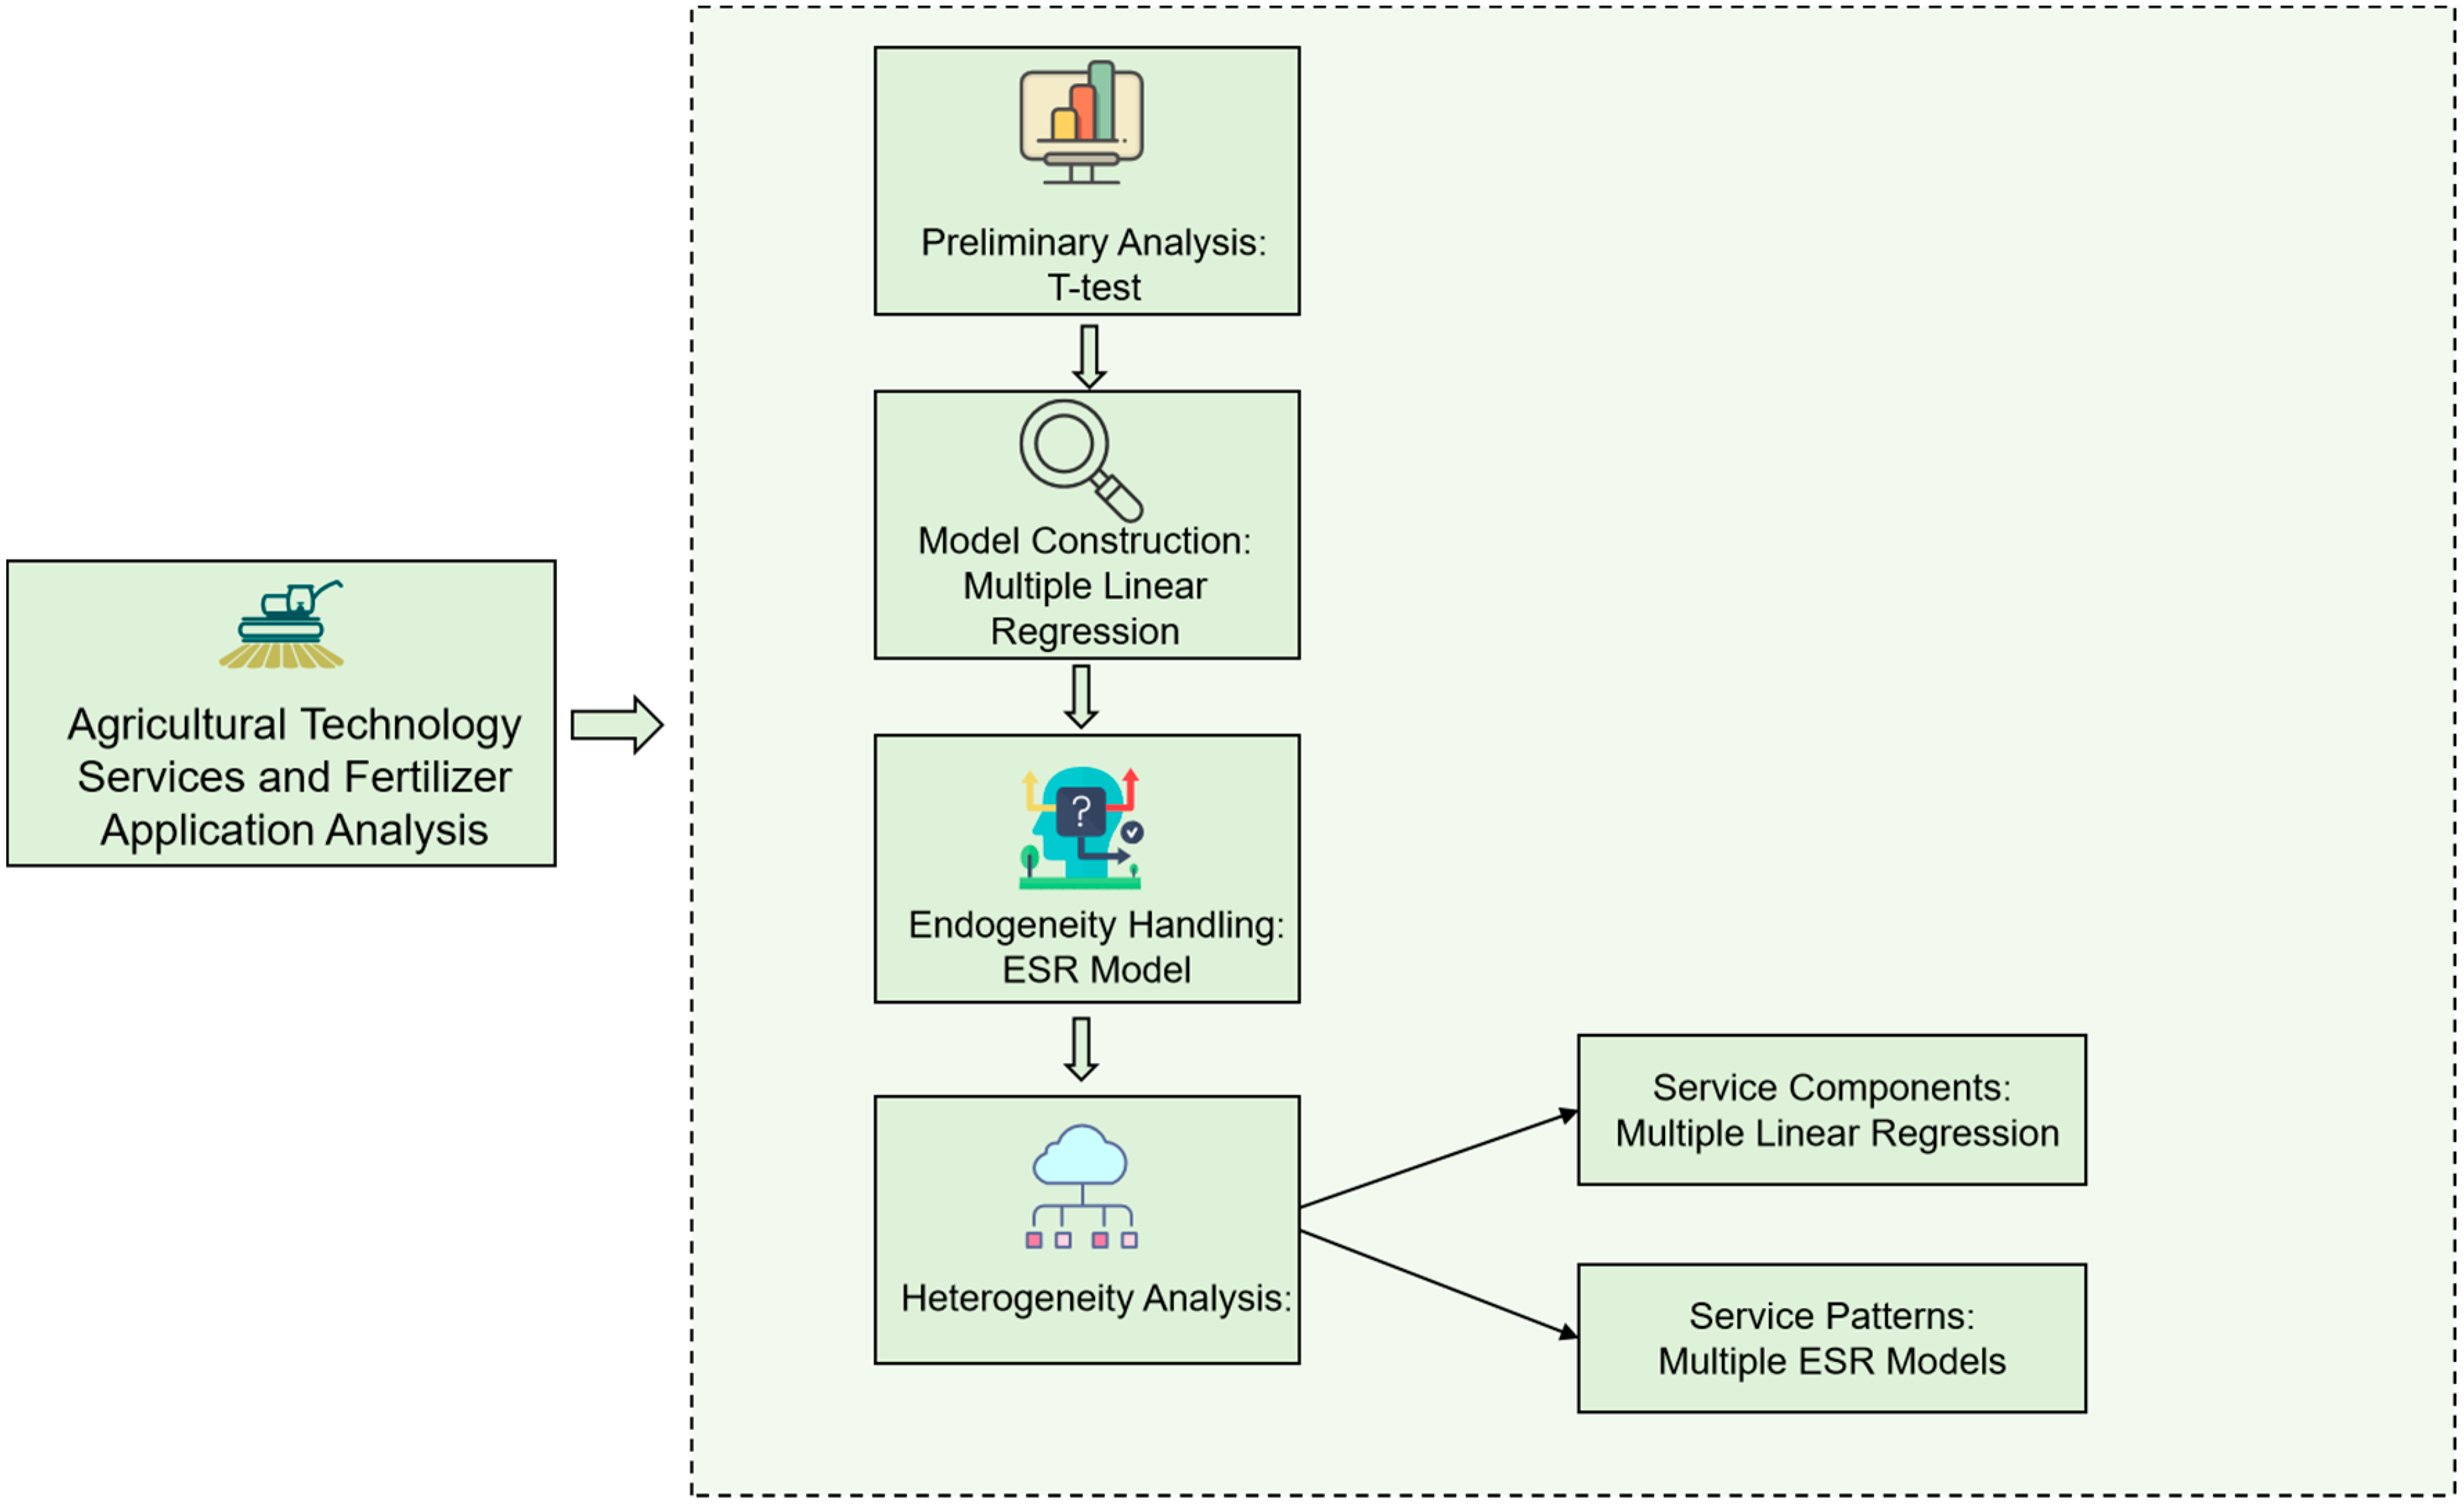
3. Materials and Methods

3.1. Data Sources

This study focuses on wheat cultivation in the North China Plain to explore the impact of agricultural technology services on farmers’ fertilizer application. The North China Plain was selected for its critical role in China’s food security, producing approximately 80% of the nation’s wheat. As a typical smallholder-dominated region, a per capita arable land area of 1.21 mu (0.08 ha), significantly below the national average, has intensified the urgent demand for agricultural technical services. Additionally, the region is characterized by hyper-intensive cultivation and severe environmental pressures, collectively highlighting the challenges and urgency of agricultural green transition. A map in Figure 1 delineates the geographical scope of the study area. Given that agricultural machinery services are the most demanded and widely utilized component of agricultural technology services among farmers, the term “agricultural technology services” in this paper primarily refers to the specialized services provided by agricultural technology service organizations to meet the needs of agricultural production. These services include land preparation, sowing, fertilization, pesticide application, harvesting, and other related technical activities [38,39,40].
The data used in this study were collected by the research team through a stratified and random sampling survey of wheat-growing households in 59 villages across 35 townships and 14 counties within five provinces (Shandong, Henan, Hebei, Anhui, and Jiangsu) of the North China Plain. The survey was conducted from April 2024 to August 2024 using a face-to-face questionnaire interview method. A total of 950 questionnaires were distributed, and after excluding incomplete, unanswered, or logically inconsistent responses, 926 valid samples were obtained, resulting in an effective response rate of 97.47%. The questionnaire covered key aspects, such as farmers’ basic characteristics, household characteristics, village characteristics, wheat cultivation and management practices, and farmers’ cognitive traits.

3.2. Model Construction

This study employs a multi-stage analytical approach to investigate the relationship between agricultural technology services and fertilizer application (as shown in Figure 2). First, independent t-tests compare fertilizer application intensity and expenditure between farmers adopting agricultural technology services and non-adopters. A multiple linear regression model is then used to quantify the association between agricultural technology service inputs and fertilizer application, controlling for household characteristics, plot features, and regional variables. To address potential self-selection bias in farmers’ adoption decisions, an endogenous switching regression model is applied, jointly modeling the adoption probability and outcome equations. Finally, heterogeneity analysis of agricultural technology services affecting fertilizer application was conducted by performing. On the one hand, multivariate linear regression was applied to analyze the heterogeneity of agricultural technology service links; on the other hand, polynomial endogenous switching regression was applied to analyze the heterogeneity of agricultural technology service patterns.

3.2.1. Construction of the Farmers’ Fertilizer Input Model

To examine the impact of the core explanatory variable, agricultural technology services, on farmers’ fertilizer application intensity, the following model is established:
ln f e r t i = a 0 + a 1 S e r v i c e i + a 2 k C i + μ i .
Here, ln f e r t i represents the logarithmic form of the fertilizer application intensity of the i-th farmer household. The fertilizer application intensity is measured by the amount of fertilizer applied per unit area (mu). S e r v i c e i represents the participation of the i-th farmer in agricultural technology services. C i represents other control variables, including factors such as the personal and family characteristics of the i-th agricultural decision-maker, agricultural production and management characteristics, village characteristics, and farmers’ cognitive traits. μ i is the random error term, capturing unobserved factors affecting fertilizer application intensity. In addition, a 0 is the intercept term, and a 1 and a 2 are parameters to be estimated.

3.2.2. Endogenous Switching Regression Model

If the adoption of agricultural technology services by smallholder farmers were randomly assigned, the results of multivariate linear regression would be valid and unbiased. However, farmers’ adoption of agricultural technology services is not random and cannot be treated as an exogenous variable, necessitating correction for selection bias to avoid biased estimates. Moreover, the adoption of agricultural technology services results from multiple interacting factors, including both observable and unobservable elements, which may simultaneously influence farmers’ fertilizer input decisions. Additionally, since the adoption of agricultural technology services does not constitute a randomized controlled experiment, counterfactual information cannot be obtained to distinguish causal relationships. This study specifically requires differentiating the variation in fertilizer inputs between scenarios where farmers do and do not adopt agricultural technology services. The Endogenous Switching Regression (ESR) model comprehensively addresses selection bias caused by both observable and unobservable variables. This method is commonly used to estimate the impact of adopting technologies, purchasing services, participating in training, or joining agricultural organizations.
The behavioral choice equation for whether a farmer purchases agricultural technology services is
D * = Z i β + μ i           D = 1 ,   i f   D * > 0 0 ,   i f   D * 0 .
The outcome equation for farmers purchasing and not purchasing agricultural technology services is
Y M i = X M i α M + ε M i           i f   D = 1 ,
Y N i = X N i α N + ε N i           i f   D = 0 ,
where is the latent variable of the dichotomous variable D ; Z i is a set of explanatory variables affecting the purchase of agricultural technology services by farmers; whether or not farmers purchase agricultural technology services may be affected by unobservable factors (e.g., farmers’ cognitive ability), which may be related to fertilizer inputs. Y M i and Y N i denote the fertilizer input status of farmers who use and do not use agricultural technology services, respectively; X M i and X N i denote the explanatory variables affecting the fertilizer input of farmers who purchase agricultural technology services and those who do not.
The estimated coefficients of the ESR model are used to estimate the average treatment effect of agricultural technology service purchases on the effect of farmers. This is achieved by comparing the expected value of the effect level of agricultural technology service non-purchasing farmers with that of purchasing farmers in the real scenario and the hypothetical scenario of the counterfactual, using the counterfactual analytical framework. Fertilizer inputs of agricultural technology services purchased and non-purchased farmers can be expressed as
E Y M i D = 1 = X M i α N + σ N i λ M i ,
E Y N i D = 0 = X N i α M + σ M i λ N i .
This in turn allows us to obtain the average treatment effect of fertilizer inputs for farmers purchasing agricultural technology services:
A T T = E Y M i D = 1 E Y N i D = 1 = X M i α M + σ M i λ M i X M i α N σ N i λ M i .
The average treatment effect of fertilizer inputs for farmers who did not purchase agricultural technology services is calculated as follows:
A T U = E Y M i D = 0 E Y N i D = 0 = X N i α N + σ N i λ N i X N i α M σ M i λ N i .

3.2.3. Multivariate Endogenous Switching Regression Model

The Multivariate Endogenous Switching Regression (MESR) model is employed to evaluate the treatment effects. The choice of agricultural technology service models may be endogenously determined by farmers’ self-selection and decision-making. The MESR model incorporates a selection correction method by calculating the Inverse Mills Ratio (IMR) to address this endogeneity bias [41].
The MESR model further extends this approach by specifying a separate outcome equation for each choice alternative, thereby allowing for the evaluation of treatment effects under multiple-choice conditions [42]. Assuming there are m + 1 types of agricultural technology service models, a farmer’s choice of a particular model depends on the stochastic utility associated with participating in that model [43]. The multinomial choice equation is thus specified as shown in Equation (2). In the first stage, the selection equation for farmers’ choice of service mode is estimated using a multinomial logit model.
U j i = Z i   γ j + μ j i j = 0 , m ;   i = 1 , n           D i = 0 ,   i f   μ j i > max j 0 μ j i m ,   i f   μ j i > max j m μ j i .
Here, Z i represents a set of explanatory variables influencing a farmer’s participation in different agricultural technology service models. The decision to participate in a particular service model may be affected by unobservable factors (e.g., the farmer’s cognitive ability), which may also be correlated with fertilizer input. μ i is the random error term, taking j = 0 as the reference group the conditional probability that a farmer chooses a particular model j is expressed as shown in Equation (3).
P = D j = m Z i = 1 1 + j 0 exp Z i γ j exp Z m i γ m 1 + j 0 exp Z i γ j .
In the second stage, the fertilizer application intensity outcome equation is constructed to estimate the variations in fertilizer application intensity among farmers participating in different service models. The system of outcome equations for farmers’ participation in different service models is expressed as follows (Equation (4)):
Y 0 i = X 0 i β 0 + σ 0 λ 0 i + ε 0 i           i f   D i = 0 Y m i = X m i β 0 + σ m λ m i + ε m i           i f   D i = m .
Here, Y j i denotes the fertilizer application intensity of households participating in mode j. X represents the set of variables influencing fertilizer application intensity, excluding the decision to participate. ε j i is the random error term. Z overlaps partially with X but includes additional variables that do not belong to X and only affect y through D; these can be regarded as “instrumental variables”. λ j i is the inverse Mills ratio, derived from the selection equation, and is introduced to correct for potential selection bias.
The parameter σ i can reflect the correlation coefficient between the error terms of the selection equation and the outcome equation. Estimating Equation (4) yields a consistent estimator of β and allows for the calculation of the Average Treatment Effect on the Treated (ATT). In this study, the sample of households that did not participate in agricultural technology service models is used as the control group (j = 0), while the samples of households participating in three types of agricultural technology service models are considered as the treatment groups (market-oriented service model j = 1, cooperative service model j = 2, and industrialized service model j = 3). The conditional expectations of the treated group under the factual participation and counterfactual non-participation scenarios are shown in Equations (5) and (6), respectively. The ATT is calculated as shown in Equation (7) and can be used to reflect the fertilizer-reducing effect of different agricultural technology service models.
E Y j i D j = 1 , 2 , 3 = X j i β j + σ j λ j i ,
E Y m i D j = 1 , 2 , 3 = X m i β 0 + σ 0 λ j i ,
A T T = E Y j i D j = 1 , 2 , 3 E Y 0 i D j = 1 , 2 , 3 = X j i β j β 0 + λ j i σ j σ 0

3.3. Variable Selection and Descriptive Statistics

The dependent variable in this study is the fertilizer application intensity of wheat farmers, measured as the average amount of fertilizer applied per area (kilograms per mu; note: 1 mu ≈ 0.0667 hectares or 0.1647 acres). For empirical analysis, this variable is log-transformed by adding one to address potential issues with zero values.
The core explanatory variables are the expenditure on agricultural technology services per area (CNY per mu; note: Based on the World Bank’s 2023 annual average exchange rate, CNY 1 ≈ USD 0.1412), which reflects the intensity of technology service inputs in wheat cultivation, and whether farmers choose soil testing and fertilizer recommendation services, mechanical fertilizer application services, and straw returning services. It should be noted that straw returning is a time-lagged technology. It takes 2 to 3 years for straw to decompose into usable organic fertilizer. Therefore, the survey inquired whether farmers adopted straw returning technology in 2021.
The factors influencing farmers’ fertilizer application decisions are complex and multifaceted. Overall, farmers’ fertilizer application decisions are shaped by a combination of internal and external factors, including the characteristics of the household head, family, agricultural production, and regional environment. Drawing on existing research, this study controls for other factors that may influence fertilizer application, including individual characteristics of the household head, family management characteristics, agricultural production characteristics, and external environmental factors.
The household head is the primary decision-maker in agricultural production. Their individual characteristics, such as gender, age, years of education, and risk attitude, highlight production experience, labor allocation, and subjective perceptions that directly influence fertilizer application decisions [44,45,46]. The family is the basic unit of agricultural production, and its characteristics, such as the labor dependency ratio and the degree of agricultural specialization, indirectly affect fertilizer application decisions through labor and capital endowments. Land is the medium for fertilizer application, and its characteristics directly determine the demand for fertilizer. The area under cultivation and soil fertility collectively reflect land characteristics from both quantity and quality perspectives. Natural disasters are important external factors that significantly influence farmers’ decisions regarding fertilizer application levels. To mitigate the potential interference of individual extreme values on research outcomes, this study implemented logarithmic transformation on continuous variables including fertilizer application intensity, agricultural technical service costs, organic fertilizer application intensity, and cultivated area. This logarithmic transformation effectively addressed skewed data distribution and the influence of outliers while preserving the relative relationships between variables. For detailed variable selection and descriptive statistics, see Table 1.
The results show that the average fertilizer application intensity among the sample households is 71.59 kg/mu (1073.85 kg/ha), which is significantly higher than the recommended upper limit of 30 kg/mu set by developed countries. It is worth noting that this figure is consistent with the findings of Gao et al. [47], indicating the reliability of the survey data. In 2023, the average expenditure on agricultural technology services per mu for farmers was CNY 139.024 (USD 19.630). The average usage rate of soil-testing-based fertilizer recommendation services for wheat planting was 0.281, and the average usage rate of mechanical fertilization services was 0.371. The average usage rate of straw incorporation services for wheat planting was 0.738 in 2021. These figures indicate a relatively high participation rate in straw incorporation services, reflecting the significant success of the national straw-burning ban policy.
Among the individual characteristics of the household heads, the majority of rural household heads are male, with an average age of 52.444 years. The average years of education is relatively low at 9.136 years. The average risk attitude score is 2.826, suggesting that farmers tend to be conservative in their agricultural production decisions.
In terms of family management characteristics, the labor dependency ratio is 1.248, and the degree of agricultural specialization is 0.389, indicating that most households engage in multiple occupations rather than focusing solely on agriculture.
Regarding agricultural production characteristics, the average application intensity of organic fertilizer among the sample households is 32.978 kg/mu (494.67 kg/ha). The average cultivated area is 84.092 mu (5.61 ha). The relatively large average cultivated area may be due to the rapid development of the secondary and tertiary industries in Jiangsu Province, which has led to a high rate of non-agricultural employment among rural laborers, increased land transfer rates, and a higher number of large-scale farming operators compared to other provinces. The sample households also have relatively high-quality land, with an average soil fertility score of 3.733 (indicating above-average soil quality) and good irrigation conditions, with an average score of 4.053.
In terms of external environmental characteristics, the average impact of natural disasters is 1.100, indicating that most households have not experienced significant crop losses due to natural disasters in the past five years.

4. Results

4.1. Benchmark Regression Results of Agricultural Technology Services on Fertilizer Application

4.1.1. Independent Samples t-Test

This study employed the independent samples t-test to assess whether the decision to adopt agricultural technology services significantly impacts fertilizer application. As shown in Table 2, famers that adopted agricultural technology services exhibited an average reduction of 8.351 kg in fertilizer application per mu (125.265 kg/ha) and a cost reduction of CNY 26.735 per mu (USD 56.625/ha) compared to those that did not. These differences were statistically significant at the 1% level, indicating that agricultural technology services have a negative impact on fertilizer application intensity. Specifically, famers that adopted agricultural technology services had lower average fertilizer application costs and amounts per mu than those that did not, suggesting that such services may effectively reduce fertilizer use. Figure 3 can also show this.

4.1.2. Multiple Linear Regression

This study further examines the impact of agricultural technology services on farmers’ fertilizer application intensity. Table 3 reports the estimation results of the effect of agricultural technology service expenditure on fertilizer application intensity. Model 1 presents the regression analysis of the relationship between agricultural technology services and fertilizer application intensity. Models 2 to 4 progressively control for the household head’s personal characteristics, family characteristics, production and management characteristics, and natural characteristics, based on Model 1. The estimation results of Models 1 to 4 consistently show a significant negative correlation between agricultural technology service expenditure and fertilizer application intensity. Specifically, Models 1 to 3 pass the significance test at the 1% level, while Model 4 passes at the 5% level. This indicates that as agricultural technology service expenditure increases, farmers’ fertilizer application intensity decreases, thereby validating Hypothesis 1.
Furthermore, firstly, in Model 4, the gender of the household head is negatively correlated with fertilizer application intensity at the 5% significance level. Specifically, households with male heads have lower fertilizer application intensity compared to those with female heads. This may be attributed to differences in decision-making objectives between genders. When females serve as the primary decision-makers in household agricultural production, they tend to prioritize long-term grain security and stable income for the family, often opting to increase fertilizer application intensity to ensure crop yields and quality. In contrast, male heads of households may consider additional factors such as the short-term economic pressure of fertilizer costs on the household budget and environmental protection concerns.
Secondly, in Model 4, the age of the household head is negatively correlated with fertilizer application intensity at the 5% significance level. This relationship may be explained by two main factors. On the one hand, older household heads have accumulated extensive experience through long-term agricultural practice. With fewer opportunities for non-agricultural employment, they have relatively more time to devote to farming, which allows them to rely less on increasing fertilizer application intensity to boost yields. On the other hand, long-term engagement in farming often fosters a deep attachment to the land among older farmers, who view it as a valuable asset. As a result, they tend to adopt more sustainable practices, including reasonable fertilizer application, to maintain soil health and productivity.
Thirdly, the education level of the household head is negatively correlated with fertilizer application intensity at the 1% significance level. This relationship can be explained by several factors. Individuals with higher education levels are more likely to engage in cost–benefit analysis in agricultural production decisions. They understand that excessive fertilizer application does not necessarily lead to proportional increases in yield or economic benefits. Higher education levels are associated with greater awareness of environmental knowledge and the adoption of green technologies. Educated farmers are more likely to recognize the negative impacts of over-fertilization and are thus more inclined to adopt sustainable practices, such as reducing fertilizer intensity while maintaining crop productivity.
Fourthly, the intensity of organic fertilizer application is positively correlated with the intensity of chemical fertilizer application at the 5% significance level. This relationship can be explained by several factors. On one hand, the combined use of organic and chemical fertilizers can enhance crop yields and economic benefits. On the other hand, the application of organic fertilizer often involves higher labor and material costs. To maximize economic returns, farmers may increase the use of chemical fertilizers on top of organic fertilizers to achieve higher output. This practice is supported by studies showing that integrating organic and chemical fertilizers can improve nitrogen use efficiency and soil fertility while maintaining or increasing crop yields.
Fifthly, soil fertility is negatively correlated with fertilizer application intensity at the 1% significance level. Higher soil fertility indicates that the soil already contains a rich supply of nutrients, thereby reducing the demand for additional chemical fertilizers.
Sixthly, irrigation capacity is positively correlated with fertilizer application intensity at the 10% significance level. Better irrigation conditions provide a more favorable moisture environment for crop growth, which may encourage farmers to increase fertilizer application intensity to maximize yields.

4.2. Endogeneity Test

Previous sections have explored the relationship between agricultural technology services and farmers’ fertilizer application intensity, revealing a significant negative impact of agricultural technology services on fertilizer use. However, the robustness of this result may be compromised by potential endogeneity issues, which necessitate further investigation.
The Endogenous Switching Regression (ESR) model comprehensively addresses selection bias caused by both observable and unobservable variables. This method is commonly used to estimate the impact of adopting technologies [48,49], purchasing services, participating in training, or joining agricultural organizations. In this study, the adoption rate of agricultural technology services among other famers within the same village, excluding the focal famer, is utilized as an instrumental variable. On the one hand, based on the herd effect, the adoption rate of socialized services by other famers in the village significantly influences the focal famer’s decision to adopt agricultural technology services, satisfying the relevance condition of the instrumental variable. On the other hand, the adoption rate of agricultural technology services by other famers in the village does not directly affect the focal household’s fertilizer input, thereby satisfying the exogeneity condition of the instrumental variable.
Based on the ESR model and using Stata 17.0, the joint estimation results of agricultural technology services and fertilizer application intensity among farmers passed the significance test at the 1% level. Additionally, the joint independent likelihood ratio test passed the significance test at the 5% level. These results indicate that the choice of agricultural technology services by farmers is correlated with their fertilizer application intensity. It is necessary to correct for sample selection bias caused by unobservable factors.
This study focuses on the fertilizer-reducing effect of agricultural technical services, with the estimation results presented in Table 4. ATT (Average Treatment Effect on the Treated) represents the difference in fertilizer application intensity between farmers who actually adopted agricultural technical services and those who hypothetically did not. ATU (Average Treatment Effect on the Untreated) represents the change in fertilizer application intensity for farmers who currently do not adopt agricultural technical services but hypothetically do.
The results show that under the counterfactual assumption, farmers who actually adopted agricultural technology services would experience an increase of 0.098 (in natural logarithm) in fertilizer application intensity if they had not adopted the services, while farmers who did not adopt agricultural technology services would see a reduction of 0.147 (in natural logarithm) in fertilizer application intensity if they had adopted the services, with both treatment effects being statistically significant at the 1% level. These findings indicate that agricultural technology services have a significant fertilizer-reducing effect, and farmers can significantly lower their fertilizer application levels by adopting agricultural technology services.

4.3. Heterogeneity Analysis

4.3.1. Heterogeneity in Service Components

Using the natural logarithm of fertilizer application intensity for wheat as the dependent variable, we estimated the models using ordinary least squares (OLS). The estimation results of OLS are presented in Table 5. Models 5–7 examine the impacts of Soil Testing and Fertilizer Recommendation (STFRS), Mechanical Fertilizer Application Service (MFAS), and Straw Returning Service (SRS) on fertilizer application intensity without control variables. Models 8–10 include control variables such as the household head’s individual characteristics, family management characteristics, agricultural production characteristics, and external environmental characteristics to assess the impacts of the three services on fertilizer application intensity. All variance inflation factors (VIF) in Models 5–10 ranged from 1.53 to 1.66. Following methodological standards, these values indicate no significant multicollinearity concerns, as they are well below the commonly accepted threshold of VIF < 10. We report heteroscedasticity-robust standard errors throughout our regression specifications to mitigate potential bias in statistical inference. The results of Models 5–10 show that the core explanatory variables—STFRS, MFAS, and SRS—are all significantly negative, thus validating Hypotheses 2 to 4.
Further analysis of the impact of control variables on fertilizer application intensity was conducted based on Models 8 to 10. The results indicate that the education level of the household head exerts a significant negative effect on fertilizer application intensity. A plausible explanation is that households with higher education levels are more likely to acquire scientific knowledge about fertilization, better understand the risks of excessive fertilizer use, and thus consciously reduce fertilizer application. Meanwhile, organic fertilizer application intensity shows a significant positive correlation with chemical fertilizer application intensity. This phenomenon may be driven by the relatively higher costs associated with organic fertilizer use, including procurement, transportation, and labor expenses, which incentivize farmers to increase chemical fertilizer inputs alongside organic fertilizers to ensure wheat yield and offset additional production costs. The cultivated area also demonstrates a significant positive impact on fertilizer application intensity. Larger cultivated areas typically imply that farmers allocate more time to agricultural production, face fewer non-agricultural employment opportunities, and rely more heavily on agricultural income. Consequently, they prioritize production stability and economic returns. Increasing fertilizer inputs enhance crop growth vigor, stress resistance, and yield per unit area, thereby mitigating yield losses caused by natural disasters or pest infestations. Additionally, the impact of natural disasters significantly increases fertilizer application intensity. Following disasters, farmers tend to raise potassium fertilizer application to improve wheat lodging resistance, increase phosphorus fertilizer use to enhance drought tolerance, and intensify overall fertilizer inputs to promote crop recovery, compensate for yield losses, and safeguard agricultural income.

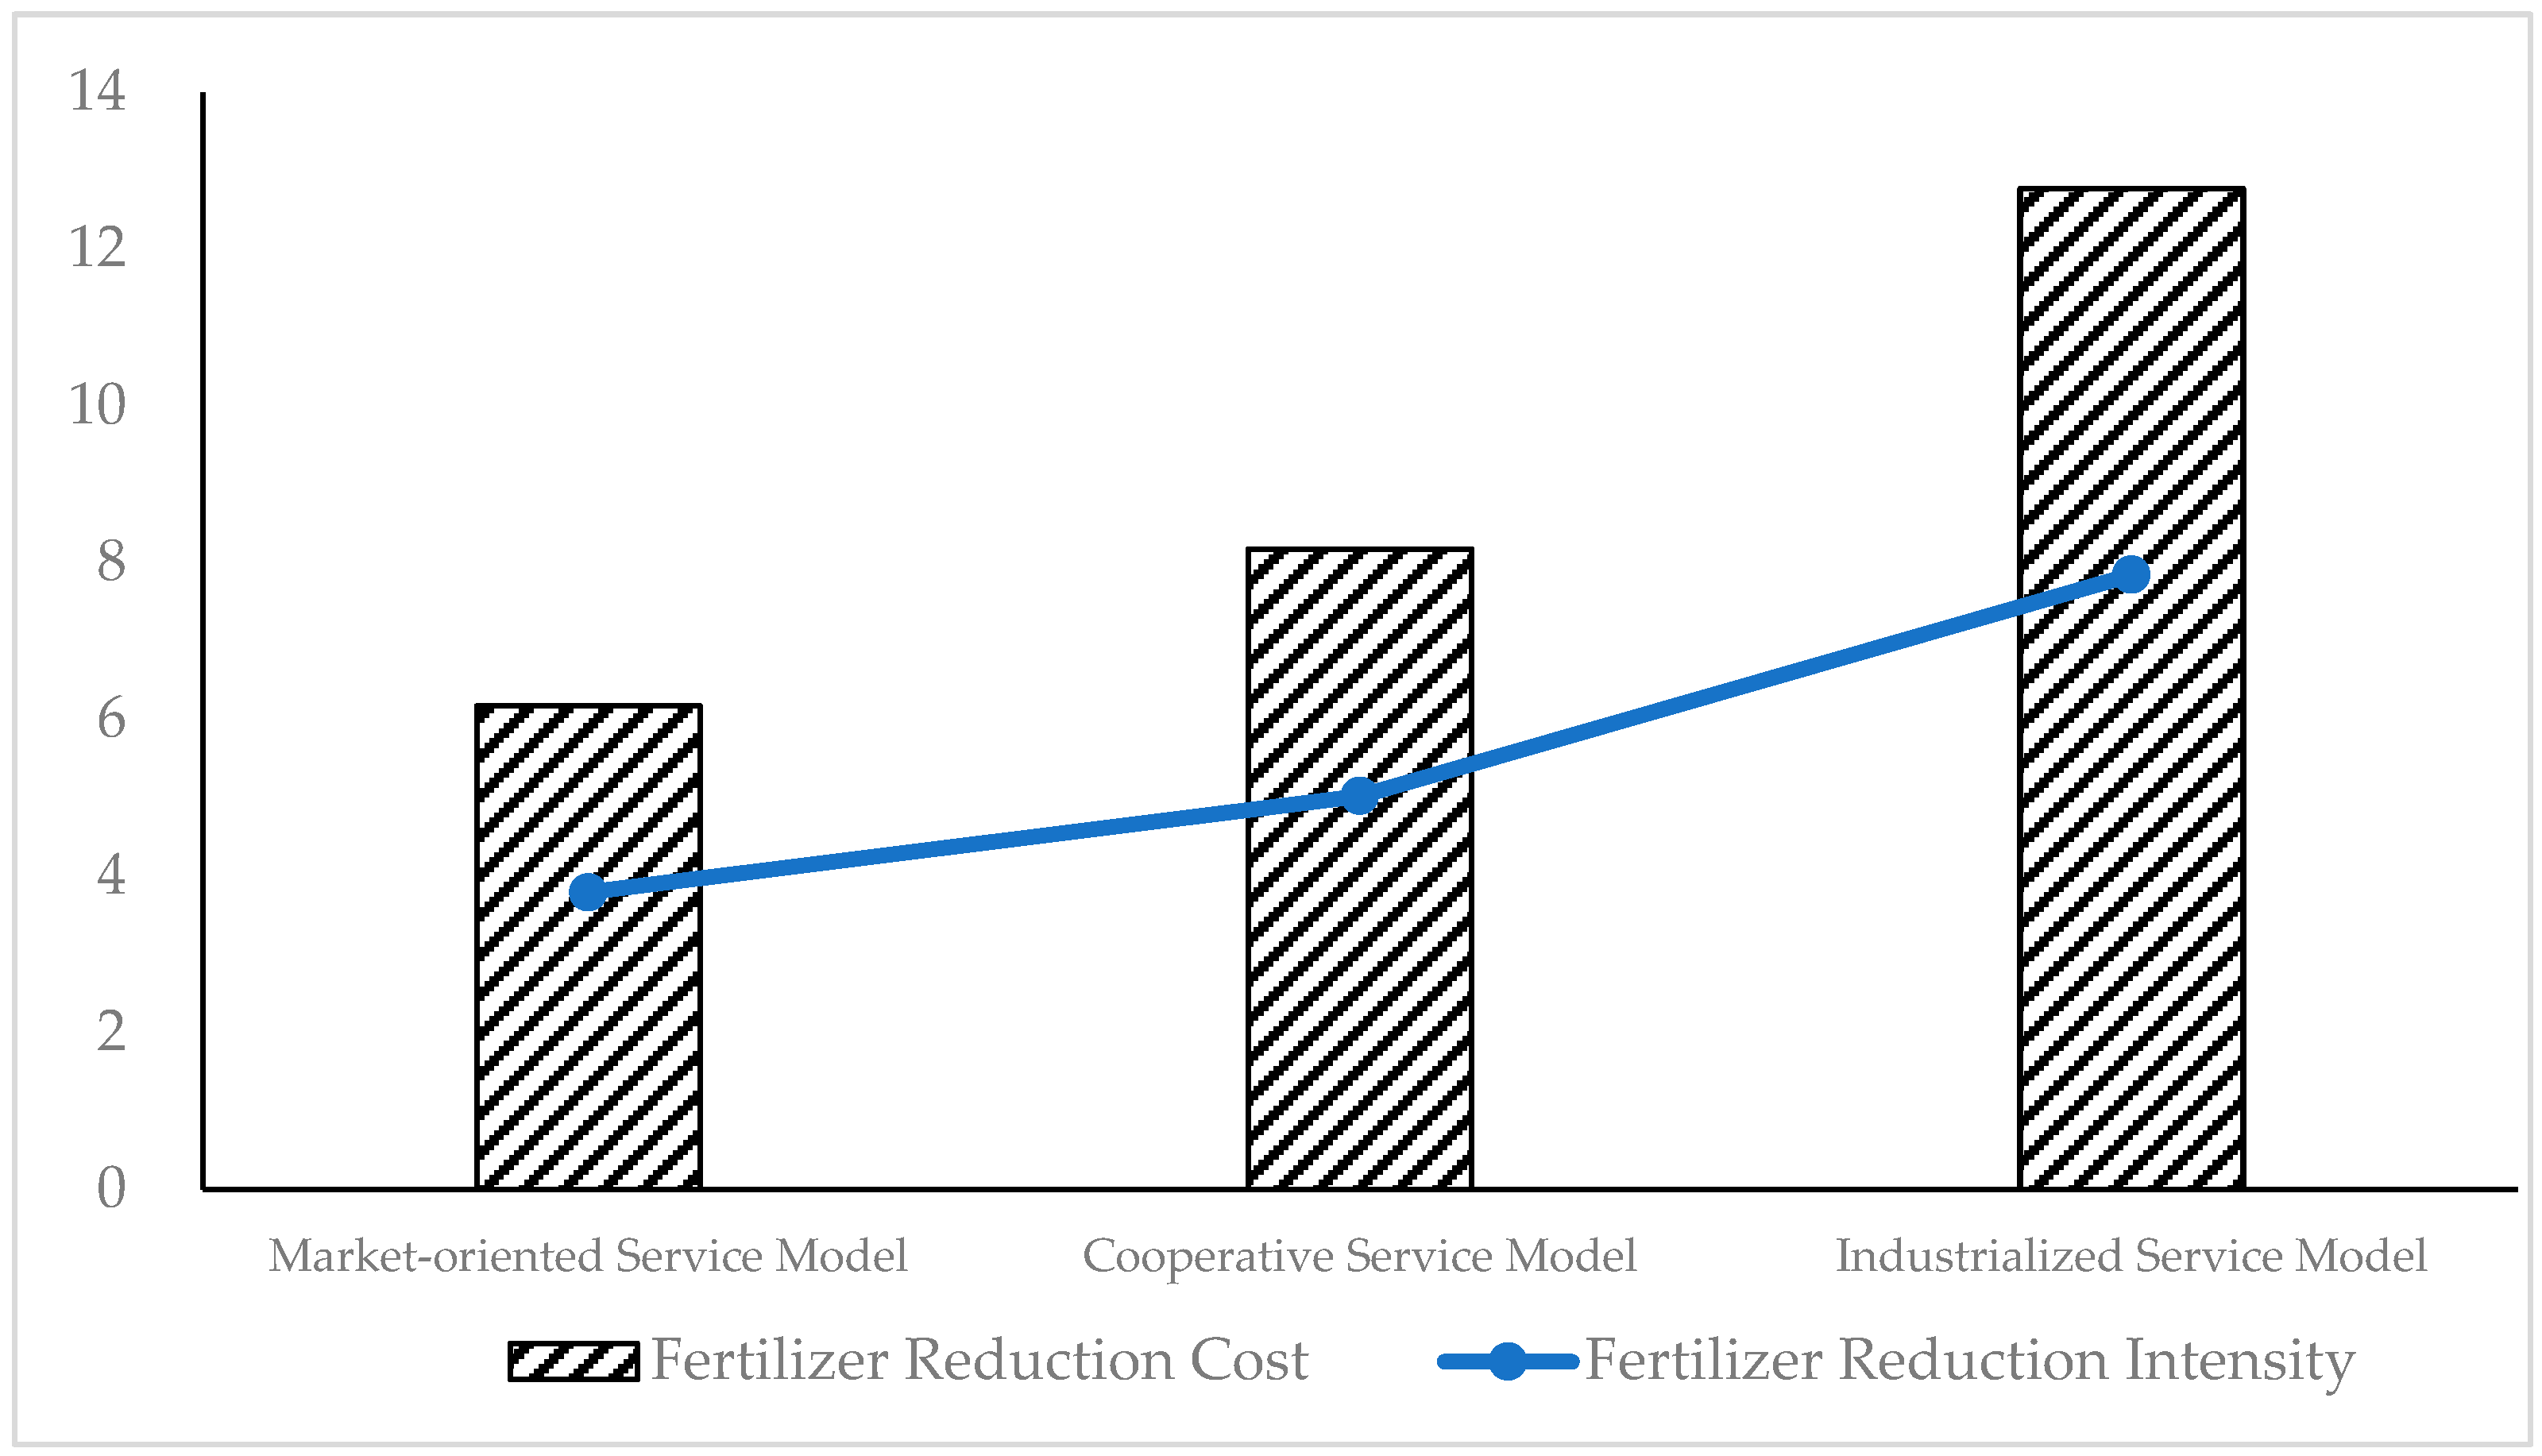
4.3.2. Heterogeneity in Service Models

Due to space limitations, this paper only reports the results from Step 2 of the multinomial endogenous switching regression model. Table 6 presents the average treatment effects on the treated (ATT) of different agricultural technology service participation models on farmers’ fertilizer application intensity. The actual fertilizer application intensity represents the true amount of fertilizer input, while the counterfactual fertilizer application intensity represents the amount of fertilizer that would have been used by participating farmers if they had not engaged in the specific service model. The difference between the actual and counterfactual fertilizer application intensities is the ATT value, indicating the average treatment effect of different agricultural technology service participation models on farmers’ fertilizer application intensity.
The estimation results in Table 5 show the following: First, the market-oriented service model has a negative treatment effect on fertilizer application intensity, which is significant at the 1% statistical level. The estimated ATT value indicates that for farmers participating in the market-oriented service model, if they did not participate in this model, their fertilizer application intensity would increase from 69.834 kg to 73.625 kg, a difference of 3.791 kg, representing an increase of 5.43%.
Second, the cooperative service model also has a negative treatment effect on fertilizer application intensity, which is significant at the 1% statistical level. The estimated ATT value shows that for farmers participating in the cooperative service model, if they did not participate in this model, their fertilizer application intensity would increase from 63.054 kg to 68.074 kg, a difference of 5.020 kg, representing an increase of 7.96%.
Third, the industrialized service model has a negative treatment effect on fertilizer application intensity, which is significant at the 1% statistical level. The estimated ATT value indicates that for farmers participating in the industrialized service model, if they did not participate in this model, their fertilizer application intensity would increase from 61.321 kg to 69.166 kg, a difference of 7.845 kg, representing an increase of 12.79%. Therefore, Hypothesis 5 is validated.
To further analyze the cost-reduction effects of fertilizer reduction under market-oriented, cooperative, and industrialized service models, as illustrated in Figure 4, this study employed the sample average fertilizer price of CNY 1.63/kg (USD 0.23) for quantitative calculations. The analysis revealed significant disparities in cost-saving efficiencies achieved through fertilizer reduction technologies across the three service models. Specifically, the fertilizer reduction costs for market-based services, cooperative services, and industrialized services were CNY 6.17 (USD 0.87), CNY 8.17 (USD 1.15), and CNY 12.77 (USD 1.80), respectively, among which the cost reduction magnitude of the industrialized service model reached 2.07 times that of the market-based model.

5. Discussion on Agricultural Technology Service Model Selection

The wheat production process is divisible, with each stage having an optimal allocation of inputs. Small-scale farmers can independently complete production stages where the cost is lower than the cost of purchasing agricultural technology services [50]. Alternatively, they can choose to outsource the entire production process to service providers. However, due to varying degrees of embedded green technologies, the final outcomes in terms of fertilizer reduction and efficiency enhancement differ.
In the market-oriented service model, the main actors in agricultural production are typically ordinary farmers and large-scale growers who do not participate in any economic organizations, primarily engage in family-based production, and directly connect with the market. These farmers have full autonomy in deciding on input allocation for agricultural production. They purchase services from agricultural machinery service providers to assist in production, with the specific service prices, locations, and timing often determined flexibly based on market conditions, rather than being subject to fixed contractual agreements. These services are usually concentrated in a single stage of agricultural production. The suppliers of agricultural technology services in this model are often villagers who provide machinery services on a part-time basis. These suppliers operate on a small scale and are dispersed, lacking specialization and economies of scale. Their capacity and coverage for agricultural technology services are limited, which restricts the integration of green technologies. From the demand side, most buyers are small-scale, dispersed farmers with limited cognitive abilities. In summary, in a spontaneously formed agricultural technology service market, the many-to-many transaction model fragments the limited market capacity. This not only fails to achieve economies of scale but also increases transaction costs. The scale of supply and demand can only support transactions in necessary stages such as plowing, sowing, and harvesting, but not in non-essential stages like pesticide application and fertilization. This makes it difficult to create space for the integration of green technologies.
In the cooperative service model, farmers join cooperatives as members and receive partial services such as the supply of agricultural inputs and technical services from the cooperative. Members can enjoy discounted service prices, and the service content typically covers multiple stages of agricultural production, resulting in relatively close service transaction relationships. This model effectively promotes the integration of advanced technologies and the optimization of agricultural production management. It addresses the shortcomings of labor input and difficulties in agricultural machinery investment faced by farmers. By bulk-purchasing agricultural inputs, cooperatives can significantly reduce farmers’ production costs and lower the economic barriers to adopting green production materials. Through organized service provision, the cooperative model achieves specialization and economies of scale in service delivery. By constructing incomplete contractual relationships, it unifies fragmented demands, creating effective market capacity for the expansion of green service segments, reducing transaction costs [51], and creating space for the integration of green technologies. It is important to note that while participation in cooperatives enhances farmers’ production and management capabilities, farmers retain the flexibility to make production decisions based on their own circumstances. They are not required to purchase all services from the cooperative, reflecting the incompleteness of the contract.
In the industrialized service model, agricultural production decisions are primarily made by agricultural technology service organizations. To achieve high-quality agricultural products, these organizations integrate the forces of village collectives and cooperatives to aggregate dispersed farmers and establish large-scale production bases [52]. Through contractual or vertically integrated transaction models, modern production factors are incorporated into farmers’ production activities, enabling standardized management and supervision across all stages of agricultural production, including pre-production, production, and post-production. Under this model, farmers receive comprehensive services covering all stages of agricultural production, with interests tied together from pre-production to post-production. The contractual and mutually beneficial nature of this model provides external constraints that enhance the integration of green technologies, thereby achieving a higher degree of green production.
Farmers often prioritize short-term profit maximization in their decision-making processes [53]. Green production technologies, which have positive externalities, typically increase production costs, making farmers hesitant to adopt them. In a market with limited capacity and weak demand, small-scale and dispersed farmers have limited financial strength and risk-bearing capacity [54], making it difficult for them to independently bear the additional costs associated with green production. In such scenarios, external intervention through resource integration and demand aggregation can effectively pool fragmented market demands, allowing the costs of green technologies to be shared among multiple participants. This facilitates the wider promotion and diffusion of green technologies. Additionally, farmers are generally concerned that reducing fertilizer input may negatively impact crop yields and hinder the achievement of their short-term profit goals. The emergence of contract farming has compressed farmers’ autonomous decision-making space and standardized their production inputs. This model not only reduces the risks associated with green production but also provides external constraints that promote the adoption of green technologies.
In summary, the transition from market-oriented models to cooperative models and then to industrialized models has led to significant changes in agricultural service organizations. These organizations have evolved from individual machinery service providers to a collaborative structure involving farmers’ professional cooperatives and agricultural enterprises. The transaction forms have also shifted from market-based transactions to contractual and integrated collaborative transactions. The contractual relationships have become increasingly closed, from loose to semi-closed and then to fully closed. This has compressed the decision-making space for small farmers, with collective rational decision-making replacing individual irrational decision-making.
Agricultural technology service organizations have increasingly engaged farmers in green agricultural production [55,56]. As a result, the effects of reduced fertilizer application have become more pronounced. For example, the “company + cooperative + farmer” model has effectively aggregated fragmented market demands through resource integration and centralized demand, allowing the costs of green technologies to be shared among multiple participants. This model has not only reduced the risks associated with green production but also provided external constraints that promote the adoption of green technologies.

6. Research Conclusions and Policy Recommendations

6.1. Conclusions

This study finds that agricultural technology services can effectively reduce the use of chemical fertilizers. Specific services such as soil testing and formula fertilization, mechanical fertilization, and straw returning to the field all have significant negative impacts on fertilizer application intensity, indicating that they effectively promote the reduction in fertilizer use. As the level of engagement with agricultural services increases, farmers participating in cooperative and industrialized service models exhibit further reductions in fertilizer application intensity compared to those in market-oriented models. This suggests that more integrated service models can better support the adoption of green production practices. Further implementation of agricultural technology services will help reduce agricultural non-point source pollution, ensure food quality and safety, promote the transition to a resource-efficient and environmentally friendly sustainable agricultural model, and achieve the dual goals of ecological conservation alongside stable production and increased income.

6.2. Policy Recommendations

Strengthening the technological support for agricultural technology services is crucial. Advanced technologies and scientific agronomic practices are key factors for agricultural technology service organizations to effectively guide farmers in reducing chemical fertilizer use. The government should further leverage the technology dissemination advantages of these organizations. First, the government or industry associations should establish online and offline technology exchange platforms to facilitate the sharing of technical experiences and innovative models for fertilizer reduction and efficiency improvement among agricultural technology service organizations. They should also organize industry-academia-research docking activities between service organizations, research institutions, and universities to accelerate the transformation and application of scientific and technological achievements. Second, agricultural technology service organizations should be encouraged to collaborate with research institutions to conduct research and development on fertilizer reduction technologies and the application of new agronomic practices, such as the development of new fertilizers, precision fertilization technology innovation, and efficient utilization of organic fertilizers. Service organizations that achieve significant results in technological innovation should be rewarded and honored. Third, agricultural technology expert teams should be organized to provide regular technical guidance and training for agricultural social service organizations, including soil testing techniques, fertilizer application plan formulation, and the use of new fertilizers, to promptly address technical issues encountered by service organizations in fertilizer reduction efforts.
Encouraging service providers to innovate service models and organizational forms is essential during the critical period of agricultural modernization transformation. Incentivizing service providers to innovate service models and organizational forms is of key significance for developing a diversified and specialized agricultural service system. First, based on local resource endowments, industrial structures, and actual agricultural development, diverse service models covering single-link, multi-link, and full-process production entrustment should be explored and developed to precisely meet the differentiated and diversified service needs in agricultural production. Second, leveraging the organizational advantages of new types of agricultural management entities, mature organizational forms such as “service provider + rural collective economic organization + farmers” and “service provider + various new management entities + farmers” should be actively promoted and deepened. By establishing a sound mechanism for profit distribution and risk-sharing, a close cooperative relationship can be fostered among participating entities to create a stable community of shared interests and risks. Third, from the perspective of integrated industrial development, agricultural leading enterprises, technology companies, and internet platforms should be actively guided to expand into the agricultural service sector. This will promote the deep integration of technology and materials, as well as technology and services, to achieve efficient allocation of technological elements throughout the agricultural production process.

Author Contributions

C.L. contributed to the conceptualization, methodology, software, validation, formal analysis, investigation, data curation, writing—original draft, writing—review and editing, and visualization. L.X. contributed to the conceptualization, project administration, resources, writing—review and editing, supervision, and funding acquisition. T.Z. contributed to the conceptualization, resources, writing—review and editing. All authors have read and agreed to the published version of the manuscript.

Funding

This research was funded by The Agricultural Science and Technology Innovation Program, grant number 10-IAED-02-2025.

Data Availability Statement

The data from this study are not yet publicly available due to other research findings that have not yet been disclosed. Consider contacting the authors if there is a reasonable need for partial disclosure at the authors’ discretion.

Conflicts of Interest

The authors declare no conflicts of interest.

Abbreviations

The following abbreviations are used in this manuscript:
STFRSSoil Testing and Fertilizer Recommendation
MFASMechanical Fertilizer Application Service
SRSStraw Returning Service
CNYChinese Yuan

References

  1. Takeshima, H.; Adhikari, R.P.; Shivakoti, S.; Kaphle, B.D.; Kumar, A. Heterogeneous returns to chemical fertilizer at the intensive margins: Insights from Nepal. Food Policy 2017, 69, 97–109. [Google Scholar] [CrossRef]
  2. Liu, Y.; Zhou, Y. Reflections on China’s food security and land use policy under rapid urbanization. Land Use Policy 2021, 109, 105699. [Google Scholar] [CrossRef]
  3. Liu, Y.; Sun, D.; Wang, H.; Wang, X.; Yu, G.; Zhao, X. An evaluation of China’s agricultural green production: 1978–2017. J. Clean. Prod. 2020, 243, 118483. [Google Scholar] [CrossRef]
  4. Zheng, W.; Luo, B.; Hu, X. The determinants of farmers’ fertilizers and pesticides use behavior in China: An explanation based on label effect. J. Clean. Prod. 2020, 272, 123054. [Google Scholar] [CrossRef]
  5. Ren, H.; Han, K.; Liu, Y.; Zhao, Y.; Zhang, L.; He, Q.; Li, Z.; Zhang, J.; Liu, P.; Wang, H.; et al. Improving smallholder farmers’ maize yields and economic benefits under sustainable crop intensification in the North China Plain. Sci. Total Environ. 2021, 763, 143035. [Google Scholar] [CrossRef]
  6. Li, S.; Zhu, Y.; Li, X. Analysis of the Decisions of Farmers Working Different Sized Farms to Constantly Use Soil Testing Formula Fertilizer. J. Resour. Ecol. 2018, 9, 146–153. [Google Scholar] [CrossRef]
  7. Li, S.; Lei, Y.; Zhang, Y.; Liu, J.; Shi, X.; Jia, H.; Wang, C.; Chen, F.; Chu, Q. Rational trade-offs between yield increase and fertilizer inputs are essential for sustainable intensification: A case study in wheat–maize cropping systems in China. Sci. Total Environ. 2019, 679, 328–336. [Google Scholar] [CrossRef]
  8. Shao, Y.; Xie, Y.; Wang, C.; Yue, J.; Yao, Y.; Li, X.; Liu, W.; Zhu, Y.; Guo, T. Effects of different soil conservation tillage approaches on soil nutrients, water use and wheat-maize yield in rainfed dry-land regions of North China. Eur. J. Agron. 2016, 81, 37–45. [Google Scholar] [CrossRef]
  9. Ren, S.; Li, E.; Deng, Q.; Cui, Z. Characteristics of Chemical Fertilizer Application and Environmental Risk Assessment of Three Major Food Crops in China. Resour. Environ. Yangtze Basin 2019, 28, 2936–2947. (In Chinese) [Google Scholar]
  10. Brack, W.; Altenburger, R.; Schüürmann, G.; Krauss, M.; López Herráez, D.; van Gils, J.; Slobodnik, J.; Munthe, J.; Gawlik, B.M.; van Wezel, A.; et al. The SOLUTIONS project: Challenges and responses for present and future emerging pollutants in land and water resources management. Sci. Total Environ. 2015, 503–504, 22–31. [Google Scholar] [CrossRef]
  11. Chen, X.; Cui, Z.; Fan, M.; Vitousek, P.; Zhao, M.; Ma, W.; Wang, Z.; Zhang, W.; Yan, X.; Yang, J.; et al. Producing more grain with lower environmental costs. Nature 2014, 514, 486–489. [Google Scholar] [CrossRef]
  12. Soule, M.J. Soil Management and the Farm Typology: Do Small Family Farms Manage Soil and Nutrient Resources Differently than Large Family Farms. Agric. Resour. Econ. Rev. 2001, 30, 179–188. [Google Scholar] [CrossRef]
  13. Sun, Y.; Hu, R.; Zhang, C. Does the adoption of complex fertilizers contribute to fertilizer overuse? Evidence from rice production in China. J. Clean. Prod. 2019, 219, 677–685. [Google Scholar] [CrossRef]
  14. Huan, M.; Zhan, S. Agricultural Production Services, Farm Size and Chemical Fertilizer Use in China’ s Maize Production. Land 2022, 11, 1931. [Google Scholar] [CrossRef]
  15. Farooq, U.; Akmal, M.; Ahmad, Q.; Akram, Z.; Arshad, A.; Qamar, H.; Ullah, H.; Zubair, M.; Khurshid, M.R. Biofortification of Mungbean (Vigna radiata) using Iron- Enriched Organic Amendment. Pak. J. Agric. Res. 2021, 34, 394–671. [Google Scholar] [CrossRef]
  16. Raza, A.; Ahmad, S.; Mateen, A.; Arshad, A.; Rehman, A. Effect of copper nanoparticles on growth parameters of maize seedlings. Int. J. Nanotechnol. 2022, 19, 1143–1157. [Google Scholar]
  17. Arshad, A.; Qamar, H.; Siti-Sundar, R.; Yue, Z.; Zubair, M.; Raza, M.A.; Habib-ur-Rehman, M.; Zhang, L. Phenotypic Plasticity of Spineless Safflower (Carthamus tinctorius L.) Cultivars in Response to Exogenous Application of Salicylic Acid under Rainfed Climate Conditions. Pak. J. Agric. Res. 2020, 33, 729. [Google Scholar] [CrossRef]
  18. Wang, R.; Zhang, Y.; Zou, C. How does agricultural specialization affect carbon emissions in China? J. Clean. Prod. 2022, 370, 133463. [Google Scholar] [CrossRef]
  19. Zhang, H.; Wu, D. The Impact of Rural Industrial Integration on Agricultural Green Productivity Based on the Contract Choice Perspective of Farmers. Agriculture 2023, 13, 1851. [Google Scholar] [CrossRef]
  20. Shi, F.; Cai, B.; Meseretchanie, A.; Geremew, B.; Huang, Y. Agricultural socialized services to stimulate the green production behavior of smallholder farmers: The case of fertilization of rice production in south China. Front. Environ. Sci. 2023, 11, 1169753. [Google Scholar] [CrossRef]
  21. Zhang, L.; Xue, L.; Zhou, Y. How do low-carbon policies promote green diffusion among alliance-based firms in China? An evolutionary-game model of complex networks. J. Clean. Prod. 2019, 210, 518–529. [Google Scholar] [CrossRef]
  22. Pan, D.; Zhang, N. The Role of Agricultural Training on Fertilizer Use Knowledge: A Randomized Controlled Experiment. Ecol. Econ. 2018, 148, 77–91. [Google Scholar] [CrossRef]
  23. Pan, D.; Kong, F.; Zhang, N.; Ying, R. Knowledge training and the change of fertilizer use intensity: Evidence from wheat farmers in China. J. Environ. Manag. 2017, 197, 130–139. [Google Scholar] [CrossRef]
  24. Emmanuel, D.; Owusu-Sekyere, E.; Owusu, V.; Jordaan, H. Impact of agricultural extension service on adoption of chemical fertilizer: Implications for rice productivity and development in Ghana. NJAS Wagening. J. Life Sci. 2016, 79, 41–49. [Google Scholar] [CrossRef]
  25. Antoci, A.; Iannucci, G.; Rocchi, B.; Ticci, E. The land allocation game: Externalities and evolutionary competition. Struct. Change Econ. D 2023, 64, 124–133. [Google Scholar] [CrossRef]
  26. Alemayehu, G.; Shibabaw, A.; Adgo, E.; Asch, F.; Freyer, B. Crop rotation and organic matter application restore soil health and productivity of degraded highland crop farms in northwest Ethiopia. Cogent Food Agric. 2020, 6, 1831124. [Google Scholar] [CrossRef]
  27. Dong, H.; Zhang, Y.; Chen, T.; Li, J. Acceptance Intention and Behavioral Response to Soil-Testing Formula Fertilization Technology: An Empirical Study of Agricultural Land in Shaanxi Province. Int. J. Environ. Res. Public Health 2023, 20, 951. [Google Scholar] [CrossRef]
  28. Yamauchi, F. Rising real wages, mechanization and growing advantage of large farms: Evidence from Indonesia. Food Policy 2016, 58, 62–69. [Google Scholar] [CrossRef]
  29. Gao, L.; Wang, C.; Wu, A.; Chen, H.; Liao, Q.; Liao, Y. Effect of layered fertilizer strategies on rapeseed (Brassica napus L.) productivity and soil macropore characteristics under mechanical direct-sowing. Sci. Rep. 2024, 14, 25457. [Google Scholar] [CrossRef]
  30. Lu, F. How can straw incorporation management impact on soil carbon storage? A meta-analysis. Mitig. Adapt. Strateg. Glob. Change 2015, 20, 1545–1568. [Google Scholar] [CrossRef]
  31. Ren, Z.; Zhong, K. Driving mechanism of subjective cognition on farmers’ adoption behavior of straw returning technology: Evidence from rice and wheat producing provinces in China. Front. Psychol. 2022, 13, 922889. [Google Scholar] [CrossRef]
  32. Chen, J.; Pang, D.; Jin, M.; Luo, Y.; Li, H.; Li, Y.; Wang, Z. Improved soil characteristics in the deeper plough layer can increase grain yield of winter wheat. J. Integr. Agric. 2020, 19, 1215–1226. [Google Scholar] [CrossRef]
  33. He, J.; Shi, Y.; Yu, Z. Subsoiling improves soil physical and microbial properties, and increases yield of winter wheat in the Huang-Huai-Hai Plain of China. Soil. Tillage Res. 2019, 187, 182–193. [Google Scholar] [CrossRef]
  34. Chen, W.; Yuan, W.; Wang, J.; Wang, Z.; Zhou, Z.; Liu, S. No-Tillage Combined with Appropriate Amount of Straw Returning Increased Soil Biochemical Properties. Sustainability 2022, 14, 4875. [Google Scholar] [CrossRef]
  35. Liang, Q.; Ma, K.; Liu, W. The role of farmer cooperatives in promoting environmentally sustainable agricultural development in China: A review. Ann. Public Coop. Econ. 2023, 94, 741–759. [Google Scholar] [CrossRef]
  36. Huang, Z.; Liang, Q. Agricultural organizations and the role of farmer cooperatives in China since 1978: Past and future. China Agric. Econ. Rev. 2018, 10, 48–64. [Google Scholar] [CrossRef]
  37. Li, C.; Deng, H.; Yu, G.; Kong, R.; Liu, J. Impact Effects of Cooperative Participation on the Adoption Behavior of Green Production Technologies by Cotton Farmers and the Driving Mechanisms. Agriculture 2024, 14, 213. [Google Scholar] [CrossRef]
  38. Bai, Z.; Wang, T.; Xu, J.; Li, C. Can Agricultural Productive Services Inhibit Carbon Emissions? Evidence from China. Land 2023, 12, 1313. [Google Scholar] [CrossRef]
  39. Zhou, Z.; Liao, H.; Li, H. The Symbiotic Mechanism of the Influence of Productive and Transactional Agricultural Social Services on the Use of Soil Testing and Formula Fertilization Technology by Tea Farmers. Agriculture 2023, 13, 1696. [Google Scholar] [CrossRef]
  40. Tang, L.; Liu, Q.; Yang, W.; Wang, J. Do agricultural services contribute to cost saving? Evidence from Chinese rice farmers. China Agric. Econ. Rev. 2018, 10, 323–337. [Google Scholar] [CrossRef]
  41. Bourguignon, F.; Fournier, M.; Gurgand, M. Selection bias corrections based on the multinomial logit model: Monte carlo comparisons. J. Econ. Surv. 2007, 21, 174–205. [Google Scholar] [CrossRef]
  42. Khonje, M.G.; Manda, J.; Mkandawire, P.; Tufa, A.H.; Alene, A.D. Adoption and welfare impacts of multiple agricultural technologies: Evidence from eastern Zambia. Agric. Econ. 2018, 49, 599–609. [Google Scholar] [CrossRef]
  43. Kassie, M.; Teklewold, H.; Marenya, P.; Jaleta, M.; Erenstein, O. Production Risks and Food Security under Alternative Technology Choices in Malawi: Application of a Multinomial Endogenous Switching Regression. J. Agric. Econ. 2015, 66, 640–659. [Google Scholar] [CrossRef]
  44. Pan, D.; He, M.; Kong, F. Risk attitude, risk perception, and farmers’ pesticide application behavior in China: A moderation and mediation model. J. Clean. Prod. 2020, 276, 124241. [Google Scholar] [CrossRef]
  45. Wang, N.; Gao, Y.; Wang, Y.; Li, X. Adoption of eco-friendly soil-management practices by smallholder farmers in Shandong Province of China. Soil Sci. Plant Nutr. 2016, 62, 185–193. [Google Scholar] [CrossRef]
  46. Wang, Y.; Zhu, Y.; Zhang, S.; Wang, Y. What could promote farmers to replace chemical fertilizers with organic fertilizers? J. Clean. Prod. 2018, 199, 882–890. [Google Scholar] [CrossRef]
  47. Gao, E.; Zheng, J.; Zhu, J. Research on the Diversified Synergistic Pathways of Translation Service Outsourcing, Production Environment, and Fertilizer Reduction in Food Crops: A Case Study of the Land Entrustment Production Model. Rural. Econ. 2023, 08, 68–77. (In Chinese) [Google Scholar]
  48. Zhu, X.; Hu, R.; Zhang, C.; Shi, G. Does Internet use improve technical efficiency? Evidence from apple production in China. Technol. Forecast. Soc. 2021, 166, 120662. [Google Scholar] [CrossRef]
  49. Huang, J.; Wang, Y.; Wang, J. Farmers’ Adaptation to Extreme Weather Events through Farm Management and Its Impacts on the Mean and Risk of Rice Yield in China. Am. J. Agric. Econ. 2015, 97, 602–617. [Google Scholar] [CrossRef]
  50. Olutumise, A.I.; Ekundayo, B.P.; Omonijo, A.G.; Akinrinola, O.O.; Aturamu, O.A.; Ehinmowo, O.O.; Oguntuase, D.T. Unlocking sustainable agriculture: Climate adaptation, opportunity costs, and net revenue for Nigeria cassava farmers. Discov. Sustain. 2024, 5, 67. [Google Scholar] [CrossRef]
  51. Jiang, X.; Chang, J.; Sun, H. Inframarginal Model Analysis of the Evolution of Agricultural Division of Labor. Mathematics 2019, 7, 1152. [Google Scholar] [CrossRef]
  52. Chen, Z.; Tang, C.; Liu, B.; Liu, P.; Zhang, X. Can socialized services reduce agricultural carbon emissions in the context of appropriate scale land management? Front. Environ. Sci. 2022, 10, 1039760. [Google Scholar] [CrossRef]
  53. Li, J.; Rodriguez, D.; Zhang, D.; Ma, K. Crop rotation model for contract farming with constraints on similar profits. Comput. Electron. Agric. 2015, 119, 12–18. [Google Scholar] [CrossRef]
  54. Chen, W.; Jiang, Y. Application of Markov Model-Based IoT in Agricultural Insurance and Risk Management. Mob. Inf. Syst. 2021, 2021, 8723258. [Google Scholar] [CrossRef]
  55. Yuedong, Z.; Yifang, Z.; Jiaxian, X. The Impact of Agricultural Technology Services on the Efficiency of Green Grain Production: An Analysis Based on the Generalized Stochastic Forest Model. J. Resour. Ecol. 2024, 15, 243–257. [Google Scholar] [CrossRef]
  56. Qing, C.; Zhou, W.; Song, J.; Deng, X.; Xu, D. Impact of outsourced machinery services on farmers’ green production behavior: Evidence from Chinese rice farmers. J. Environ. Manag. 2023, 327, 116843. [Google Scholar] [CrossRef]
Figure 1. Geographical Location of the Study Area.
Sustainability 17 02840 g001
Figure 2. Methodological Framework of Agricultural Technology Services and Fertilizer Application Practices.
Sustainability 17 02840 g002
Figure 3. Fertilizer Application Between Groups Adopters and Non-Adopters.
Sustainability 17 02840 g003
Figure 4. Fertilizer Reduction in Different Agricultural Technology Service Models.
Sustainability 17 02840 g004
Table 1. Descriptive Statistics and Variable Selection for Agricultural Technology Services and Fertilizer Application Variables.
VariableDescriptionObservationsMeanStandard
Deviation
Dependent
Variable
FertilizerThe Actual value of Fertilizer Application Intensity (kg/mu)92671.59324.346
Core Explanatory VariablesServiceThe Actual value of agricultural technology services cost (CNY/mu)926139.024106.226
STFRS (Soil Testing and Fertilizer Recommendation)Whether soil testing and fertilizer recommendation service was chosen in 2023? Yes = 1, No = 09260.2810.450
MFAS (Mechanical Fertilizer Application Service)Whether mechanical fertilizer application service was chosen in 2023? Yes = 1, No = 09260.3710.483
SRS (Straw Returning Service)Whether straw returning service was chosen in 2021? Yes = 1, No = 09260.7380.440
ATSM (Agricultural Technology Service Model)What type of agricultural technology service model did the famer participate in? Non-participation = 0, Market-oriented = 1, Cooperative = 2, Industrialized = 3.9261.1090.914
Household Head CharacteristicsGenderMale = 1, Female = 09260.7190.450
AgeActual value (years)92652.44413.075
EducationActual value (years of education)9269.1363.754
Risk AttitudeWillingness to take risks for higher returns: 1 = Strongly Disagree, 2 = Disagree, 3 = Neutral, 4 = Agree, 5 = Strongly Agree9262.8261.066
Family Management CharacteristicsLDR (Labor Dependency Ratio)Labor Dependency Ratio = Non-labor population/labor population in the household9261.2481.179
DAS (Degree of Agricultural Specialization)Degree of Agricultural Specialization = Agricultural income/total household income9260.3890.521
Agricultural Production CharacteristicsOrganic FertilizerActual value (kg/mu)92632.978205.524
Cultivated AreaActual value (mu)92684.092213.019
Soil FertilitySoil fertility: 1 = Very Poor, 2 = Poor, 3 = Medium, 4 = Good, 5 = Excellent9263.7331.122
Irrigation CapacityEase of water access for irrigation: 1 = Very Difficult, 2 = Difficult, 3 = Medium, 4 = Easy, 5 = Very Easy9264.0531.285
External Environmental CharacteristicsDisasterNumber of times severely affected by natural disasters in the past five years9261.1001.134
Table 2. Independent Samples t-test Results Comparing Fertilizer Application Between Groups Adopters and Non-Adopters.
VariableNon-AdoptersAdoptersDifference
(N = 227)(N = 699)
Fertilizer Application (kg/mu)77.897
(1.828)
69.546
(0.865)
8.351 ***
(1.840)
Fertilizer Cost (CNY/mu)255.188
(6.514)
226.453
(2.986)
26.735 ***
(6.421)
Note: *** indicate significance at the 1% levels. Standard errors are reported in parentheses.
Table 3. Ordinary Least Squares Regression Analysis of Agricultural Technology Services on Fertilizer Application Intensity.
VariableFertilizer
(1)(2)(3)(4)
Service−0.020 ***
(0.005)
−0.020 ***
(0.005)
−0.019 ***
(0.005)
−0.013 **
(0.006)
Gender −0.068 ***
(0.026)
−0.069 ***
(0.027)
−0.065 **
(0.028)
Age −0.003 **
(0.001)
−0.003 **
(0.001)
−0.002 **
(0.001)
Education −0.014 ***
(0.004)
−0.015 ***
(0.004)
−0.015 ***
(0.004)
Risk Attitude −0.009
(0.010)
−0.009
(0.01)
−0.010
(0.01)
LDR −0.007
(0.010)
−0.006
(0.010)
DAS 0.013
(0.019)
0.021
(0.020)
Organic Fertilizer 0.023 **
(0.010)
Cultivated Area 0.007
(0.008)
Soil Fertility −0.005 ***
(0.012)
Irrigation Capacity 0.058 *
(0.011)
Disaster 0.025
(0.014)
Constant4.301 ***
(0.023)
4.643 ***
(0.083)
4.643 ***
(0.083)
4.328 ***
(0.110)
R-squared0.1140.1420.1430.183
Observations926926926926
Note: *, **, and *** indicate significance at the 10%, 5%, and 1% levels, respectively. Robust standard errors are reported in parentheses.
Table 4. Average Treatment Effects of Agricultural Technology Services on Fertilizer Application Intensity Using ESR Model.
GroupActual AdoptersNon-AdoptersATTATU
Actual Adopters4.190 ***
(0.004)
4.288 ***
(0.003)
−0.098 ***
(0.005)
Non-adopters4.161 ***
(0.008)
4.308 ***
(0.007)
−0.147 ***
(0.011)
Note: *** indicate significance at the 1% levels. Standard errors are reported in parentheses.
Table 5. Heterogeneous Effects of Agricultural Technology Service Components on Fertilizer Application Intensity.
Variable Fertilizer
(5)(6)(7)(8)(9)(10)
STFRS−0.062 ** −0.088 ***
(0.026) (0.027)
MFAS −0.140 *** −0.104 ***
(0.024) (0.024)
SRS −0.050 * −0.064 *
(0.027) (0.038)
Gender −0.036−0.030−0.012
(0.026)(0.025)(0.024)
Age −0.002 **−0.002 **−0.001
(0.001)(0.001)(0.001)
Education −0.010 ***−0.009 **−0.009 ***
(0.004)(.004)(0.004)
Risk Attitude −0.003−0.0070.009
(0.010)(0.010)(0.011)
LDR −0.010−0.009−0.003
(0.009)(0.009)(0.009)
DAS 0.001−0.008−0.006
(0.021)(0.021)(0.022)
Organic Fertilizer 0.030 ***0.023 **0.014 *
(0.010)(0.010)(0.008)
Cultivated Area 0.031 ***0.026 ***0.029 ***
(0.010)(0.010)(0.011)
Soil Fertility 0.0140.0180.010
(0.012)(0.012)(0.015)
Irrigation Capacity 0.032 ***0.024 **−0.013
(0.011)(0.012)(0.014)
Disaster 0.045 ***0.038 ***0.037 ***
(0.015)(0.014)(0.016)
Constant4.292 ***4.347 ***4.320 ***4.236 ***4.331 ***4.204 ***
(0.026)(0.029)(0.033)(0.098)(0.096)(0.157)
R-squared0.1000.1260.0980.1680.1730.552
Observations926926926926926926
Note: *, **, and *** indicate significance at the 10%, 5%, and 1% levels, respectively. Robust standard errors are reported in parentheses.
Table 6. Heterogeneous Effects of Agricultural Technology Service Models on Fertilizer Application Intensity.
Agricultural Technology
Service Model Selection
Actual Fertilizer Application IntensityCounterfactual Fertilizer
Application Intensity
ATT
Market-oriented Service Model69.834 *** (0.460)73.625 *** (0.363)−3.791 *** (0.556)
Cooperative Service Model63.054 *** (1.062)68.074 *** (0.715)−5.020 *** (0.859)
Industrialized Service Model61.321 *** (0.837)69.166 *** (0.592)−7.845 *** (0.884)
Note: *** indicate significance at the 1% levels. Standard errors are reported in parentheses.
Disclaimer/Publisher’s Note: The statements, opinions and data contained in all publications are solely those of the individual author(s) and contributor(s) and not of MDPI and/or the editor(s). MDPI and/or the editor(s) disclaim responsibility for any injury to people or property resulting from any ideas, methods, instructions or products referred to in the content.

