Abstract
Against the backdrop of a global economic slowdown, this study examines the impact of the digital intelligence economy on regional high-quality development across 30 Chinese provinces from 2008 to 2022, considering the moderating role of economic policy uncertainty. Using the entropy method to construct composite indicators for the digital intelligence economy and high-quality development, this study applies benchmark regression, mediation analysis, moderation analysis, spatial Durbin models and threshold models. The results show that the digital intelligence economy significantly promotes regional high-quality development through increased innovation investment, enhanced innovation capabilities and entrepreneurship. However, this impact is non-linear: while it initially hinders high-quality development in less developed regions, it becomes beneficial as the economy matures. Economic policy uncertainty negatively moderates this relationship, especially in the more developed eastern regions. Additionally, the digital intelligence economy exhibits positive spatial spillover effects, driving high-quality development in the neighboring areas. The study concludes that policymakers should prioritize digital infrastructure, stabilize economic policies to reduce uncertainty, and promote interregional collaboration to leverage spillover benefits, and tailored strategies are essential to bridge development gaps. This study fills the gap in understanding the interactive effects of the digital intelligence economy and economic policy uncertainty on regional development.
1. Introduction
In today’s world, human society is facing a technological revolution. The emergence of artificial intelligence and big data models has led to the digital and intelligent transformation of society. This changes the production relations of society, drives significant changes in the economy and people’s lives, and stimulates the potential for social innovation and development, giving rise to a digital intelligence economy. The digital intelligence economy is a new type of economy that combines digitalization and intelligence. Digitalization is mainly characterized by big data analysis and processing, while intelligence is centered on machine learning and artificial intelligence. Compared with traditional economic models, the digital intelligence economy can optimize the economic structure and enhance economic growth momentum [1] and has become one of the important driving factors for global economic recovery. The advent of digital information technologies, including mobile Internet, big data, artificial intelligence, and blockchain, has reshaped the global economic landscape and driven the transformation and upgrading of economic structures [2].
Digital intelligence transformation has not only reshaped the global economic landscape but also prompted a series of policy responses and strategic shifts in major economies, including China. The Chinese government first highlighted the application of big data in its 2014 work report, and later, in the 2016 report of the 19th National Congress of the Communist Party of China, it explicitly called for the deep integration of the Internet, big data, artificial intelligence, and the real economy. Currently, the world is in the midst of a new round of industrial revolution, and the core features of Industry 4.0 are digitalization, automation, and human-computer interaction, while Lu’s research [3] shows that Industry 4.0 is closely linked to intelligent technologies. The digital economy, as a fusion of digitalization and intelligence, focuses more on the application of intelligent technologies than the traditional digital economy and has a more far-reaching impact on the economy and society.
Amid these technological advancements, China has actively embraced the digital revolution as a key driver of economic restructuring and upgrading. Amidst the backdrop of slowing global economic growth and rising debt levels, the Chinese government declared at the 19th National Congress in 2017 that China’s economy had transitioned from a phase of high-speed growth to one of high-quality development. Regional high-quality development refers to a state of development in a specific region where economic growth is of high quality, effective, and sustainable by optimizing the economic structure, enhancing industrial competitiveness, and achieving green development. It emphasizes the balance, coordination, and sustainability of development, aiming to achieve harmonious development in the region in terms of the economy, society, environment, and other aspects [4]. High-quality development differs from high-speed growth, which relies solely on GDP growth rates, as it focuses more on addressing the issues of imbalance, incoordination, and unsustainability in economic development [5]. High-quality development is not only reflected in economic growth but also encompasses technological innovation, green environmental protection, and other aspects. The high-quality development strategy advocated by the Chinese government has achieved certain results and played an important role in promoting economic recovery and technological development. The intelligent and digital features of the digital intelligence economy are highly compatible with the coordination, balance, and sustainability required for regional high-quality development [6].
As a product of technological innovation, the digital intelligence economy has the advantages of high efficiency [7], low pollution [8], sustainability [9], and strong coordination and flexibility, which can effectively solve the imbalance problem in regional development and thus powerfully promote regional high-quality development. Based on this, this paper selects 30 provinces in China from 2008 to 2022 as the research object, and uses the entropy weight method to construct digital intelligence economic indicators from three aspects of industrial digitalization, industrial intelligence, and industrial upgrading. It constructs high-quality development indicators from five aspects: coordination, greenness, innovation, openness, and sharing. Further, this paper explores the influence of the digital intelligence economy on regional high-quality development from three dimensions: innovation, entrepreneurship, and innovation investment. It also examines the moderating role of economic policy uncertainty from two dimensions of fiscal policy and foreign trade policy.
This study is dedicated to exploring the impact mechanisms of the digital economy on regional high-quality development, including the impact paths, spatial effects, and non-linear threshold effects, with a focus on examining the moderating effects of different economic policy uncertainties. Compared to past studies, this study intends to fill the gap in the research on intelligence and economic policy uncertainty. Past studies have focused on the digital economy perspective [7,10,11], while few have addressed the concept of intelligence and the digital intelligence economy. In addition, while past studies have often studied policy uncertainty as an independent variable [12,13] or dependent variable [14,15], this study examines the mechanism of policy uncertainty from the perspective of moderating effect and investigates the mechanism of the impact of the digital intelligence economy on regional high-quality development by constructing the mediation model and the moderating model. Meanwhile, the spatial Durbin model is introduced to respond more comprehensively to the spillover effect of the digital intelligence economy. This study provides a theoretical basis for regions to achieve high-quality development through digitalization and intelligence, considering the influence of economic policy uncertainty. The heterogeneity analysis and threshold effect analysis in this study also provide different policy recommendations for regions with different development levels.
2. Theoretical Framework
2.1. Literature Review
In the past, the academic community has mainly focused on the aspect of digitalization. Digitalization has a profound impact on all aspects of the economy and society. Researchers have conducted extensive studies on the impact of the digital economy from both micro and macro perspectives, such as enterprise innovation [16], financing constraints [17], green development [18], and government support [19]. In research on intelligence, Hussain [20] proved that digital intelligence has a positive effect on enterprise innovation performance, and Nahar [21] showed that it is also significant for achieving sustainable social development. Regarding the impact of the digital intelligence economy on high-quality development, most studies have only considered the digital aspect. Ma and Zhu [22] found that the digital economy affects regional high-quality development in terms of industrial structure and technological innovation. In addition, Guo [23] used the DID method to study the impact of big data experimental zones on regional high-quality development and found that the digital economy has a promoting effect on high-quality development. In terms of intelligence, Wang’s latest research [24] found that artificial intelligence technology has a positive impact on the energy high-quality development, which provides certain inspiration for the research on the impact of digital intelligence on regional high-quality development. Jian [25] examined the impact of AI on the high-quality development of China’s economy from the perspective of wholesale and retail trade and suggested that there are spatial differences in the impact of intelligent technologies.
While these studies have provided valuable insights into the role of digitalization in various economic and social contexts, the current international academic community has focused on the connection between the digital intelligence economy and regional high-quality development. Most existing research is based on the status quo of China’s efforts to achieve regional high-quality development. Rao [26] demonstrated that digital finance can significantly enhance corporate technological innovation levels and proved from a corporate finance perspective that digitalization and intelligence are urgently needed for high-quality regional development. Xu [27] investigated the impact of the digital intelligence economy on common prosperity, emphasizing the threshold effect of the digital intelligence economy, which is constrained by regional development. For other countries in the world, although there are few studies that refer to ‘high-quality development’, there are also studies on intelligence and sustainable economic development, which is also a manifestation of high-quality development. Duc [28] measured the level of digital economy in Vietnam and found that the contribution of digital economy development to GDP has been increasing annually, which is somewhat related to the popularization of intelligent technologies. Ababio [29] analyzed panel data from 48 low- and middle-income countries to examine the impact of digital finance on inclusive economic development and found a positive link between digital finance and sustainable development. For developed countries, Zhang [30] found in a study of the G7 countries that the digital economy promoted the recovery of developed countries’ economies by boosting the development of the tourism industry. In addition to the impact of digitalization and intelligence, Ades’s study [31] found that regional corruption affects the investment climate and the efficiency of resource allocation. Komornicki [32] found that regional economic development cannot be achieved without the construction of new transport facilities; therefore, infrastructure bottlenecks may limit high-quality regional development. All of these, in turn, impact high-quality development.
Despite the growing interest in the digital intelligence economy, research on its impact on high-quality development is still limited, especially in terms of regional differences and impact mechanisms. According to Schumpeter’s theory of creative destruction and endogenous growth theory [33], innovation is the core driving force of economic development. The digital intelligence economy promotes “creative destruction” through digital and intelligent technologies, breaks traditional industrial patterns, and gives rise to new business forms, thereby enhancing regional innovation levels. Moreover, the digital intelligence economy accelerates knowledge spillover effects through data accumulation and intelligent technology applications, becoming an endogenous driving force for regional high-quality development [34]. This study explores the internal connection between the digital intelligence economy and regional high-quality development.
However, it is necessary to pay attention to the current global economic and social situation, which is constantly changing. The prevalence of unilateralism and trade protectionism has brought great uncertainty to the economic policies of all countries, including monetary policy and foreign trade policy. For the research on the digital intelligence economy and high-quality development, economic policy uncertainty must be taken into account. Economic policy uncertainty (EPU) has been widely studied. It refers to the situation where economic agents cannot predict the future monetary, fiscal, trade, and financial regulatory policies to be adopted by the government. Dinh [13] proved that the EPU includes the unpredictability of policy changes themselves, the factors that trigger policy changes (such as political uncertainty and economic fluctuations), and the phenomena and economic results caused by it. EPU has a significant impact on the macroeconomy, and past studies have mainly focused on technological innovation [35], corporate investment [12], and financial stability [13]. These studies show that the EPU has a direct impact on regional economic and social development.
Given the significant role of economic policy uncertainty in shaping the business environment, it is crucial to examine how it interacts with the digital intelligence economy to affect the high-quality development. In addition to the direct impacts identified in previous studies, economic policy uncertainty may also have indirect effects on the digital intelligence economy system. EPU can lead to a reduction in corporate investment [12,36], which in turn affects corporate operations and development and is indirectly detrimental to corporate technological innovation. At the same time, the high-risk costs brought about by EPU may also reduce regional innovation performance. Peng’s research [35] found that the impact of EPU on green innovation in sustainable development is particularly significant. Innovation and sustainability are important characteristics of the digital intelligence economy and high-quality development, and EPU may have an important impact on both. Therefore, this study investigates the impact mechanism of the digital intelligence economy on regional high-quality development, focusing on the role of economic policy uncertainty in this process.
2.2. Theoretical Analysis and Hypotheses: Impact Mechanism Analysis
Artificial intelligence technology is now developing at a rapid pace and will have a significant impact on the regional economy and innovation development [24]. According to the Solow growth model, Schumpeter’s theory of creative destruction, and endogenous growth theory, the technology-driven economic model of the digital intelligence economy will affect regional development in terms of innovation investment. Meanwhile, according to the new economic geography theory, DIE is likely to produce spatial spillover effects.
The impact of policy uncertainty on economic growth has been an important direction for economics research in recent years. According to expectation theory, economic agents make investment and production decisions based on their expectations of future policy changes [36]. When policy uncertainty is high, firms face increased risk and uncertainty, which leads to a decrease in investment and innovation activities.
We therefore make the following hypothetical inferences.
2.2.1. Digital Intelligence Economy and Regional High-Quality Development
Digitalization and intelligence are the main paths for future social progress, and the digital intelligence economy will promote the realization of regional high-quality development. The process of digitalization and intelligence is accompanied by a series of major scientific discoveries and technological breakthroughs. From the perspective of investment, this is undoubtedly a great piece of news, and investment in innovation in various regions has also increased with the development of digitalization and intelligence. An increase in investment in the innovation field brings significant development prospects to various regions. The digital intelligence economy attracts substantial capital inflows, with both enterprises and governments increasing their investments in digital transformation and intelligent technology applications [19]. These investments not only drive the development of new technologies but also upgrade traditional industries. In addition, the innovation level of digitalization and intelligence technologies, represented by information networks, artificial intelligence, and advanced manufacturing, has made great progress. The improvement of the innovation level has given rise to new economies, new industries, new business forms, and new models, and different regions can explore development models suitable for themselves. At the same time, entrepreneurship has always been regarded as a significant driving force for innovation and economic development [37]. The digital intelligence economy has created a broad market for digital and intelligent technologies, triggering a new wave of entrepreneurship. The digital intelligence economy lowers barriers to entrepreneurship and offers more opportunities and platforms. Digital technologies enable startups to access information, funding, and talent more conveniently while expanding market space and sales channels. The number of artificial intelligence companies has been increasing in recent years, which will help the economic development of various regions. The promotion of innovation investment, innovation level, and entrepreneurial activity in the digital intelligence economy helps solve the current problems faced by regional economies and is thus conducive to the realization of regional high-quality development. Therefore, we propose the following hypotheses:
Hypothesis H1a.
The digital intelligence economy can promote regional high-quality development by increasing innovation investment.
Hypothesis H1b.
The digital intelligence economy can promote regional high-quality development by enhancing regional innovation levels.
Hypothesis H1c.
The digital intelligence economy can promote regional high-quality development by encouraging entrepreneurship.
An important characteristic of the digital economy is that it compresses the spatial and temporal distance and enhances the breadth and depth of economic activities between regions through efficient information transmission [10], and intelligence can further strengthen this connection. Economic activities in cities have significant spatial spillover effects on regional economic development in terms of economic growth [38]. From the perspective of resource elements, the digital intelligence economy, an economic form that integrates digitalization and intelligence, has data and intelligent technology as its core resource elements. The non-competitive and reusable nature of data plays a key role in the digital intelligence economy, and intelligent technology further improves the utilization efficiency and value-creation ability of the data. The digital intelligence economy can optimize resource allocation and improve production efficiency through the flow of data and the application of intelligent algorithms. From the perspective of the carrier platform, the digital intelligence economy relies on intelligent digital platforms, which not only connect producers and consumers but also integrate various entities in the industrial chain. Unlike traditional platforms, digital intelligence economy platforms have stronger scale-increasing returns and externalities [39]. From the perspective of technological innovation, the innovation process of the digital intelligence economy is more complex and continuously iterative. The rapid diffusion and short iteration cycle of intelligent technology enable the digital intelligence economy to respond quickly to market changes and promote industrial upgrading. Overall, the spatial spillover effects of the digital intelligence economy can be attributed to the spatial mobility of technology, data and capital. For example, digital platforms break geographical barriers and promote the integration of resources across regions, forming “high-high” innovation agglomeration areas. These areas drive the development of surrounding regions through radiation effects, which is in line with Krugman’s theory of regional economic agglomeration and diffusion in the new economic geography [40]. Therefore, we propose the following hypothesis:
Hypothesis H2.
The impact of the digital intelligence economy on regional high-quality development has regional heterogeneity and spatial spillover effects.
The promotion of regional high-quality development by the digital intelligence economy is not linear. Achieving regional high-quality development requires solving the coordinated development problems of economic structure optimization, industrial competitiveness enhancement, and green development [41]. When a region’s economic development is relatively backward, various production resources are scarce, and the economy is in the stage of increasing the marginal returns of factors. At this time, the development of the digital intelligence economy focuses more on factor layout and infrastructure construction to improve local economic development [42]. However, the digital intelligence industry has a clear urban and regional bias, which may lead to the concentration of resources in developed areas, thereby widening the development gap between regions and hindering the realization of regional high-quality development. As the economy continues to develop and enters the stage of diminishing marginal returns, various production factors are in a relatively saturated state. In this stage, the development of the digital intelligence economy can optimize the layout of resource factors, improve production efficiency, and promote coordinated development between regions through technological innovation and industrial upgrading [43]. Some scholars [27,44] have shown that the impact of the digital intelligence economy is inevitably constrained by the local level of economic development. Therefore, the effect of the digital intelligence economy on regional high-quality development may exhibit distinct phased characteristics due to differences in regional economic development levels. In the early stages of economic development, the development of the digital intelligence economy may exacerbate the imbalance of development between regions; however, after the economy reaches a certain level, the continued development of the digital intelligence economy can help optimize resource allocation and promote regional high-quality development. Therefore, we propose the hypothesis:
Hypothesis H3.
The impact of the digital intelligence economy on regional high-quality development is non-linear.
2.2.2. The Regulatory Effect of Economic Policy Uncertainty
As an exogenous shock that is widely prevalent internationally, economic policy uncertainty (EPU) can lead to a reduction in corporate investment. Faced with unpredictable economic policies, enterprises face greater risks and uncertainties, making them more cautious in their investment decisions. This may lead to a reduction in financial investment in innovation and technology [45], which is crucial for the development of the digital intelligence economy. The reduction in investment will, in turn, hinder the growth and expansion of the digital intelligence economy and its potential to promote regional high-quality development. The reduction in investment means that the progress of digital infrastructure construction, intelligent technology research and development, and the application of these technologies in various industries will slow down, weakening the driving force for regional economic transformation and upgrading. At the same time, high levels of EPU increase the risk costs related to innovation [46]. Enterprises engaged in the digital intelligence economy usually have high innovation capabilities, but EPU may make it more difficult for them to obtain funding and support for innovation projects. Due to the uncertain economic environment, banks and other financial institutions may become more conservative in lending, making it more difficult for innovative enterprises to obtain loans. These impacts are not conducive to the sustainable development of the digital intelligence economy and the realization of regional high-quality development goals. Therefore, we propose the hypothesis:
Hypothesis H4.
Economic policy uncertainty has a negative regulatory effect on the relationship between the digital intelligence economy and regional high-quality development.
In more developed regions, there is usually a relatively rich accumulation of capital, talent, and technological resources. These regions have a stronger ability to withstand risks and adapt to changes [47]. However, when EPU exceeds a certain threshold, even relatively advantaged regions are affected. For example, in regions with developed digital industries, enterprises may have a certain resilience to policy changes. However, if EPU increases, especially in the current period of global economic slowdown, trade policy, and financial regulations fluctuate violently, the investment and innovation activities of these enterprises will still be significantly suppressed, and the negative impact on regional high-quality development will be more obvious. Highly developed regions usually have a more complex and sensitive institutional environment and geopolitical environment [48]. They are more closely connected to global and national economic systems and are more affected by changes in macroeconomic policies. These regions may have a higher dependence on certain policies, such as preferential policies for high-tech industries and international trade policies. When the EPU increases, changes in these policies may have a more direct and far-reaching impact on the development of the digital intelligence economy in these regions. For example, changes in export-related policies may have a greater impact on digital technology-driven export enterprises in developed coastal regions, thereby affecting the regional economic structure and the high-quality development. Therefore, we propose the following hypothesis:
Hypothesis H5.
In regions with a higher level of development, the negative regulatory effect of economic policy uncertainty is more significant.
In summary, the conceptual framework of this study is shown in Figure 1.
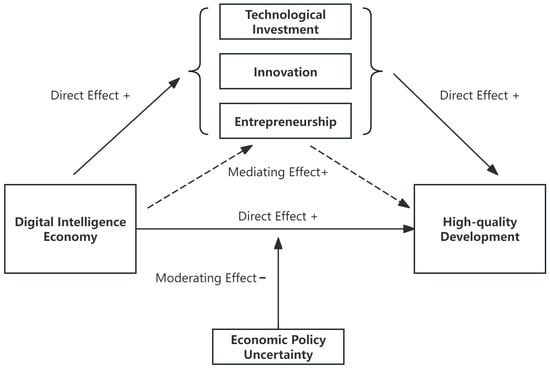
Figure 1.
Conceptual framework.
3. Research Methodology
3.1. Variables and Data
3.1.1. Independent Variable
Digital intelligence economy (DIE). To study the impact of the digital intelligence economy, it is first necessary to measure its impact. We select indicators from 3 aspects: industrial digitalization, industrial intelligence, and industrial upgrading. The indicators of the digital intelligence economy are listed in Table 1. Most past research has focused on digitalization, which is an important feature of the digital economy. We consider the indicators of digitalization and select the indicators of the number of Internet broadband access ports and the number of employees in urban units of the information transmission, software, and information technology services industry, which are obtained from the National Bureau of Statistics of China (NBSC). Compared with the digital economy, the digital intelligence economy pays more attention to the application of intelligence; therefore, we refer to Yao’s study [49] and use word frequency analysis to filter the enterprises that have applied AI as an indicator of the number of artificial intelligence companies. Referring to Acemoglu [50] and Lu [51], we use the data on industrial robots in China published by the International Federation of Robotics (IFR) and obtain the indicator of the number of industrial machines by the weighted average of the number of industrial employment in each province of China from the China Labor Statistics Yearbook. Artificial intelligence is essentially a technology, and the digital intelligence economy is an economic form brought about by new technology. Technological progress in most economies shows a capital bias [52]. Therefore, we consider choosing the indicators of the value of technology market transactions and the funding for technological improvements, which are highly correlated with the technology and capital markets, and the data are obtained from the NBSC.

Table 1.
Composition of digital intelligence economy indicators.
The entropy method is widely used [23,24,53] because it can objectively calculate the weights of the indicators. We use the entropy method (see Appendix A1) to construct the DIE, with the results multiplied by 100 for easy display.
3.1.2. Dependent Variable
High-quality development (HQD). To study high-quality development, it must first be measured. According to the definition of high-quality development, we refer to some past research [11,53,54] and select indicators from five aspects: coordination, green, innovation, openness, and sharing. The specific indicators of regional high-quality development are listed in Table 2. The data on GDP, book collections, and local financial expenditure were obtained from the NBSC, import and export data from the China Statistical Yearbook for every province, data on new industrial products from the China Industry Statistical Yearbook, data on wastewater and carbon dioxide from the China Statistical Yearbook on Environment, and data on patents from the China Statistical Yearbook on Science and Technology. We use the entropy method to construct HQD, with the results multiplied by 100 for easy display.
Table 2.
Composition of regional high-quality development indicators.
3.1.3. Mediating Variables
Based on the hypothesis argumentation, we select mediating variables from three aspects: technological investment, innovation, and entrepreneurship, which are: Technological investment: Local fiscal science and technology expenditure (ES) [55]; Innovation: R&D capital (RD) [56]; Entrepreneurship: Number of new enterprises per 10,000 people (BR) [10].
3.1.4. Moderating Variables
Referring to Baker’s study [15], we select the EPU index as the proxy variable for economic policy uncertainty, which has been widely used in past research on policy uncertainty. In addition, we constructed fiscal policy index EPU_2 and trade policy index EPU_3 using the same method and used them as moderating variables to study the impact of different economic policies.
3.1.5. Control Variables
To eliminate the impact of unobserved factors on the research results, referring to past studies by scholars [8,24,53], we select control variables from multiple perspectives, which are: Economy: Number of unemployed people (UP); Energy consumption: Total electricity consumption (EC); Human capital: Permanent population (PO); Government department functions: General budget expenditure (GB).
3.1.6. Data
This study selects data from 30 provinces in mainland China from 2008 to 2022. The data for this period are relatively complete and valid, providing a robust basis for empirical analysis. This period is crucial as it spans the emergence and rapid development of the digital intelligence economy in China, including the impact of the global financial crisis, the rise of digital technologies, and the shift toward high-quality development. This timeframe allows for a comprehensive analysis of how the digital intelligence economy has evolved and influenced regional development over a significant period. The macroeconomic data are sourced from the National Bureau of Statistics of China (NBSC) and the statistical bureaus of individual provinces, while enterprise-level data are obtained from the CSMAR database. These sources are recognized for their reliability and accuracy, according to the Statistical Law of the People’s Republic of China. Tibet is excluded from the analysis due to significant missing data, which could compromise the integrity and reliability of the results. Additionally, Hong Kong, Macao, and Taiwan are excluded to maintain consistency in the statistical methods and definitions used across the mainland provinces, as these regions have unique economic and administrative structures that may not align with the mainland’s data collection and reporting standards. To eliminate the impact of outliers, we applied 1% standard winsorization to all continuous variables.
3.1.7. Descriptive Statistics and Correlation Test
Since many of the macro data we selected showed exponential growth, we performed a logarithmic transformation on all macro variables before the study. Table A1 (see Appendix A2) lists the descriptive statistical results for each variable. The substantial variances in DIE, ES, and RD indicate significant disparities in digital intelligence economic levels and investment in high—tech across different regions. To mitigate multicollinearity, we conducted a correlation analysis of the key indicators, with the correlation matrix presented in Table A2 (see Appendix A3). It can be observed that the dependent variable HQD is significantly positively correlated with the explanatory variable DIE at the 1% level, which preliminarily verifies that DIE may have a positive impact on HQD. Moreover, the correlation coefficients of all control variables are less than 0.3, indicating that there is no significant multicollinearity among the selected variables.
3.2. Model Specification
To study the impact of the digital intelligence economy on regional high-quality development, we refer to some past research and construct a benchmark regression model, which is set as Model (1):
where HQD represents the level of regional economic high-quality development, DIE represents the level of the digital economy, UP, EC, PO, and GB are control variables, representing the number of unemployed, electricity consumption, permanent population, and budget expenditure, represents the regional effect, represents the time effect, and is the random error term.
To further test the transmission mechanism of the impact of the digital intelligence economy on regional high-quality development, we constructed an intermediary mechanism model based on the previous discussion, which is set as Models (2) and (3):
where M is the intermediary variable, and we selected three intermediary variables: ES (science and technology expenditure), RD (R&D capital investment), and BR (number of enterprises registered per 10,000 people).
To test the regulatory effect of policy uncertainty on the relationship between the digital intelligence economy and regional high-quality development, we constructed a moderating effect model related to EPU, which is set as Model (4):
where EPU is the index of economic policy uncertainty, and we introduce the interaction term DIE×EPU to test the regulatory effect of EPU.
4. Empirical Research
4.1. Benchmark Regression Results
In order to study the impact of DIE on HQD, we need to perform a regression analysis on the benchmark Model (1) at first. Table 3 presents the regression results for Model (1). We first carry out a Hausman test (see Appendix A4), which proves that a two-way fixed effects model should be used, and the results are significant at the 1% level (coefficient is 0.245 in column (1)). To avoid the problem of overfitting the model, we use stepwise regression. We successively add control variables related to the economy (UP), energy (EC), population (PO), and government functions (GB), and find that the regression results are still significant at the 1% level (coefficients are 0.243, 0.228, 0.242, 0.210). This suggests that after taking into account all control variables, for every one unit increase in DIE, there is a consequent 0.21 unit increase in HQD. Thus, the benchmark regression results prove that DIE can significantly promote HQD.
Table 3.
Benchmark regression results.
4.2. Mechanism Test of DIE’s Impact on HQD
We validate the mechanism of DIE’s effect on HQD by intermediary model. Table 4 shows the regression results for Models (2) and (3). We use investment (ES), innovation (RD), and entrepreneurship (BR) as intermediary variables for the model regression. Columns (1), (3), and (5) show that after introducing the intermediary variables, DIE still significantly promotes HQD (coefficients were 0.175, 0.244, 0.181), and ES, RD, and BR all have a promoting effect on HQD (coefficients were 0.825, 0.537, 0.835), and are significant at the 1% significance level. Columns (2), (4), and (6) show that DIE also has a promoting effect on ES, RD, and BR (coefficients of 0.042, 0.032, and 0.035), and is significant at the 1% significance level. This illustrates that DIE promotes HQD by promoting ES, RD, and BR. Therefore, H1a, H1b, and H1c are confirmed; innovation investment, innovation, and entrepreneurship are all important ways for DIE to promote HQD.
Table 4.
Mediating effect mechanism tests.
4.3. EPU’s Moderating Effect Test
We regress the moderating model with a cross-term to verify the effect of EPU. Table 5 shows the regression results for Model (5). After introducing the interaction term of DIE and EPU in column (1), DIE still significantly promotes HQD (0.341), and the coefficient of the interaction term is −0.001, which is significant at the 5% significance level. This indicates that economic policy uncertainty negatively moderates the impact of DIE on HQD. To further explore this, we successively selected the fiscal policy index EPU_2 and the trade policy index EPU_3 as moderating variables and introduced the interaction term with DIE for testing. It can be seen that the coefficient of the interaction term between EPU_2 and DIE in column (3) is not significant, while the coefficient of the interaction term between EPU_3 and DIE in column (5) is significant at the 5% level. Therefore, economic policies related to international trade can more significantly negatively affect the promotion of high-quality development by the digital intelligence economy, and economic policies related to domestic finance would have a limited impact. In summary, H4 is confirmed.
Table 5.
Moderating effect mechanism tests.
4.4. Robustness Test
4.4.1. Adjustment of Sample Intervals
In order to verify whether the research results are sensitive to changes in the sample range, we use the method of adjusting the sample interval to test the robustness of the regression results of the benchmark model. Considering that after 2020, China’s economy is more obviously affected by COVID-19, we select the data for the period of 2008–2019 and re-run the regression analysis of the Model (1), and the regression results are shown in Table 6. Column (1) shows the result after adjusting the sample interval, and column (2) shows the original result for comparison. It can be noticed that the coefficient of DIE in column (1) is 0.226, which is significant at the 1% level. This is less different from the original result. DIE can still significantly promote HQD. Therefore, the findings of this study are robust and not affected by factors related to sample selection intervals, such as COVID-19.
Table 6.
Adjustment of the sample intervals.
4.4.2. Instrumental Variables (IV)
To avoid endogeneity issues, referring to some past research [22,53], we use the first lag of the digital intelligence economy variable DIE as an instrumental variable to verify the relationship between the lagged term of DIE and DIE, and then re-regress the original Model (1). In addition, we use principal component analysis (PCA) to reconstruct the digital intelligence economy index DIE_PCA [8] and replace DIE with DIE_PCA as an instrumental variable to re-regress Model (1). The regression results are presented in Table 7.
Table 7.
Endogeneity and robustness tests.
At the 1% significance level, the lagged first order of DIE appears to promote DIE (0.576), so the choice of instrumental variable is valid. After using the instrumental variable method, L.DIE and DIE_PCA still significantly promote HQD (coefficients were 0.091 and 0.437), which proves that one of our conclusions is that the digital intelligence economy can promote regional high-quality development, and this conclusion is robust.
4.4.3. Propensity Score Matching (PSM)
In order to further verify the causality of the impact of DIE on regional high-quality development HQD, and to avoid sample selection bias as well as the influence of endogeneity problems of control variables on the research results, we use the propensity score matching (PSM) method to conduct a robustness test. PSM is a quasi-experimental method that reduces the risk of inference by matching the treatment and control group samples so that the two groups are balanced in terms of the distribution of features after matching, thereby reducing the impact of endogeneity problems on causal inference [57]. We take the mean of DIE as the boundary, if it is greater than or equal to the mean of DIE is set as the experimental group, take the dummy variable DIE_dum as 1; on the contrary, it is the control group, take the value of 0, and then match the variables of this subgroup. Propensity scores were estimated using a logit model with the dummy variable DIE_dum as the dependent variable and control variables (UP, EC, PO, and GB) as independent variables. With the propensity scores estimated from the logit model, we matched the samples from the treatment and control groups on a one-to-one basis using nearest neighbor matching, and the balance test results of the processing are shown in Appendix A5. The bias after matching was small compared to the previous ones, and thus, the balance of the PSM method was verified. We re-regressed the benchmark Model (1) with the variables after matching, and the regression results are presented in Table 8. It can be found that the DIE_dum coefficient in the regression result of propensity score matching is 1.012, which is significant at the 5% level. Therefore, this result also proves that DIE can significantly contribute to HQD, and the results of the propensity score matching method further validate the robustness of the model results and avoid the problem of endogeneity in the control variables.
Table 8.
PSM results.
5. Further Research
5.1. Regional Heterogeneity
The impact of the digital intelligence economy level in different regions on high-quality economic development and the regulatory effect of economic policy uncertainty varies. The distribution of China’s digital intelligence economy (DIE) by province from 2008 to 2022 is shown in Figure 2, which clearly shows that China’s DIE development is higher in the central and western regions, and that cities with a high degree of DIE development are mainly concentrated in the eastern coast and the central and western regions represented by Sichuan.
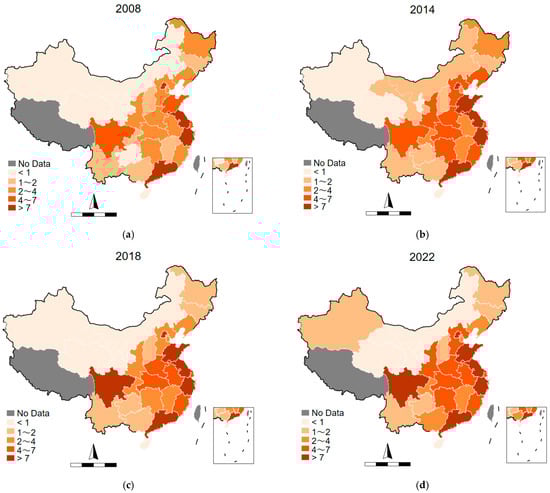
Figure 2.
Spatial distribution map of China’s DIE from 2008 to 2022: (a) 2008, (b) 2014, (c) 2018, and (d) 2022.
According to previous research of past scholars [58], we divide the sample regions into eastern, central, and western regions, and re-regressed Model (4). The regression results are presented in Table 9. It can be found that in the eastern and central regions, DIE significantly promotes HQD at the 5% significance level (coefficients are 0.149 and 0.375), but the impact of DIE on HQD in the western region is not significant. This result indicates that the impact of DIE on HQD has regional heterogeneity, and the impact in the eastern and central regions of China is more significant than that in the western region.
Table 9.
Analysis of regional heterogeneity.
Furthermore, after introducing the interaction term DIE×EPU, we find that EPU in each region has a negative impact on HQD, but only in the economically developed eastern region, where the coefficient of the interaction term is significantly negative (coefficient is −0.002). This result indicates that the regulatory effect of economic policy uncertainty varies in regions with different levels of development, and the regulatory effect in the more developed eastern region is the most significant one.
5.2. Spatial Spillover Effect
5.2.1. Spatial Weight Matrix and Spatial Econometric Model Specification
We choose two spatial weight matrices for the spatial spillover effects. The spatial weight matrices are as follows:
: The adjacency matrix of each province and city is as follows:
: The geographical distance matrix of each province and city is as follows:
, is the geographical distance between the region and the region.
We used the spatial Durbin model for regression, as shown in Model (5):
where, W is the spatial weight matrix, and X represents all the explanatory variables.
5.2.2. Spatial Autocorrelation and Model Selection
Before the spatial econometric study, we need to test the Moran index for the presence or absence of spatial effects. The local Moran’s I index for each year is significant at the 1% level (see Appendix A6), indicating that there is positive spatial autocorrelation in the high-quality development of each province’s economy, and there is a positive spillover effect in the high-quality development of regional economies; that is, regions achieving high-quality economic development have a positive impact on surrounding provinces and cities. From the perspective of different regions, cities with high-high agglomeration characteristics are mainly concentrated in the southeast coastal area centered on the Yangtze River Delta, while the local Moran’s I index for innovation performance of cities in the Northeast and western regions shows low-low agglomeration characteristics, which preliminarily proves that the high-quality economic development of China still shows the gradient distribution characteristic of east-central-west.
Figure 3 shows the distribution of HQD by province in China. It can be seen that from 2008–2022, Chinese cities with high HQD are mainly concentrated in the eastern coastal region, with Beijing, the Yangtze River Delta (Shanghai), and the Pearl River Delta (Guangzhou) as the center of the outward radiation, and the provinces with high HQD are gradually driving the neighboring cities to achieve high-quality development. This further proves that China’s high-quality development has high-high agglomeration characteristics and low-low agglomeration characteristics.
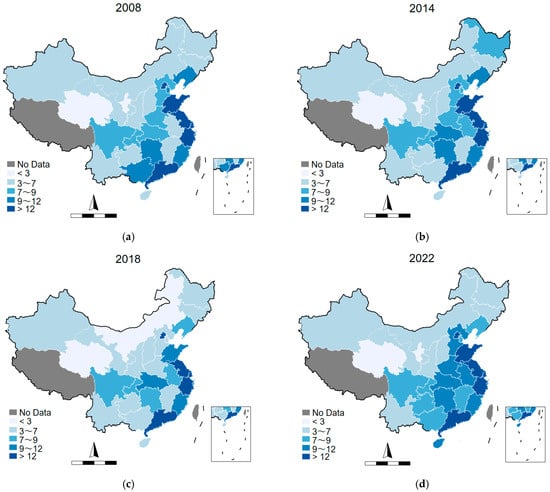
Figure 3.
Spatial distribution map of China’s HQD from 2008 to 2022: (a) 2008, (b) 2014, (c) 2018, and (d) 2022.
In order to determine which model is more reliable to use, we have performed the LM, LR and Wald tests (see Appendix B). Based on the test results, we choose the spatial Durbin model (SDM).
5.2.3. Regression Results of Spatial Econometric Model
To verify the possible spatial spillover effect of DIE on HQD, we regress the spatial Durbin model. The regression results of Model (5) are presented in Table 10. The direct and indirect effects in the regression results are significant at the 1% level, and the coefficients are positive, regardless of whether the Wa or We spatial Durbin model is used. The results for Wa show that for every 1 unit increase in DIE, the HQD of the neighboring region increases by 0.458 units. The results for We show that for every 1 unit increase in the DIE, the HQD of the region at a distance increases by 0.481 units. Therefore, the DIE has a significant positive spatial spillover effect on HQD; that is, the level of the digital intelligence economy in a region not only promotes the high-quality development of the region itself but also promotes the high-quality development of surrounding regions.
Table 10.
Direct, indirect, and total spatial effects on HQD.
5.3. Threshold Effect
Figure 4 shows the distribution of GDP by province in China from 2008 to 2022, and it can be found that in recent years, China’s economic development also shows a trend of high west and low east, which is more similar to the distribution of China’s digital intelligence economy and high-quality development:
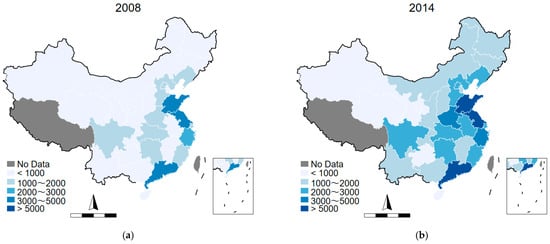
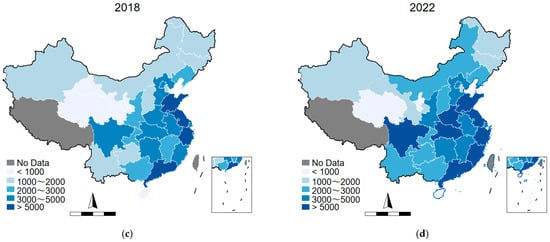
Figure 4.
Spatial distribution map of China’s GDP from 2008 to 2022: (a) 2008; (b) 2014; (c) 2018; (d) 2022.
Therefore, we consider that the digital intelligence economy has obvious regional differences in its impact on high-quality development. This is especially true when the level of economic development and development efficiency of different regions varies, and these impacts are likely to be non-linear. To verify this conjecture, we considered setting a threshold effect model for testing and first set a single-threshold model, as shown in Model (6):
where I is the indicator function, is the threshold value, and Control is a control variable.
The use of energy is a necessary condition for economic development, and regions with high energy utilization efficiency often have better economic development [59]. Therefore, we used energy utilization efficiency GC: GDP/electricity consumption as the threshold variable. In order to test the number of thresholds that may exist, we perform a single-threshold and a double-threshold test in turn, and the results are shown in Table 11.
Table 11.
Threshold condition test results.
The p-values of single-threshold and double-threshold are 0.0033 and 0.1367, which shows that at the 1% level, the model passes the single-threshold test but does not pass the double-threshold test. The threshold value is 1645.944, and the threshold regression results are presented in Table 12. It can be found that before GC reaches the threshold value of 1645.944, the impact of DIE on HQD is significantly negative at the 5% level (coefficient is −0.0804), and after GC exceeds the threshold value of 1645.944, the impact of DIE on HQD is significantly positive at the 1% level (coefficient is 0.1866). This result proves that the impact of DIE on HQD is non-linear and has a threshold effect. In the early stage of economic development, the development of the digital intelligence economy hinders the realization of high-quality development in the region; however, this hindering effect gradually weakens until the economy reaches a certain level, and the continued development of the digital intelligence economy can help achieve high-quality development in the region.
Table 12.
Threshold regression results.
6. Conclusions
6.1. Research Conclusions
Based on panel data from 30 Chinese provinces from 2008 to 2022, this study constructs indicators for the digital intelligence economy and high-quality development and empirically analyzes their relationship while considering the moderating role of economic policy uncertainty. The results demonstrate that the digital intelligence economy significantly promotes regional high-quality development through increased innovation investment, enhanced regional innovation levels, and encouragement of entrepreneurship. This effect is robust across various tests, including the instrumental variables. Additionally, economic policy uncertainty negatively moderates this relationship, particularly in more developed regions. The study also reveals regional differences in the impact, with the eastern and central regions benefiting more significantly. The digital intelligence economy exhibits a positive spatial spillover effect and a non-linear threshold effect, initially hindering and eventually facilitating high-quality development as the economy matures.
6.2. Discussion: Contribution and Innovation
The digital economy can promote high-quality regional development, as found in previous studies [11,34]. The rapid development of artificial intelligence in recent years has had an impact on the regional economy, and none of these studies have addressed the application of intelligent technologies. This study examines the transmission mechanism of the digital economy on regional high-quality development from three perspectives: investment, innovation, and entrepreneurship, verifying Li’s study [56] on the mediating effect of R&D capital, and we propose a mechanism for entrepreneurship on the basis of Zhao’s study [10]. Based on this, this study expands from digitalization to digital intelligence, further demonstrating that the digital intelligence economy can also promote regional high-quality development. Secondly, this study focuses on analyzing the mechanism of EPU from the perspective of the moderating effect, which has been less addressed in previous studies. We construct fiscal policy index EPU_2 and trade policy index EPU_3 to study the impact of policy uncertainty from both domestic and international perspectives. We find that the negative moderating effect of economic policy related to international trade is more significant. Previous studies have examined the spatial spillover effects of the digital economy in terms of green development [22] and regional innovation performance [60]. On this basis, we further advance our research on regional high-quality development, a concept highly relevant to economic development and regional innovation, and make relevant new policy implications for regional economic development. In addition, on the basis of regional heterogeneity analyses that have been widely conducted in the past, this study proposes the hypothesis of a threshold effect and obtains model validation, and the results prove that in a region with a lower level of economic development, the development of the digital intelligence economy may hinder the realization of regional high-quality development. Previous studies have not addressed this issue [11] or have only briefly mentioned this negative effect [27]. Furthermore, they did not discuss this in depth. This study addresses the shortcomings of previous studies.
6.3. Policy Implications
The findings of this study have significant implications for policymakers, although the policy proposals need to be more specific and actionable:
- (1)
- Enhancing Support for the Digital Intelligence Economy: The government should adopt concrete measures to support the digital intelligence economy. For instance, it could provide targeted financial incentives and policy guidance to accelerate the construction of digital infrastructure, such as high-speed broadband networks and data centers. Additionally, investment in research and development (R&D) of intelligent technologies, including artificial intelligence and machine learning, should be increased to foster innovation and drive regional high-quality development. These actions can help leverage the efficiency and innovation gains from digital and intelligent technologies more effectively.
- (2)
- Ensuring Policy Stability and Adaptability: Given the negative impact of economic policy uncertainty on the relationship between the digital intelligence economy and regional high-quality development, the government should strive to balance policy stability with the need for regulatory adjustments in a fast-moving digital economy. While maintaining overall policy stability to reduce investment risks and innovation costs for businesses, the government should also establish flexible regulatory frameworks that can adapt to emerging technological trends and market changes. This approach can create a more conducive environment for enterprises to thrive in the digital intelligence sector.
- (3)
- Implementing Tailored Regional Policies: Considering the differences in development levels across regions, the government should adopt differentiated policies based on specific economic contexts. For regions with lower economic development levels, such as China’s central and western regions, the focus should be on strengthening digital infrastructure construction and talent training. This helps narrow the development gap between regions and ensures that all areas can benefit from the digital intelligence economy. For more economically developed regions, such as China’s eastern regions, the government should further optimize the development environment for the digital intelligence economy by enhancing technological innovation and upgrading industries. This includes supporting the application of advanced digital technologies in traditional industries to drive intelligent transformation and promote the development of emerging digital industries.
- (4)
- Promoting Regional Cooperation and Synergistic Development: In light of the spatial spillover effects of the digital intelligence economy, the government should encourage cooperation and exchange among regions to facilitate the sharing of resources and collaborative innovation. By leveraging the technological and resource advantages of more developed regions, the government can enhance the spillover effects in less developed areas, thereby achieving broader high-quality development.
6.4. Research Limitations and Future Prospects
While this study provides valuable insights into the relationship between the digital intelligence economy and regional high-quality development, it also has certain limitations. For instance, the data mainly cover a specific period and regions, and the dynamic changes in the digital intelligence economy and high-quality development may not be fully captured. Future research can expand the data range to include longer time spans and more diverse regions and employ more advanced analytical methods to deepen the understanding of this relationship. In addition to the variables examined in this paper, other factors (e.g., regional corruption and infrastructure bottlenecks) may also affect high-quality development. This is one of the ideas for future research. Additionally, further studies should explore the long-term impacts and potential risks associated with the digital intelligence economy to provide more comprehensive policy recommendations. As China is a developing country, future research can expand the sample to include both developed and less developed countries, which will help better understand the global impact of the digital intelligence economy and provide more universal policy insights. Moreover, conducting case studies on specific regions or industries that have successfully implemented digital intelligence technologies could offer practical insights into the mechanisms through which these technologies drive the high-quality development. Such case studies can also highlight the challenges and opportunities faced during the implementation process, providing actionable recommendations for policymakers and practitioners.
Author Contributions
Conceptualization, C.W. and Z.W.; Methodology, C.W. and Z.W.; Data curation, C.W.; Writing—original draft preparation, C.W.; Writing—review and editing, Z.W. All authors have read and agreed to the published version of the manuscript.
Funding
This research received no external funding.
Institutional Review Board Statement
Not applicable.
Informed Consent Statement
Not applicable.
Data Availability Statement
The data used to support the findings of this study are available from the corresponding author, upon reasonable request.
Conflicts of Interest
The authors declare no conflicts of interest.
Abbreviations
The following abbreviations are used in this manuscript:
| DIE | Digital Intelligence Economy |
| HQD | High-quality Development |
| EPU | Economic Policy Uncertainty |
Appendix A
Appendix A.1
Entropy method: First, it is necessary to standardize the basic index data. The data standardization formula is as follows:
is the standardized result of (i = 1, 2, …, 30; t =1, 2, …, 15, t = 1 when year = 2008). is the maximum value of the t th index sequence in the i th province and is the minimum value of the t th index sequence in the i th province. The standardized variables take values between 0 and 1. Then, the weight coefficient is determined by the entropy weight method. reflects the degree of influence of this index on the score of the evaluation index. The standardized data can obtain the information entropy of each index according to the following formula: , where , (m is 30 here) and . After determining the information entropy of each index, the weight value of each index can be obtained according to the formula: . The larger the weight value of the index, the deeper the influence of the index on the evaluation index score. The entropy weight method yields the index of .
Appendix A.2
Table A1 presents the data description. The sample size is 450.
Table A1.
Data description.
Table A1.
Data description.
| Variables | N | Mean | SD | Min | Max |
|---|---|---|---|---|---|
| DIE | 450 | 4.510 | 4.919 | 0.0367 | 26.51 |
| HQD | 450 | 9.014 | 6.291 | 1.073 | 29.57 |
| ES | 450 | 1.869 | 1.140 | −0.978 | 4.761 |
| RD | 450 | 2.692 | 1.432 | −2.434 | 5.774 |
| BR | 450 | 3.413 | 0.710 | 1.735 | 5.505 |
| EPU | 450 | 144.4 | 18.92 | 117.2 | 186.5 |
| EPU_2 | 450 | 147.3 | 41.66 | 84.25 | 245.9 |
| EPU_3 | 450 | 181.6 | 118.6 | 85.88 | 470.7 |
| UP | 450 | 3.082 | 0.708 | 0.742 | 4.413 |
| EC | 450 | 2.727 | 0.730 | 0.207 | 4.366 |
| PO | 450 | 3.593 | 0.744 | 1.712 | 4.843 |
| GB | 450 | 3.636 | 0.713 | 1.177 | 5.222 |
Appendix A.3
Table A2 shows the correlation analysis matrix, where each value in the matrix represents the correlation coefficient between the row and the corresponding variable in the column.
Table A2.
Pairwise Correlations.
Table A2.
Pairwise Correlations.
| Variables | HQD | DIE | ES | RD | BR | EPU | UP | EC | PO | GB |
|---|---|---|---|---|---|---|---|---|---|---|
| HQD | 1.000 | |||||||||
| DIE | 0.915 *** | 1.000 | ||||||||
| ES | 0.733 *** | 0.787 *** | 1.000 | |||||||
| RD | 0.728 *** | 0.791 *** | 0.866 *** | 1.000 | ||||||
| BR | 0.405 *** | 0.338 *** | 0.579 *** | 0.421 *** | 1.000 | |||||
| EPU | 0.030 | −0.015 | 0.005 | 0.022 | −0.002 | 1.000 | ||||
| UP | 0.428 *** | 0.457 *** | 0.407 *** | 0.522 *** | 0.075 | 0.003 | 1.000 | |||
| EC | 0.613 *** | 0.700 *** | 0.687 *** | 0.871 *** | 0.271 *** | 0.020 | 0.283 *** | 1.000 | ||
| PO | 0.557 *** | 0.642 *** | 0.505 *** | 0.662 *** | −0.019 | −0.004 | 0.264 *** | 0.266 *** | 1.000 | |
| GB | 0.575 *** | 0.678 *** | 0.840 *** | 0.842 *** | 0.503 *** | −0.011 | 0.205 *** | 0.226 *** | 0.291 *** | 1.000 |
Note: *** p < 0.01.
Appendix A.4
Table A3 shows the results of Hausman’s test, where RE stands for random effects and FE stands for two-way fixed effects. The value of Hausman’s test is 556, which corresponds to a p-value of 0.000, which indicates that the use of the random effects model is rejected; therefore, a two-way fixed effects model is used.
Table A3.
Hausman test.
Table A3.
Hausman test.
| Variables | (1) | (2) | (3) |
|---|---|---|---|
| RE | FE | FE | |
| IE | 0.426 *** | 0.261 *** | 0.261 *** |
| (0.046) | (0.046) | (0.046) | |
| Control | YES | YES | YES |
| Constant | 2.090 | 16.291 *** | 16.291 *** |
| (2.032) | (4.770) | (4.770) | |
| Observations | 450 | 450 | 450 |
| R-squared | 0.110 | 0.110 | |
| Number of ID | 30 | 30 | 30 |
| Hausman | 556 | ||
| p-value | 0.000 |
Note: *** p < 0.01.
Appendix A.5
Table A4 presents the results after propensity score matching for the control variables. The comparison shows that the bias of the variable means after matching are all under 5%, which indicates that there is no significant error in the control variables. Therefore, the balance of the PSM is acceptable, and the results of the robustness test of the PSM method are also acceptable.
Table A4.
PSM balance test.
Table A4.
PSM balance test.
| Variables | Unmatched(U)/Matched(M) | Mean | %bias | |
|---|---|---|---|---|
| Treated | Control | |||
| UP | U | 3.471 | 2.694 | 131.2 |
| M | 3.200 | 3.175 | 4.3 | |
| EC | U | 3.142 | 2.311 | 138.6 |
| M | 2.696 | 2.720 | −4.1 | |
| PO | U | 4.027 | 3.160 | 143.3 |
| M | 3.611 | 3.635 | −4.0 | |
| GB | U | 4.025 | 3.247 | 130.2 |
| M | 3.683 | 3.654 | 4.8 | |
Appendix A.6
The local Moran’s I index of the HQD from 2008 to 2022 is shown in Table A5. The p-value for the Moran index was <0.01 in each year, for both Wa and We, suggesting that there are significant spatial spillovers from HQD.
Table A5.
China’s local Moran’s I from 2008 to 2022.
Table A5.
China’s local Moran’s I from 2008 to 2022.
| Year | Wa | We | ||
|---|---|---|---|---|
| I | p-Value | I | p-Value | |
| 2008 | 0.280 | 0.008 | 0.235 | 0.005 |
| 2009 | 0.283 | 0.008 | 0.229 | 0.006 |
| 2010 | 0.303 | 0.005 | 0.248 | 0.003 |
| 2011 | 0.283 | 0.008 | 0.248 | 0.003 |
| 2012 | 0.294 | 0.006 | 0.233 | 0.005 |
| 2013 | 0.290 | 0.007 | 0.242 | 0.003 |
| 2014 | 0.293 | 0.006 | 0.252 | 0.002 |
| 2015 | 0.276 | 0.009 | 0.253 | 0.003 |
| 2016 | 0.325 | 0.002 | 0.290 | 0.001 |
| 2017 | 0.257 | 0.012 | 0.259 | 0.002 |
| 2018 | 0.260 | 0.010 | 0.282 | 0.001 |
| 2019 | 0.254 | 0.012 | 0.263 | 0.002 |
| 2020 | 0.325 | 0.002 | 0.241 | 0.003 |
| 2021 | 0.369 | 0.001 | 0.268 | 0.001 |
| 2022 | 0.389 | 0.000 | 0.246 | 0.003 |
Note: p-value is the result of a two-tailed test.
Appendix B
Appendix B presents the process for selecting the spatial econometric model.
The results of the LM test are presented in Table A6.
Table A6.
LM test.
Table A6.
LM test.
| Wa | We | |||
|---|---|---|---|---|
| Value | p-Value | Value | p-Value | |
| Moran’I | 9.586 | 0.000 | 6.577 | 0.000 |
| LM-lag | 190.726 | 0.000 | 36.697 | 0.000 |
| Robust-LM-lag | 112.409 | 0.000 | 9.002 | 0.003 |
| LM-error | 89.239 | 0.000 | 41.293 | 0.000 |
| Robust-LM-error | 10.922 | 0.001 | 13.598 | 0.000 |
All indicators are significant at the 1% level, so there is spatial autocorrelation, and it is reasonable to use the spatial econometric model, including the Spatial Autoregressive Model (SAR), Spatial Error Model (SEM), and spatial Durbin model (SDM).
The results of the LR test and Wald test are presented in Table A7.
Table A7.
LR test and Wald test.
Table A7.
LR test and Wald test.
| Wa | We | ||||
|---|---|---|---|---|---|
| Z-Value | p-Value | Z-Value | p-Value | ||
| LR Test | SDM/SAR | 35.300 | 0.000 | 46.880 | 0.000 |
| SDM/SEM | 169.050 | 0.000 | 131.400 | 0.000 | |
| Wald Test | SDM/SAR | 19.220 | 0.002 | 11.620 | 0.040 |
| SDM/SEM | 36.520 | 0.000 | 13.920 | 0.016 | |
The LR test rejected the original hypothesis at the 1% level, and the Wald test also rejected the original hypothesis at the 5% level; thus, the test results rejected the SDM model degenerating into the SAR model and the SEM model, and thus the SDM model was used.
The results of the LR test for fixed effects using the model are presented in Table A8. The LR test rejected the original hypothesis; therefore, the two-way fixed effects model was used.
Table A8.
LM test for fixed effects.
Table A8.
LM test for fixed effects.
| Wa | We | |||
|---|---|---|---|---|
| Z-Value | p-Value | Z-Value | p-Value | |
| Both/Time | 787.740 | 0.000 | 817.240 | 0.000 |
| Both/Ind | 46.430 | 0.00 | 42.3600 | 0.000 |
References
- Zhou, B.; Zeng, X.; Jiang, L.; Xue, B. High-Quality Economic Growth under the Influence of Technological Innovation Preference in China: A Numerical Simulation from the Government Financial Perspective. Struct. Change Econ. Dyn. 2020, 54, 163–172. [Google Scholar]
- Yang, Z.; Chen, J. Innovation and Governance of Corporate Social Responsibility in the Digital and Intelligent Era. J. Shanghai Univ. Financ. Econ. 2020, 22, 33–51. [Google Scholar]
- Lu, Y. Industry 4.0: A Survey on Technologies, Applications and Open Research Issues. J. Ind. Inf. Integr. 2017, 6, 1–10. [Google Scholar]
- Wang, H.; Zhang, J.; Jia, Y. Research on Regional High-Quality Economic Development of China. J. Technol. Econ. 2023, 42, 120–131. [Google Scholar]
- Bei, J. Study on the “High-Quality Development” Economics. China Political Econ. 2018, 1, 163–180. [Google Scholar]
- Cai, Q.; Huang, L. Research on Coordinated Regional Development in the Era of Digital Economy: Theoretical Evolution and Prospects. Int. Financ. 2024, 7, 43–50. [Google Scholar]
- Zhang, X.; Wang, G.; Zhang, J.; He, Z. Digital Economy, Financial Inclusion and Inclusive Growth. China Econ. 2020, 15, 92–105. [Google Scholar]
- Chen, P. Is the Digital Economy Driving Clean Energy Development?—New Evidence from 276 Cities in China. J. Clean. Prod. 2022, 372, 133783. [Google Scholar]
- Luo, S.; Yimamu, N.; Li, Y.; Wu, H.; Irfan, M.; Hao, Y. Digitalization and Sustainable Development: How Could Digital Economy Development Improve Green Innovation in China? Bus. Strategy Environ. 2023, 32, 1847–1871. [Google Scholar] [CrossRef]
- Zhao, T.; Zhang, Z.; Liang, S. Digital Economy, Entrepreneurship, and High-Quality Economic Development: Empirical Evidence from Urban China. Manag. World 2020, 36, 65–76. [Google Scholar]
- Ding, C.; Liu, C.; Zheng, C.; Li, F. Digital Economy, Technological Innovation and High-Quality Economic Development: Based on Spatial Effect and Mediation Effect. Sustainability 2022, 14, 216. [Google Scholar]
- Wang, Y.; Chen, C.R.; Huang, Y.S. Economic Policy Uncertainty and Corporate Investment: Evidence from China. Pac.-Basin Financ. J. 2014, 26, 227–243. [Google Scholar]
- Dinh, H.B.P.; Iyke, B.N.; Sharma, S.S.; Affandi, Y. Economic Policy Uncertainty and Financial Stability-Is There a Relation? Econ. Model. 2021, 94, 1018–1029. [Google Scholar]
- Bu, L.; Zhao, H.; Fan, H. Geopolitical Risk, Economic Policy Uncertainty and Exchange Rate Fluctuation. Stud. Int. Financ. 2021, 11, 55–65. [Google Scholar]
- Baker, S.R.; Bloom, N.; Davis, S.J. Measuring Economic Policy Uncertainty. Q. J. Econ. 2016, 131, 1593–1636. [Google Scholar]
- Wang, C.; Yu, D.; Long, R. Economic Policy Uncertainty and Enterprise Digitalization: Stepping Stone or Stumbling Block? Bus. Manag. J. 2023, 45, 79–100. [Google Scholar]
- Sun, G.; Fang, J.; Li, J.; Wang, X. Research on the Impact of the Integration of Digital Economy and Real Economy on Enterprise Green Innovation. Technol. Forecast. Soc. Change 2024, 200, 123097. [Google Scholar]
- Ye, F.; Ouyang, Y.; Li, Y. Digital Investment and Environmental Performance: The Mediating Roles of Production Efficiency and Green Innovation. Int. J. Prod. Econ. 2023, 259, 108822. [Google Scholar]
- Liang, L.; Li, Y. How Does Government Support Promote Digital Economy Development in China? The Mediating Role of Regional Innovation Ecosystem Resilience. Technol. Forecast. Soc. Change 2023, 188, 122328. [Google Scholar]
- Hussain, M.; Yang, S.; Maqsood, U.S.; Zahid, R.M.A. Tapping into the Green Potential: The Power of Artificial Intelligence Adoption in Corporate Green Innovation Drive. Bus. Strategy Environ. 2024, 33, 4375–4396. [Google Scholar]
- Nahar, S. Modeling the Effects of Artificial Intelligence (AI)-Based Innovation on Sustainable Development Goals (SDGs): Applying a System Dynamics Perspective in a Cross-Country Setting. Technol. Forecast. Soc. Change 2024, 201, 123203. [Google Scholar]
- Ma, D.; Zhu, Q. Innovation in Emerging Economies: Research on the Digital Economy Driving High-Quality Green Development. J. Bus. Res. 2022, 145, 801–813. [Google Scholar]
- Guo, B.; Wang, Y.; Zhang, H.; Liang, C.; Feng, Y.; Hu, F. Impact of the Digital Economy on High-Quality Urban Economic Development: Evidence from Chinese Cities. Econ. Model. 2023, 120, 106194. [Google Scholar]
- Wang, B.; Wang, J.; Dong, K.; Nepal, R. How Does Artificial Intelligence Affect High-Quality Energy Development? Achieving a Clean Energy Transition Society. Energy Policy 2024, 186, 114010. [Google Scholar]
- Jian, L.; Guo, S.; Yu, S. Effect of Artificial Intelligence on the Development of China’s Wholesale and Retail Trade. Sustainability 2023, 15, 10524. [Google Scholar] [CrossRef]
- Rao, S.; Pan, Y.; He, J.; Shangguan, X. Digital Finance and Corporate Green Innovation: Quantity or Quality? Environ. Sci. Pollut. Res. 2022, 29, 56772–56791. [Google Scholar]
- Xu, W.; Shi, R.; Zhou, J.; Liu, C. The Mechanism and Effect of Digital Intelligence Economy Promoting Common Prosperity. J. Ind. Technol. Econ. 2024, 43, 135–144. [Google Scholar]
- Duc, D.T.V.; Dat, T.T.; Linh, D.H.; Phong, B.X. Measuring the Digital Economy in Vietnam. Telecommun. Policy 2024, 48, 102683. [Google Scholar]
- Ababio, J.O.-M.; Yiadom, E.B.; Ofori-Sasu, D.; Sarpong-Kumankoma, E. Digital Financial Inclusion and Inclusive Development in Lower-Middle-Income Countries: The Enabling Role of Institutional Quality. J. Chin. Econ. Foreign Trade Stud. 2024, 17, 133–151. [Google Scholar]
- Zhang, X.; Lau, C.K.M.; Li, R.; Wang, Y.; Wanjiru, R.; Seetaram, N. Determinants of Carbon Emissions Cycles in the G7 Countries. Technol. Forecast. Soc. Change 2024, 201, 123261. [Google Scholar]
- Ades, A.; Di Tella, R. Rents, Competition, and Corruption. Am. Econ. Rev. 1999, 89, 982–993. [Google Scholar]
- Komornicki, T.; Goliszek, S. New Transport Infrastructure and Regional Development of Central and Eastern Europe. Sustainability 2023, 15, 5263. [Google Scholar] [CrossRef]
- Romer, P. Endogenous Technological-Change. J. Polit. Econ. 1990, 98, S71–S102. [Google Scholar]
- Zhang, H.; Liu, Z.; Wang, S. Exploration of the Path of High-Quality Development of China’s Economy in the Context of the Digital Economy. J. Commer. Econ. 2019, 23, 183–186. [Google Scholar]
- Peng, X.-Y.; Zou, X.-Y.; Zhao, X.-X.; Chang, C.-P. How Does Economic Policy Uncertainty Affect Green Innovation? Technol. Econ. Dev. Econ. 2023, 29, 114–140. [Google Scholar]
- Gulen, H.; Ion, M. Policy Uncertainty and Corporate Investment. Rev. Financ. Stud. 2016, 29, 523–564. [Google Scholar]
- Welter, F.; Baker, T.; Wirsching, K. Three Waves and Counting: Therising Tide of Contextualization in Entrepreneurship Research. Small Bus. Econ. Group 2019, 52, 319–330. [Google Scholar]
- Philip, L.; Cottrill, C.; Farrington, J.; Williams, F.; Ashmore, F. The Digital Divide: Patterns, Policy and Scenarios for Connecting the “final Few” in Rural Communities across Great Britain. J. Rural Stud. 2017, 54, 386–398. [Google Scholar]
- Liu, Y.; Dong, J.; Wei, J. Digital Innovation Management:Theoretical Framework and Future Research. Manag. World 2020, 36, 198–217,219. [Google Scholar]
- Krugman, P. Increasing Returns and Economic-Geography. J. Polit. Econ. 1991, 99, 483–499. [Google Scholar]
- Chauhan, C.; Parida, V.; Dhir, A. Linking Circular Economy and Digitalization Technologies: A Systematic Literature Review of Past Achievements and Future Promises. Technol. Forecast. Soc. Change 2022, 177, 121508. [Google Scholar]
- Liu, Z.; Zheng, Y. Development Paradigm of Artificial Intelligence in China from the Perspective of Digital Economics. J. Chin. Econ. Bus. Stud. 2022, 20, 207–217. [Google Scholar]
- Zou, T. Technological Innovation Promotes Industrial Upgrading: An Analytical Framework. Struct. Change Econ. Dyn. 2024, 70, 150–167. [Google Scholar] [CrossRef]
- Ye, T.; Wang, X. The Impact of Digital Economy on Coordinated and Balanced Development—On the Realization Path of Common Prosperity. Econ. Perspect. 2023, 1, 73–88. [Google Scholar]
- Ren, X.; Xia, X.; Taghizadeh-Hesary, F. Uncertainty of Uncertainty and Corporate Green Innovation-Evidence from China. Econ. Anal. Policy 2023, 78, 634–647. [Google Scholar]
- Xu, Z. Economic Policy Uncertainty, Cost of Capital, and Corporate Innovation. J. Bank Financ. 2020, 111, 105698. [Google Scholar]
- Diemer, A.; Iammarino, S.; Rodriguez-Pose, A.; Storper, M. The Regional Development Trap in Europe. Econ. Geogr. 2022, 98, 487–509. [Google Scholar]
- Adams, S.; Adedoyin, F.; Olaniran, E.; Bekun, F.V. Energy Consumption, Economic Policy Uncertainty and Carbon Emissions; Causality Evidence from Resource Rich Economies. Econ. Anal. Policy 2020, 68, 179–190. [Google Scholar]
- Yao, J.; Zhang, K.; Guo, L.; Feng, X. How Does Artificial Intelligence Improve Firm Productivity? Based on the Perspective of Labor Skill Structure Adjustment. J. Manag. World 2024, 40, 101–116,133,117–122. [Google Scholar]
- Acemoglu, D.; Restrepo, P. Robots and Jobs: Evidence from US Labor Markets. J. Polit. Econ. 2020, 128, 2188–2244. [Google Scholar]
- Lu, T.; Zhu, Z. Will AI Reduce Labor Income Share—A Test Based on Fixed Effect Model and Panel Quantile Model. J. Shanxi Univ. Financ. Econ. 2021, 43, 29–41. [Google Scholar]
- Klump, R.; McAdam, P.; Willman, A. Factor Substitution and Factor-Augmenting Technical Progress in the United States: A Normalized Supply-Side System Approach. Rev. Econ. Stat. 2007, 89, 183–192. [Google Scholar]
- Song, M.; Tao, W.; Shen, Z. Improving High-Quality Development with Environmental Regulation and Industrial Structure in China. J. Clean. Prod. 2022, 366, 132997. [Google Scholar]
- Zheng, H.; He, Y. How Does Industrial Co-Agglomeration Affect High-Quality Economic Development? Evidence from Chengdu-Chongqing Economic Circle in China. J. Clean. Prod. 2022, 371, 133485. [Google Scholar]
- Pu, X.; Zeng, M.; Zhang, W. Corporate Sustainable Development Driven by High-Quality Innovation: Does Fiscal Decentralization Really Matter? Econ. Anal. Policy 2023, 78, 273–289. [Google Scholar]
- Li, X.; Wu, F.; Zhu, L. Digital Economy and Regional Innovation Performance. J. Shanxi Univ. Financ. Econ. 2021, 43, 17–30. [Google Scholar]
- Caliendo, M.; Kopeinig, S. Some Practical Guidance for the Implementation of Propensity Score Matching. J. Econ. Surv. 2008, 22, 31–72. [Google Scholar]
- Li, J.; Peng, Y.; Ma, S. Inclusive Finance and Economic Development in China: Multidimensional Connotation and Empirical Analysis. Econ. Res. J. 2020, 55, 37–52. [Google Scholar]
- Lv, Y.; Chen, W.; Cheng, J. Effects of Urbanization on Energy Efficiency in China: New Evidence from Short Run and Long Run Efficiency Models. Energy Policy 2020, 147, 111858. [Google Scholar]
- Capello, R.; Lenzi, C. Innovation Modes and Entrepreneurial Behavioral Characteristics in Regional Growth. Small Bus. Econ. Group 2016, 47, 875–893. [Google Scholar]
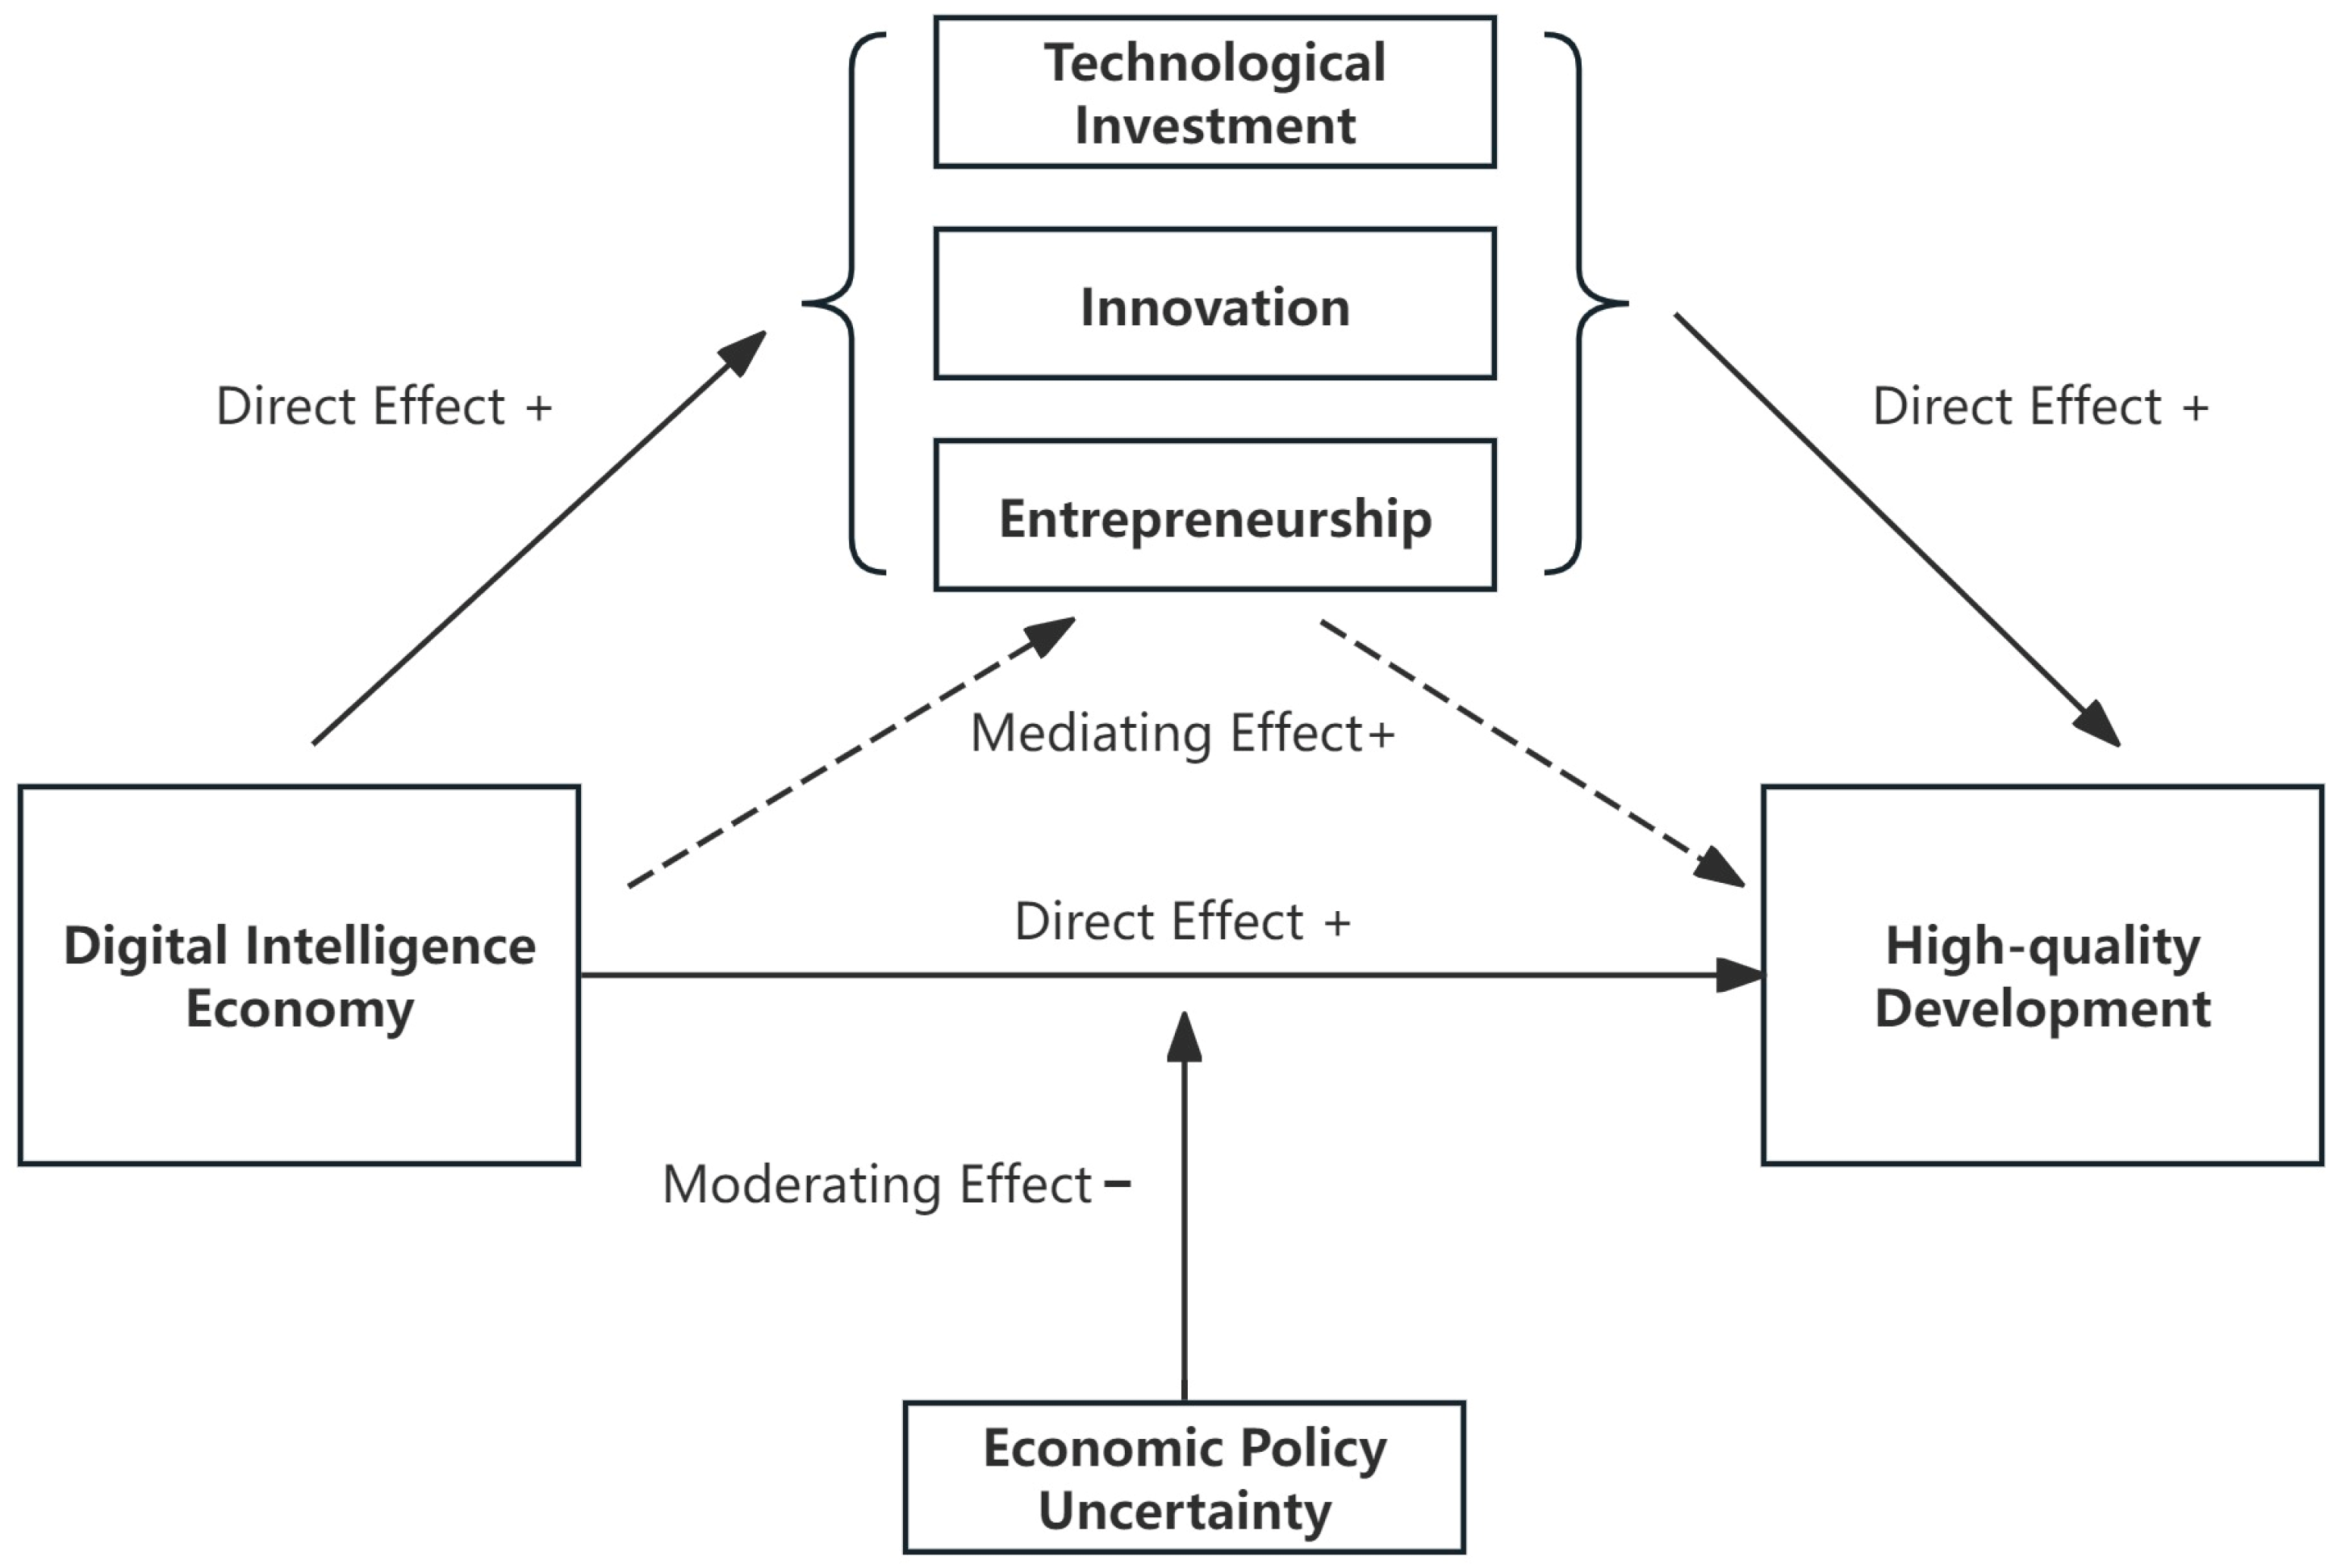
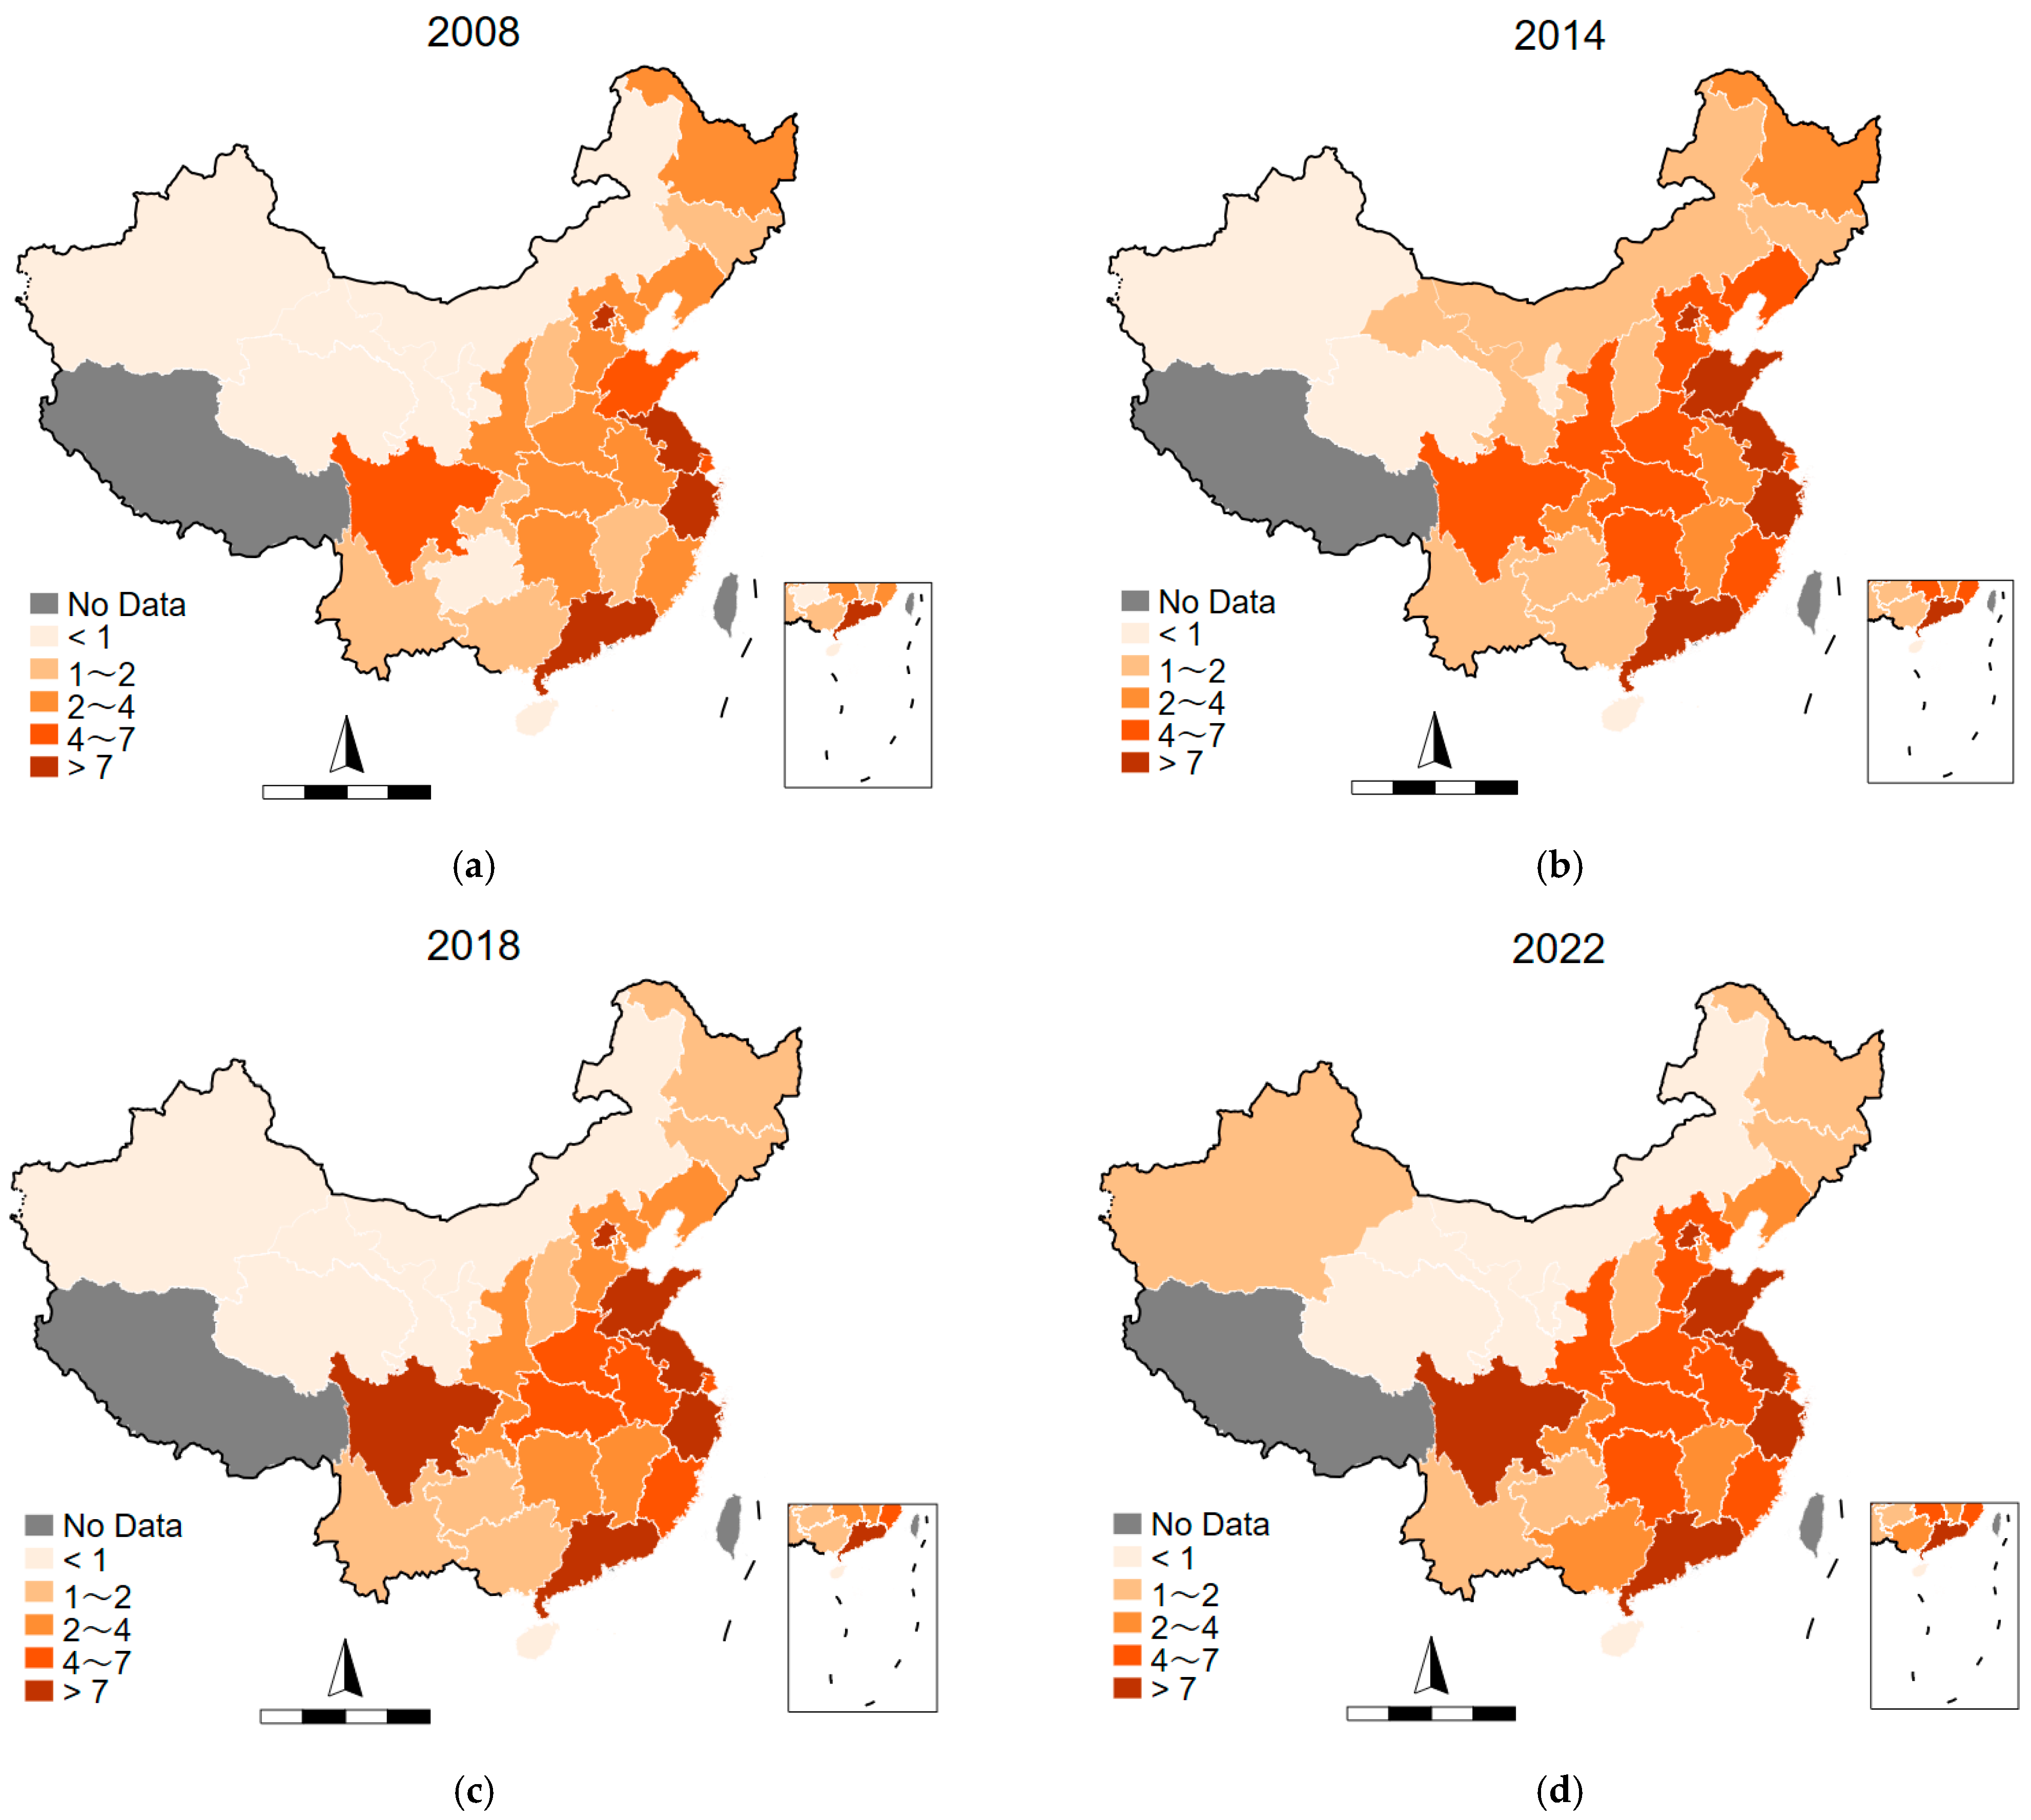

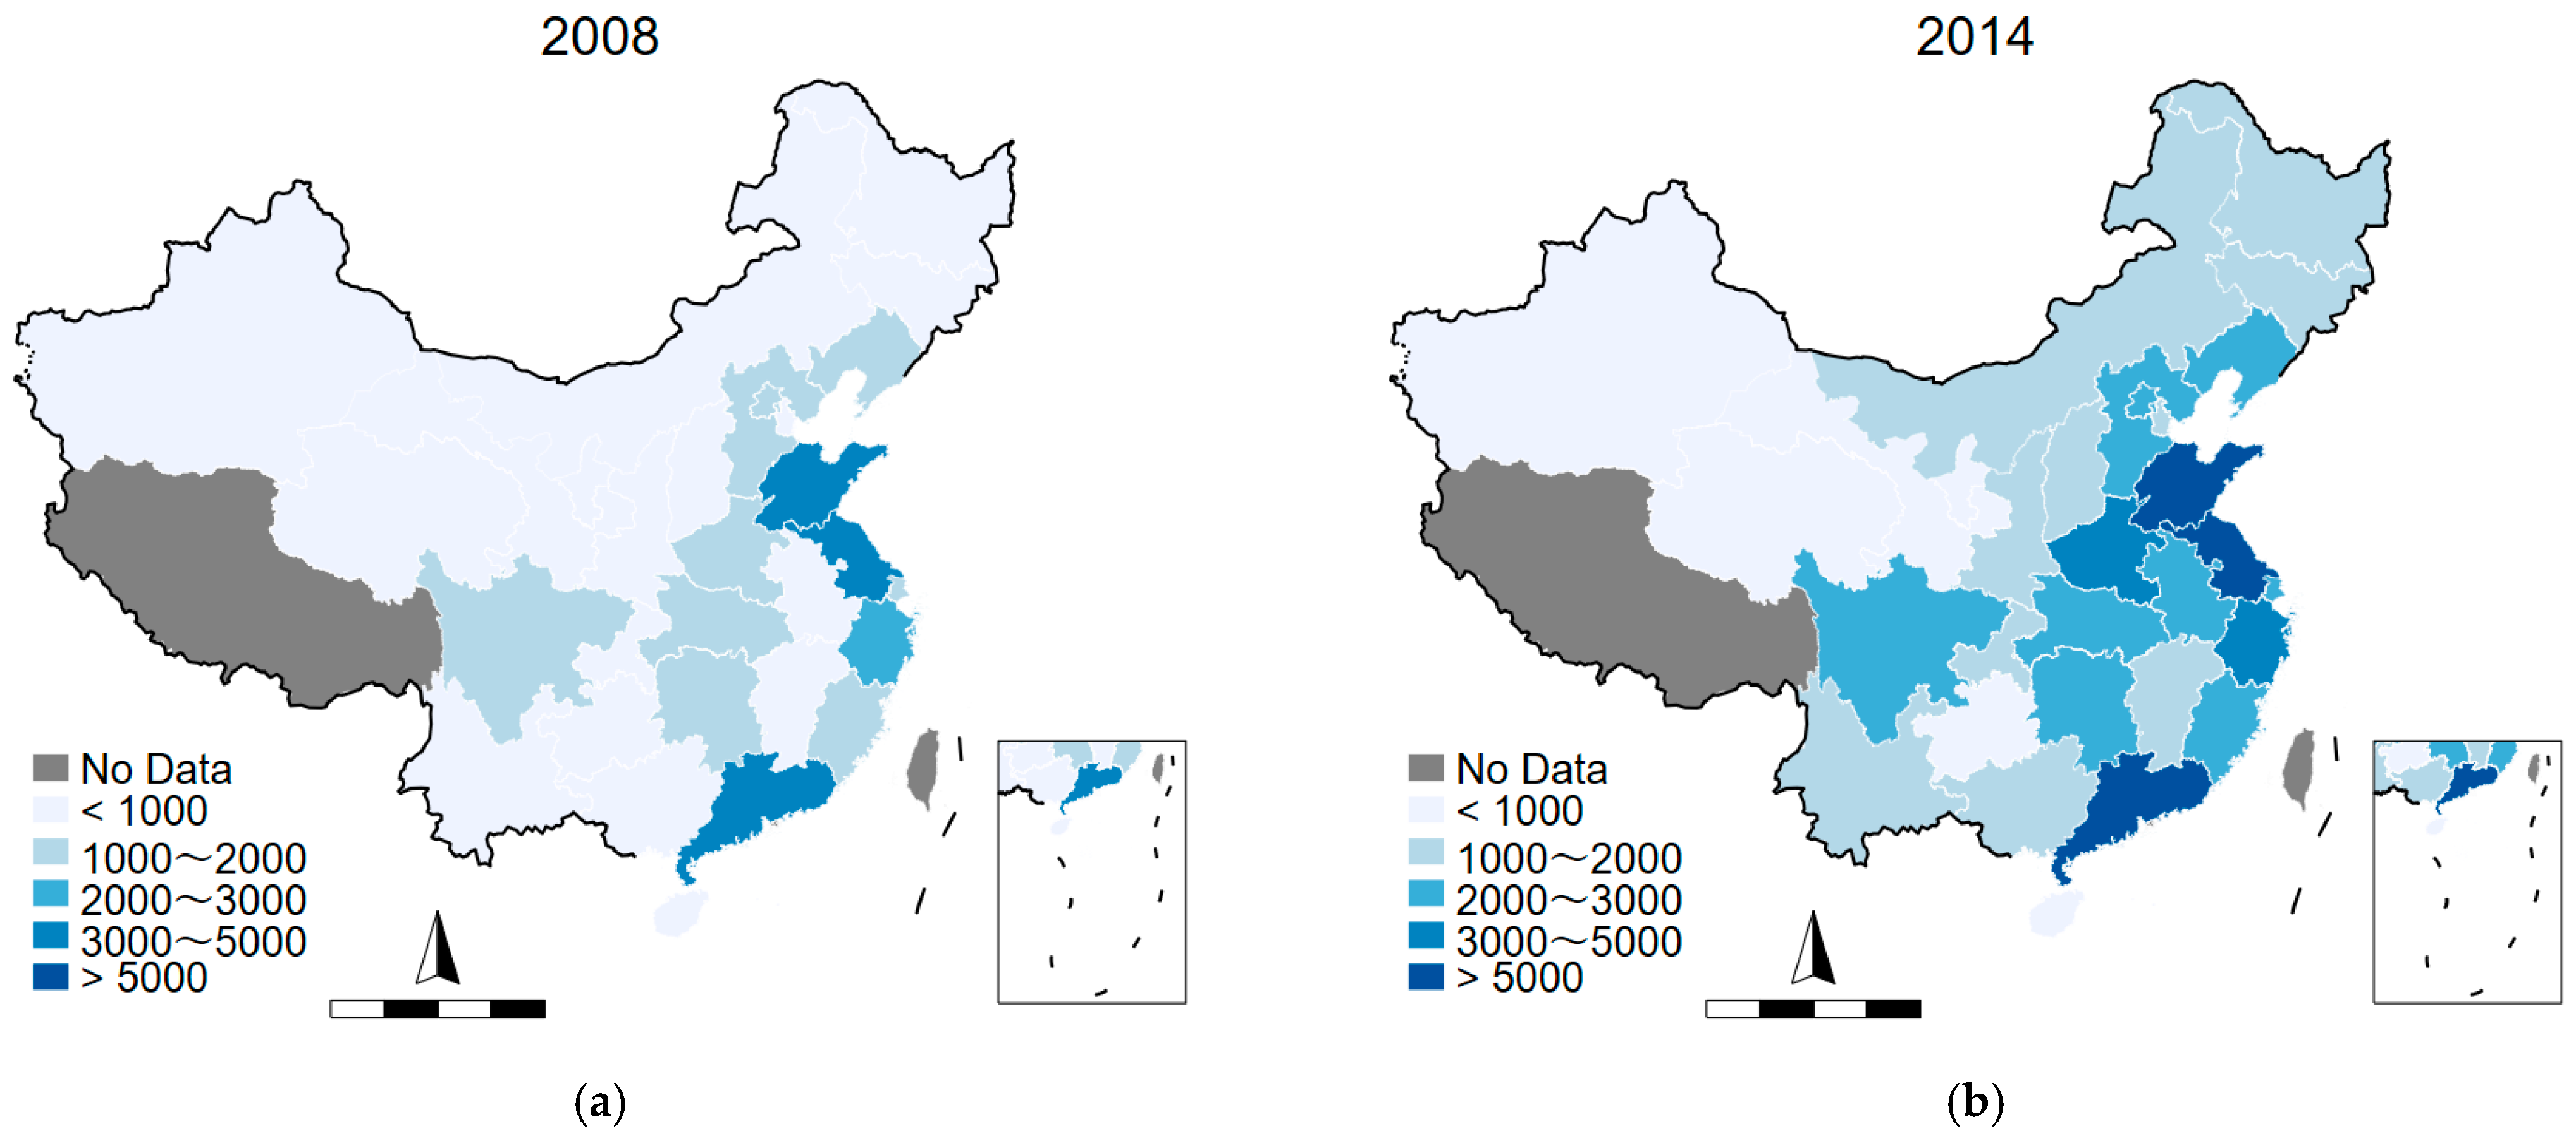
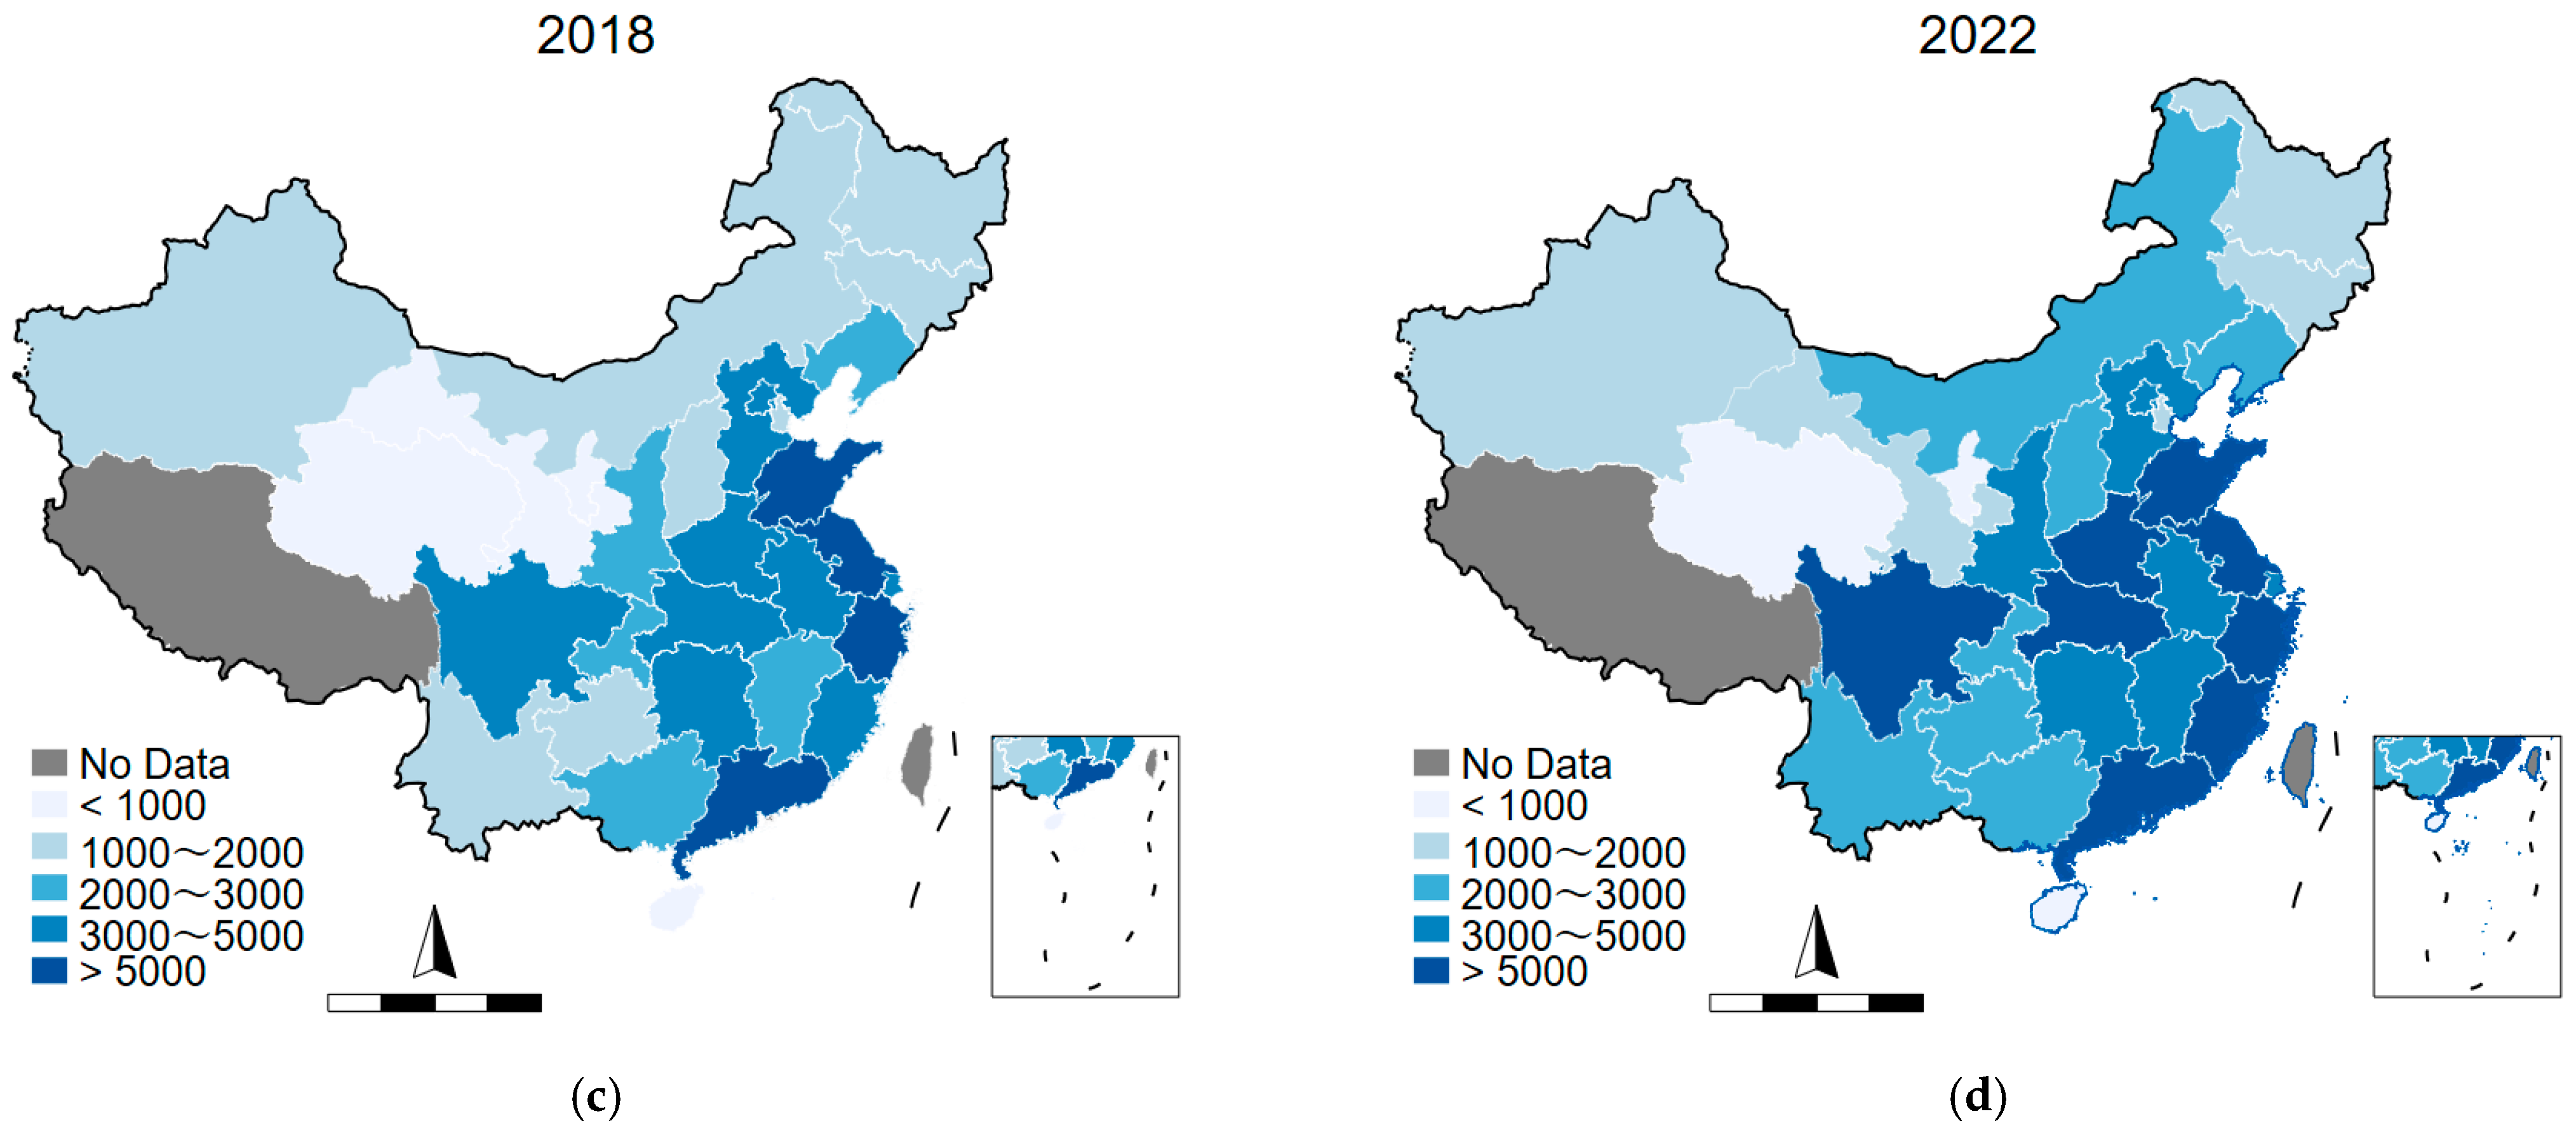
Disclaimer/Publisher’s Note: The statements, opinions and data contained in all publications are solely those of the individual author(s) and contributor(s) and not of MDPI and/or the editor(s). MDPI and/or the editor(s) disclaim responsibility for any injury to people or property resulting from any ideas, methods, instructions or products referred to in the content. |
© 2025 by the authors. Licensee MDPI, Basel, Switzerland. This article is an open access article distributed under the terms and conditions of the Creative Commons Attribution (CC BY) license (https://creativecommons.org/licenses/by/4.0/).