
Internal Control Quality and Leverage Manipulation: Evidence from Chinese State-Owned Listed Companies

Abstract
:1. Introduction
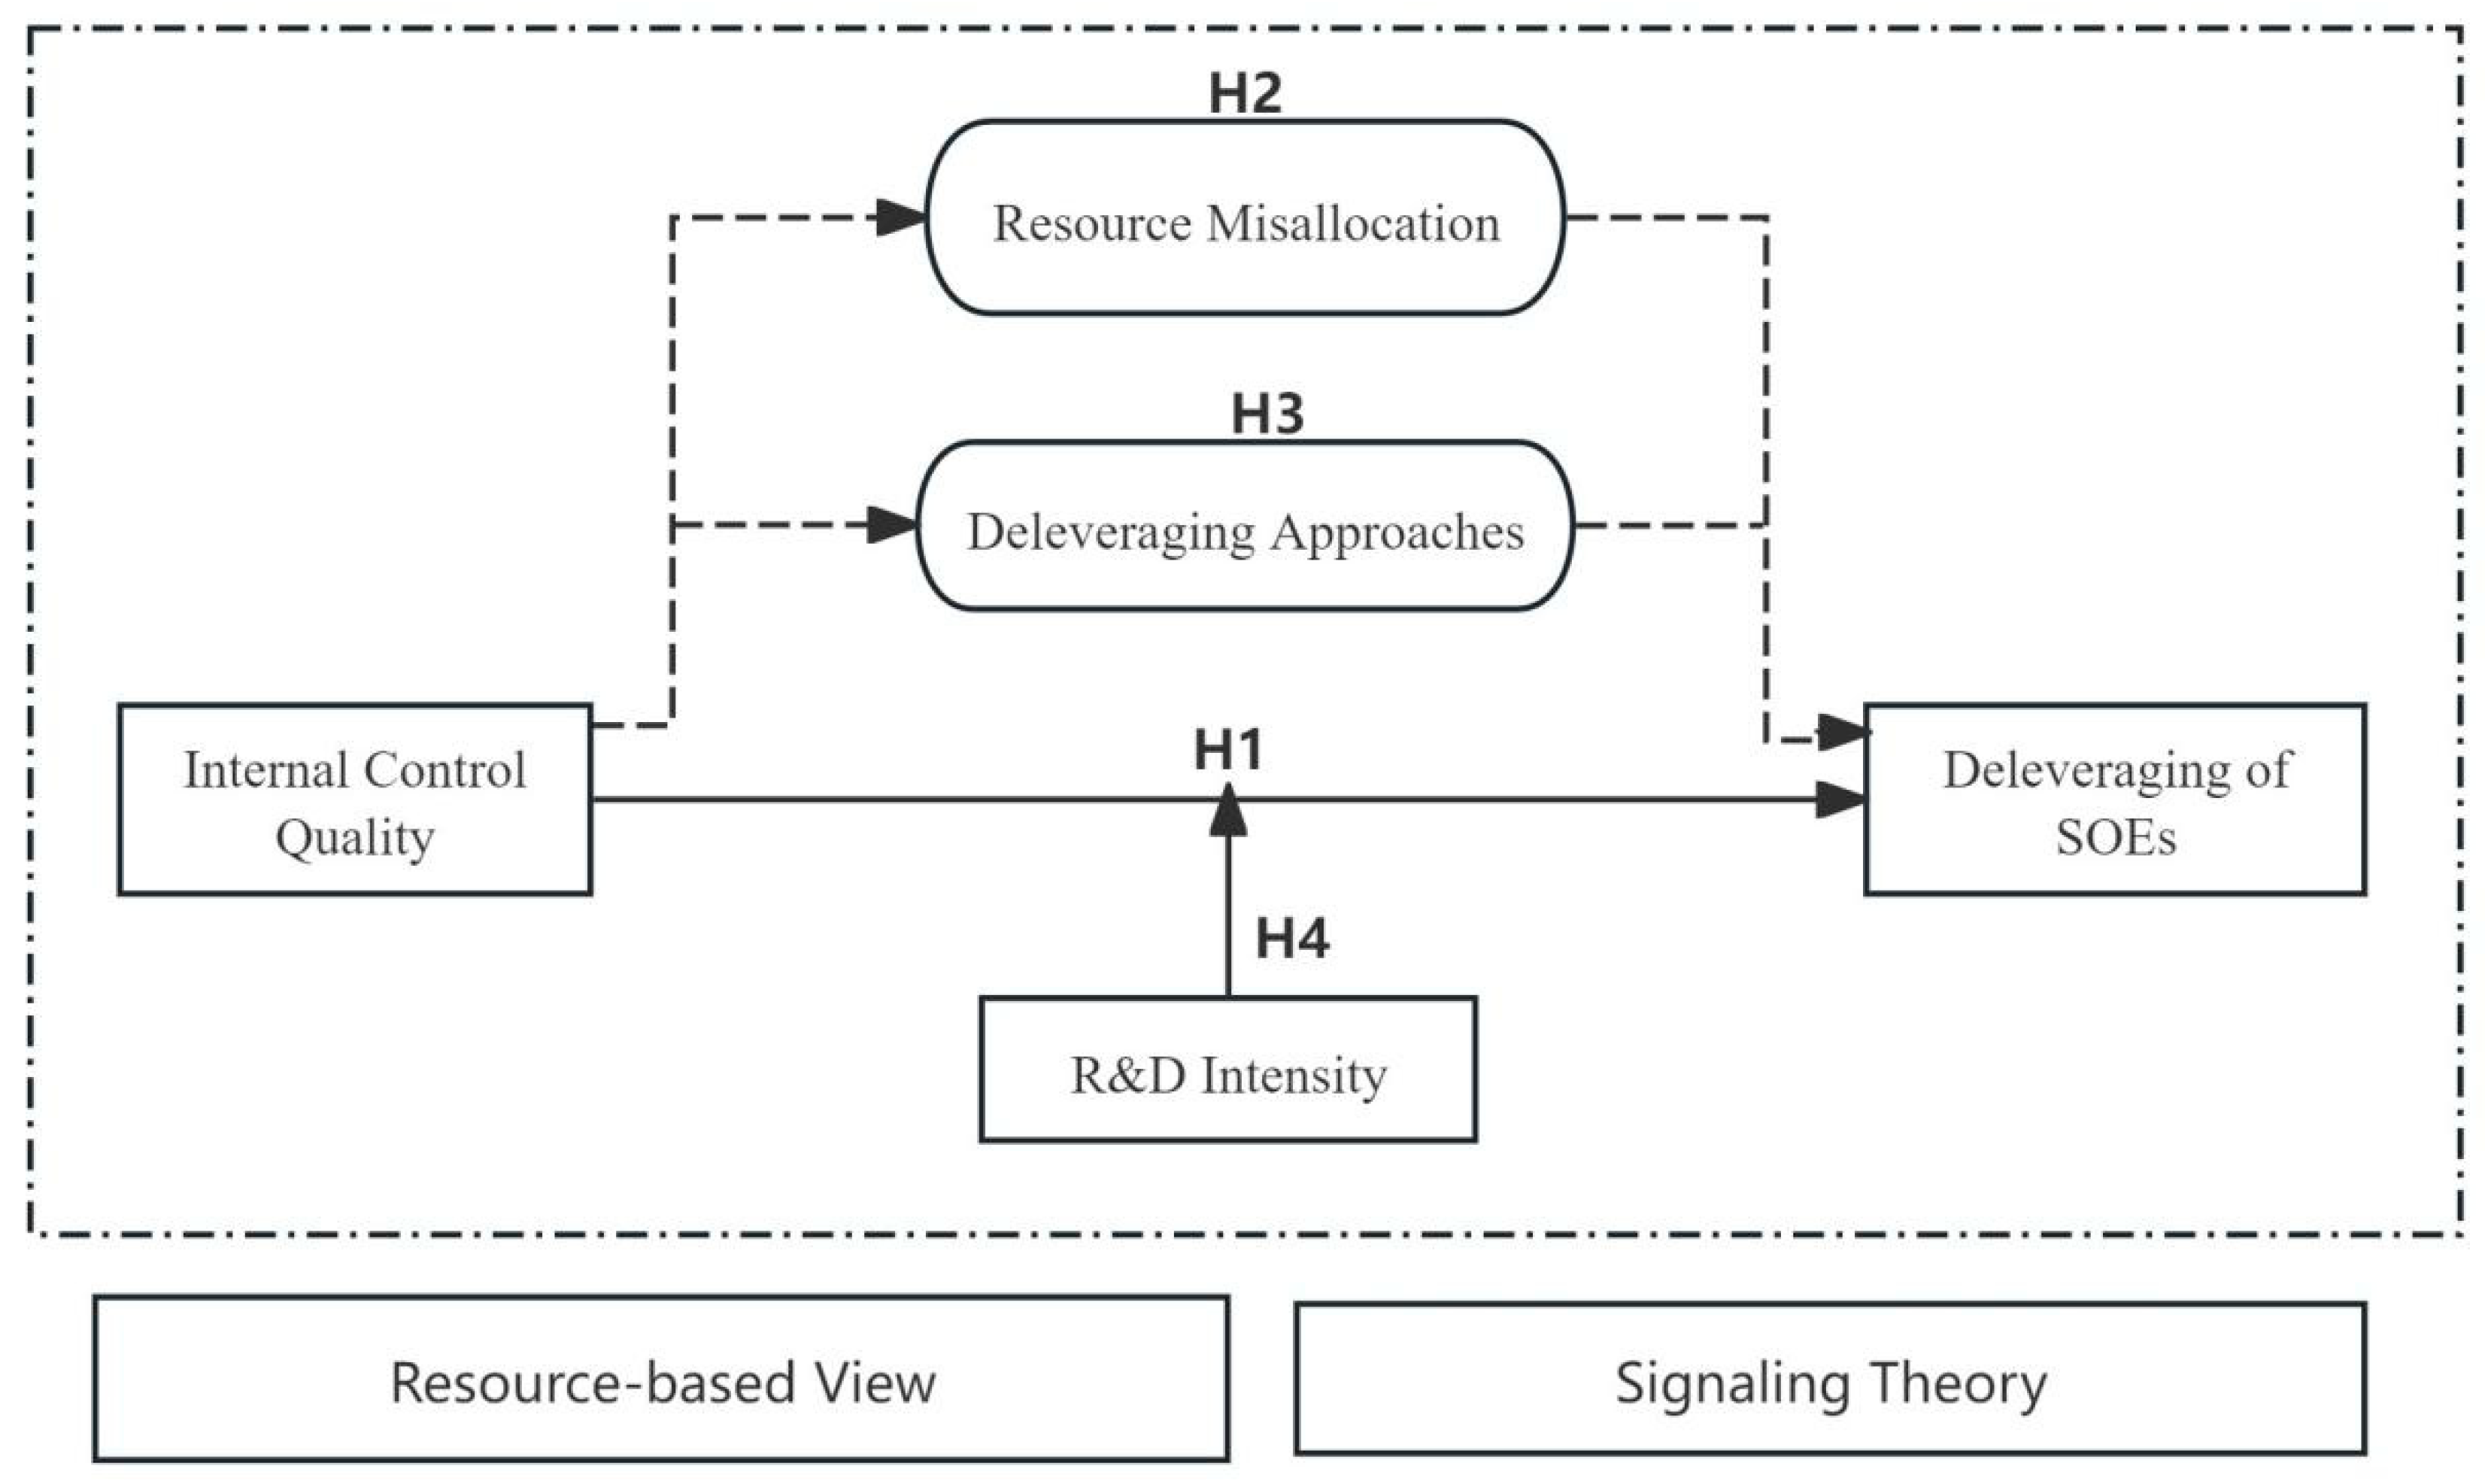
2. Theoretical Background Research Hypothesis
2.1. Internal Control Quality and Deleveraging of SOEs
2.2. Internal Control, Resource Misallocation, and State-Owned Enterprise Deleveraging
2.3. Deleveraging Approaches
2.4. The Moderating Role of R&D Intensity
3. Materials and Methods
3.1. Sample Selection
3.2. Variable Definition
3.2.1. Explained Variable
3.2.2. Core Explanatory Variable
3.2.3. Control Variables
3.3. Model Construction
4. Data Analysis
4.1. Descriptive Analysis
4.2. Benchmark Regression
4.3. Robustness Test
4.3.1. Deleveraging Regulatory Policies
4.3.2. Employing Different Methods to Measure Leverage Manipulation Motivation
4.3.3. Real Estate Industry
4.3.4. Omitted Variable Problem
4.4. Endogeneity Test
4.4.1. PSM Test
4.4.2. Heckman Test
4.4.3. Instrument-Free IV Estimation
4.5. Mediation Analysis
4.5.1. The Role of Resource Misallocation
4.5.2. Selection of Deleveraging Methods
4.5.3. Moderating Effect of R&D Intensity
4.5.4. Heterogeneity Test
- (1)
- Central Enterprises vs. Local SOEs
- (2)
- Excessive Debt vs. Non-Excessive Debt
5. Discussion
6. Conclusions and Future
Author Contributions
Funding
Institutional Review Board Statement
Informed Consent Statement
Data Availability Statement
Conflicts of Interest
Abbreviation
| (SOEs) | State-owned enterprises |
References
- Qiu, B.; Cheng, B. Evidence from China: Is a deleveraging policy effective? Int. Rev. Econ. Financ. 2022, 77, 471–480. [Google Scholar] [CrossRef]
- Yang, X.; Wang, X.; Cao, J.; Song, L.; Huang, C. Evidence from China: Can local government implicit debt raise regional financial market spillover? Financ. Res. Lett. 2024, 67, 105873. [Google Scholar] [CrossRef]
- El Ghoul, S.; Guedhami, O.; Kwok, C.C.; Zheng, Y. Collectivism and the costs of high leverage. J. Bank. Financ. 2019, 106, 227–245. [Google Scholar] [CrossRef]
- Liu, Y.; Liu, J.; Dong, P. Evidence from China: VAT rate cut and enterprise deleveraging. Econ. Anal. Policy 2023, 78, 1254–1266. [Google Scholar] [CrossRef]
- Benigno, P.; Eggertsson, G.B.; Romei, F. Dynamic debt deleveraging and optimal monetary policy. Am. Econ. J. Macroecon. 2020, 12, 310–350. [Google Scholar] [CrossRef]
- Benigno, P.; Romei, F. Debt deleveraging and the exchange rate. J. Int. Econ. 2014, 93, 1–16. [Google Scholar] [CrossRef]
- Tian, Z.; Zhu, B.; Lu, Y. Empirical evidence from China: The governance of non-state shareholders and corporate ESG. Financ. Res. Lett. 2023, 56, 104162. [Google Scholar] [CrossRef]
- Gungoraydinoglu, A.; Öztekin, Ö. Firm-and country-level determinants of corporate leverage: Some new international evidence. J. Corp. Financ. 2011, 17, 1457–1474. [Google Scholar] [CrossRef]
- Chen, H.; Yang, D.; Zhang, J.H.; Zhou, H. Internal controls, risk management, and cash holdings. J. Corp. Financ. 2020, 64, 101695. [Google Scholar] [CrossRef]
- Luo, M. Enterprise internal control and accounting information quality. J. Financ. Risk Manag. 2017, 6, 16–26. [Google Scholar] [CrossRef]
- Qi, B.; Li, L.; Zhou, Q.; Sun, J. Does internal control over financial reporting really alleviate agency conflicts? Account. Financ. 2017, 57, 1101–1125. [Google Scholar] [CrossRef]
- Bole, V.; Prašnikar, J.; Trobec, D. A macroprudential evaluation: Policy measures in the deleveraging process. J. Policy Model. 2014, 36, 410–432. [Google Scholar] [CrossRef]
- Luo, K.; Huang, Y.; Lv, Y. Evidence from environmental, social and governance ratings: Non-state shareholder governance and corporate sustainability. Sustain. Dev. 2024, 32, 211–226. [Google Scholar]
- Feng, M.; Li, C.; McVay, S. Internal control and management guidance. J. Account. Econ. 2009, 48, 190–209. [Google Scholar]
- Brown, N.C.; Pott, C.; Wömpener, A. The effect of internal control and risk management regulation on earnings quality: Evidence from Germany. J. Account. Public Policy 2014, 33, 1–31. [Google Scholar]
- Cheng, Q.; Goh, B.W.; Kim, J.B. Internal control and operational efficiency. Contemp. Account. Res. 2018, 35, 1102–1139. [Google Scholar] [CrossRef]
- Rahman, M.; Rodríguez-Serrano, M.Á.; Lambkin, M. An integrated resource based and signalling theory perspective: Brand management efficiency and firm value. Ind. Market. Manag. 2018, 72, 112–126. [Google Scholar]
- Barney, J.B. Firm Resources and Sustained Competitive Advantage. J. Manag. 1991, 17, 99–120. [Google Scholar] [CrossRef]
- Udeh, I. Observed effectiveness of the COSO 2013 framework. J. Account. Organ. Change 2020, 16, 31–45. [Google Scholar] [CrossRef]
- Power, M. The risk management of everything. J. Risk Financ. 2004, 5, 58–65. [Google Scholar] [CrossRef]
- D’Mello, R.; Gao, X.; Jia, Y. Internal control and internal capital allocation: Evidence from internal capital markets of multi-segment firms. Rev. Account. Stud. 2017, 22, 251–287. [Google Scholar] [CrossRef]
- Ko, C.; Haney, M.H.; Lee, G. Effects of ethical leadership and formal control systems on employee opportunistic behavior in China. Benchmarking 2018, 25, 1350–1362. [Google Scholar] [CrossRef]
- Lai, S.M.; Liu, C.L.; Chen, S.S. Internal control quality and investment efficiency. Account. Horiz. 2020, 34, 125–145. [Google Scholar] [CrossRef]
- Shin, H.H.; Park, Y.S. Financing constraints and internal capital markets: Evidence from Korean chaebols. J. Corp. Financ. 1999, 5, 169–191. [Google Scholar]
- Bargeron, L.L.; Lehn, K.M.; Zutter, C.J. Sarbanes-Oxley and corporate risk-taking. J. Account. Econ. 2010, 49, 34–52. [Google Scholar]
- Boulhaga, M.; Bouri, A.; Elamer, A.A.; Ibrahim, B.A. The moderating role of internal control quality: Environmental, social and governance ratings and firm performance. Corp. Soc. Responsib. Environ. Manag. 2023, 30, 134–145. [Google Scholar] [CrossRef]
- El-Mahdy, D.F.; Park, M.S. Internal control quality and information asymmetry in the secondary loan market. Rev. Quant. Financ. Account. 2014, 43, 683–720. [Google Scholar] [CrossRef]
- Lambert, R.; Leuz, C.; Verrecchia, R.E. Accounting information, disclosure, and the cost of capital. J. Account. Res. 2007, 45, 385–420. [Google Scholar]
- Doyle, J.; Ge, W.; McVay, S. Determinants of weaknesses in internal control over financial reporting. J. Account. Econ. 2007, 44, 193–223. [Google Scholar] [CrossRef]
- Chalmers, K.; Hay, D.; Khlif, H. Internal control in accounting research: A review. J. Account. Lit. 2019, 42, 80–103. [Google Scholar]
- Alexander, C.R.; Bauguess, S.W.; Bernile, G.; Lee, Y.H.A.; Marietta-Westberg, J. Economic effects of SOX Section 404 compliance: A corporate insider perspective. J. Account. Econ. 2013, 56, 267–290. [Google Scholar]
- Zhang, H.; Dong, S. Digital transformation and firms’ total factor productivity: The role of internal control quality. Financ. Res. Lett. 2023, 57, 104231. [Google Scholar]
- Miles, S.J.; Van Clieaf, M. Strategic fit: Key to growing enterprise value through organizational capital. Bus. Horiz. 2017, 60, 55–65. [Google Scholar]
- Fang, H.; Jin, Y. Corporate governance, internal control and inefficient investment: Theoretical analysis and empirical evidences. Account. Res. 2013, 7, 63–69. [Google Scholar]
- Sgambati, S. The art of leverage: A study of bank power, money-making and debt finance. Rev. Int. Polit. Econ. 2019, 26, 287–312. [Google Scholar]
- Vu, Q.; Nga, N.T.T. Does the implementation of internal controls promote firm profitability? Evidence from private Vietnamese small-and medium-sized enterprises (SMEs). Financ. Res. Lett. 2022, 45, 102178. [Google Scholar]
- Osma, B.G.; Gomez-Conde, J.; de las Heras, E. Debt pressure and interactive use of control systems: Effects on cost of debt. Manag. Account. Res. 2018, 40, 27–46. [Google Scholar]
- Dimitropoulos, P.E. R&D investments and profitability during the crisis: Evidence from Greece. R&D Manag. 2020, 50, 587–598. [Google Scholar]
- Sun, L.; Shen, J.; Zhai, J.; Lu, F.; Zhang, X.; Liu, A.; Guan, H. Business environment, financing constraints and enterprise innovation investment. Financ. Res. Lett. 2024, 70, 106310. [Google Scholar] [CrossRef]
- Song, M.; Ai, H.; Li, X. Political connections, financing constraints, and the optimization of innovation efficiency among China’s private enterprises. Technol. Forecast. Soc. Change 2015, 92, 290–299. [Google Scholar]
- Hitt, M.A.; Hoskisson, R.E.; Johnson, R.A.; Moesel, D.D. The market for corporate control and firm innovation. Acad. Manag. J. 1996, 39, 1084–1119. [Google Scholar]
- Shi, L.; Lin, B. The dual-credit policy effectively replaces subsidy from the perspective of R&D intensity. Environ. Impact Assess. Rev. 2023, 102, 107160. [Google Scholar]
- Zhao, L.; Fu, X.; Li, Y.; Zhao, Y. Can exchange inquiry letters identify internal control risks?—Empirical evidence based on inquiry letter of annual report. South Financ. 2020, 10, 40–51. [Google Scholar]
- Huang, Y.; Chen, P.; You, X.; Dou, J. What is the governance effect of “reverse mixed reform” in private enterprises?—Based on evidence of regulatory information. J. Manag. Eng. 2024, 38, 162–178. [Google Scholar]
- Ma, W.; Ding, S.; Jia, P.; Han, J. The deleveraging effect of State-owned Enterprise supervision System: Theoretical logic and empirical evidence from the change of State-owned enterprise affiliation. J. Financ. Econ. 2019, 49, 4–19. [Google Scholar]
- Li, S.; Zhang, N.; Sun, Y. Has China’s mixed-ownership reform helped companies deleverage?—Analysis of utility heterogeneity of different direction mixed reform. J. Dongyue 2023, 44, 125–131. [Google Scholar]
- Wang, Y.; Ding, X.; Liu, Z. The impact of mixed ownership reform on the deleveraging behavior of State-owned enterprises: Degree and way. Account. Res. 2022, 12, 103–118. [Google Scholar]
- Fang, M.; Njangang, H.; Padhan, H.; Simo, C.; Yan, C. Social media and energy justice: A global evidence. Energy Econ. 2023, 125, 106886. [Google Scholar]
- Kiviet, J.F. Testing the impossible: Identifying exclusion restrictions. J. Econom. 2020, 218, 294–316. [Google Scholar]
- Kiviet, J.F. Instrument-free inference under confined regressor endogeneity and mild regularity. Econom. Stat. 2023, 25, 1–22. [Google Scholar]
- Harford, J.; Klasa, S.; Walcott, N. Do firms have leverage targets? Evidence from acquisitions. J. Financ. Econ. 2009, 93, 1–14. [Google Scholar]
- Denis, D.J.; McKeon, S.B. Debt financing and financial flexibility: Evidence from proactive leverage increases. Rev. Financ. Stud. 2012, 25, 1897–1929. [Google Scholar]
- Chang, C.; Chen, X.; Liao, G. What are the reliably important determinants of capital structure in China? Pac.-Basin Financ. J. 2014, 30, 87–113. [Google Scholar]
- Long, T.; Bu, K.; Du, P.; Wang, Z. Can educational investment mitigate the impact of aging on household leverage ratio? Int. Rev. Econ. Financ. 2024, 89, 1335–1347. [Google Scholar]
- Cook, D.O.; Fu, X.; Tang, T. Are target leverage ratios stable? Investigating the impact of corporate asset restructuring. J. Empir. Financ. 2016, 35, 150–168. [Google Scholar]
- D’Mello, R.; Gruskin, M.; Kulchania, M. Shareholders’ valuation of long-term debt and decline in firms’ leverage ratio. J. Corp. Financ. 2018, 48, 352–374. [Google Scholar]
- Zheng, D.; Xu, Y.; Wenren, Y. Compliance management and investment efficiency in state-owned enterprises: Evidence from China. China J. Account. Res. 2024, 17, 100358. [Google Scholar]
- Sanusi, A. State owned enterprises (SOEs), the problems and solutions in financial and asset management. J. Politek. Tunas Pemuda 2016, 3, 19–33. [Google Scholar]
- Kalemli-Özcan, Ş.; Kwak, J.H. Capital flows and leverage. Annu. Rev. Econ. 2020, 12, 833–846. [Google Scholar]
- Cline, B.N.; Fu, X.; Tang, T. Shareholder investment horizons and bank debt financing. J. Bank. Financ. 2020, 110, 105656. [Google Scholar]
- Tran, Q.T. Economic policy uncertainty and cost of debt financing: International evidence. N. Am. J. Econ. Financ. 2021, 57, 101419. [Google Scholar]

| Variable Type | Variable Name | Variable | Variable Definitions |
|---|---|---|---|
| Explanatory variables | Leverage ratio of SOEs | lev | Total liabilities/Total assets |
| Core explanatory variables | Internal control quality | icq | The natural logarithm is taken after adding 1 to the DIBO internal control index |
| Control variables | Management ability | manage | The natural logarithm of total assets |
| Enterprise age | age | The number of years the enterprise has been established plus 1 to take the logarithm | |
| Asset structure | tang | Net profit/Total assets | |
| Proportion of intangible assets | itang | The shareholding ratio of the largest shareholder | |
| Financial liability | finlev | Administrative expenses/total assets | |
| Cash flow | cflow | The difference between control and ownership |
| Variable | Obs | Mean | SD | Min | Median |
|---|---|---|---|---|---|
| lev | 13,458 | 0.0324 | 0.3417 | −0.8477 | 13.9027 |
| icq | 13,458 | 6.2210 | 1.3073 | 0.0000 | 6.9041 |
| manage | 13,458 | 0.0800 | 0.0800 | 0.0065 | 0.8845 |
| age | 13,458 | 2.7344 | 0.4949 | 0.0000 | 3.3673 |
| tang | 13,458 | 0.4068 | 0.1862 | 0.0116 | 0.8076 |
| itang | 13,458 | 0.0501 | 0.0580 | 0.0000 | 0.3045 |
| finlev | 13,458 | 0.4521 | 0.2526 | 0.0000 | 0.9027 |
| cflow | 13,458 | 0.0462 | 0.0700 | −0.1994 | 0.2646 |
| tobin | 13,458 | 1.8059 | 1.1802 | 0.8577 | 8.4650 |
| mbratio | 13,458 | 0.6957 | 0.2655 | 0.1181 | 1.1660 |
| roa | 13,458 | 0.0277 | 0.0571 | −0.3411 | 0.2749 |
| roe | 13,458 | 0.0426 | 0.1656 | −1.0354 | 0.4716 |
| Variable | (1) | (2) | (3) | (4) |
|---|---|---|---|---|
| lev | lev | lev | lev | |
| icq | −0.0349 *** | −0.0273 *** | −0.0270 *** | −0.0221 *** |
| (0.0022) | (0.0023) | (0.0065) | (0.0065) | |
| manage | −0.0320 | −0.1009 | ||
| (0.0397) | (0.0984) | |||
| age | −0.0277 *** | −0.0768 *** | ||
| (0.0060) | (0.0164) | |||
| tang | −0.0991 *** | −0.0888 *** | ||
| (0.0173) | (0.0317) | |||
| itang | −0.0713 | −0.2896 * | ||
| (0.0526) | (0.1557) | |||
| finlev | 0.0271 ** | 0.0620 ** | ||
| (0.0130) | (0.0254) | |||
| cflow | 0.0679 | −0.0553 | ||
| (0.0458) | (0.0499) | |||
| tobin | 0.0175 *** | −0.0059 | ||
| (0.0043) | (0.0087) | |||
| mbratio | 0.0408 ** | 0.0068 | ||
| (0.0195) | (0.0307) | |||
| roa | −0.6544 *** | −0.8432 *** | ||
| (0.1015) | (0.2204) | |||
| roe | −0.0439 | −0.0456 | ||
| (0.0331) | (0.0750) | |||
| _cons | 0.2493 *** | 0.2694 *** | 0.1982 *** | 0.4424 *** |
| (0.0142) | (0.0308) | (0.0419) | (0.0851) | |
| Individual fixed effects | NO | NO | YES | YES |
| Year fixed effects | NO | NO | YES | YES |
| N | 13,458 | 13,458 | 13,415 | 13,415 |
| r2 | 0.0178 | 0.0349 | 0.1483 | 0.1726 |
| r2_a | 0.0177 | 0.0342 | 0.0686 | 0.0944 |
| (1) | (2) | (3) | (4) | (5) | |
|---|---|---|---|---|---|
| lev | lev | lev | lev | lev | |
| icq | −0.0205 *** | −0.0204 *** | −0.0230 *** | −0.0249 *** | −0.0230 *** |
| (0.0064) | (0.0064) | (0.0068) | (0.0077) | (0.0068) | |
| manage | −0.1798 ** | −0.1800 ** | −0.1102 | −0.0806 | −0.1275 |
| (0.0768) | (0.0768) | (0.1039) | (0.1129) | (0.1042) | |
| age | −0.0796 *** | −0.0795 *** | −0.0789 *** | −0.0788 *** | −0.0759 *** |
| (0.0162) | (0.0161) | (0.0166) | (0.0212) | (0.0163) | |
| tang | −0.0715 ** | −0.0719 ** | −0.0971 *** | −0.1129 *** | −0.0888 *** |
| (0.0308) | (0.0307) | (0.0332) | (0.0391) | (0.0316) | |
| itang | −0.2423 | −0.2411 | −0.2936 * | −0.4863 *** | −0.2754 * |
| (0.1570) | (0.1568) | (0.1569) | (0.1651) | (0.1569) | |
| finlev | 0.0612 ** | 0.0621 ** | 0.0645 ** | 0.0531 * | 0.0637 ** |
| (0.0251) | (0.0251) | (0.0267) | (0.0319) | (0.0254) | |
| cflow | −0.0663 | −0.0705 | −0.0332 | −0.0475 | −0.0850 * |
| (0.0489) | (0.0488) | (0.0546) | (0.0549) | (0.0487) | |
| tobin | −0.0094 | −0.0097 | −0.0058 | −0.0049 | −0.0065 |
| (0.0083) | (0.0083) | (0.0088) | (0.0102) | (0.0088) | |
| mbratio | 0.0024 | 0.0006 | 0.0045 | 0.0629 | 0.0122 |
| (0.0282) | (0.0281) | (0.0316) | (0.0436) | (0.0309) | |
| roa | −0.8584 *** | −0.8542 *** | −0.8276 *** | −0.9566 *** | −0.7639 *** |
| (0.2049) | (0.2042) | (0.2312) | (0.2536) | (0.2257) | |
| roe | 0.0006 | 0.0004 | −0.0523 | −0.0539 | −0.0351 |
| (0.0425) | (0.0424) | (0.0812) | (0.0925) | (0.0813) | |
| _cons | 0.4424 *** | 0.4432 *** | 0.4579 *** | 0.4502 *** | 0.4420 *** |
| (0.0793) | (0.0792) | (0.0872) | (0.1039) | (0.0871) | |
| Individual Fixed Effects | YES | YES | YES | YES | YES |
| Year Fixed Effects | YES | YES | YES | YES | NO |
| Year × Industry Fixed Effects | NO | NO | NO | NO | YES |
| N | 12,966 | 13,011 | 12,947 | 12,469 | 13,353 |
| r2 | 0.1726 | 0.1717 | 0.1734 | 0.2898 | 0.1650 |
| r2_a | 0.0914 | 0.0908 | 0.0926 | 0.0725 | 0.0859 |
| Variable | (1) | (2) | (3) | (4) |
|---|---|---|---|---|
| lev | disclosed | lev | lev | |
| z1 | 6.4304 *** | |||
| (0.2217) | ||||
| icq | −0.0230 *** | −0.0224 *** | −0.0273 *** | |
| (0.0068) | (0.0066) | (0.0023) | ||
| size | 0.0873 | |||
| (0.1126) | ||||
| top1 | −0.0173 *** | |||
| (0.0045) | ||||
| big4 | 0.3573 | |||
| (0.2681) | ||||
| depamo | 0.0000 ** | |||
| (0.0000) | ||||
| lnSale | −0.0446 | |||
| (0.0876) | ||||
| tagr | −0.0352 | |||
| (0.0427) | ||||
| tobin | −0.0065 | 0.0016 | −0.0077 | 0.0175 *** |
| (0.0088) | (0.0471) | (0.0087) | (0.0043) | |
| mbratio | 0.0122 | −0.4889 * | 0.0022 | 0.0408 ** |
| (0.0309) | (0.2962) | (0.0305) | (0.0195) | |
| roa | −0.7639 *** | 0.6550 | −0.7589 *** | −0.6544 *** |
| (0.2257) | (1.1663) | (0.2232) | (0.1015) | |
| roe | −0.0351 | −0.0530 | −0.0633 | −0.0439 |
| (0.0813) | (0.3653) | (0.0766) | (0.0331) | |
| cflow | −0.0850 * | −0.0550 | 0.0679 | |
| (0.0487) | (0.0502) | (0.0458) | ||
| imr | 0.0000 | |||
| (0.0000) | ||||
| manage | −0.1275 | −0.0777 | −0.0320 | |
| (0.1042) | (0.1007) | (0.0397) | ||
| age | −0.0759 *** | −2.4213 *** | −0.0774 *** | −0.0277 *** |
| (0.0163) | (0.1737) | (0.0158) | (0.0060) | |
| tang | −0.0888 *** | −0.0983 *** | −0.0991 *** | |
| (0.0316) | (0.0302) | (0.0173) | ||
| itang | −0.2754 * | −0.2950 * | −0.0713 | |
| (0.1569) | (0.1627) | (0.0526) | ||
| finlev | 0.0637 ** | 0.0672 *** | 0.0271 ** | |
| (0.0254) | (0.0258) | (0.0130) | ||
| _cons | 0.4420 *** | 0.1011 *** | 0.4507 *** | 0.2694 *** |
| (0.0871) | (1.6618) | (0.0810) | (0.0308) | |
| Individual Fixed Effects | YES | YES | YES | YES |
| Year Fixed Effects | YES | YES | YES | YES |
| N | 13,353 | 11,304 | 13,182 | 13,458 |
| r2_p | 0.7349 | 0.1837 | ||
| r2_a | 0.0859 | 0.1047 |
| (1) | (2) | (3) | (4) | (5) | |
|---|---|---|---|---|---|
| OP Method | LP Method | OLS Method | FE Method | GMM Method | |
| mis1 | mis2 | mis3 | mis4 | mis5 | |
| icq | −0.0008 * | −0.0012 *** | −0.0009 ** | −0.0008 ** | −0.0028 *** |
| (0.0004) | (0.0004) | (0.0004) | (0.0004) | (0.0006) | |
| manage | 0.2386 *** | 0.2234 *** | 0.2003 *** | 0.1929 *** | 0.2573 *** |
| (0.0131) | (0.0117) | (0.0101) | (0.0098) | (0.0159) | |
| age | 0.0096 *** | 0.0023 | 0.0012 | 0.0000 | 0.0080 *** |
| (0.0026) | (0.0023) | (0.0020) | (0.0020) | (0.0030) | |
| tang | −0.0134 *** | −0.0037 | −0.0062 | −0.0065 * | −0.0146 ** |
| (0.0051) | (0.0046) | (0.0040) | (0.0039) | (0.0063) | |
| itang | −0.0652 *** | −0.0758 *** | −0.0765 *** | −0.0783 *** | −0.0741 *** |
| (0.0147) | (0.0143) | (0.0125) | (0.0125) | (0.0197) | |
| finlev | −0.0179 *** | −0.0142 *** | −0.0124 *** | −0.0122 *** | −0.0196 *** |
| (0.0033) | (0.0030) | (0.0027) | (0.0027) | (0.0040) | |
| cflow | −0.0209 *** | −0.0220 *** | −0.0274 *** | −0.0272 *** | −0.0179 * |
| (0.0078) | (0.0070) | (0.0062) | (0.0060) | (0.0096) | |
| tobin | 0.0027 *** | 0.0039 *** | 0.0046 *** | 0.0047 *** | 0.0021 ** |
| (0.0008) | (0.0008) | (0.0008) | (0.0007) | (0.0010) | |
| mbratio | −0.0029 | −0.0040 | 0.0002 | 0.0003 | −0.0080 |
| (0.0042) | (0.0039) | (0.0035) | (0.0034) | (0.0051) | |
| roa | −0.0180 | −0.0475 *** | −0.0473 *** | −0.0496 *** | −0.0030 |
| (0.0188) | (0.0170) | (0.0145) | (0.0144) | (0.0254) | |
| roe | 0.0077 | 0.0199 *** | 0.0187 *** | 0.0199 *** | 0.0031 |
| (0.0064) | (0.0056) | (0.0048) | (0.0047) | (0.0083) | |
| _cons | 0.0522 *** | 0.0675 *** | 0.0623 *** | 0.0652 *** | 0.0838 *** |
| (0.0090) | (0.0084) | (0.0074) | (0.0073) | (0.0113) | |
| Individual Fixed Effects | YES | YES | YES | YES | YES |
| Year Fixed Effects | YES | YES | YES | YES | YES |
| N | 13,415 | 13,415 | 13,415 | 13,415 | 13,415 |
| r2 | 0.6953 | 0.7428 | 0.7657 | 0.7709 | 0.6610 |
| r2_a | 0.6665 | 0.7185 | 0.7435 | 0.7493 | 0.6290 |
| (1) | (2) | (3) | |
|---|---|---|---|
| Debt Reduction | Reduce Short-Term Debt | Reduce Long-Term Debt | |
| lev1 | lev2 | lev3 | |
| icq | −0.0053 ** | −0.0047 ** | 0.0130 |
| (0.0021) | (0.0023) | (0.0101) | |
| manage | −0.1445 *** | −0.0799 | −0.0792 |
| (0.0506) | (0.0557) | (0.2484) | |
| age | −0.0456 *** | −0.0455 *** | 0.0005 |
| (0.0141) | (0.0156) | (0.0833) | |
| tang | −0.2303 *** | −0.1237 *** | −0.8632 *** |
| (0.0232) | (0.0280) | (0.1285) | |
| itang | −0.2715 *** | −0.2341 ** | 0.1279 |
| (0.0784) | (0.0916) | (0.4441) | |
| finlev | 0.0492 *** | −0.0656 *** | 0.7242 *** |
| (0.0173) | (0.0199) | (0.0940) | |
| cflow | −0.3620 *** | −0.1900 *** | −1.7693 *** |
| (0.0415) | (0.0476) | (0.2093) | |
| tobin | −0.0071 * | −0.0090 * | −0.0269 |
| (0.0040) | (0.0047) | (0.0213) | |
| mbratio | 0.0238 | 0.0362 | −0.0511 |
| (0.0207) | (0.0242) | (0.1151) | |
| roa | −0.2924 *** | −0.2772 ** | 0.2612 |
| (0.0952) | (0.1084) | (0.4884) | |
| roe | 0.1282 *** | 0.1024 *** | 0.3270 ** |
| (0.0253) | (0.0294) | (0.1438) | |
| _cons | 0.3723 *** | 0.3550 *** | 0.5313 ** |
| (0.0477) | (0.0531) | (0.2693) | |
| Individual Fixed Effects | YES | YES | YES |
| Year Fixed Effects | YES | YES | YES |
| N | 13,415 | 13,415 | 13,415 |
| r2 | 0.1749 | 0.1239 | 0.1050 |
| r2_a | 0.0970 | 0.0411 | 0.0204 |
| (1) | (2) | (3) | (4) | (5) | |
|---|---|---|---|---|---|
| Equity Increase | Capital Increase and Profit Retention | Other Equity Increase | Capital Increase | Profit Retention | |
| lev4 | lev5 | lev6 | lev7 | lev8 | |
| icq | −0.0034 ** | −0.0058 *** | 0.0005 | 0.0006 | −0.1299 *** |
| (0.0016) | (0.0013) | (0.0006) | (0.0007) | (0.0170) | |
| manage | −0.0825 ** | 0.0692 ** | −0.0016 | −0.0277 | 1.2376 *** |
| (0.0369) | (0.0311) | (0.0108) | (0.0175) | (0.3612) | |
| age | 0.0153 ** | −0.0300 *** | 0.0085 ** | −0.0385 *** | 0.2013 ** |
| (0.0060) | (0.0100) | (0.0043) | (0.0067) | (0.1018) | |
| tang | −0.0857 *** | −0.0457 *** | −0.0156 ** | −0.0716 *** | 0.5581 *** |
| (0.0131) | (0.0155) | (0.0068) | (0.0095) | (0.1798) | |
| itang | 0.0055 | −0.0073 | −0.0431 * | 0.0334 | 1.0765 * |
| (0.0415) | (0.0526) | (0.0221) | (0.0336) | (0.5927) | |
| finlev | 0.0058 | 0.0347 *** | 0.0088 * | −0.0011 | 0.4904 *** |
| (0.0088) | (0.0109) | (0.0052) | (0.0067) | (0.1291) | |
| cflow | −0.0016 | 0.1360 *** | 0.0094 | −0.0393 *** | 1.1373 *** |
| (0.0225) | (0.0258) | (0.0100) | (0.0150) | (0.2911) | |
| tobin | −0.0046 * | −0.0059 ** | 0.0011 | −0.0023 | 0.0319 |
| (0.0023) | (0.0025) | (0.0010) | (0.0016) | (0.0303) | |
| mbratio | 0.0174 | −0.0535 *** | 0.0073 | 0.0116 | 0.2699 * |
| (0.0118) | (0.0148) | (0.0069) | (0.0088) | (0.1633) | |
| roa | 0.4800 *** | 1.1727 *** | 0.0208 | 0.2208 *** | 7.5397 *** |
| (0.0676) | (0.0602) | (0.0271) | (0.0305) | (0.6431) | |
| roe | 0.4696 *** | −0.0240 | 0.0021 | −0.0131 * | 1.8608 *** |
| (0.0221) | (0.0156) | (0.0083) | (0.0077) | (0.1933) | |
| _cons | 0.0504 ** | 0.1875 *** | −0.0397 *** | 0.1679 *** | −0.3930 |
| (0.0246) | (0.0328) | (0.0146) | (0.0210) | (0.3536) | |
| Individual Fixed Effects | YES | YES | YES | YES | YES |
| Year Fixed Effects | YES | YES | YES | YES | YES |
| N | 13,415 | 13,415 | 13,415 | 13,415 | 13,415 |
| r2 | 0.5052 | 0.2007 | 0.1936 | 0.1572 | 0.1865 |
| r2_a | 0.4585 | 0.1251 | 0.1174 | 0.0776 | 0.1097 |
| (1) | (2) | |
|---|---|---|
| lev | lev | |
| icq | −0.0312 *** | −0.0271 *** |
| (0.0089) | (0.0072) | |
| rd1 | −6.7985 *** | |
| (2.1500) | ||
| rd1_icq | 1.0150 *** | |
| (0.3283) | ||
| rd2 | −0.0057 ** | |
| (0.0025) | ||
| rd2_icq | 0.0008 ** | |
| (0.0004) | ||
| manage | −0.1062 | −0.1037 |
| (0.0993) | (0.0989) | |
| age | −0.0807 *** | −0.0772 *** |
| (0.0164) | (0.0164) | |
| tang | −0.0865 *** | −0.0908 *** |
| (0.0317) | (0.0317) | |
| itang | −0.3000 * | −0.3028 ** |
| (0.1562) | (0.1544) | |
| finlev | 0.0637 ** | 0.0620 ** |
| (0.0252) | (0.0255) | |
| cflow | −0.0525 | −0.0585 |
| (0.0500) | (0.0497) | |
| tobin | −0.0054 | −0.0061 |
| (0.0085) | (0.0086) | |
| mbratio | 0.0017 | 0.0032 |
| (0.0308) | (0.0308) | |
| roa | −0.8624 *** | −0.8561 *** |
| (0.2165) | (0.2188) | |
| roe | −0.0379 | −0.0376 |
| (0.0735) | (0.0743) | |
| _cons | 0.5163 *** | 0.4828 *** |
| (0.0980) | (0.0865) | |
| Individual Fixed Effects | YES | YES |
| Year Fixed Effects | YES | YES |
| N | 13,415 | 13,415 |
| r2 | 0.1754 | 0.1737 |
| r2_a | 0.0973 | 0.0955 |
| (1) | (2) | (3) | (4) | |
|---|---|---|---|---|
| Central Enterprises | Local SOEs | Excessive Debt | Non-Excessive Debt | |
| lev | lev | lev | lev | |
| icq | −0.0225 | −0.0212 *** | −0.0196 *** | −0.0156 |
| (0.0297) | (0.0062) | (0.0066) | (0.0136) | |
| manage | −0.2865 * | −0.0500 | 0.0508 | −0.2060 * |
| (0.1739) | (0.1145) | (0.1770) | (0.1167) | |
| age | −0.0210 | −0.0907 *** | −0.1036 *** | −0.1050 *** |
| (0.0397) | (0.0181) | (0.0274) | (0.0211) | |
| tang | −0.1739 ** | −0.0998 *** | −0.1516 *** | −0.0657 |
| (0.0803) | (0.0336) | (0.0455) | (0.0497) | |
| itang | −1.5111 | −0.2597 | −0.4087 ** | −0.1888 |
| (1.2894) | (0.1595) | (0.1924) | (0.1651) | |
| finlev | −0.0866 | 0.0968 *** | −0.0354 | 0.0842 ** |
| (0.1038) | (0.0258) | (0.0427) | (0.0336) | |
| cflow | −0.0221 | −0.0718 | −0.0812 | −0.0173 |
| (0.1520) | (0.0528) | (0.0677) | (0.0768) | |
| tobin | −0.0510 | 0.0013 | −0.0062 | 0.0055 |
| (0.0453) | (0.0070) | (0.0128) | (0.0075) | |
| mbratio | −0.0216 | 0.0144 | 0.0181 | −0.0216 |
| (0.0764) | (0.0335) | (0.0603) | (0.0370) | |
| roa | −0.9921 | −0.7702 *** | −0.7235 *** | −1.4800 *** |
| (0.6599) | (0.2421) | (0.2554) | (0.4102) | |
| roe | −0.0539 | −0.0512 | −0.0696 | 0.2040 |
| (0.1601) | (0.0874) | (0.0581) | (0.2940) | |
| _cons | 0.5546 * | 0.4392 *** | 0.5720 *** | 0.4580 *** |
| (0.3026) | (0.0805) | (0.1431) | (0.1134) | |
| Individual Fixed Effects | YES | YES | YES | YES |
| Year Fixed Effects | YES | YES | YES | YES |
| N | 1906 | 11,225 | 6826 | 6423 |
| r2 | 0.2228 | 0.2009 | 0.3070 | 0.1622 |
| r2_a | 0.1000 | 0.1166 | 0.2046 | 0.0413 |
Disclaimer/Publisher’s Note: The statements, opinions and data contained in all publications are solely those of the individual author(s) and contributor(s) and not of MDPI and/or the editor(s). MDPI and/or the editor(s) disclaim responsibility for any injury to people or property resulting from any ideas, methods, instructions or products referred to in the content. |
© 2025 by the authors. Licensee MDPI, Basel, Switzerland. This article is an open access article distributed under the terms and conditions of the Creative Commons Attribution (CC BY) license (https://creativecommons.org/licenses/by/4.0/).
Share and Cite
Chen, Q.; Liu, S. Internal Control Quality and Leverage Manipulation: Evidence from Chinese State-Owned Listed Companies. Sustainability 2025, 17, 2905. https://doi.org/10.3390/su17072905
Chen Q, Liu S. Internal Control Quality and Leverage Manipulation: Evidence from Chinese State-Owned Listed Companies. Sustainability. 2025; 17(7):2905. https://doi.org/10.3390/su17072905
Chicago/Turabian StyleChen, Qianqian, and Shilin Liu. 2025. "Internal Control Quality and Leverage Manipulation: Evidence from Chinese State-Owned Listed Companies" Sustainability 17, no. 7: 2905. https://doi.org/10.3390/su17072905
APA StyleChen, Q., & Liu, S. (2025). Internal Control Quality and Leverage Manipulation: Evidence from Chinese State-Owned Listed Companies. Sustainability, 17(7), 2905. https://doi.org/10.3390/su17072905