Abstract
Rural modernization constitutes a crucial aspect in the modernization of socialism with Chinese characteristics. This paper assesses the level of rural modernization in China and investigates its spatiotemporal evolution characteristics and restrictive factors through a spatial autocorrelation analysis and the obstacle degree model. The research indicates that: (1) The overall rural modernization has escalated, with infrastructure and public services advancing at the fastest pace, while the modernization of the ecological environment and governance system lags relatively behind. The majority of provinces exhibit distinct internal imbalances and classified development traits, mainly categorized as the ecological priority type and economic priority type. (2) The eastern coastal areas and the southwest region have witnessed rapid development due to their well-established infrastructure and agglomeration of innovative elements; the northwest and northeast regions have developed slowly, influenced by geographical conditions and industrial structure. Regions exhibit the characteristics of both high and low agglomeration in multiple dimensions. (3) The modernization of governance systems and the ecological environment serve as the primary constraints, manifested as a low percentage of administrative villages, insufficient planning, excessive use of pesticides and fertilizers, and a low greening rate. Hence, it is necessary to address the shortcomings, optimize the spatial layout, and strengthen grassroots governance capacities to promote the coordinated advancement of rural modernization.
1. Introduction
Promoting rural modernization is a critical task in the comprehensive construction of a socialist modernized country and serves as a key strategy to address regional development imbalances and inadequacies. The 19th CPC National Congress officially incorporated rural modernization into the comprehensive framework of socialist modernization emphasizing the need for synchronized and systematic integration of agricultural and rural development [1]. Despite this, rural areas continue to face widespread challenges, including insufficient infrastructure and public services, weak governance capacity for ecological environments, and significant regional disparities, all of which pose substantial barriers to achieving rural modernization [2,3,4,5,6]. Consequently, rural modernization must be prioritized as a core component of national modernization efforts. In this context, assessing the level of rural modernization in China and identifying the constraints within its development process not only provides empirical support for domestic policymakers and local governments to optimize resource allocation and develop targeted revitalization strategies but also contributes to comparative studies on rural modernization pathways and evaluation frameworks in developing countries from an international perspective. This research holds considerable significance for understanding the trajectory of agricultural and rural modernization and addressing existing deficiencies.
For an extended period, rural modernization has remained a central focus of scholarly inquiry, encompassing multiple dimensions such as technological innovation, transformations in production relations, and adjustments in social structures [7,8,9,10]. Contemporary research on rural modernization primarily converges on its conceptual framework, practical pathways, level assessment, measurement methodologies, and outcome analysis. Regarding its connotation, early studies predominantly concentrated on agricultural modernization, investigating the characteristics of technological innovation, the enhancement in production efficiency, and the improvement in social welfare during the transition from traditional to modern agriculture [11]. Meanwhile, from the perspective of Marxist political economy, rural modernization fundamentally entails a restructuring of production relations, wherein modernization is achieved through profound transformations in rural social structures [12].With the continuous advancement of theoretical discourse, the academic focus has expanded beyond agricultural modernization to encompass the modernization of rural areas and farmers, thereby exploring coordinated development pathways for agriculture and rural society [13,14,15,16]. For instance, Knickel, from the perspective of farmers’ agency, posited that human capital accumulation plays a mediating role in the modernization process [17]. Huttunen, utilizing empirical data from Europe, examined the symbiotic relationship between agricultural technological revolutions and rural governance transformations [18]. Hardeman, through a multidimensional analysis, elucidated the internal mechanisms driving the coordinated development of agriculture, rural areas, and farmers [19]. These studies have significantly enriched the understanding of rural modernization and provided valuable insights for constructing comprehensive evaluation index systems. Internationally, research on the assessment of rural modernization levels commenced relatively early, with evaluation frameworks typically integrating agricultural and rural modernization. These frameworks predominantly emphasize the role of production efficiency and sustainable development in facilitating rural transformation [20,21,22,23]. For example, Schultz contended that the transition from traditional to modern agriculture is primarily driven by the incorporation of contemporary production elements and advancements in technology [24]. Rezaei and Karami adopted a multidimensional approach to measure modernization levels, incorporating aspects such as efficient resource utilization, environmental sustainability, product quality, economic benefits, employment, and social participation [25]. In contrast, domestic scholars have developed evaluation frameworks that, while complementing traditional index systems, exhibit distinct emphases on governance, ecology, culture, and public services [26]. For instance, Di Fei and Hu Zhiquan et al. proposed an index system encompassing six dimensions: industry, production, operation, support and protection, quality and efficiency, and green development [27]. Another study formulated an evaluation framework comprising five aspects: industry, ecology, culture, governance, and quality of life [28]. Regarding measurement methodologies, scholars typically employ subjective weighting techniques—such as the Delphi method [29] and the Analytic Hierarchy Process (AHP) [30]—as well as objective weighting approaches, including the entropy weight method [31] and the entropy weight TOPSIS approach [32]. Additionally, multi-method integrated multi-index measurement systems are frequently utilized [33]. For the analysis of evaluation results, scholars apply diverse analytical models, including the coupling coordination degree model [34], kernel density estimation [34], the Dagum Gini coefficient method [35], spatial econometric models [36], and the obstacle factor diagnosis model [37]. These methods facilitate an in-depth examination of the spatiotemporal evolution, regional disparities, and key determinants shaping the trajectory of rural modernization.
In summary, while existing research has explored rural modernization from multiple dimensions and established a solid theoretical foundation, several areas warrant further in-depth investigation. First, most studies primarily emphasize qualitative analyses of theoretical connotations and transformation pathways, yet rigorous quantitative examinations of the internal structural differences in rural modernization and their influencing factors remain limited. Second, quantitative studies often conflate agricultural modernization with rural modernization in measurement, failing to precisely capture the distinctive characteristics and indicator system specific to rural modernization. Third, there is no unified consensus—either domestically or internationally—on the construction standards for evaluating rural modernization, resulting in considerable discrepancies in indicator selection and weight determination across studies. Fourth, systematic diagnostic research on the constraints within the rural modernization process remains insufficient, with the interrelationships among hindering factors requiring further clarification. Against this backdrop, this study focuses on assessing the level of rural modernization in China from 2013 to 2022. Utilizing the entropy method, it constructs a comprehensive evaluation indicator system, incorporating spatial autocorrelation analysis to elucidate the spatiotemporal evolution characteristics of rural modernization. Additionally, the study employs the obstacle degree model to identify key constraints inhibiting modernization progress. By establishing a systematic measurement framework, this research advances both the theoretical and methodological dimensions of rural modernization assessment. Furthermore, it provides empirical data to support policy optimization, enhance regional coordination, and guide local governments and grassroots governance practitioners in promoting the sustained advancement of rural modernization.
2. Data Sources and Research Methods
2.1. Sources of Data
Given data availability and the requirement for continuity in the time series, this study constructed a dataset covering 30 provinces in China for the period from 2013 to 2022. Due to incomplete or missing data, the Tibet Autonomous Region, Hong Kong SAR, Macao SAR, and Taiwan were excluded from the analysis. It is important to note that, although China’s administrative system consists of 34 provincial-level regions—including 23 provinces, 5 autonomous regions, 4 municipalities, and 2 special administrative regions—this study focused on the 30 provinces with more comprehensive and continuous data to ensure the robustness of the analysis. The data utilized in this study were derived from authoritative sources, including the China Statistical Yearbook, China Rural Statistical Yearbook, China Urban and Rural Statistical Yearbook, China Population and Employment Statistical Yearbook, China Environmental Statistical Yearbook, and China Social Statistical Yearbook, all published by the National Bureau of Statistics of China. Additionally, provincial-level statistical yearbooks were incorporated to enhance data completeness and regional accuracy. The use of these official sources ensured a high degree of data reliability and consistency, thereby providing a solid empirical foundation for the study.
The absence or incompleteness of data in certain provinces for some years may compromise the continuity of trend analysis and result in potential overestimation or underestimation of the actual conditions in specific regions. To address this issue, this study employed alternative indicators, estimation techniques, or reconstructed data based on relevant statistical yearbooks to supplement the missing information, thereby providing data that more closely approximates the true situation. To ensure the scientific rigor and reliability of the final results, all original data underwent standardization. Specifically, the extreme value method was applied to standardize the original data [38], resolving inconsistencies across dimensions, units, scales, and positive/negative attributes while ensuring the comparability of the data within a unified framework.
The equation for normalizing positive indicators is:
The equation for normalizing negative indicators is:
Within this framework, in Equation (i = 1, 2, 3, …, n; j = 1, 2, 3, …, m), X’ij represents the data after dimensionless processing, Xij denotes the original data of the j-th indicator for the i-th province, max(Xij) corresponds to the maximum value of the original indicator data, and min(Xij) refers to the minimum value of the original indicator data.
2.2. Construction of the Indicator System for the Level of Development of Rural Modernization
With China entering a new era of development, enhancing production capacity, increasing farmers’ incomes, and advancing rural construction have become core objectives of the comprehensive rural revitalization strategy. This strategy has introduced new connotations and characteristics to the process of rural modernization. To systematically capture this transformation, this study constructed an evaluation framework grounded in a thorough understanding of rural modernization and aligned with the core principles of the rural revitalization strategy. These principles include industrial prosperity, ecological livability, rural cultural advancement, effective governance, and improved living standards. Drawing on the existing scholarly research [39,40,41,42] and adhering to the principles of usability, comparability, and systemicity, this study established an indicator system encompassing five key dimensions: rural ecological environment, rural governance system and governance capacity, rural cultural and healthcare systems, rural residents’ income and consumption patterns, and rural infrastructure and public services. These primary dimensions were further operationalized into 21 secondary indicators (Table 1).

Table 1.
Assessment framework for rural modernization.
Specifically: (1) The rural ecological environment modernization index was designed to evaluate the rural areas’ capacity for sustainable development and the degree of harmony between humans and nature, with a focus on enhancing the improvement and sustainability of the ecological environment. To this end, key factors such as environmental governance, resource use efficiency, ecological protection, green development, and pollution prevention and control were selected to comprehensively reflect the outcomes of ecological environment optimization and its contribution to sustainable development [41,43,44,45]. (2) The indicators for the modernization of the rural governance system and governance capacity aim to measure the optimization of the rural governance structure, efficiency enhancement, and promotion of rule-of-law construction, with particular emphasis on the quality of public service delivery. Therefore, elements such as governance structure optimization, grassroots governance capacity, public service efficiency, and rule-of-law construction were selected to comprehensively assess the effectiveness of rural governance and social management modernization [46,47]. (3) Cultural and healthcare modernization indicators focus on improving rural residents’ living standards encompassing cultural undertakings, the enhancement of farmers’ quality, and improvements in healthcare services. To this end, indicators such as the coverage rate of cultural service facilities, the proportion of expenditure on education, culture, and entertainment, health resource allocation, and rural education levels were selected to reflect advancements in rural culture and health [48,49,50]. (4) Income and consumption modernization indicators primarily measure rural economic development and the improvement in residents’ living standards, with a specific focus on the growth of farmers’ income and the optimization of consumption structures. Indicators such as per capita disposable income, the composition of consumption expenditure, the urban–rural income gap, and the proportion of household consumption expenditure were selected to comprehensively reflect the growth of the rural economy and the enhancement of residents’ welfare [51]. (5) Infrastructure and public service modernization indicators emphasize reflecting improvements in rural production and living conditions as well as infrastructure construction. Indicators such as the safe drinking water guarantee rate, energy supply penetration rate, road hardening rate, resident electricity consumption rate, and the urban–rural infrastructure gap were selected to evaluate the supportive role of infrastructure and public service systems in rural development [52,53].
2.3. Research Methodology
2.3.1. Entropy Value Method
The entropy value method (EVM) is an objective weighting approach based on information entropy theory, designed to quantify the uncertainty in the data distribution of each evaluation indicator, thereby ensuring a scientifically rigorous determination of weights. By measuring the informational content of the indicators, this method mitigates the biases that may arise from subjective weighting, thereby enhancing the objectivity and accuracy of evaluation. To ensure an accurate assessment of rural modernization levels, this study first employed the range standardization method to eliminate scale differences among indicators. Subsequently, the entropy method was applied to calculate the objective weights of each evaluation index. Finally, utilizing a multivariate linear weighting model, the comprehensive development level of rural modernization—as well as the scores of its various subsystems—was computed [54]. A higher index value indicates a more advanced level of rural modernization, whereas a lower value suggests a less developed state.
The specific calculation formula is as follows:
① Calculate the information entropy ej for each indicator as follows:
② Calculate the specific weight Wj for each indicator as follows:
③ Calculate the index of rural modernization development level based on the weighted indicators:
In this framework, X’ij represents the normalized data, while Xij refers to the original data for the j-th of the i-th province. max(Xij) and min(Xij) represent the highest and lowest values of the original indicator data, respectively. Y is the proportion of the proportion of the j-th for the i-th evaluation object. e is the information entropy, g denotes the variation coefficient, W represents the specific weight, Z refers to the rural modernization development index, and m represents the total count of indicators.
2.3.2. Spatial Autocorrelation Analysis
Spatial autocorrelation analysis, as a fundamental method in geospatial statistics, quantifies spatial dependence to uncover the spatial heterogeneity and agglomeration characteristics of the observed variables. Empirical evidence indicates that China’s rural development process exhibits pronounced spatial agglomeration patterns. However, due to variations in regional resource endowment and socio-economic development needs, agricultural modernization displays distinct gradient differentiation characteristics between eastern and western regions [55]. To systematically explore the spatial differentiation laws of rural modernization levels and their dynamic evolution mechanisms, this study employed Global Moran’s I (GMI) and Local Moran’s I (LMI) for spatial autocorrelation analysis. Moran’s scatterplot and Local Indicators of Spatial Association (LISA) values are utilized to depict local spatial agglomeration characteristics and assess their statistical significance [56]. Specifically, the GMI evaluates the overall spatial agglomeration of rural modernization levels, revealing whether significant spatial autocorrelation exists. In contrast, the LMI decomposes the study units to identify spatial differences between provinces and their neighboring regions, further elucidating the specific agglomeration patterns at the local level.
The specific formula for the GMI is as follows:
The specific formula for the LMI is as follows:
Among them, I is the GMI, which quantifies the overall spatial correlation of rural modernization levels across different regions; Ii is the MLI, which assesses the spatial association between the i-th region and its neighboring regions; xi represents the rural modernization development level in province x; n represents the total count of study units; represents the average rural modernization level across all n provinces; S2 is the sample variance, providing a measure of data dispersion; and Wij represents the spatial weight matrix, which is utilized to measure the spatial interaction among different regions. The Moran’s I value spans from −1 to 1. If Moran’s I is above 0, it suggests positive spatial autocorrelation, where regions with high values are more likely to group together. On the other hand, when Moran’s I is below 0, it implies a negative spatial autocorrelation, with low-value regions more likely to aggregate. A Moran’s I value of 0 indicates a random spatial distribution, lacking any substantial spatial correlation.
2.3.3. Obstacle Degree Model
The obstacle degree model (ODM) is a method for assessing the blocking effect based on system-level deconstruction, which can reveal the spatial heterogeneity and dynamic evolution characteristics of the multidimensional blocking mechanism by quantifying the strength of the negative effect of the limiting factors on the target system. In order to deeply study the main obstacle factors restricting the development of China’s rural modernization, this paper referred to the research of Shujuan Ding [57] to diagnose and analyze the constraining factors of the rural modernization system, and the main calculation formula is provided as follows.
where Dij represents the deviation index, quantifying the degree of deviation between a specific indicator and its theoretical maximum value; Uij represents the factor contribution rate, which indicates the contribution of a particular indicator to the entire indicator system; Wij represents the indicator weight, which is utilized to assess the relative significance of the indicator within the comprehensive evaluation system; and Oij represents the obstruction level of a particular indicator, which quantitatively analyzes the extent to which a specific indicator hinders the rural modernization process. A larger Oij value suggests a greater negative influence on regional rural modernization. j is the index variable, indicating the location for the j-th particular assessment indicator within the sequence of indicators.
3. Results and Discussion
3.1. Temporal Analysis of the Development Level of Rural Modernization in China
3.1.1. The General Features of China’s Rural Modernization Development Level
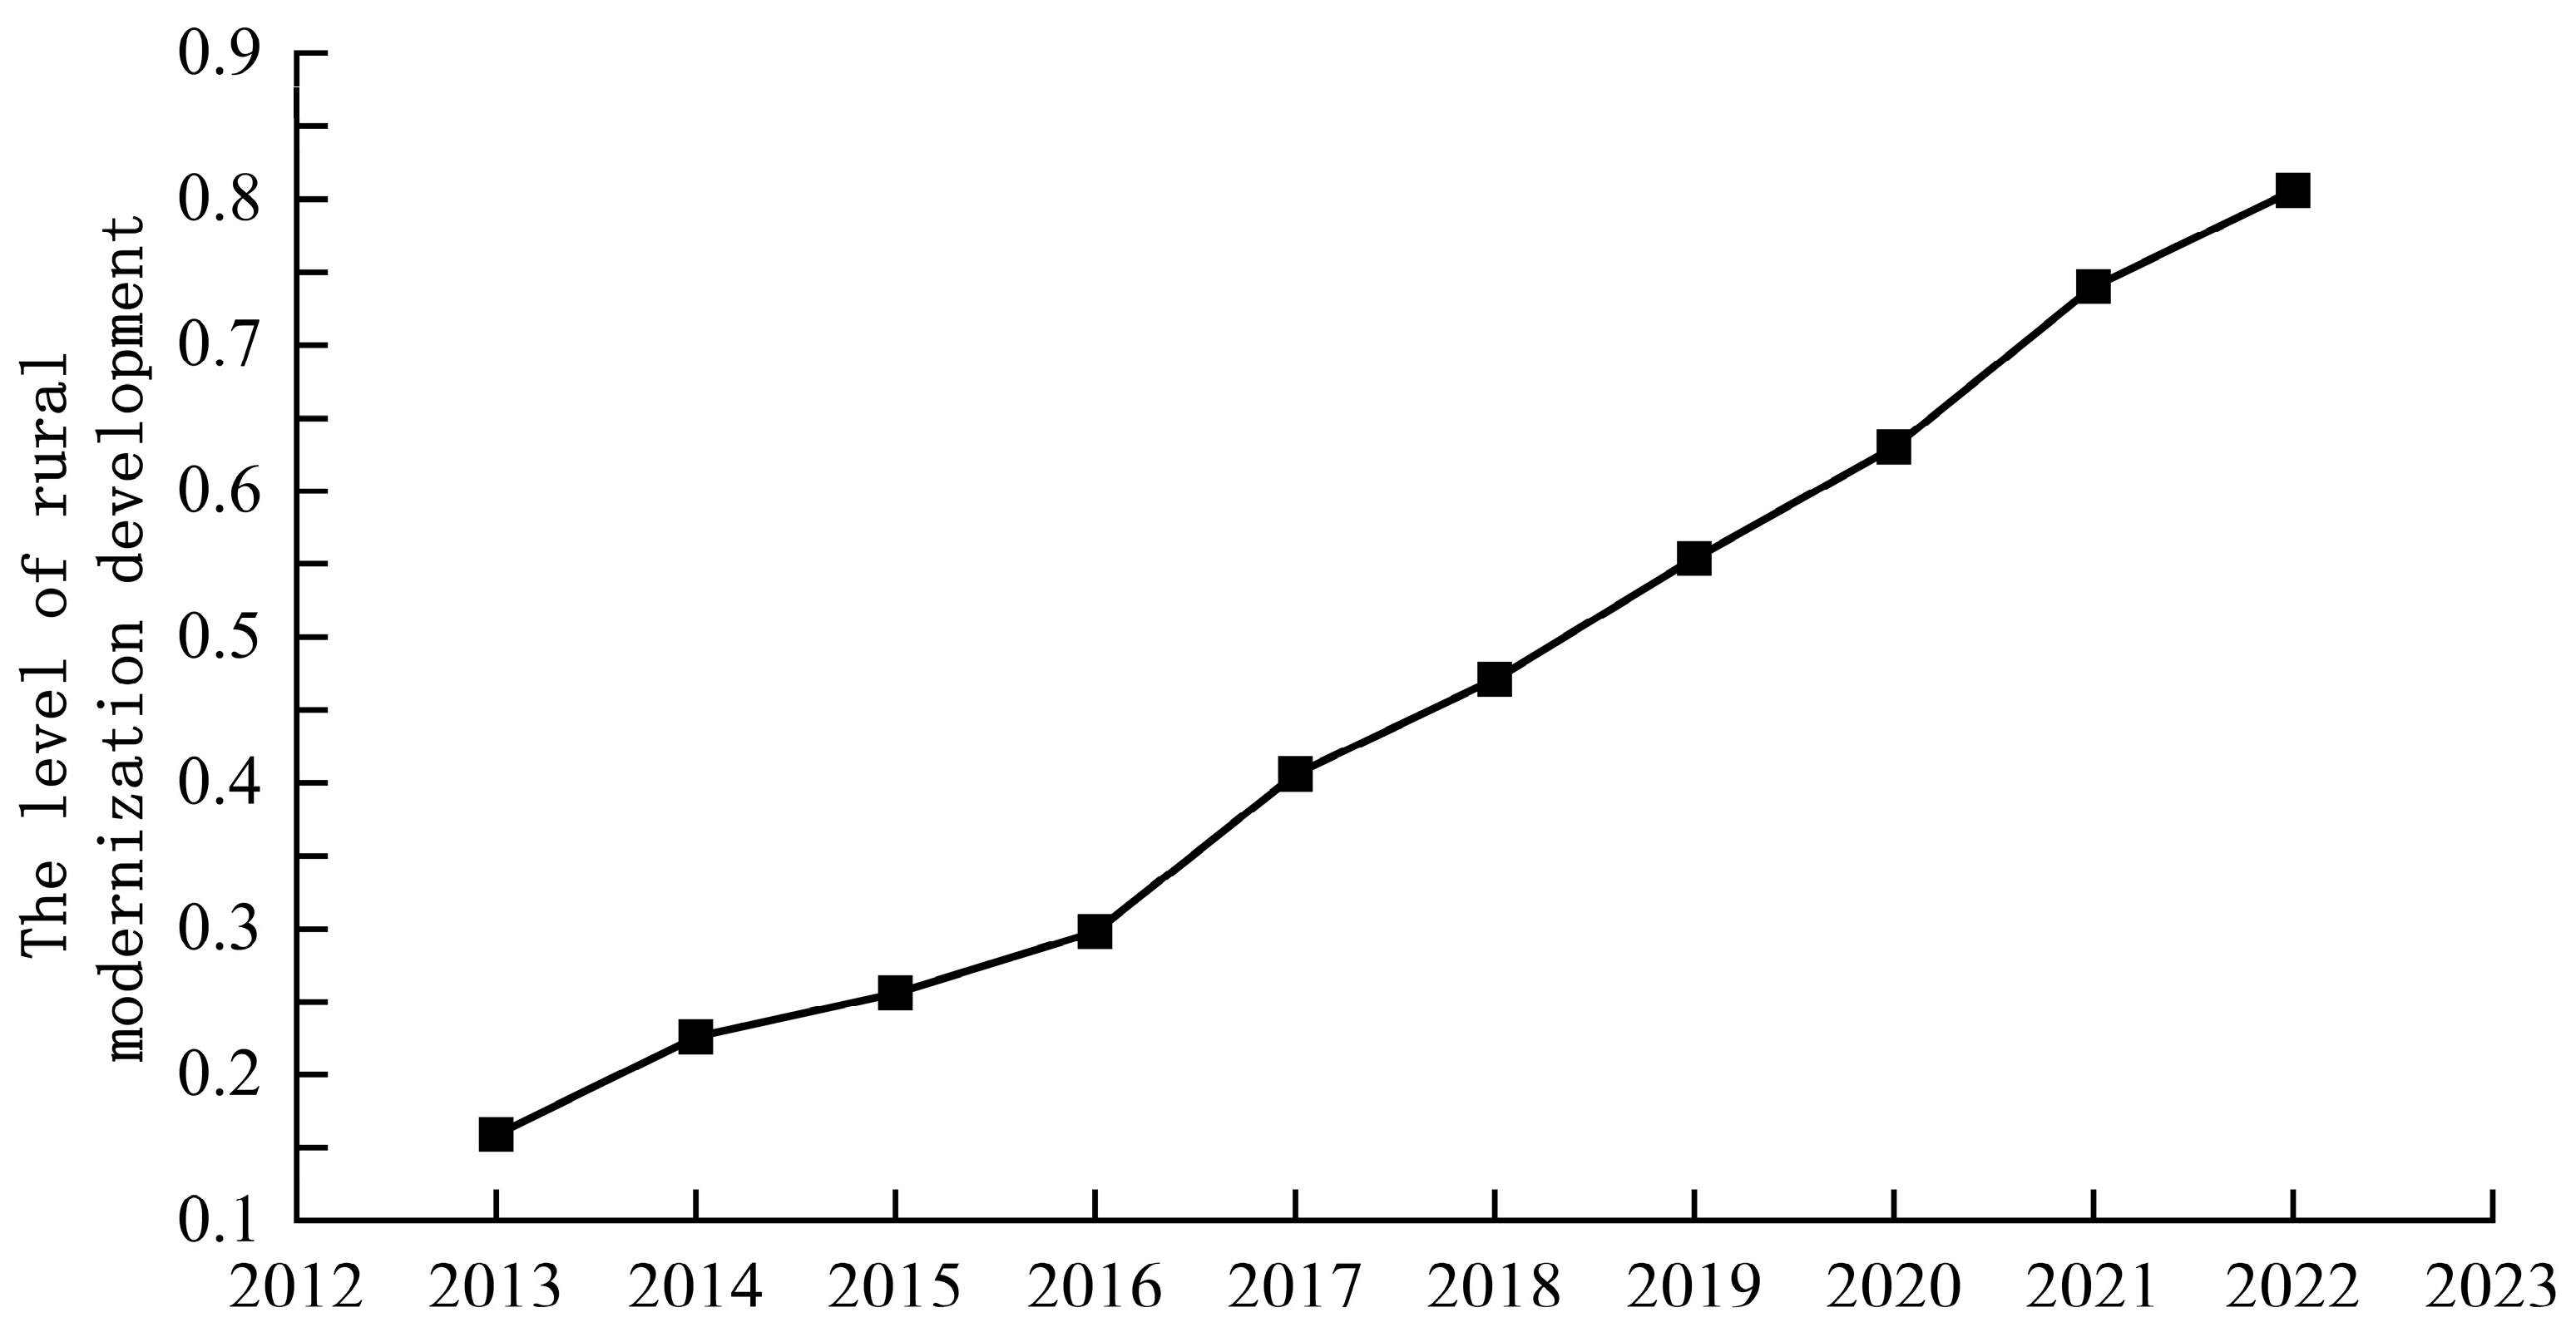
Based on the weighted evaluation indicators, the total index of rural modernization development from 2013 to 2022 was calculated using the entropy method, and the corresponding annual growth rates were determined (Figure 1). The findings suggest a steady upward trend in China’s rural modernization level, which rose from 0.159 in 2013 to 0.806 in 2022, at an average annual growth rate of 20.2%. Notably, the period from 2017 to 2022 witnessed a more rapid increase in rural modernization levels compared to the earlier years. This acceleration can be attributed primarily to the execution of the Rural Revitalization Strategy, which integrates agricultural and rural development plans, focuses on “Three rural challenges” (agriculture, rural development, and farmers), deepens rural reforms, and provides robust policy.

Figure 1.
National rural modernization development level from 2013 to 2022.
3.1.2. The Characteristics of Classification for China’s Rural Modernization Development Level
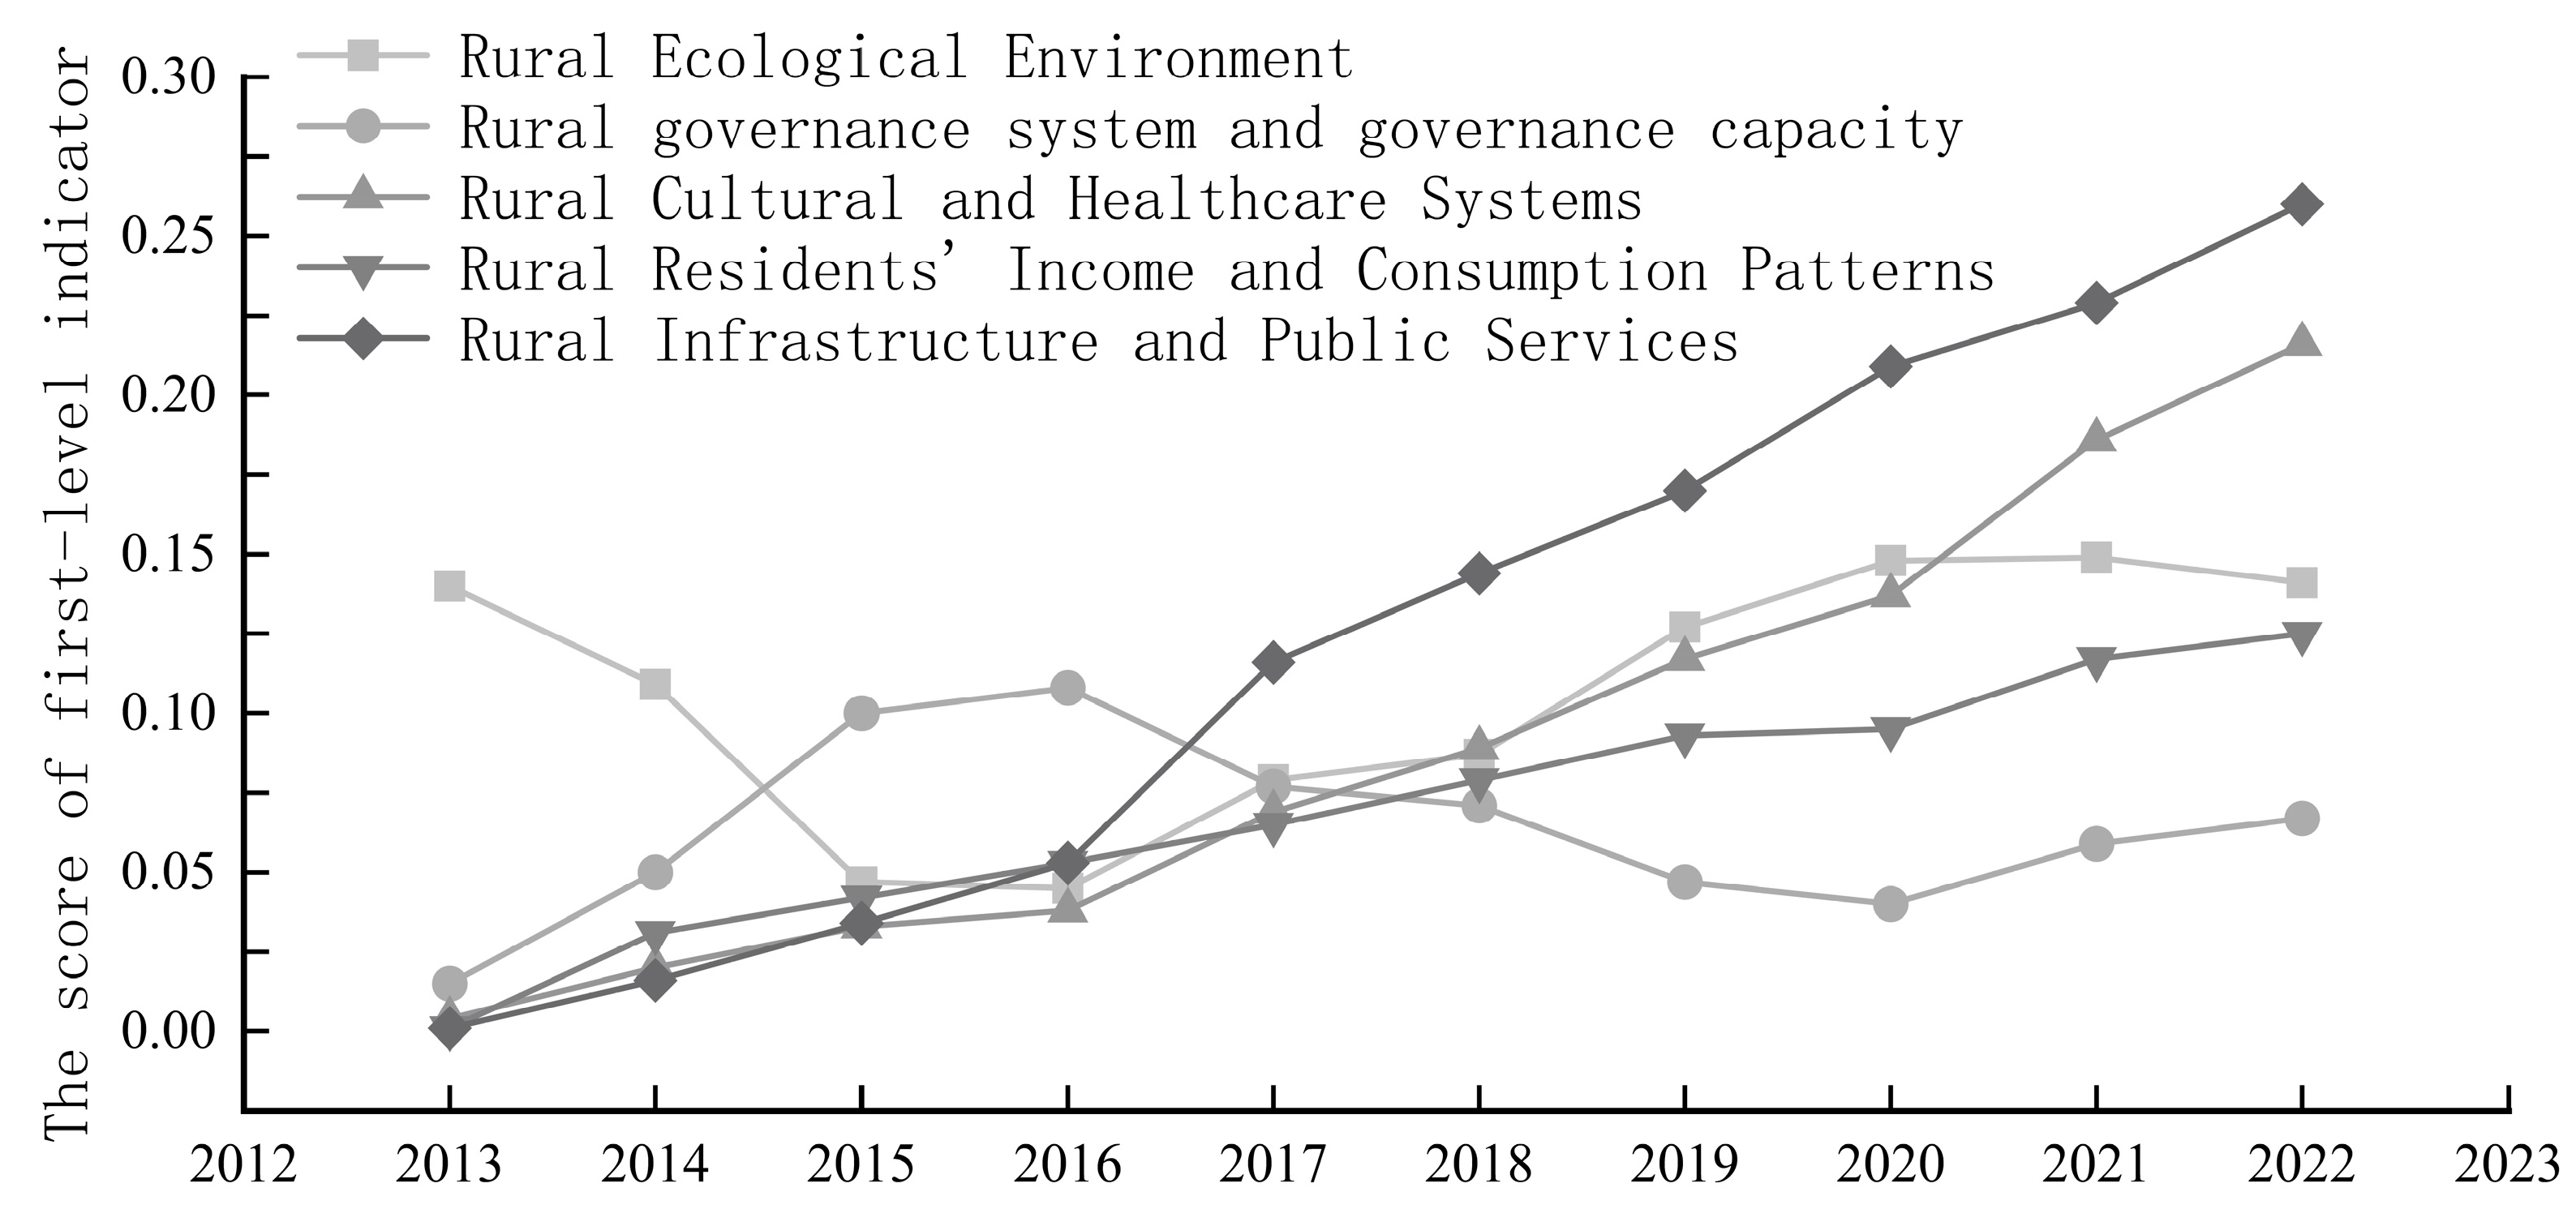
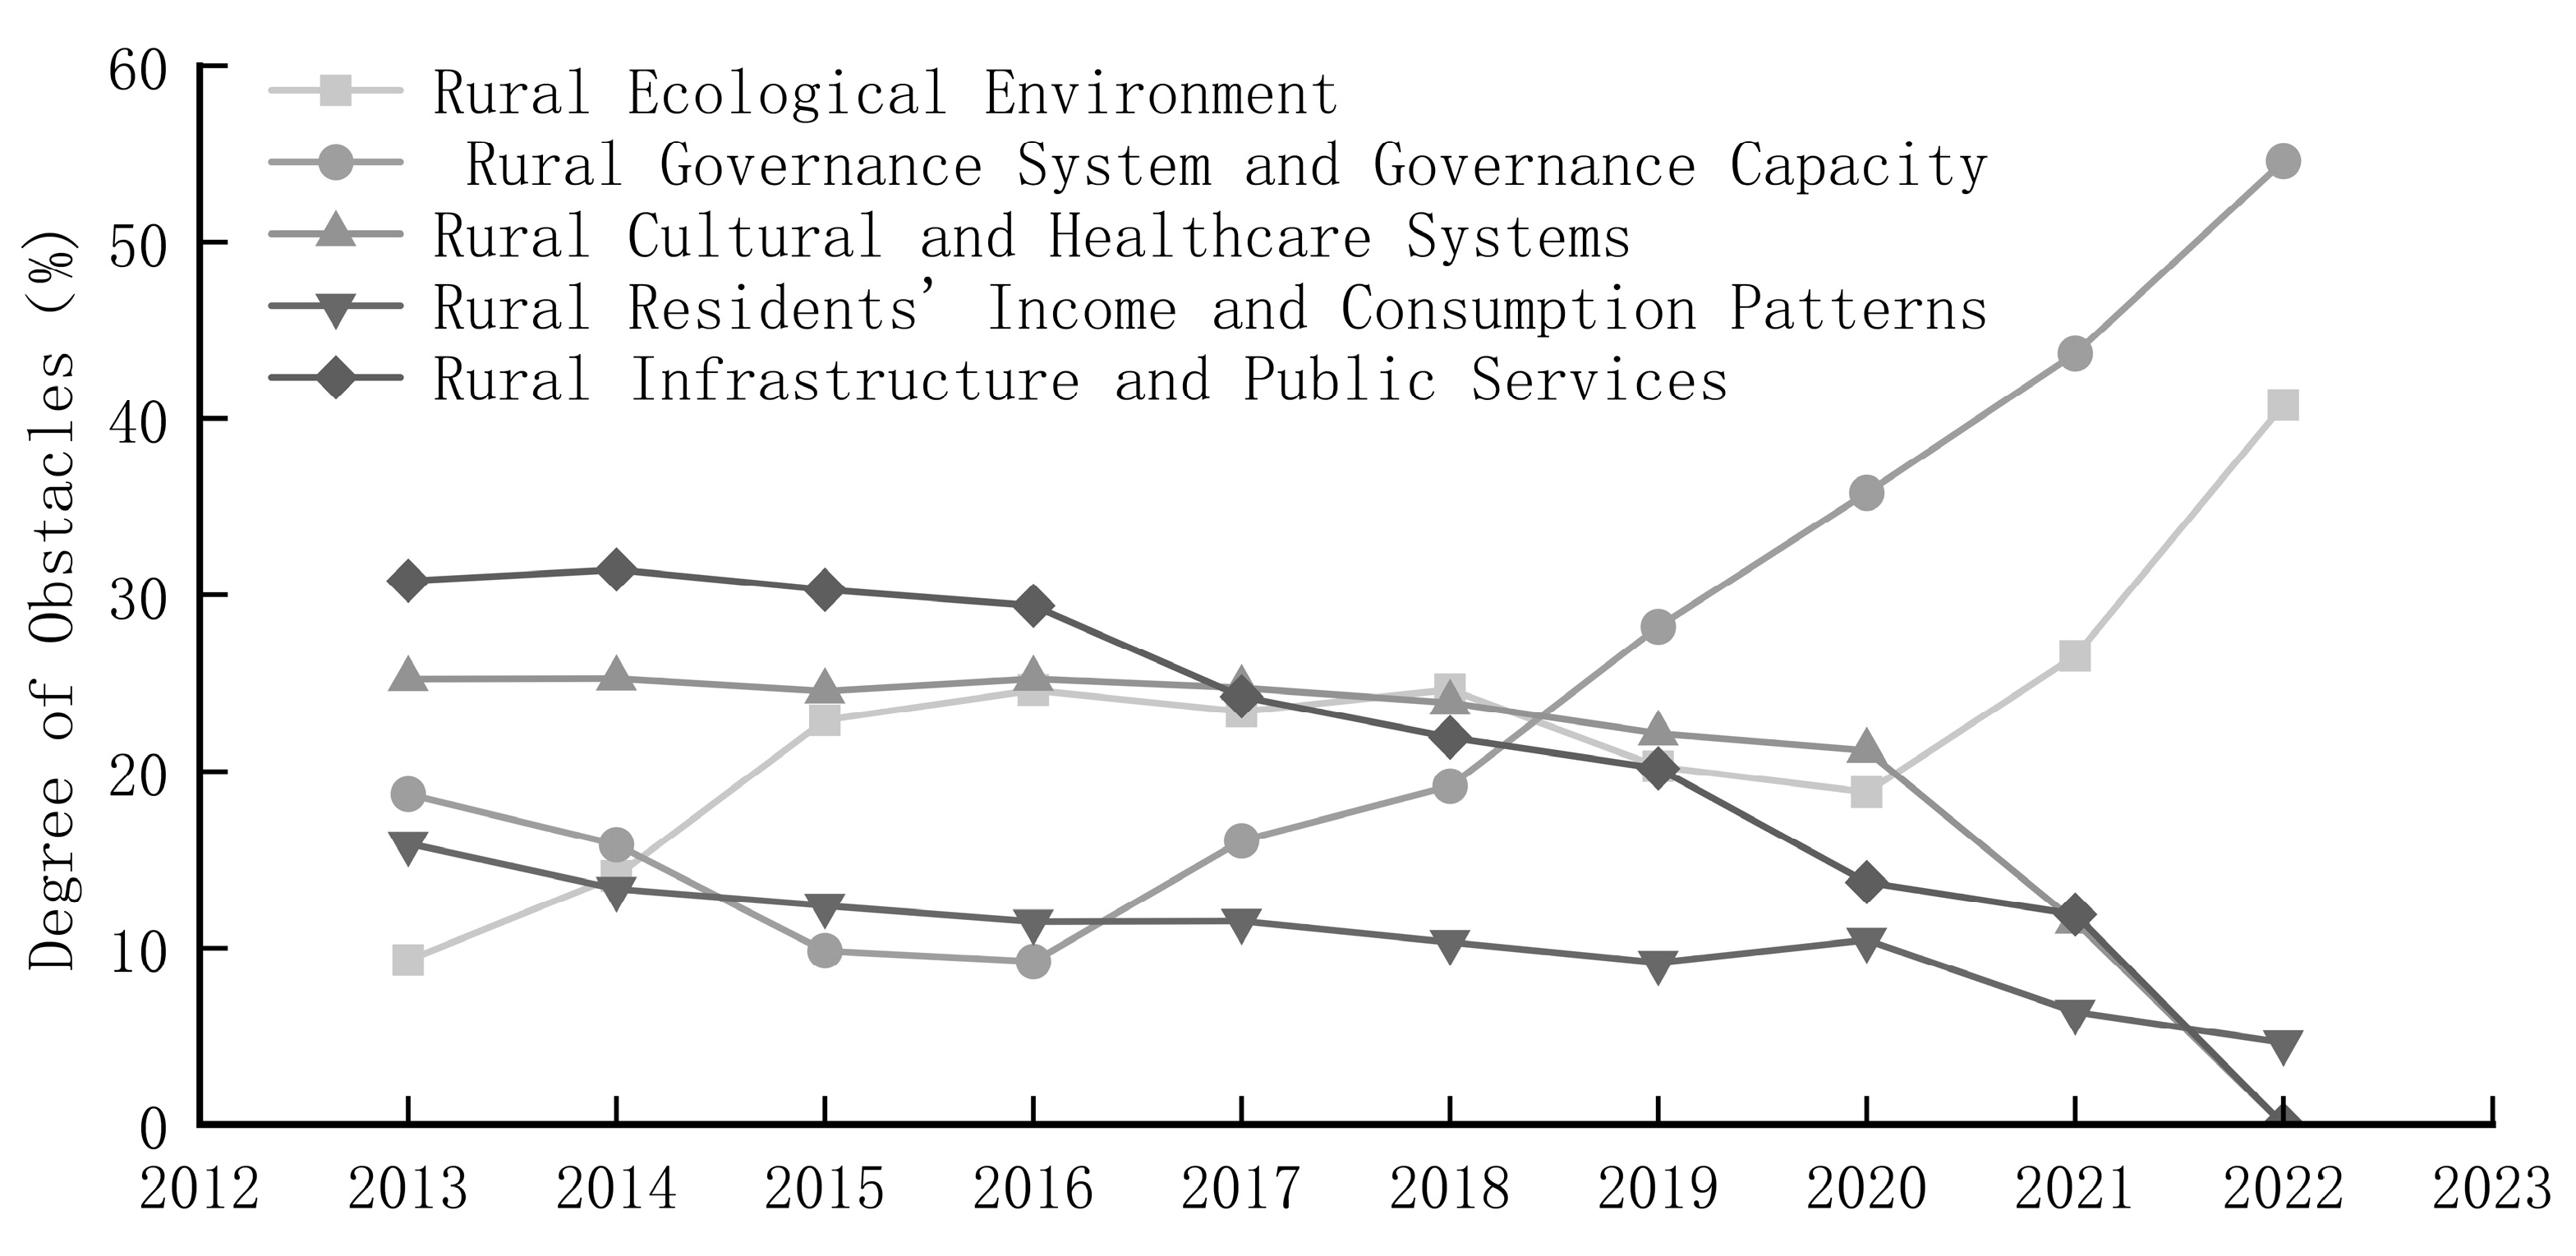
Under the framework of guideline-level analysis (Figure 2), China’s rural modernization dimensions exhibit an overall fluctuating upward trend between 2013 and 2022. Notably, the most significant increase is observed in infrastructure and public service modernization, with its index rising from 0.001 in 2013 to 0.26 in 2022. This substantial growth fully reflects the government’s strong emphasis on rural infrastructure and public services throughout the 13th Five-Year Plan, as well as the remarkable achievements attained through continuous reform deepening and policy support. The modernization of governance systems and their capacities follows a trajectory of initial rise followed by decline, characterized by significant fluctuations. Between 2013 and 2016, the index surged by 575%, increasing from 0.008 to 0.054, primarily driven by the policy dividends of land transfer system reforms, such as ownership confirmation, certificate issuance, and service platform construction, which effectively enhanced grassroots governance efficiency and propelled rapid short-term development of governance capacity. However, from 2017 to 2022, the index cumulatively declined by 42%, likely due to the governance system’s inability to adapt to profound changes in the rural social structure amid accelerated urban-rural factor mobility. Institutional frictions between the administratively dominated governance model and market-oriented infrastructure inputs weakened governance effectiveness. By 2022, with the advent of digital transformation and the construction of a governance community, the precision of rural governance improved, and the index shows signs of rebounding. In contrast, cultural and medical modernization, as well as farmers’ income and consumption modernization, develop more steadily, demonstrating a sustained upward trend. This reflects the gradual improvement in cultural and medical penetration and socioeconomic levels in rural areas of China. However, the fluctuating effectiveness of reforms aimed at modernizing the governance system and governance capacity has imposed certain constraints on overall coordinated development. The modernization of the rural ecological environment has seen the least improvement, with the index increasing only slightly from 0.139 in 2013 to 0.14 in 2022, representing a mere 0.01 increase over ten years. This stagnation is attributed to the excessive use of pesticides and chemical fertilizers, as well as weak environmental awareness. This trend highlights the importance and urgency of promoting green and sustainable development in rural modernization and underscores the need for more targeted ecological protection policies and environmental governance measures in the future to drive the in-depth development of rural ecological modernization.
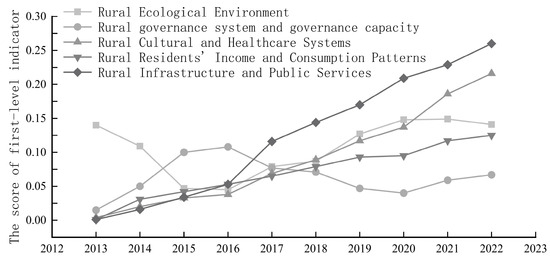
Figure 2.
Classification development level of rural modernization in China from 2013 to 2022.
3.1.3. The Internal Structure of Regional Rural Modernization Development Level
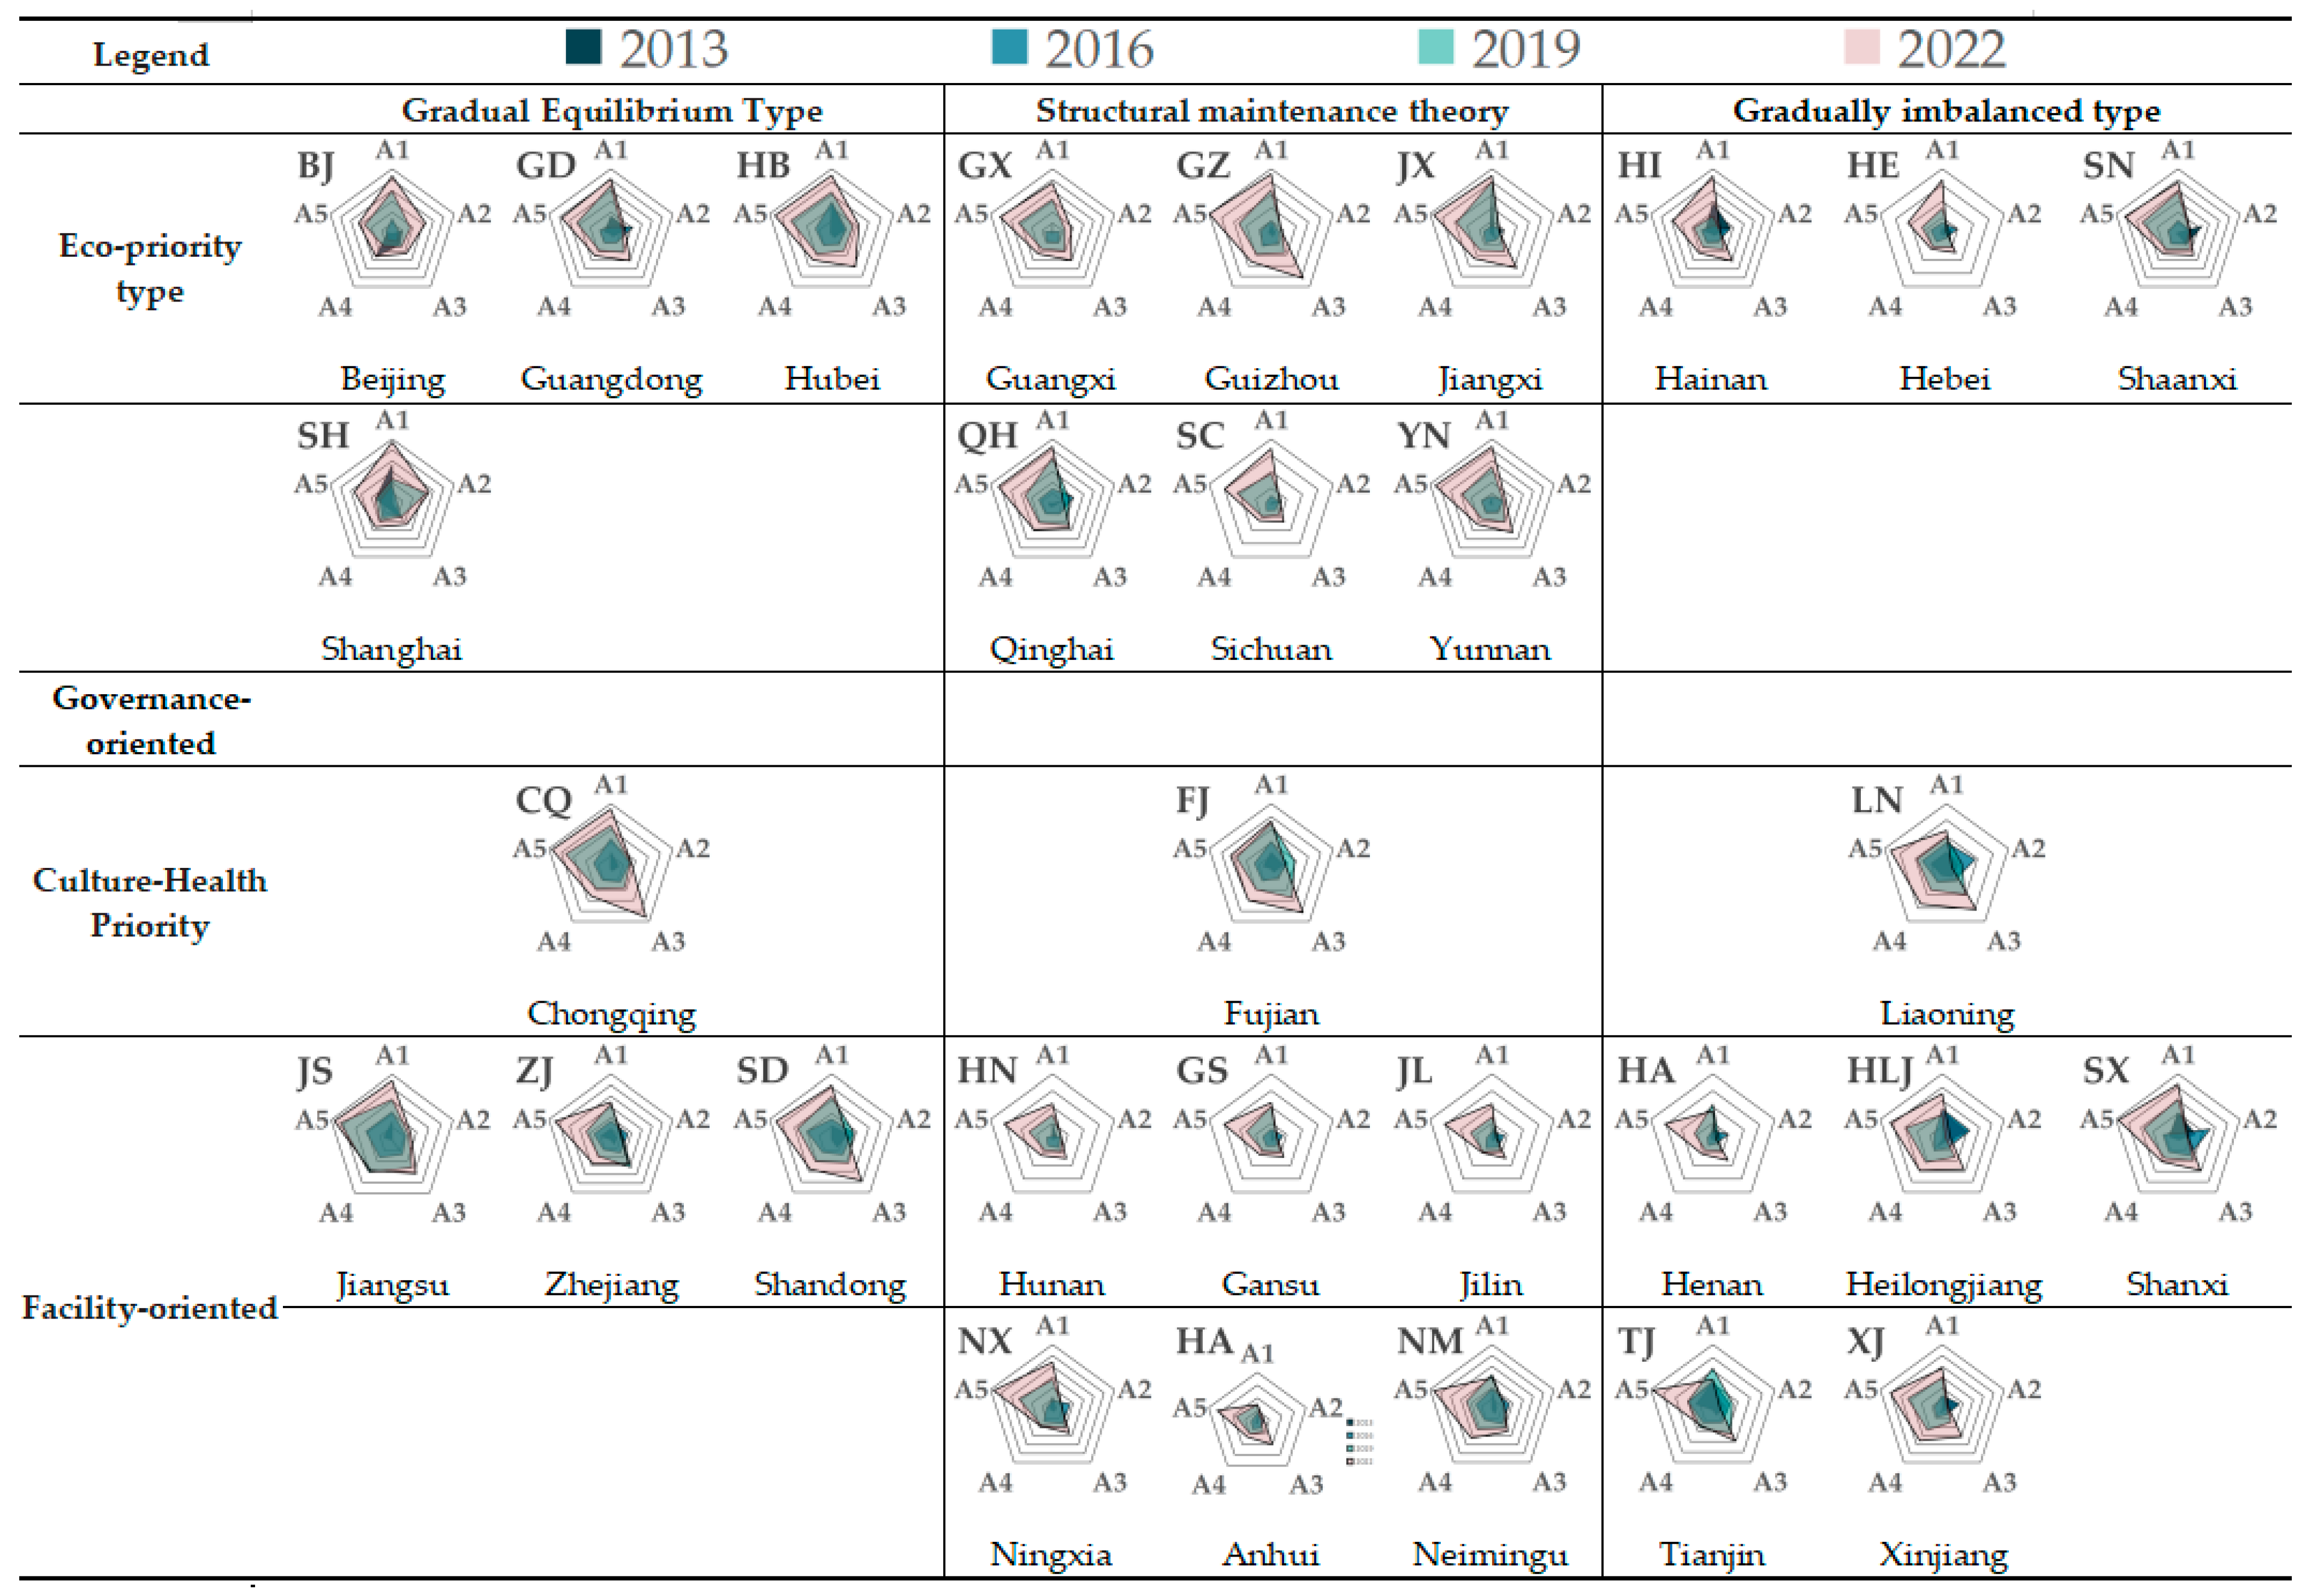
In order to deeply analyze the intrinsic structure of China’s rural modernization and its evolution law, this study selected provincial data from 2013, 2016, 2019, and 2022. A time series analysis method was employed to overlay the hierarchy of the regional development structure (Figure 3). The development types of rural modernization in each province were systematically classified across both horizontal and vertical dimensions, aiming to precisely identify the strengths and weaknesses of each province in agricultural and rural development and to uncover their underlying internal logic.
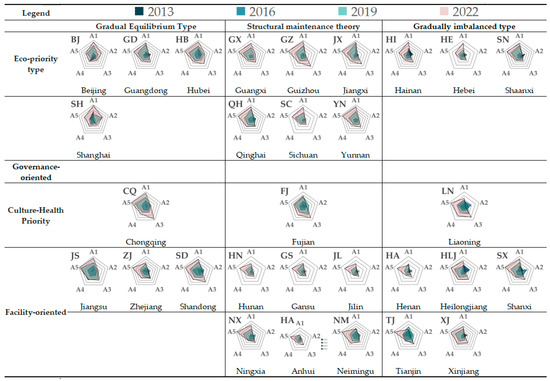
Figure 3.
Distribution of rural modernization structure in China ’s provinces. Note: A1, A2, A3, A4, and A5, respectively, represent the following subsystems: rural ecological environment modernization, rural governance system and capacity modernization, rural cultural and medical modernization, rural residents’ income and consumption modernization, and rural infrastructure and public service modernization.
The classification of vertical dimensions employs time-series data to track the dynamic changes in the development structure of each province, categorizing them into three types: gradually balanced, structurally sustained, and progressively imbalanced. Gradually balanced provinces are characterized by synchronized growth across three or more dimensions, indicating coordination and complementarity among various elements. Structurally sustained provinces exhibit continuous enhancement in one or two dimensions, while others remain stable or grow slowly, reflecting persistent strengths alongside enduring weaknesses in certain areas. Progressively imbalanced provinces experience a shift from balanced development to the prominence or decline of a single dimension, often triggered by external shocks, resource reallocation, or policy adjustments. From the longitudinal time-tracking analysis results, eight provinces (autonomous regions and municipalities), including Beijing, Chongqing, and Jiangsu, account for 27% of the total. These regions demonstrate coordinated and synchronized development across multiple dimensions of rural modernization and are gradually transitioning toward diversified development. Thirteen provinces (autonomous regions and municipalities), such as Guangxi, Fujian, and Anhui, are classified as structurally sustained, accounting for 43% of the total. These provinces exhibit clear advantages in certain key areas but also reveal deficiencies in others, reflecting a coexistence of strengths and weaknesses. Nine provinces (autonomous regions and municipalities), including Hainan, Liaoning, and Henan, show signs of progressive imbalance, suggesting that these areas have yet to establish a stable development advantage during the modernization process and are currently undergoing exploratory transitions from equilibrium to the dominance or decline of a single dimension.
In the horizontal dimension, based on the indicator system, provinces are categorized into four types: ecological priority, governance priority, cultural and medical priority, and economic priority. The cultural and medical priority focuses on “Rural Culture and Healthcare”, demonstrating leadership in cultural heritage preservation, public cultural services, and healthcare modernization. The Economic Priority integrates “Rural Residents’ Income and Consumption” with “Rural Infrastructure and Public Services,” reflecting comprehensive advantages in increasing farmers’ income, promoting consumption, and improving infrastructure. From the perspective of horizontal development types, 13 provinces (autonomous regions and municipalities), including Beijing, Guangxi, and Hainan, are classified as ecological priority types. These regions build a model of harmonious human–nature development by leveraging abundant natural resources to promote ecological agriculture, circular economy, and rural eco-tourism. However, no region stands out nationwide in terms of governance dimensions, indicating that the modernization of the rural governance system and governance capacity remains a common weak link requiring urgent strengthening. Three provinces (autonomous regions and municipalities), including Chongqing, Fujian, and Liaoning, are categorized as cultural and medical priority types. These regions promote rural cultural revitalization and health improvements through increased investment in public culture and healthcare but may lag relatively in ecological protection and economic growth. Fourteen provinces (autonomous regions and municipalities), including Jiangsu, Hunan, and Henan, belong to the economic priority type. These regions rely on industrial development, rural tourism, and new agricultural management entities to drive rapid rural economic growth and continuously enhance hardware support capabilities through infrastructure construction.
Generally speaking, the development of rural modernization across all provinces and regions in China exhibits characteristics of unbalanced and classified development. Most regions steadily advance based on their inherent advantages. Economically developed regions, such as Beijing and Shanghai, have entered the stage of comprehensive development. However, some regions have yet to clarify their own strengths and urgently require policy guidance and optimal resource allocation to achieve balanced and coordinated regional development.
3.2. Spatial Autocorrelation Analysis of Rural Modernization Development Level
3.2.1. Spatial Heterogeneity Characteristics
To explore the spatial distribution characteristics of China’s rural modernization development, this study employed the ArcGIS 10.8 software to classify the level of rural modernization development into six grades using the natural breaks method: significantly high, high, medium-high, medium-low, low, and significantly low. This classification ensures that the between-group variance is maximized, while the within-group variance is minimized, thereby enabling spatial visualization and analysis (Figure 4).
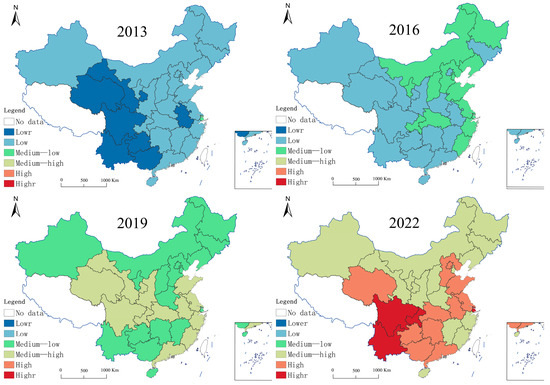
Figure 4.
Spatial distribution of rural modernization development level in 2013, 2016, 2019, and 2022.
The study’s results reveal that the development level of rural modernization in China exhibits significant regional disparities, with its spatial evolution characterized by two distinct phases: “diffusion” and “transfer”. From 2013 to 2019, the diffusion phase is marked by a gradient spread of rural modernization from the eastern coastal regions to the western areas. During this period, the eastern coastal region, leveraging its well-developed infrastructure, robust industrial foundation, and highly concentrated innovation factors, facilitated the spillover of modernization elements to neighboring regions through transportation networks and information technology. This process effectively narrowed the modernization gap in the central region. After 2019, the evolution transitions into the transfer phase, during which high levels of rural modernization shift from the eastern coastal region to the southwestern region. The rapid rise of the southwestern region can be attributed to breakthroughs in institutional innovation, policy exploration in urban–rural integration pilot zones, and the synergistic effects of collective economic reform and the integration of primary, secondary, and tertiary industries. These factors have not only optimized the flow environment for resources but also promoted the market transformation of ecological resource values, fostering the development of compound business models such as characteristic agriculture and rural tourism. Consequently, the modernization gap between the southwestern region and leading areas has narrowed, showing a catching-up trend.
In contrast, the northwest and northeast regions lag significantly in their rural modernization processes, failing to match the growth rates observed in the eastern coastal and southwestern regions. This imbalance leads to an uneven overall spatial distribution. The northwest region faces constraints due to natural geographical conditions, transportation bottlenecks, and market segmentation, which increase the costs of factor mobility and result in a dissipative effect on policy transmission, thereby inhibiting the momentum of rural economic development. Meanwhile, the northeast region, long reliant on a resource-based economy, experiences slow industrial transformation compounded by severe population loss, further weakening its endogenous development momentum for modernization. As a result, these two regions have gradually formed “development depressions” in the modernization process, widening the gap with other regions.
3.2.2. Spatial Agglomeration Characteristics
To further reveal the spatial clustering characteristics of rural modernization in China, this study calculated the GMI (Table 2) for the national rural modernization development level in 2013, 2016, 2019, and 2022. The results indicate that the GMI remains consistently positive and passes the test at the 5% significance level, suggesting a significant positive spatial correlation at the level of rural modernization. Specifically, high-level regions exhibit pronounced geographical agglomeration characteristics. Notably, the GMI follows a “U”-shaped trend: it peaks at 0.1935 in 2013, gradually declines to 0.1324 in 2019 (a decrease of 31.58%), and subsequently rebounds to 0.1609 in 2022. This trend is closely linked to the evolution of spatial differentiation patterns. During the 2013–2019 period, continuous efforts by the state to promote rural modernization policies, coupled with strategies for regional coordinated development, diversified industrial layouts, and factor agglomeration effects, effectively narrowed inter-regional development gaps, thereby weakening spatial agglomeration effects. However, since 2019, the rapid rise in rural modernization levels in the southwestern region, juxtaposed with relatively sluggish growth in the northwestern and northeastern regions, has re-strengthened the spatial agglomeration effect of high-level regions, driving the Moran’s I index upward.
Table 2.
GMI of China’s rural modernization development level in 2013–2022.
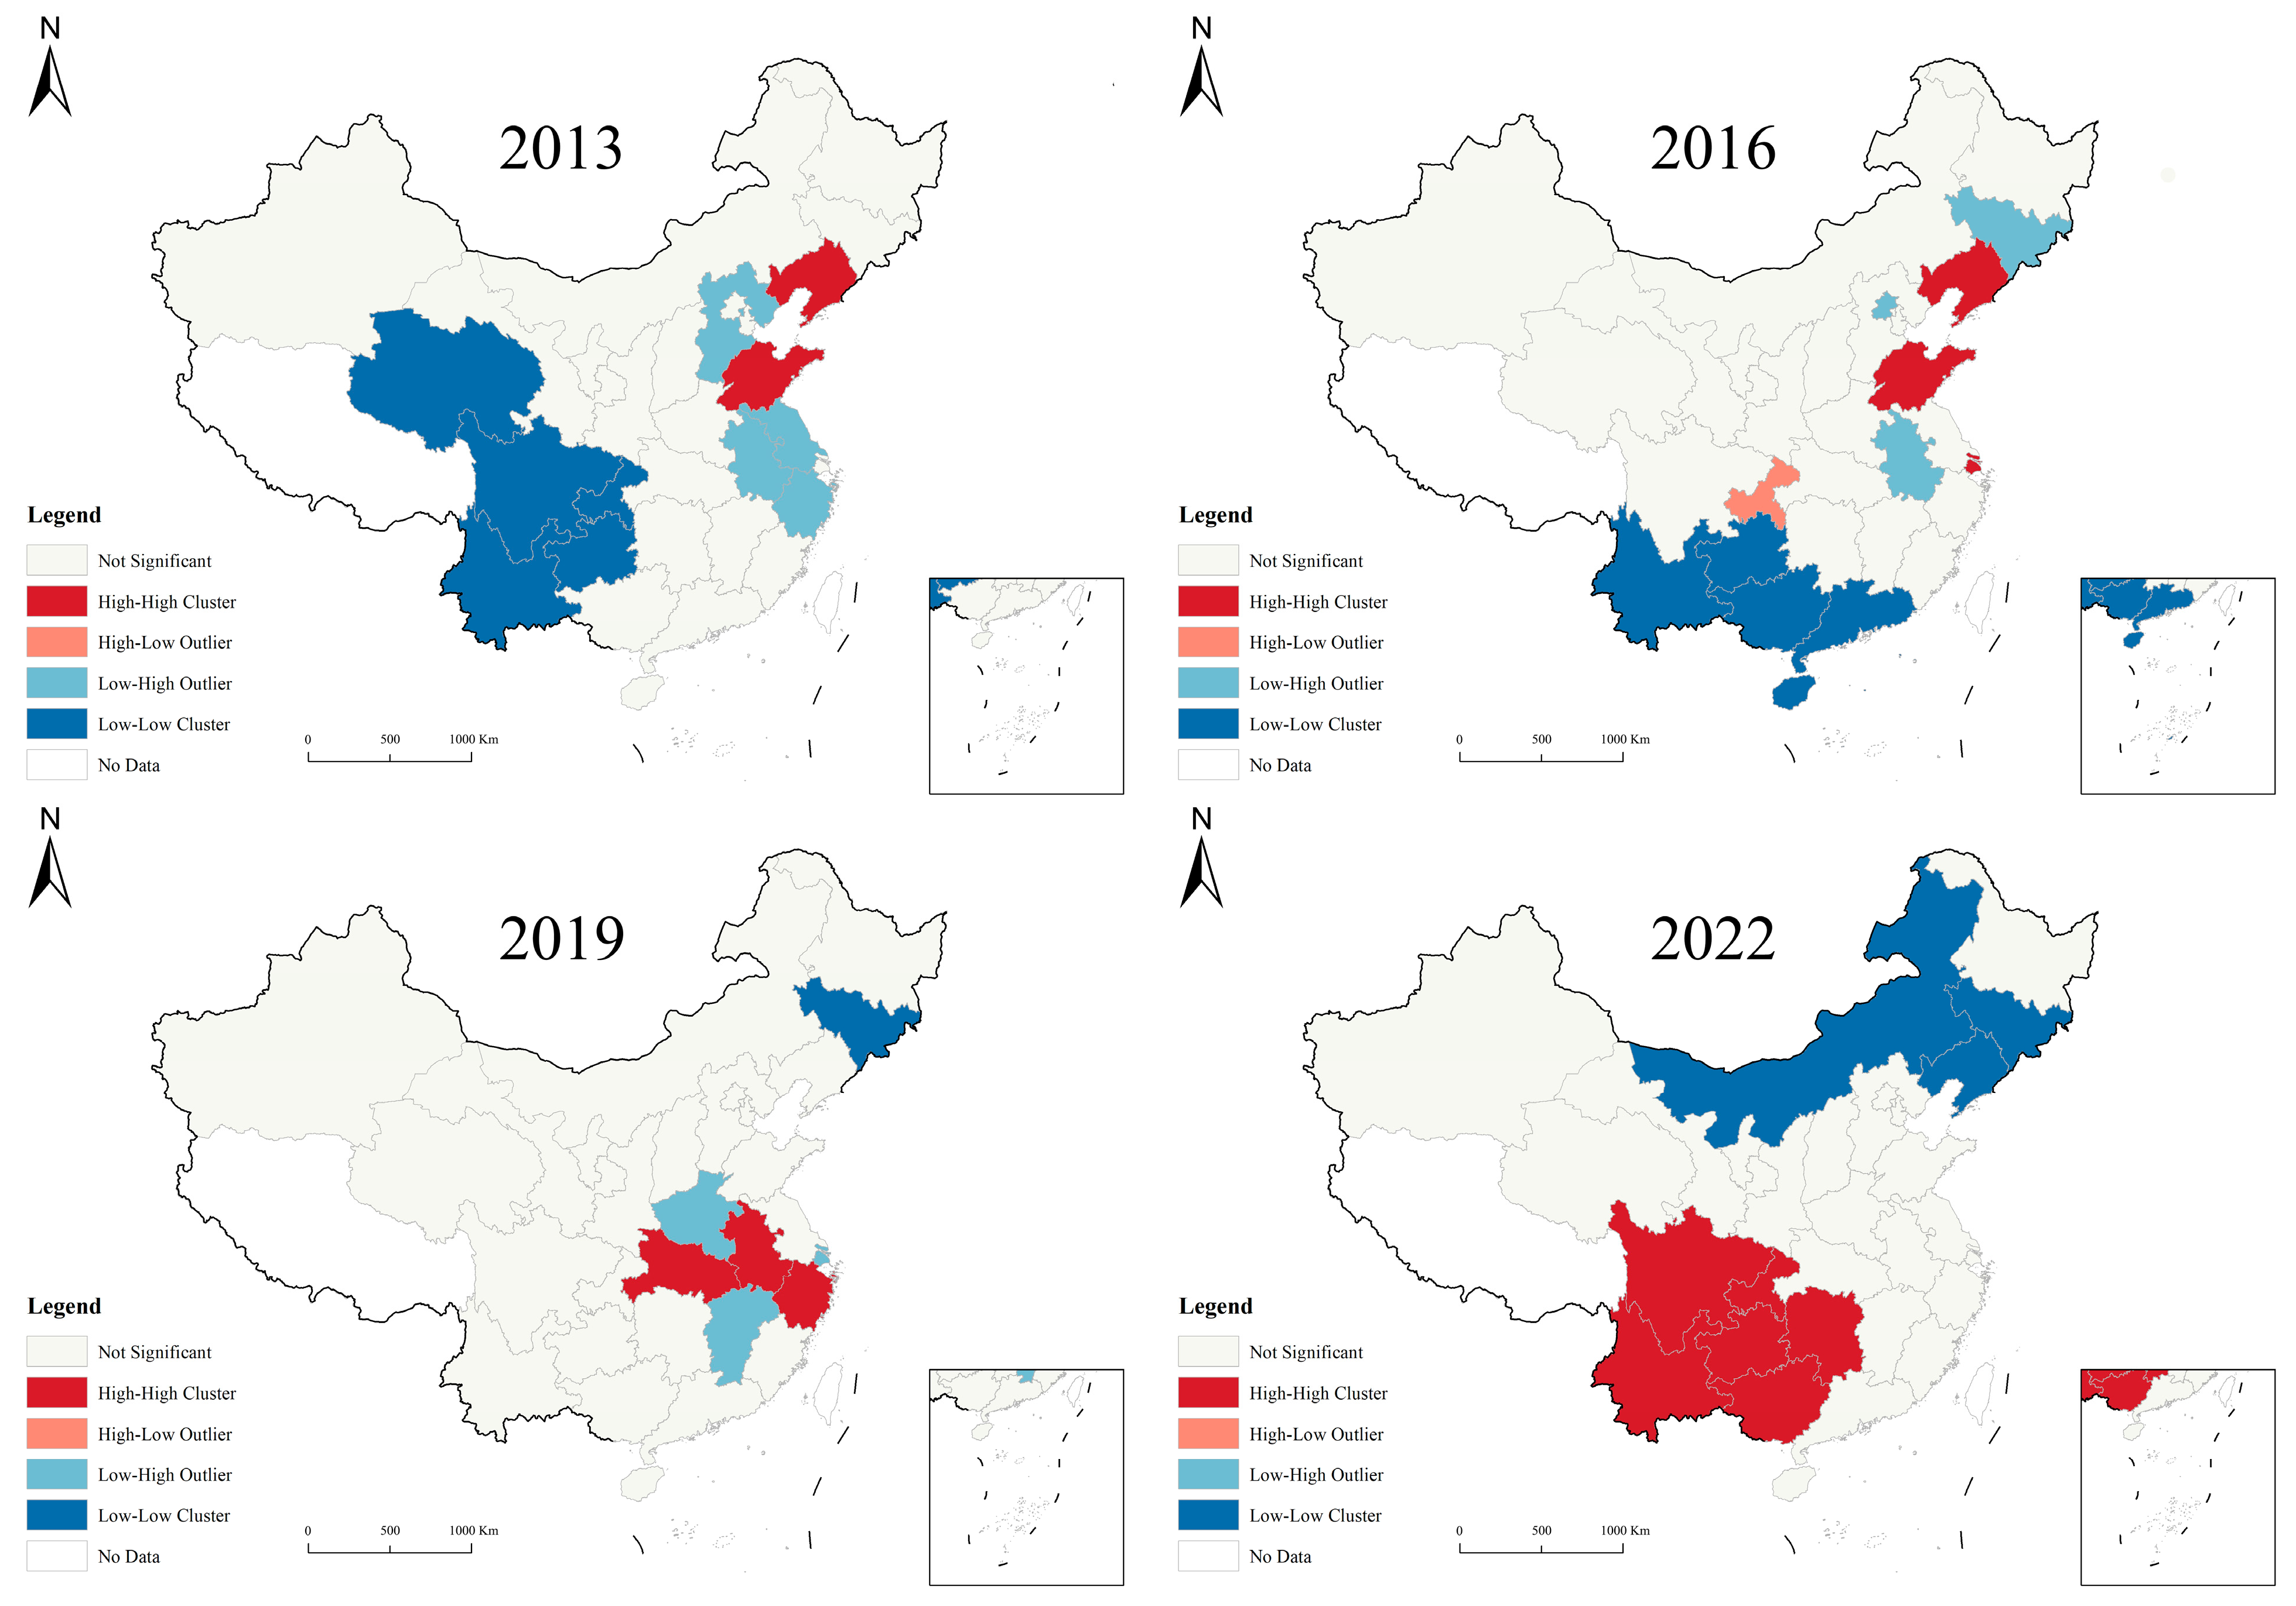
Although the GMI can reveal overall spatial agglomeration characteristics, it is incapable of identifying specific interactions among provinces. Therefore, this study further calculated the LMI and integrated Moran scatterplot analysis with LISA to explore the types of local spatial agglomeration and anomalies (Figure 5). Based on spatial correlation, local agglomeration patterns can be categorized into four types: (1) the “High–High Agglomeration” type, where provinces with a higher level of rural modernization are surrounded by similarly high-level peripheral areas; (2) the “Low–Low Aggregation” type, indicating that provinces with lower levels of modernization and their neighboring provinces form a cluster of low development; (3) the “High–Low Agglomeration” type, characterized by polarization, where high-level provinces are surrounded by low-level ones; and (4) the “Low–High Agglomeration” type, where low-level provinces are encircled by high-level provinces, forming a “hollowing-out” pattern.
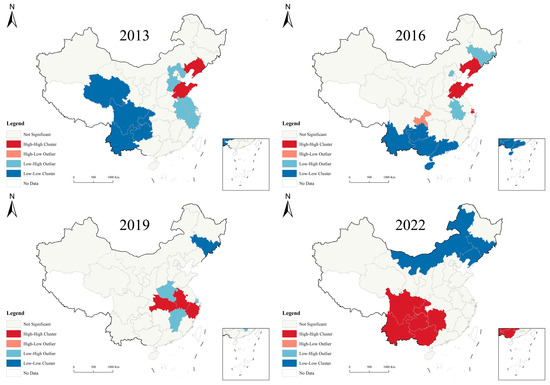
Figure 5.
Moran scatterplot–LISA distribution maps for rural modernization development levels in 2013, 2016, 2019, and 2020.
As shown in Figure 4, the “High–High Concentration” feature of China’s rural modernization is primarily distributed in the eastern coastal and southwestern regions, with a tendency to shift from the eastern coastal areas to the southwestern regions. In 2013, eastern coastal provinces such as Shanghai and Jiangsu dominated; however, with the rise in southwestern provinces like Chongqing and Sichuan, these regions are gradually becoming new highlands of rural modernization. This trend indicates that the level of rural modernization development is closely linked to local economic development. In the eastern part of the country, the continuous transfer of rural labor to the secondary and tertiary industries, along with the accelerated process of urban–rural economic integration, has led to a relative slowdown in the momentum of rural modernization. In contrast, the southwestern region, leveraging institutional innovation and resource advantages, has been catching up as latecomers.
The “Low–Low Agglomeration” type is mainly distributed in the western and northeastern regions, showing a trend of shifting from south to north. Despite abundant land resources and a strong traditional industrial base, the Northeast region has long relied on a resource-based economic model, revealing the “resource curse” effect and severely hindering sustainable economic development. In contrast, the southwestern region, supported by the rural revitalization strategy and regional coordinated development policies, has gradually broken through the “Low–Low Agglomeration” dilemma by narrowing the income gap between urban and rural areas and accelerating the layout of new industries. In this process, the synergy between institutional dividends and innovation-driven growth has played a key role.
The “High–Low Agglomeration” and “Low–High Agglomeration” types are mainly distributed in the central region. These regions generally suffer from unbalanced interregional factor flows and weak synergistic mechanisms, resulting in limited radiation capabilities of high-level regions to neighboring low-level regions and difficulties for low-level regions in effectively absorbing spillover effects from high-end factors. This regional imbalance has exacerbated the fragmentation of the rural modernization process and become a critical constraint on coordinated development.
3.3. Factors Hindering the Development of Rural Modernization
3.3.1. Fractal Dimension Barrier Analysis
Using the ODM, a quantitative analysis was conducted on the obstacle degree of China’s rural modernization criteria layer from 2013 to 2022. The results indicate that the average obstacle degrees, in descending order, are as follows: rural governance system and capacity modernization (25.12%) > ecological environment modernization (22.54%) > infrastructure and public service modernization (18.96%) > cultural and medical modernization (17.32%) > income and consumption modernization of residents (16.06%) (Figure 6).
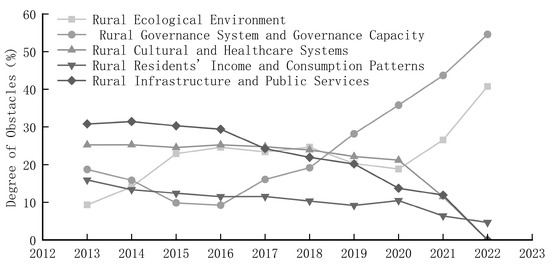
Figure 6.
Obstacles of each dimension of national rural modernization from 2013 to 2022.
Among these factors, the modernization of the rural governance system and its capacity was identified as the main obstacle, with an average obstacle degree of 25.12%, showing a significant upward trend from 18.71% in 2013 to 54.59% in 2022. This increase can be attributed to the lagging development of rural public services and the constraints imposed by the urban–rural dual structure, which hindered the equitable exchange of resources and fair distribution of benefits, leading to an unsynchronized level of public services relative to economic growth.
Secondly, ecological environment modernization posed a secondary obstacle, with an average obstacle degree of 22.54%, increasing from 9.31% in 2013 to 40.78% in 2022. This rise is primarily due to excessive use of fertilizers in agriculture, inadequate wastewater treatment facilities, and inefficient household waste management.
Conversely, the obstacle degrees for cultural and medical modernization, resident income and consumption modernization, and infrastructure and public service modernization have shown a decreasing trend over the years. This progress is due to the execution of the 14th Five-Year Plan and the rural revitalization strategy, which led to increased government investment in infrastructure, promotion of public service and cultural–medical modernization, and significant achievements in poverty alleviation, ultimately achieving the elimination of absolute poverty. According to the National Statistical Yearbook data, in 2022, the number of healthcare professionals per 10,000 rural residents increased to 66, representing an 83.3% increase; the per capita disposable income of rural residents increased to CNY 23,028, an increase of CNY 10,703.2 compared to 2013.
3.3.2. Analysis of Major Barriers
To thoroughly analyze the impact of specific indicators on rural modernization and their limitation degrees, this study selected the top six obstacle degree indicators from 2013, 2016, 2019, and 2022 for detailed examination (Table 3). The results indicate that, during the period from 2013 to 2022, several key indicators had an obstacle degree exceeding 8%, becoming significant long-term constraints on rural modernization. These include the percentage of administrative villages, the proportion of rural areas with overall planning, pesticide and fertilizer use, village greening rate, healthcare professionals per thousand rural population, average years of education in rural areas, hardened road coverage rate, and rural gas penetration rate.
Table 3.
Main obstacle factors and obstacle degrees of rural modernization development in 2013, 2016, 2019, and 2022.
In 2013, the obstacle degree of the proportion of rural areas with overall planning, healthcare professionals per thousand rural population, average years of education in rural areas, and hardened road coverage rate all exceeded 8%. This highlights the critical bottlenecks in planning, healthcare, education, and transportation infrastructure that hinder rural development.
By 2016, the obstacle degree of average years of education in rural areas rose to the top, reaching 10.431%, while the obstacle degree of the percentage of administrative villages and rural gas penetration rate also increased significantly to 9.241% and 8.043%. This reflects the growing prominence of challenges in education, infrastructure, and public services, with education emerging as the primary constraint on rural development.
In 2019, the lack of overall planning for rural areas again became a focal point, with the obstacle degree surging from 8.673% in 2013 to 16.282%, becoming the most significant barrier to rural modernization. The obstacle degree of administrative village proportion and village greening rate followed closely behind, while the constraints on education and healthcare professionals per thousand rural population weakened. This underscores the need to address not only education, healthcare, and infrastructure but also village greening and administrative management to promote comprehensive and coordinated rural development.
By 2022, the combined obstacle degree of the percentage of administrative villages and the proportion of rural areas with overall planning reached 53.398%, accounting for over half of the total obstacle degree. Additionally, the obstacle degree of pesticide and fertilizer use sharply increased to third place, and the issue of village greening persisted. These challenges stem from deficiencies in rural governance systems and capabilities, environmental modernization, inadequate administrative village scale, imperfect resource integration mechanisms, and excessive reliance on traditional agricultural practices, all of which severely constrain the advancement of rural modernization.
4. Conclusions and Recommendations
Based on the constructed rural modernization development indicator system, this study quantitatively evaluates the level of rural modernization in China using the entropy weight method. By integrating the natural breaks method, Moran’s I index, and other spatial autocorrelation analysis techniques, it elucidates the spatiotemporal evolution characteristics of rural modernization in China. Additionally, employing the obstacle degree model, this study identifies the critical factors constraining the progress of rural modernization. Compared to international practices, while China has achieved significant advancements in areas such as rural governance and ecological conservation, substantial room for improvement remains. Given the pronounced disparities among Chinese provinces in economic development, social structure, and cultural traditions, promoting rural modernization necessitates adopting location-specific strategies and designing regionally tailored policies and measures.
4.1. Conclusions
From the viewpoint of temporal change, during the period of 2013–2022, the development level of China’s rural modernization generally exhibits a steady increase, with an average annual growth rate of 20.2%. There is obvious heterogeneity in the growth of each dimension: infrastructure and public service modernization has achieved breakthrough progress driven by policy support and financial investment; culture and medical care, as well as residents’ income and consumption, have steadily increased. However, the modernization of the governance system and governance capacity, along with the modernization of the ecological environment, lags behind. In particular, the modernization of governance capacity shows fluctuating development characteristics, resulting in an overall imbalanced pattern characterized by “hardware ahead, software lagging behind”. This imbalance may lead to a decline in resource allocation efficiency during the rural revitalization process, thereby affecting the sustainable development of rural modernization. Additionally, the internal structure of rural modernization in most provinces exhibits an unbalanced pattern, dominated by two primary patterns: ecological priority and economic priority. That is, some dimensions develop faster, while others lag behind.
In terms of spatial patterns, the overall level of China’s rural modernization is transitioning from low to medium-high levels. The eastern coastal and southwestern regions are developing more rapidly, while the northwestern and northeastern regions lag behind, showing significant regional disparities. GMI analysis results indicate a strong positive spatial correlation in the level of rural modernization, with an overall trend of diffusion from the east to the southwest. Traditional high-level agglomeration regions (e.g., Shandong, Liaoning) have gradually shifted to the southwest (e.g., Chongqing, Sichuan), while low-level agglomeration regions are mainly concentrated in the northeast.
Regarding constraints, the modernization of the rural governance system and capacity, as well as the modernization of the ecological environment, remain the primary obstacles affecting the process of rural modernization. In contrast, the degree of obstacles for the modernization of culture and medical care, residents’ income and consumption, and infrastructure and public services shows a decreasing trend. A further analysis reveals that key indicators, such as the percentage of administrative villages, the proportion of master-planned villages, the amount of pesticide and chemical fertilizer applied, and the village greening rate, all exceed 8% over the entire observation period, making them core long-term constraints on the development of rural modernization.
4.2. Recommendations for Countermeasures
In response to the regional disparities in rural modernization and the internal development imbalances identified in the study, this paper proposes the following targeted countermeasure suggestions. The aim is to optimize resource allocation by precisely identifying the developmental obstacles and potential advantages of each region, thereby promoting rural modernization toward high-quality, coordinated, and sustainable development.
- (1)
- Innovate the grassroots governance system to enhance governance effectiveness and sustainability. Given that the modernization of governance capacity exhibits significant fluctuations during the process of rural modernization and acts as a constraint on overall development, it is necessary to optimize the grassroots governance system to improve governance effectiveness and sustainability. First, the administrative village governance system should be strengthened by formulating a standardized governance indicator system, implementing the dynamic management model of “one village, one plan,” regulating the operation of self-governing organizations such as villagers’ councils and supervisors’ councils, and incorporating governance transparency into the performance assessment system of county and township governments. Second, to address governance challenges arising from the accelerated flow of urban-rural elements, a coordinated governance framework at the county level should be constructed. This includes establishing a cross-sectoral joint law enforcement mechanism, improving the access list for rural community administrative affairs, and utilizing blockchain technology to develop a smart contract system for land transfer. These measures aim to achieve automatic certification of tenure changes and early warning of risks. Third, promote the digital transformation of governance by leveraging spatial positioning technology and IoT sensing equipment to build an intelligent monitoring system for rural governance. This system enables the real-time dynamic monitoring of infrastructure, collective assets, and the ecological environment, thereby enhancing governance accuracy and response efficiency.
- (2)
- Construct an ecological modernization compensation mechanism to break through the bottleneck of environmental governance. The progress of ecological modernization remains insufficient in promoting rural modernization, and obstacles to ecological governance are increasing, particularly the excessive use of pesticides and chemical fertilizers, which severely constrain the sustainable development of rural areas. Therefore, it is necessary to optimize the governance system for agricultural non-point source pollution and incorporate the construction of ecological civilization into the core agenda of rural modernization, thereby promoting a green and low-carbon development model. First, a quota management system for agricultural production inputs should be established using material flow analysis methods, and an agricultural subsidy policy linked to environmental quality improvement should be promoted. Second, a recycled agricultural model integrating farming and animal husbandry should be promoted, and a standardized system for the resourceful utilization of livestock and poultry manure should be established, achieving synergistic promotion of agricultural production and ecological protection. Third, local governments should be encouraged to explore carbon sink trading mechanisms and promote farmland carbon sink projects, improving the economic returns of ecological protection through market-oriented approaches.
- (3)
- Optimize the internal structure of rural modernization and promote balanced development. In response to the uneven development of the internal structure across different regions during the process of rural modernization, differentiated policies should be implemented to enhance the coordination among various dimensions of rural modernization. For structurally imbalanced regions (e.g., Hainan, Liaoning), cross-regional cooperation mechanisms should be established by leveraging local resource endowments to promote resource sharing and synergistic development. For structurally sustained regions (e.g., Guangxi, Chongqing), new technologies and industrial innovation models should be introduced while consolidating existing advantages, thereby driving upgrading and transformation through innovation. For regions trending toward a balanced development (e.g., Beijing, Fujian), the integrated development of urban and rural areas should be deepened, industrial chains should be extended, and the overall level of coordinated development should be improved.
- (4)
- Optimize the spatial layout of rural modernization and promote distinctive regional development. There are significant spatial disparities in China’s rural modernization, with the eastern coastal areas at a higher level, while the northwestern and northeastern regions lag behind in development. Therefore, a characteristic development strategy should be formulated based on the comparative advantages of each region. For the eastern coastal region, it should fully leverage its infrastructure and industrial agglomeration advantages, promote the development of new agricultural management entities, enhance the level of agricultural modernization, and strengthen ecological protection to create a livable and workable beautiful countryside. For the central region, the focus should be on promoting industrial integration, building a complete industrial chain ecosystem, and addressing the shortcomings in the ecological environment and public services. For the western region, it should capitalize on its ecological resource advantages, explore green development models, promote ecological industrialization, and foster the development of rural areas with unique characteristics, thereby driving the sustainable growth of the rural economy. For the northeastern region, it should strengthen agricultural science and technology innovation, promote the deep processing of agricultural products, and drive comprehensive rural revitalization through modern agriculture to reverse developmental challenges.
Author Contributions
Methodology, S.Z.; Software, S.Z.; Writing—original draft, S.M.; Visualization, S.M.; Supervision, M.S.; Project administration, M.S.; Funding acquisition, M.S. All authors have read and agreed to the published version of the manuscript.
Funding
This research was supported by the following funds: (1) Gansu Agricultural University, Doctoral Research Start-up Fund Project (Grant No. GAU-KYQD-2022-40),“Social Adaptation Research on Poverty Alleviation Relocation of Migrants in Cold and Arid Areas of Gansu Province”, from April 2023 to December 2026, RMB 100,000; (in progress, Principal Investigator). (2) Gansu Provincial Department of Science and Technology, Youth Project (Grant No. 23JRZA452), “Evaluation of the Effects and Path Selection for Increasing Income in Gansu Province Farmers’ Professional Cooperatives”, from June 2023 to June 2026, RMB 20,000; (in progress, Principal Investigator).
Institutional Review Board Statement
Not applicable.
Informed Consent Statement
Not applicable.
Data Availability Statement
The data utilized in this study were obtained from publicly accessible statistical publications, including the China Statistical Yearbook, China Rural Statistical Yearbook, China Urban-Rural Statistical Yearbook, China Population and Employment Statistical Yearbook, China Environmental Statistical Yearbook, and China Social Statistical Yearbook. If required, the full original dataset can be made available.
Acknowledgments
The authors would like to express their gratitude to the team members for their valuable guidance and assistance throughout the research process, which greatly contributed to the successful completion of this study.
Conflicts of Interest
The authors report no conflicts of interest. The entities that provided funding for this research did not participate in the study design, data collection, analyses, interpretation of the results, manuscript preparation, or the decision to publish the findings.
References
- Yin, X.; Chen, J.; Li, J. Rural Innovation System: Revitalize the Countryside for a Sustainable Development. J. Rural Stud. 2022, 93, 471–478. [Google Scholar] [CrossRef]
- Luo, Y.; Wu, J.; Xu, Y. Can Self-Governance Tackle the Water Commons?—Causal Evidence of the Effect of Rural Water Pollution Treatment on Farmers’ Health in China. Ecol. Econ. 2022, 198, 107471. [Google Scholar] [CrossRef]
- Han, J.; Yang, Q.; Zhang, L. What Are the Priorities for Improving the Cleanliness of Energy Consumption in Rural China? Urbanisation Advancement or Agriculture Development? Energy Sustain. Dev. 2022, 70, 106–114. [Google Scholar] [CrossRef]
- Yurui, L.; Luyin, Q.; Qianyi, W.; Karácsonyi, D. Towards the Evaluation of Rural Livability in China: Theoretical Framework and Empirical Case Study. Habitat Int. 2020, 105, 102241. [Google Scholar] [CrossRef]
- Liang, X.; Jin, X.; Han, B.; Sun, R.; Xu, W.; Li, H.; He, J.; Li, J. China’s Food Security Situation and Key Questions in the New Era: A Perspective of Farmland Protection. J. Geogr. Sci. 2022, 32, 1001–1019. [Google Scholar] [CrossRef]
- Liu, Y.; Li, Y. Revitalize the World’s Countryside. Nature 2017, 548, 275–277. [Google Scholar] [CrossRef]
- Bernard, B.; Lux, A. How to Feed the World Sustainably: An Overview of the Discourse on Agroecology and Sustainable Intensification. Reg. Environ. Change 2017, 17, 1279–1290. [Google Scholar] [CrossRef]
- Playán, E.; Mateos, L. Modernization and Optimization of Irrigation Systems to Increase Water Productivity. Agric. Water Manag. 2006, 80, 100–116. [Google Scholar] [CrossRef]
- Yang, Y.; Chen, C.; Sun, Y. Challenges in the Chinese Path to Modernization of Agriculture and Rural Areas: A Comparison with the US. J. Agric. Sci. 2024, 16, 1–15. [Google Scholar] [CrossRef]
- Ren, Z.; Zhu, F. Land Transfer and Agricultural Modernization: Internal Mechanism and Empirical Testing. Int. J. Educ. Humanit. 2023, 9, 79–85. [Google Scholar] [CrossRef]
- Aznar-Sánchez, J.A.; Piquer-Rodríguez, M.; Velasco-Muñoz, J.F.; Manzano-Agugliaro, F. Worldwide research trends on sustainable land use in agriculture. Land Use Policy 2019, 87, 104069. [Google Scholar] [CrossRef]
- Marx, K.; Engels, F. Marx & Engels Collected Works Vol 02: Engels: 1838-1842; Lawrence & Wishart: London, UK, 1975. [Google Scholar]
- Fulcher, J.; Scott, J. Sociology; Oxford University Press: Oxford, UK, 2011. [Google Scholar]
- Ioffe, G.; Nefedova, T.; Zaslavsky, I. The End of Peasantry?: The Disintegration of Rural Russia; University of Pittsburgh: Pittsburgh, PA, USA, 2006. [Google Scholar]
- Hayami, Y.; Ruttan, V.W. Agricultural Development: An International Perspective; The Johns Hopkins Press: Baltimore, MD, USA, 1971. [Google Scholar]
- Timmer, C.P. Agriculture and economic development. Handb. Agric. Econ. 2002, 2, 1487–1546. [Google Scholar] [CrossRef]
- Knickel, K.; Ashkenazy, A.; Chebach, T.C.; Parrot, N. Agricultural modernization and sustainable agriculture: Contradictions and complementarities. Int. J. Agric. Sustain. 2017, 15, 575–592. [Google Scholar] [CrossRef]
- Huttunen, S. Revisiting agricultural modernisation: Interconnected farming practices driving rural development at the farm level. J. Rural Stud. 2019, 71, 36–45. [Google Scholar] [CrossRef]
- Hardeman, E.; Jochemsen, H. Are There Ideological Aspects to the Modernization of Agriculture? J. Agric. Environ. Ethics 2012, 25, 657–674. [Google Scholar] [CrossRef]
- Chopin, P.; Mubaya, C.P.; Descheemaeker, K.; Öborn, I.; Bergkvist, G. Avenues for improving farming sustainability assessment with upgraded tools, sustainability framing and indicators. A review. Agron. Sustain. Dev. 2021, 41, 19. [Google Scholar] [CrossRef]
- Nelson, K.S.; Nguyen, T.D.; Brownstein, N.A.; Garcia, D.; Walker, H.C.; Watson, J.T.; Xin, A. Definitions, measures, and uses of rurality: A systematic review of the empirical and quantitative literature. J. Rural Stud. 2021, 82, 351–365. [Google Scholar] [CrossRef]
- Carof, M.; Colomb, B.; Aveline, A. A Guide for Choosing the Most Appropriate Method for Multi-Criteria Assessment of Agricultural Systems According to Decision-Makers’ Expectations. Agric. Syst. 2013, 115, 51–62. [Google Scholar] [CrossRef]
- Bergez, J.E.; Bethinger, A.; Bockstaller, C.; Cederberg, C.; Ceschia, E.; Guilpart, N.; Lange, S.; Müller, F.; Reidsma, P.; Riviere, C.; et al. Integrating Agri-Environmental Indicators, Ecosystem Services Assessment, Life Cycle Assessment, and Yield Gap Analysis to Assess the Environmental Sustainability of Agriculture. Ecol. Indic. 2022, 141, 109107. [Google Scholar] [CrossRef]
- Pardey, P.G.; Alston, J.M. Transforming Traditional Agriculture Redux. In The Oxford Handbook of Structural Transformation; Oxford University Press: Oxford, UK, 2019; pp. 362–380. [Google Scholar] [CrossRef]
- Rezaei-Moghaddam, K.; Karami, E. A Multiple Criteria Evaluation of Sustainable Agricultural Development Models Using AHP. Environ. Dev. Sustain. 2008, 10, 407–426. [Google Scholar] [CrossRef]
- He, C. World Agricultural Modernization Development Trends and Basic Experiences. Trib. Study 2013, 5, 33–37. [Google Scholar]
- Di, F.; Hu, Z. Construction and Application of China’s Agricultural Modernization Evaluation Index System. Chin. J. Agric. Resour. Reg. Plan. 2020, 41, 46–56. [Google Scholar]
- Liu, C.; Ning, A.; Jia, B.; Zhang, D. Statistical Measurement and Spatiotemporal Characteristics of Agricultural and Rural Modernization in China. Stat. Decis. 2023, 39, 43–48. [Google Scholar]
- Rikkonen, P.; Tapio, P.; Rintamäki, H. Visions for Small-Scale Renewable Energy Production on Finnish Farms—A Delphi Study on the Opportunities for New Business. Energy Policy 2019, 129, 939–948. [Google Scholar] [CrossRef]
- Munz, J.; Gindele, N.; Doluschitz, R. Exploring the Characteristics and Utilisation of Farm Management Information Systems (FMIS) in Germany. Comput. Electron. Agric. 2020, 170, 105246. [Google Scholar] [CrossRef]
- Jamin, A.; Humeau-Heurtier, A. (Multiscale) Cross-Entropy Methods: A Review. Entropy 2019, 22, 45. [Google Scholar] [CrossRef]
- Jahanshahloo, G.R.; Lotfi, F.H.; Izadikhah, M. Extension of the TOPSIS method for decision-making problems with fuzzy data. Appl. Math. Comput. 2006, 181, 1544–1551. [Google Scholar] [CrossRef]
- Pérez-Hoyos, A.; Udías, A.; Rembold, F. Integrating Multiple Land Cover Maps Through a Multi-Criteria Analysis to Improve Agricultural Monitoring in Africa. Int. J. Appl. Earth Obs. Geoinf. 2020, 88, 102064. [Google Scholar] [CrossRef]
- Siad, S.M.; Iacobellis, V.; Zdruli, P.; Gioia, A.; Stavi, I.; Hoogenboom, G. A review of coupled hydrologic and crop growth models. Agric. Water Manag. 2019, 224, 9. [Google Scholar] [CrossRef]
- Wang, Y.; Lei, Y.; Shah, M.H. Coupling and Coordination Analysis of High-Quality Agricultural Development and Rural Revitalization: Spatio-Temporal Evolution, Spatial Disparities, and Convergence. Sustainability 2024, 16, 9007. [Google Scholar] [CrossRef]
- Hua, F.A.N.; Cuiwei, Z.H.A.O. Coupling Coordination Relationship between Ecological Human Settlements and the Happiness Levels of Residents in the Yangtze River Delta Urban Agglomeration. J. Resour. Ecol. 2024, 15, 1251–1262. [Google Scholar] [CrossRef]
- Tian, Y. The impact of digital finance on the urban-rural income gap: An empirical analysis based on spatial econometric modeling. Appl. Math. Nonlinear Sci. 2024, 9, 1–20. [Google Scholar] [CrossRef]
- Zhou, J.; Li, J.; Wang, C.; Wu, H.; Zhao, C.; Wang, Q. A Vegetable Disease Recognition Model for Complex Background Based on Region Proposal and Progressive Learning. Comput. Electron. Agric. 2021, 184, 106101. [Google Scholar] [CrossRef]
- Gang, M. Study on Promoting Agricultural and Rural Modernization under the Rural Revitalization Strategy. Agric. Technol. Equip. 2019, 71, 68–69. [Google Scholar]
- Han, J. Prioritizing agricultural, rural development and implementing the rural revitalization strategy. China Agric. Econ. Rev. 2020, 12, 14–19. [Google Scholar] [CrossRef]
- Chen, K.; Tian, G.; Tian, Z.; Ren, Y.; Liang, W. Evaluation of the coupled and coordinated relationship between agricultural modernization and regional economic development under the rural revitalization strategy. Agronomy 2022, 12, 990. [Google Scholar] [CrossRef]
- Chen, X.; Wei, H.; Song, Y. Rural Revitalization in China; Springer: Berlin/Heidelberg, Germany, 2023. [Google Scholar]
- De Oliveira Ferreira Silva, C.; Lilla Manzione, R.; Albuquerque Filho, J.L. Large-Scale Spatial Modeling of Crop Coefficient and Biomass Production in Agroecosystems in Southeast Brazil. Horticulturae 2018, 4, 44. [Google Scholar] [CrossRef]
- Reimer, A. Ecological modernization in US agri-environmental programs: Trends in the 2014 Farm Bill. Land Use Policy 2015, 47, 209–217. [Google Scholar] [CrossRef]
- Xu, B.; Baležentis, T.; Štreimikienė, D.; Shen, Z. Enhancing agricultural environmental performance: Exploring the interplay of agricultural productive services, resource allocation, and marketization factors. J. Clean. Prod. 2024, 439, 140843. [Google Scholar] [CrossRef]
- Gutu Sakketa, T. Urbanisation and rural development in sub-Saharan Africa: A review of pathways and impacts. Res. Glob. 2023, 6, 100133. [Google Scholar] [CrossRef]
- Cattaneo, A.; Adukia, A.; Brown, D.L.; Christiaensen, L.; Evans, D.K.; Haakenstad, A.; McMenomy, T.; Partridge, M.; Vaz, S.; Weiss, D.J. Economic and social development along the urban–rural continuum: New opportunities to inform policy. World Dev. 2022, 157, 105941. [Google Scholar] [CrossRef]
- Sjaf, S.; Kaswanto, K.; Hidayat, N.K.; Barlan, Z.A.; Elson, L.; Sampean, S.; Gunadi, H.F.F. Measuring achievement of sustainable development goals in rural area: A case study of Sukamantri Village in Bogor District, West Java, Indonesia. Sodality J. Sosiol. Pedesaan 2021, 9, 33896. [Google Scholar] [CrossRef]
- Adamowicz, M. The potential for innovative and smart rural development in the peripheral regions of Eastern Poland. Agriculture 2021, 11, 188. [Google Scholar] [CrossRef]
- Kumar, A. Indian knowledge system and social practices in rural India. Management 2023, 10, 1251–1262. [Google Scholar] [CrossRef] [PubMed]
- Handoyo, F.; Hidayatina, A.; Purwanto, P. The effect of rural development on poverty gap, poverty severity and local economic growth in Indonesia. J. Bina Praja 2021, 13, 369–381. [Google Scholar] [CrossRef]
- Falk, J.; Globisch, B.; Angelmahr, M.; Schade, W.; Schenk-Mathes, H. Drinking water supply in rural Africa based on a mini-grid energy system—A socio-economic case study for rural development. Sustainability 2022, 14, 9458. [Google Scholar] [CrossRef]
- Okosun, A.E.; Okeke, F.O.; Igwe, A.E.; Ezema, E.C.; Okpalike, C.O. Rural area infrastructural challenges and the role of architecture in urban-rural development in Nigeria. Eur. J. Sustain. Dev. 2023, 12, 305. [Google Scholar] [CrossRef]
- Hua, J.; Yu, J.; Song, Y.; Xue, Q.; Zhou, Y. The enabling effect of digital economy on high-quality agricultural development-evidence from China. Sustainability 2024, 16, 3859. [Google Scholar] [CrossRef]
- Qu, X.; Zhang, Y.; Li, Z. Is China’s Rural Revitalization Good Enough? Evidence from Spatial Agglomeration and Cluster Analysis. Sustainability 2024, 16, 4574. [Google Scholar] [CrossRef]
- Song, G.; Zhong, S.; Song, L. Spatial Pattern Evolution Characteristics and Influencing Factors in County Economic Resilience in China. Sustainability 2022, 14, 8703. [Google Scholar] [CrossRef]
- Ding, S.; Fan, Z. Spatiotemporal Evolution and Obstacle Factor Analysis of Coupling Coordination Between Economic Resilience and Green, Low-Carbon Development in China. Sustainability 2024, 16, 11006. [Google Scholar] [CrossRef]

Disclaimer/Publisher’s Note: The statements, opinions and data contained in all publications are solely those of the individual author(s) and contributor(s) and not of MDPI and/or the editor(s). MDPI and/or the editor(s) disclaim responsibility for any injury to people or property resulting from any ideas, methods, instructions or products referred to in the content. |
© 2025 by the authors. Licensee MDPI, Basel, Switzerland. This article is an open access article distributed under the terms and conditions of the Creative Commons Attribution (CC BY) license (https://creativecommons.org/licenses/by/4.0/).