Article

Widespread Microplastic Pollution in Central Appalachian Streams: Implications for Freshwater Ecosystem Sustainability

by
Isabella M. Tuzzio
1,*,
Brent A. Murry
2 and
Caroline C. Arantes
2
1
Department of Biology, West Virginia University, Morgantown, WV 26505, USA
2
School of Natural Resources and the Environment, West Virginia University, Morgantown, WV 26505, USA
*
Author to whom correspondence should be addressed.
Sustainability 2025, 17(7), 2926; https://doi.org/10.3390/su17072926
Submission received: 10 February 2025 / Revised: 13 March 2025 / Accepted: 14 March 2025 / Published: 26 March 2025
(This article belongs to the Section Sustainable Water Management)

Abstract

:
Microplastic pollution levels and potential sources of contamination in North Central Appalachia are evaluated to fill a major knowledge gap regarding microplastics in freshwater systems, which lead to negative consequences for the sustainability of healthy freshwaters. Fifty-five northern hogsucker fish were sampled from nine sites throughout seven freshwater streams in the region. Microplastic particles were extracted from the gastrointestinal (GI) tracts via 10% KOH digestion and identified visually. A total of 2185 particles were identified, ranging between 8 and 274 particles/individual and an average of 39.73 particles/individual. The most particles were found in fish within the Cheat watershed, particularly at the Big Sandy Creek downstream site, followed by tributaries of the Monongahela and Ohio Rivers. The most identified particle type was fiber (96.61%). There was a positive relationship between the total length of fish and number of particles. Agricultural land use and E. coli abundance were both positively correlated with microplastic abundance. Agricultural land use and sewage input both appear to be important drivers of microplastic pollution in these streams, although we cannot rule out the influence of atmospheric deposition. These results point to widespread levels of microplastic contamination in freshwater ecosystems in North Central Appalachia.

1. Introduction

Microplastics are persistent and ubiquitous pollutants around the world and within major ecosystems and organism groups [1,2]. They have been linked to a variety of health risks to organisms and ecosystems, and can act as vectors for transporting chemicals or other pollutants, such as PFAS, throughout the environment [3,4]. Microplastics are defined as plastic particles less than 5 mm in length and can be derived from the weathering of larger objects or directly from a range of pollutants, including exfoliates, the laundering of synthetic textiles, and sewage sludge [5,6,7]. They have been found in remote temperate, tropical, and polar regions and are being produced continually so that the ambient microplastic load in the environment is ever increasing [1,5].
Despite their widespread nature, the majority of aquatic microplastic investigation has focused on marine environments and organisms [8,9]. Zandaryaa, S. (2021) [10] identified a clear lack of freshwater studies, even though freshwater systems are likely comparably impacted by microplastics and have tremendous potential to negatively impact human and environmental health [11,12].
A few studies have investigated the relationship between microplastic occurrence or abundance in freshwaters and environmental variables [13]. These studies have shown that land cover patterns may be a significant source of microplastics in the region [14]. Increased contamination has been linked to urban and agricultural settings, likely due to a higher input of pollutants (such as sewage waste) into those ecosystems via human interference [15,16,17].
This study aims to understand the extent of microplastic occurrence in organic samples (i.e., fish) within an often-overlooked freshwater region, Appalachia. We posit that the bioaccumulation of microplastic contamination in fishes can serve as a potential indicator of larger-scale microplastic contamination in the area.
To accomplish our aim, we quantified microplastic particles in the GI tract of a common Appalachian fish, the northern hogsucker (Hypentelium nigricans) across several streams and watersheds in North Central Appalachia. The northern hogsucker is a detritivore native to and is widespread in Canada and the northern U.S. They thrive in small, fast-moving bodies of water and are known to be pollution sensitive, serving as an indicator of stream integrity [18,19]. The species is benthic, and is a group identified in Parker et al., 2019 [11] as understudied in the field of microplastic research. Benthic species are potentially disproportionately affected by the issue compared to their pelagic counterparts due to comparable bioaccumulation trends identified in other studies that utilized fish GI tracts as pollutant indicators for contaminants like heavy metals [20].
The sites that we studied varied in their natural watershed conditions (e.g., size and topographic diversity), as well as in human impacts (indexed as urban or agricultural land cover, and E. coli loading representing household sewage input). Overall, we predicted that larger watersheds and increased human activity would increase microplastic occurrence in northern hogsucker fish. In addition, we assume that local variables are the most dominant source of microplastic input and most directly affect abundance levels over global/regional contributors like atmospheric deposition. Specifically, we hypothesized that microplastic contamination would vary between sites (H1) and that the percent urban and/or agricultural land cover (H2), and E. coli levels (H3) would be positively correlated to the amount of microplastic contamination in fish, because these are indicators of human disturbance at the local watershed scale.

2. Materials and Methods

2.1. Field Sampling

Northern hogsucker were collected as part of a larger project to assess ecological well-being of warmwater mid-order streams [21] in West Virginia, United States. Fish were collected from 15 streams in North Central West Virginia (Figure 1) using high-frequency DC electrofishing. Equipment included 1–2 ETS ABP-4 backpack electrofishers and a tow barge, with ETS SDC-1 used in various combinations depending on stream width. There were 1–2 netters per electrofishing anode with dip nets (4.7 mm mesh). Fish were sampled in ~200 m reaches (± depending on stream width and natural movement barriers). Electrofishing started downstream and worked upstream, and stunned fish were netted and placed into buckets or coolers outfitted with bubblers. The majority of fish were identified, measured, and released, but highly abundant small fishes were often preserved in 10% formalin for laboratory processing (IACUC # 2205053799, WV collection permit # 2022-283). We identified the northern hogsucker as a species likely to be heavily impacted by microplastics due to its benthic detritivore feeding ecology, which was also numerically abundant across the sites we sampled and within the subsequent preserved samples we had. We included in this study fifty-five H. nigricans collected across nine sites from seven streams within three larger watersheds (Figure 1). All fish were juveniles with a length range of 5.6 cm–12.8 cm.

2.2. Environmental Variables

YSI sonde was utilized to collect specific conductivity samples, while watershed area was based on HUC10 or HUC12 depictions from the NHDPlus watershed layer. Land cover data originated from the 2019 National Land Cover Database from USGS. To collect E. coli data, water samples were taken at each site and tested via the Colilert Test kit from IDEXX. Values are included in Table 1.

2.3. Sample Preparation and Digestion

Fish were originally preserved in 10% formalin then were rinsed in water and stored in ethanol prior to dissection. Processing and inspection protocols were developed in Zipp, 2022 [22] following digestion guidelines presented in [23,24,25]. Fifty-five individuals were chosen, weighed, and measured, followed by the removal of internal viscera in totality. The control was exposed and sealed corresponding to the actions taken with each sample (for details see the contamination protocol section below and Appendix A). Following dissection, each sample and its corresponding control were suspended in a 10% KOH solution and sealed in a Fisher Scientific Isotemp Oven Model 655F at 40 °C for 72 h.

2.4. Filtration and Inspection

After the 72 h digestion period, samples and their controls were filtered with Ultrapure water through a sieve tower with mesh sizes 500, 300, 212, 106, and 63 μm resulting in 5 filter papers per fish, which facilitated more accurate counting by reducing microplastic density per filter. Each sieve was then rinsed into a vacuum filtration apparatus and onto cellulose 47 mm and 11 μm Whatman grade 1 qualitative filter paper. Filtration papers were sealed and then dried in the Isotemp oven at 40 °C for 24 h.
Following the drying period, the microplastic particles on each filtration paper were measured and visually inspected via a dissecting microscope (Amscope 3.5 × –180X Trinocular Stereo Zoom Microscope, Irving, CA, USA). Fibers, fragments, foams, and films were identified via guidelines from Rochman et al., 2019 [26]. The hot needle test [27] was performed if necessary to confidently identify a particle as plastic or organic.

2.5. Contamination Protocol

Strict contamination protocol was followed during the entirety of the study to minimize confounding environmental microplastic contamination as much as possible. White cotton lab coats and nitrile gloves were worn at all times to lessen potential fiber transmission from researchers. In the absence of a clean room, all procedures were carried out in a fume hood wherein all surfaces were thoroughly cleaned with KimWipes, Ultrapure water, and then ethanol before use. All tools and equipment were cleaned in the same manner before use and between samples to reduce surface contaminants [22].
Importantly, each sample was paired with a corresponding procedural blank that went through the same processes to better quantify contamination levels [24]. Blanks were petri dishes opened during dissection of specimens [28]. They were filled with equal amounts of 10% KOH, sealed, filtered, and enumerated in the same manner as each specimen simultaneously, as described in the methods section above to provide a baseline level of contamination (Appendix A, Figure A1 and Figure A2).

2.6. Data Analysis

Whether there are strong positive associations between body size and microplastics in digestive tracts is disputed, as some findings suggest that there is a correlation [29], while others report the opposite [30]. Therefore, our first step was to use simple linear regression across all individuals (including all sites) to test for this association. We next used analysis of covariance (ANCOVA) to test for differences in microplastic particle count and particle length among watersheds with fish total length as a covariate. We used a negative binomial distribution for the ANCOVA because data are zero-truncated counts or lengths and over-dispersed with a few large counts and measures.
Finally, we evaluated relationships between environmental variables and microplastic abundance in the fish GI tracts. As a preliminary step, we used Pearson correlation analysis to assess potential collinearity among environmental variables. The percent of forest cover showed a strong negative correlation with percent of agriculture (−0.93) and of development (−0.86) in the watershed. Then, to examine relationships between environmental variables and microplastic abundance, we used generalized linear mixed effects models (GLMM), including in the models non-correlated or weakly correlated (<0.6) variables only. Specifically, we used GLMM to assess relationships between counts of particles in each fish with non-correlated environmental variables and individual fish lengths (fixed effects: land cover types, E. coli, water conductivity, watershed area, and fish length), while accounting for sampling location (random effect). We used negative binomial distributions, which are well-suited for count data with overdispersion and few observations with high counts. We performed Likelihood Ratio Tests (LRTs) to select the best fitting model from all possible combinations of non-correlated variables (20 models). We used a stepwise iterative approach in which we added or removed predictors to select the best model based on criteria like AIC (Akaike Information Criterion) and Chi-squared test statistics. Models with lower AIC and p-value below significance level 0.05 were considered to provide a significantly better fit. We used the package glmmTMB to fit and compare models and specifically used the functions glmmTMB() and anova() [31], and R package DHARMa (Diagnostics for Hierarchical Regression Models to assess residuals) [32].

3. Results

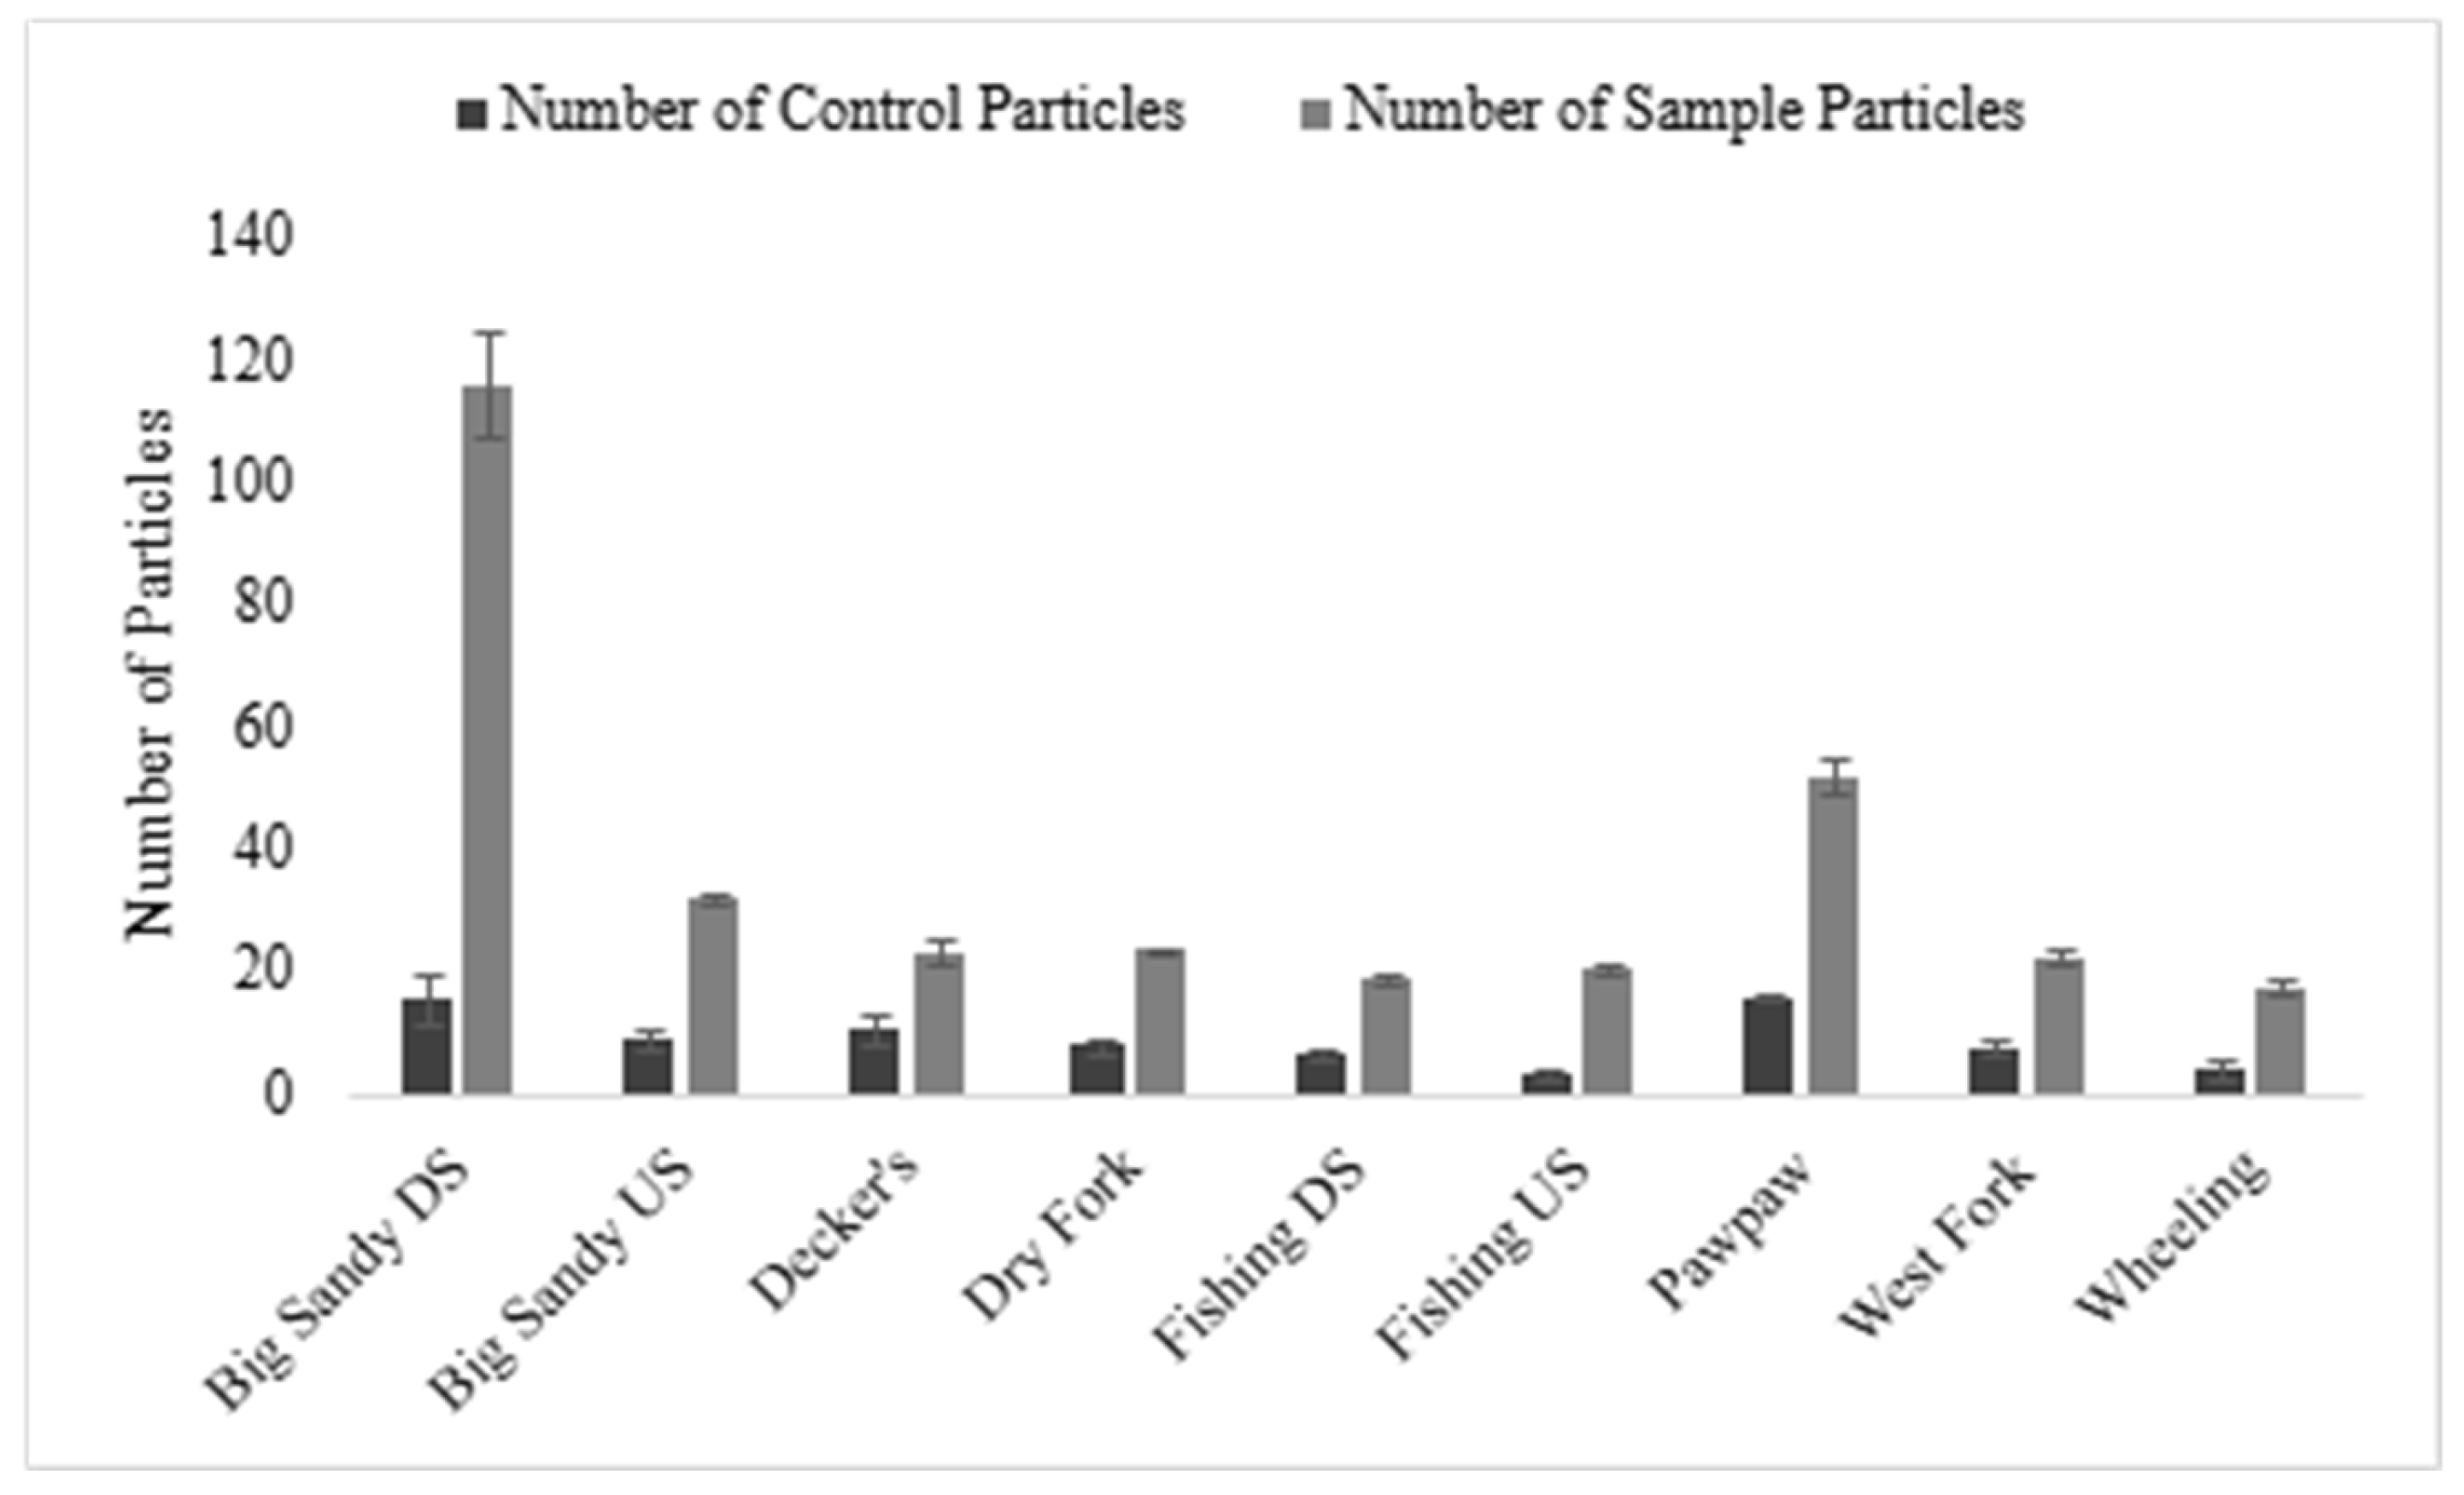
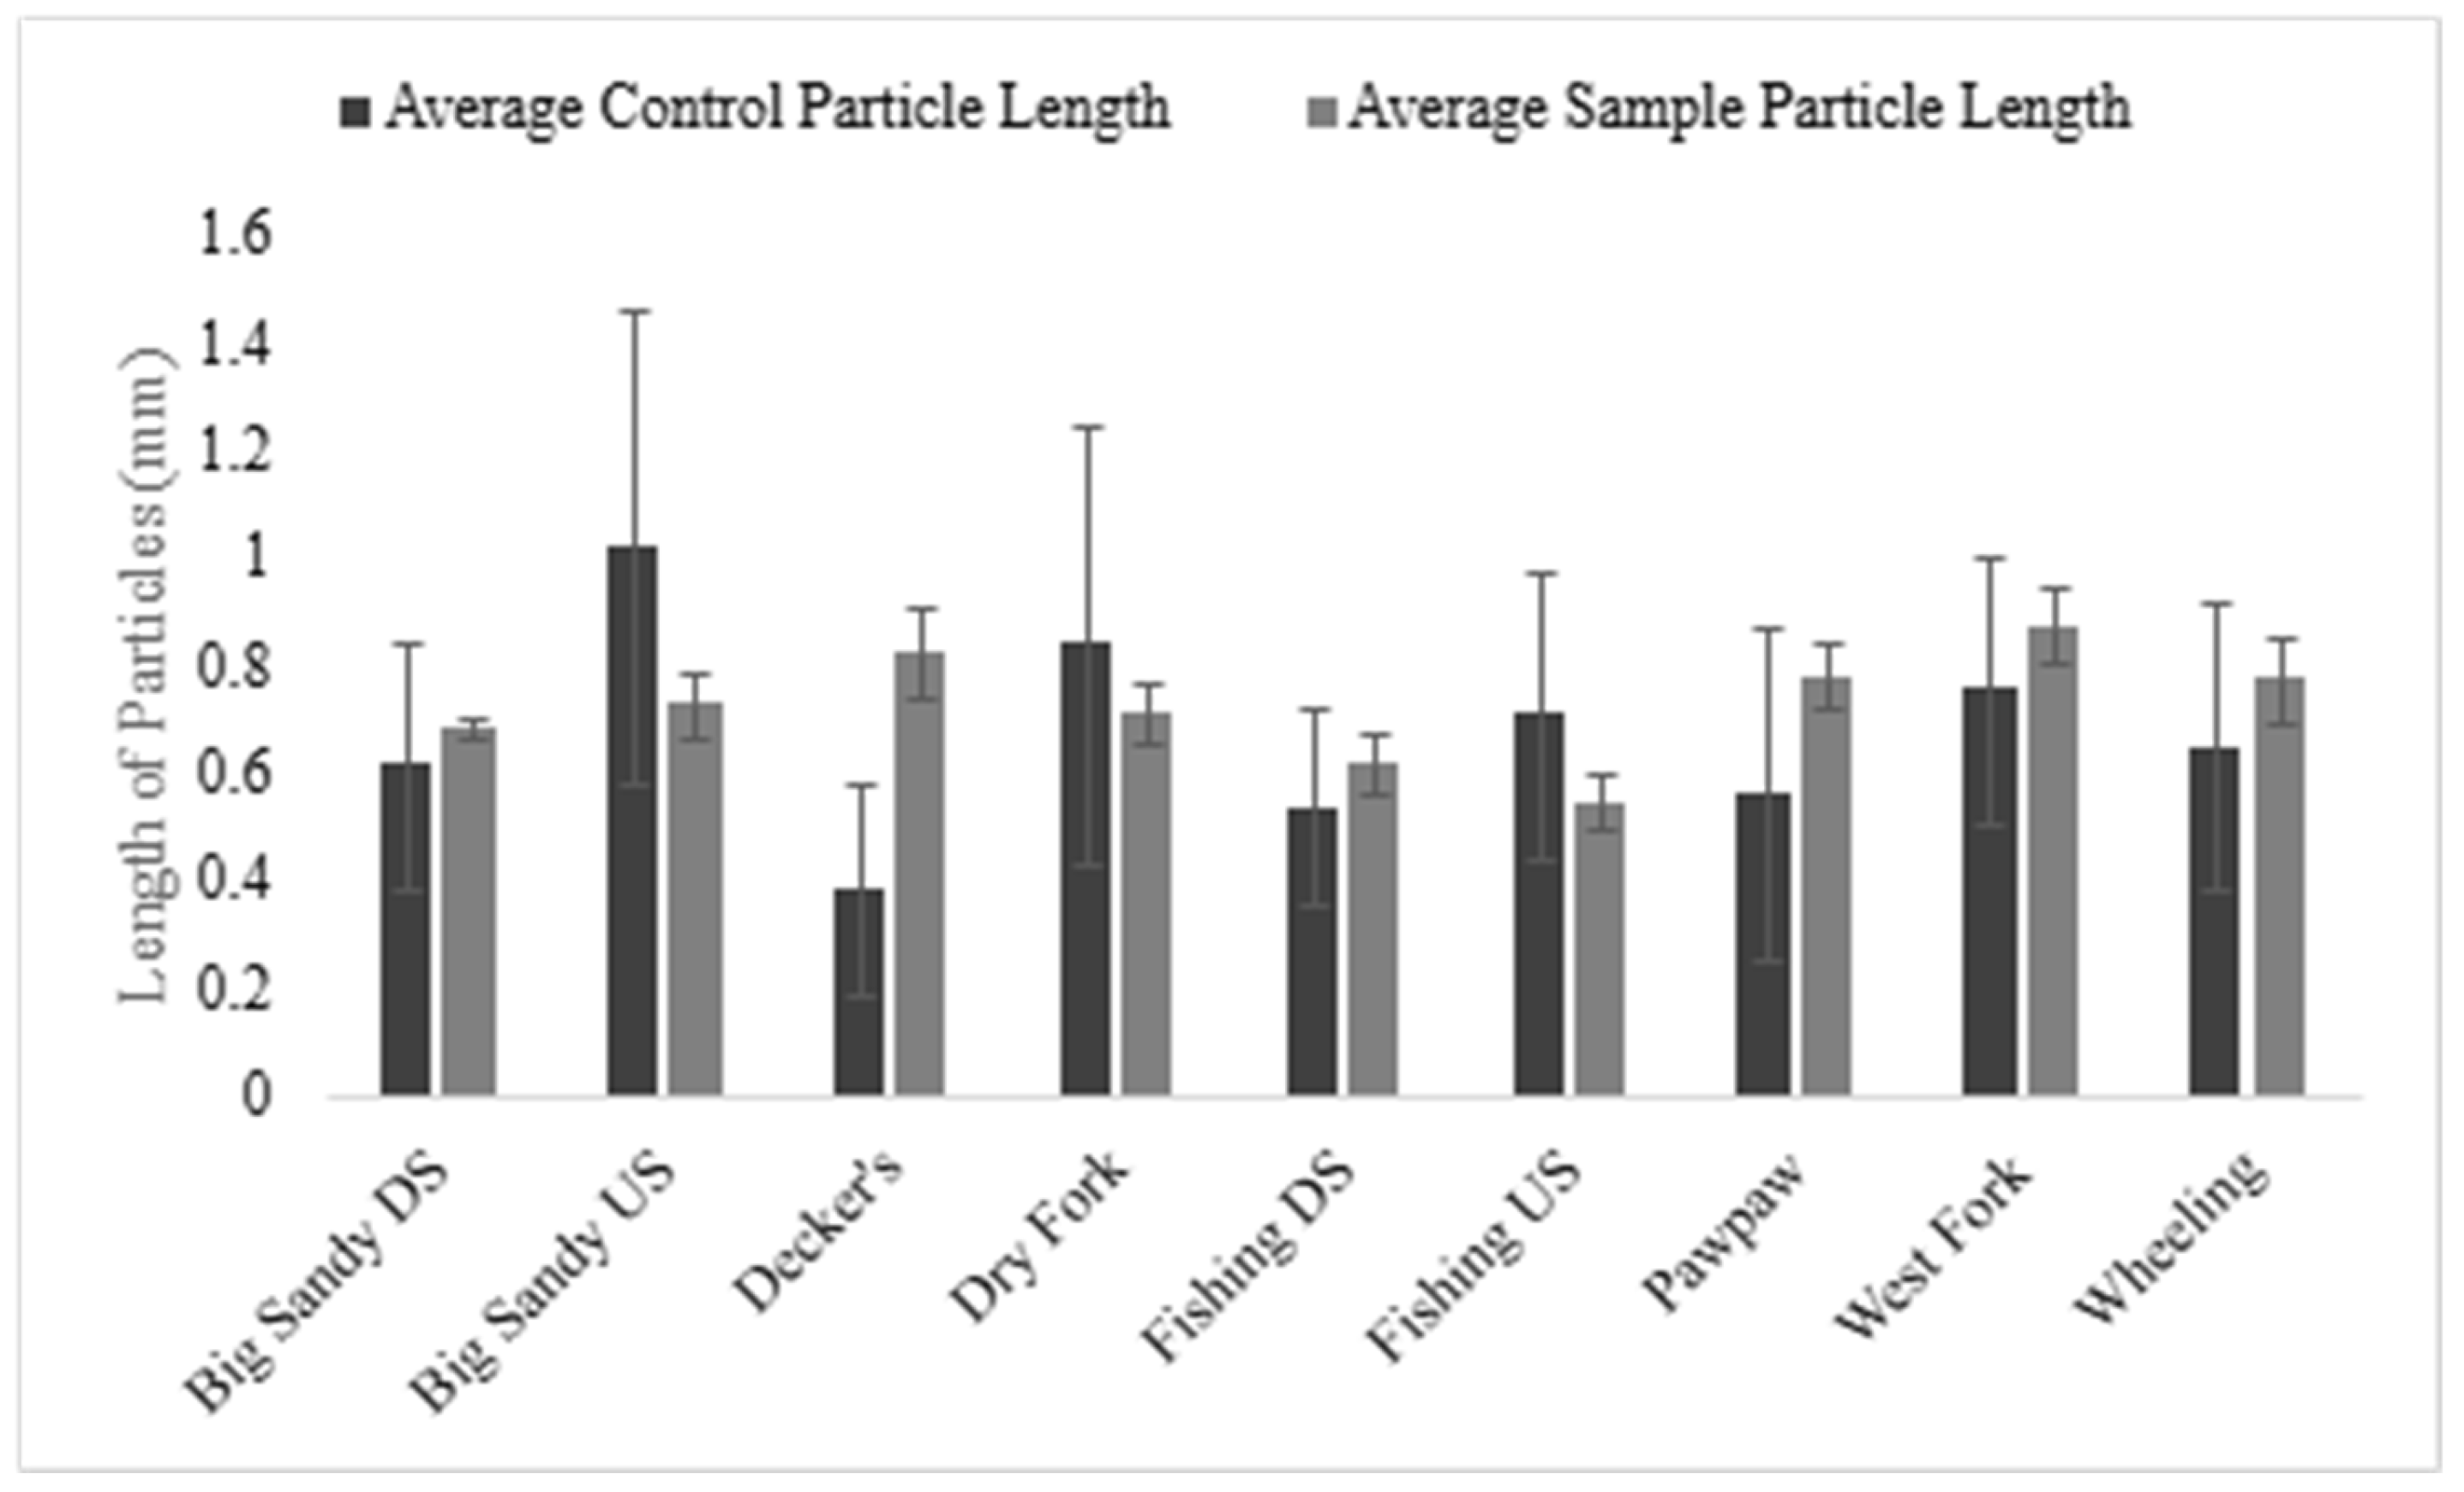
3.1. Characteristics of Microplastics in H. nigricans

We found 2185 microplastic particles in the stomachs of 55 northern hogsuckers sampled from nine sites and seven streams throughout North Central Appalachia. All 55 fish sampled contained microplastic particles. On average, individual fish had 39.73 microplastic particles in their digestive tracts. Particle lengths were on average 0.71 mm but ranged between 0.04 mm and 4.77 mm (Figure 2). Plastics were categorized as fiber, foam, sheet, or fragment based on physical characteristics. Fibers were by far the most ubiquitous, making up 96.61% of all particles found, followed by sheets at 2.01%, foams at 0.91%, and finally fragments at 0.46%. A fish from Fishing Creek (Ohio River drainage) contained the lowest number of particles (8 microplastics in the GI tract) and the most particles were identified in a fish from Big Sandy Creek (274, Cheat River drainage) (Figure 1).

3.2. Relationships Between Body Length and Microplastics in H. nigricans

The total length (mm) of the fish was not a significant predictor of the mean microplastic fragment length (Figure 3A, R2 = −0.02, F1,53 = 0.02, p = 0.8796). However, fish length was a significant predictor of the number of microplastic particles (Figure 3B, R2 = 0.13, F1,53 = 9.099, p = 0.0039) and of the sum total length (Figure 3C, R2 = 0.11, F1,53 = 7.60, p = 0.0080) of microplastic particles in their GI tracts.

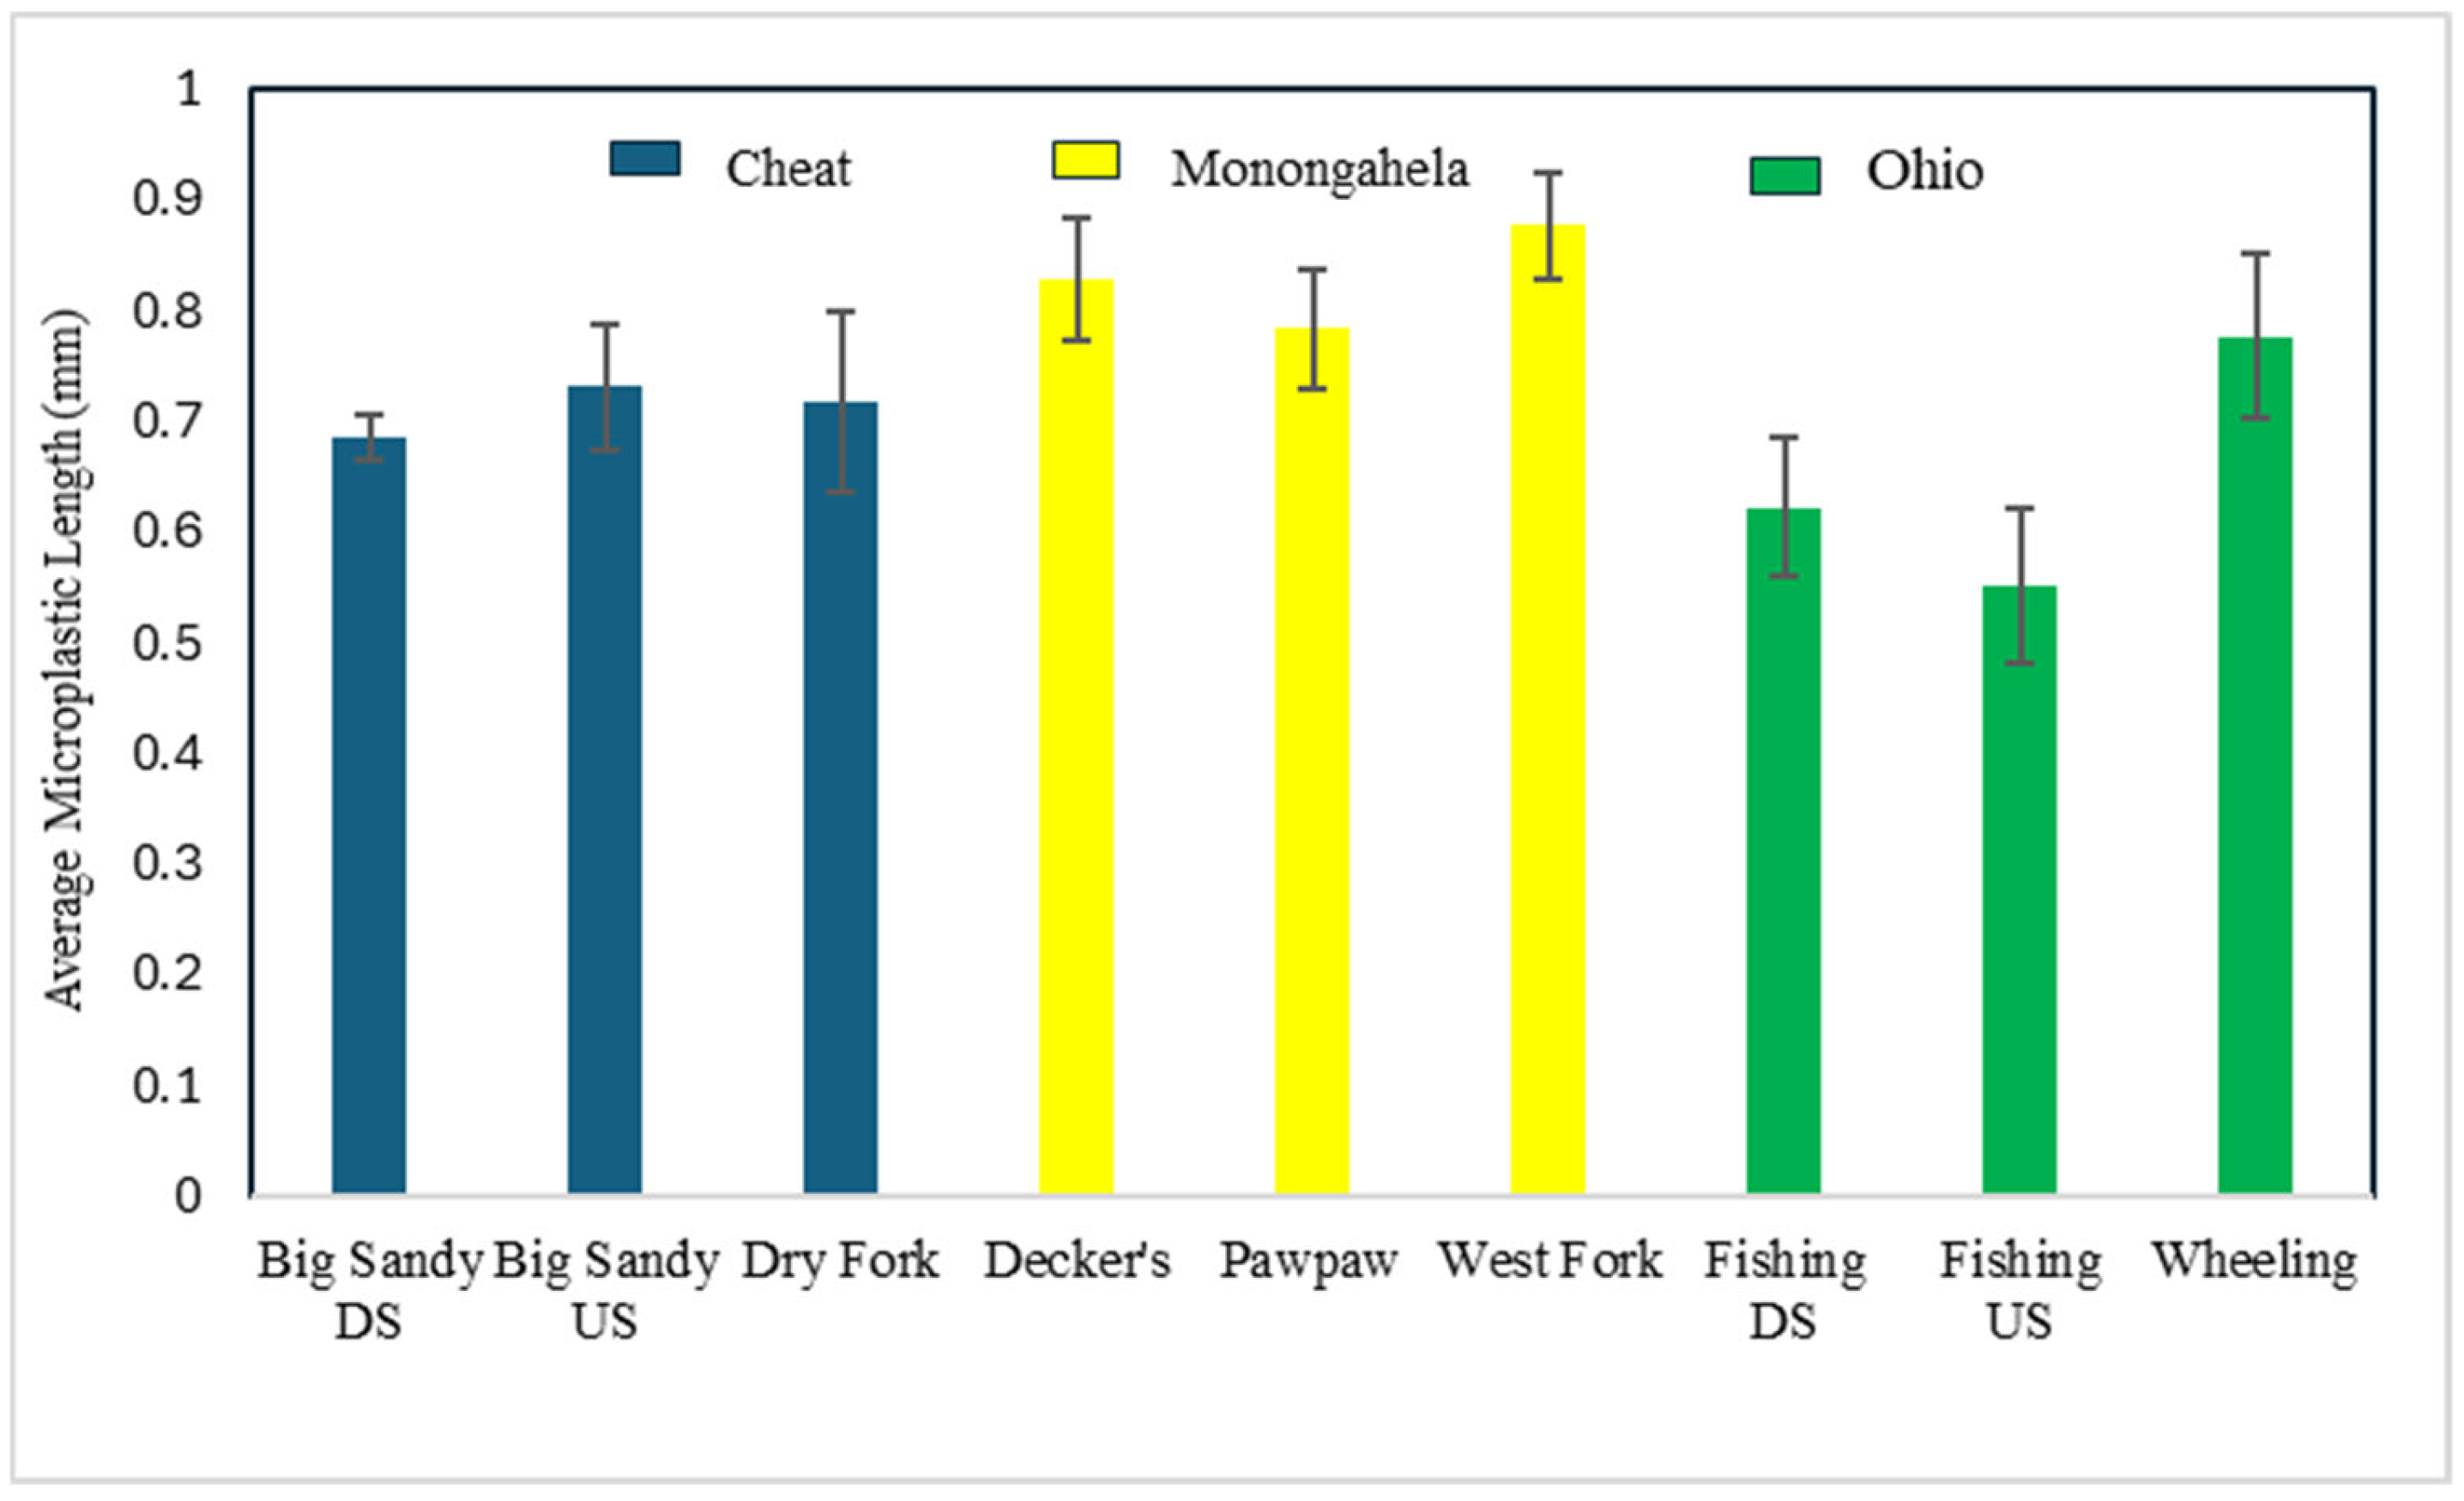
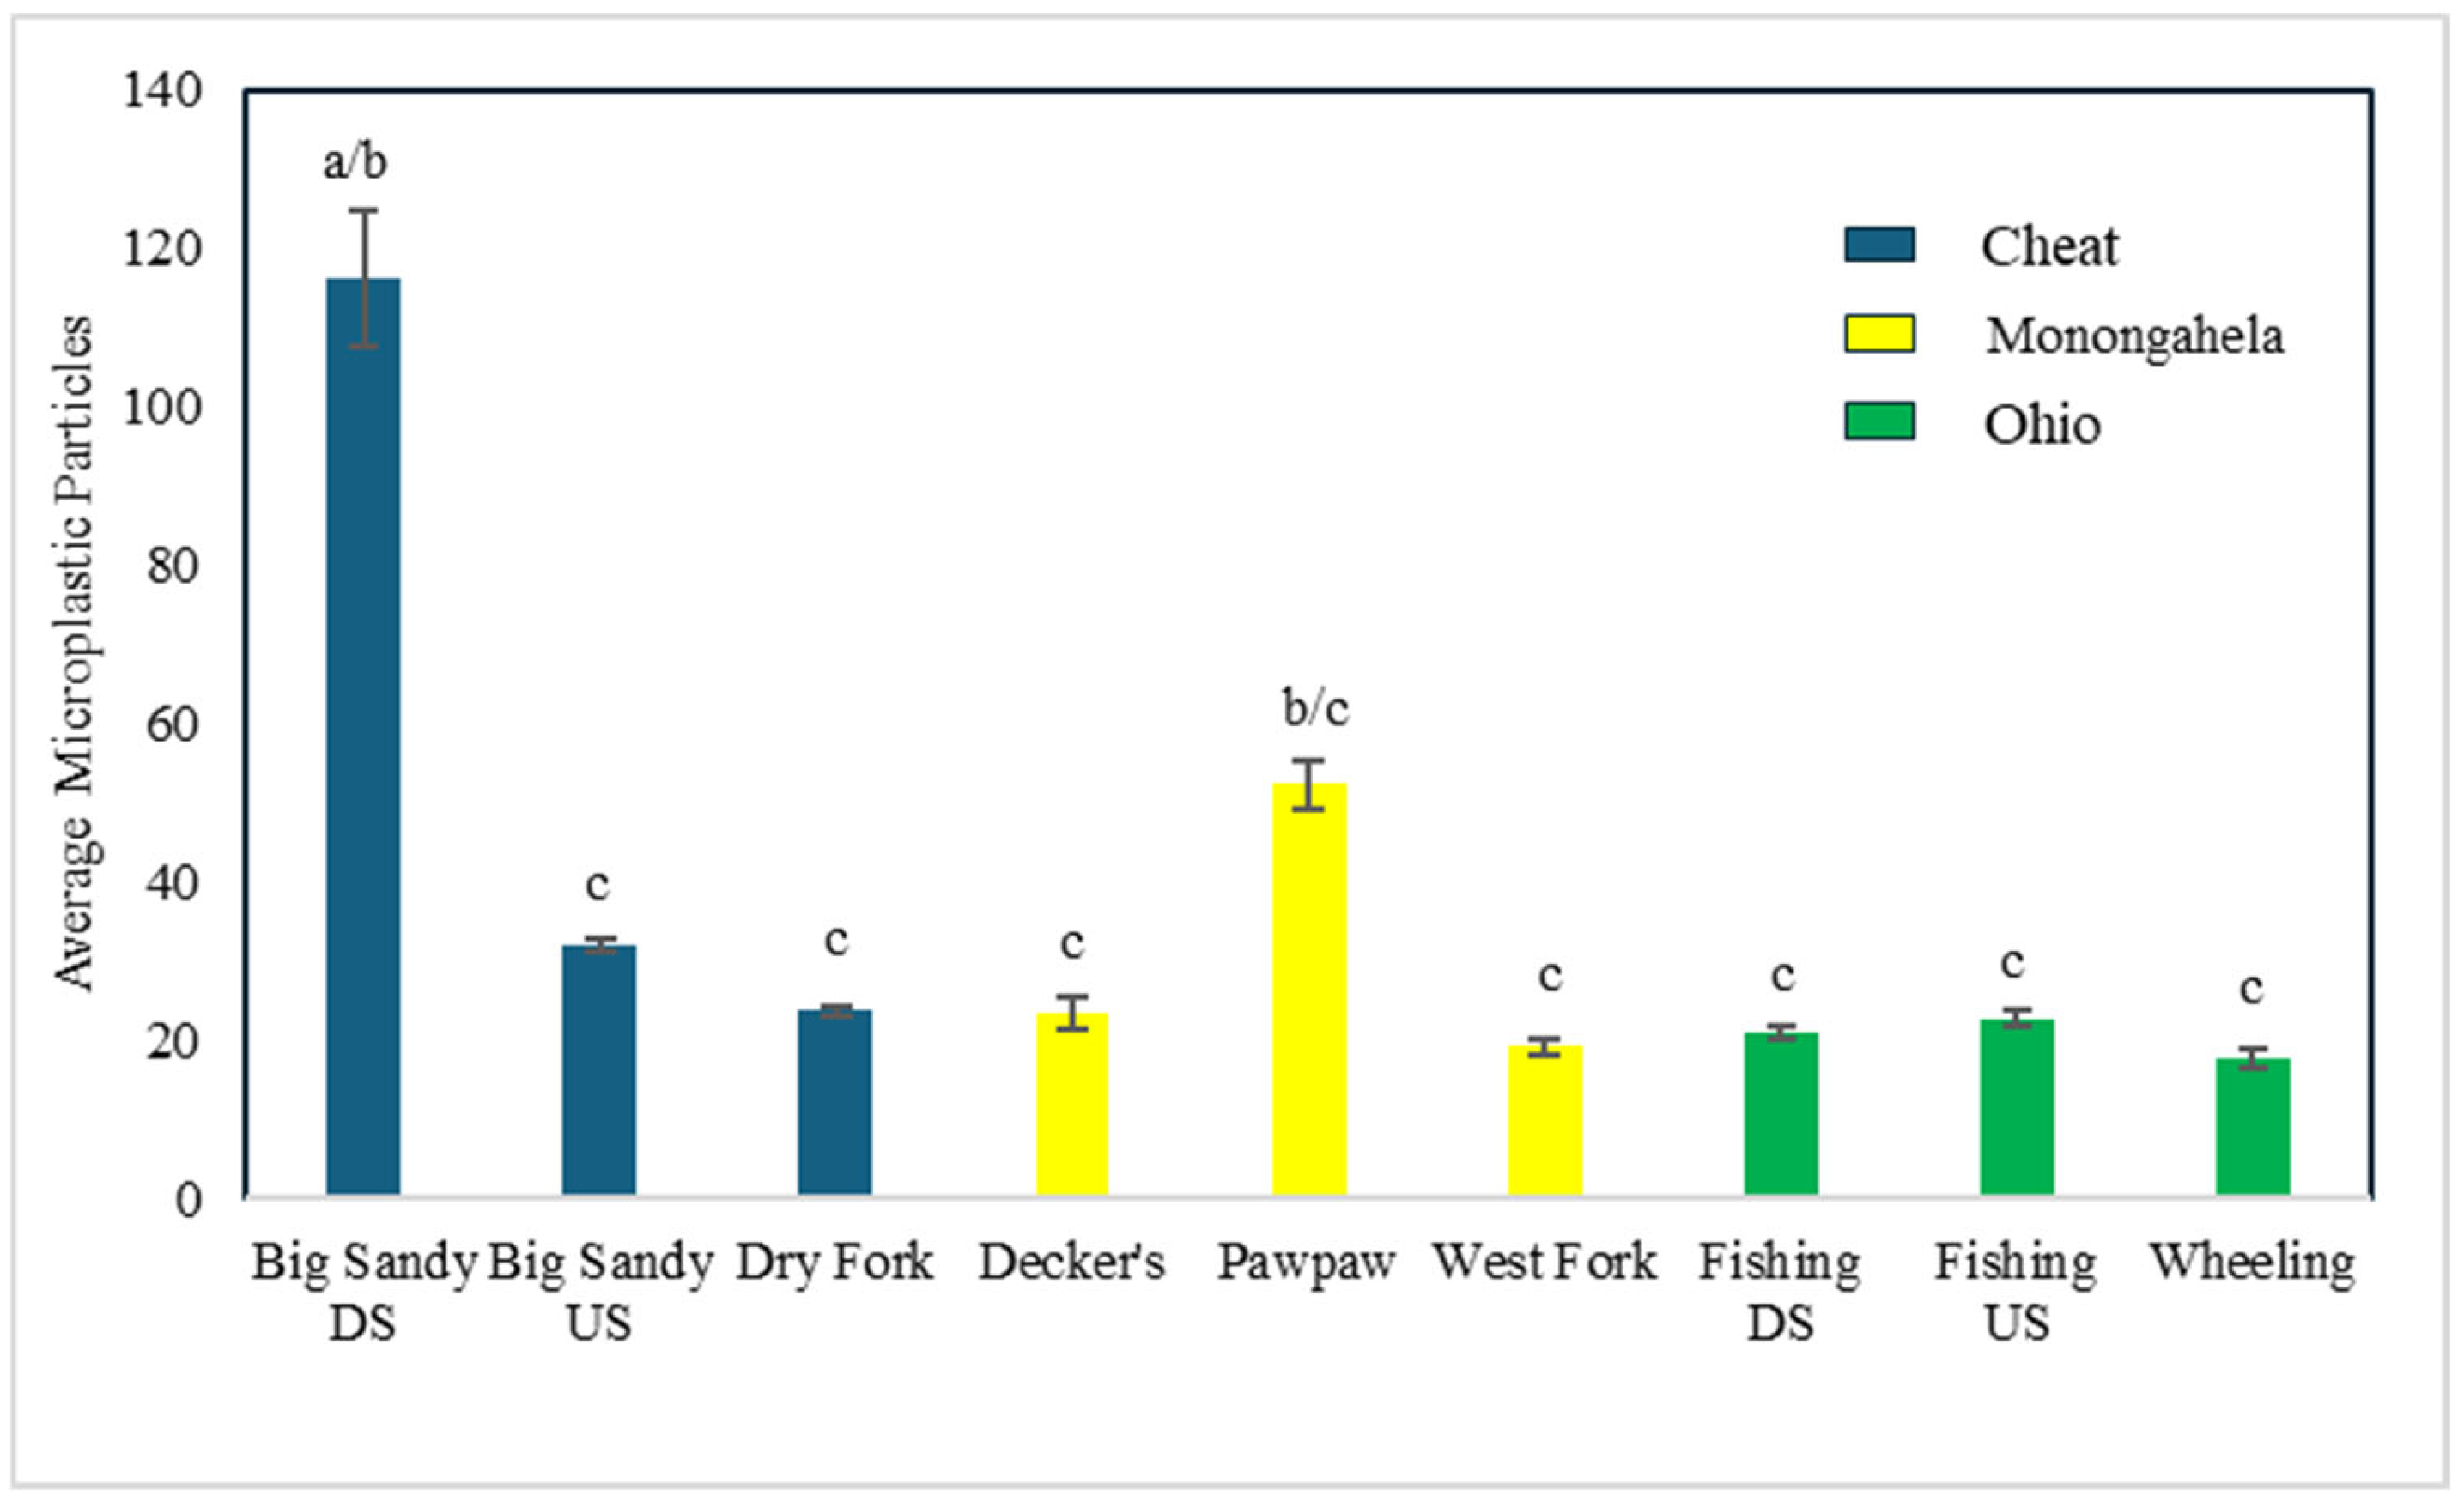
3.3. Differences in Sites, Streams, and Watersheds in Microplastic Consumption

The mean number of microplastic particles in fish GI tracts was higher in streams from the smallest watershed, the Cheat River watershed (Figure 4, mean # particles = 62.09 ± 13.43 s.e.), than the two larger Monongahela (mean # particles = 29.77 ± 4.04 s.e.) and Ohio River (mean # particles = 19.47 ± 0.33 s.e.) watersheds (F2,51 = 7.28, p = 0.0012). The Downstream site of Big Sandy Creek (Figure 4, n = 8 fish, 116.22 microplastic particles/fish) had significantly more microplastic particles than all other sites (range 3–8 fish/site and 17.75 to 32.00 microplastic particles/fish) except Pawpaw Creek (n = 3 fish, 52.33 microplastic particles/fish).

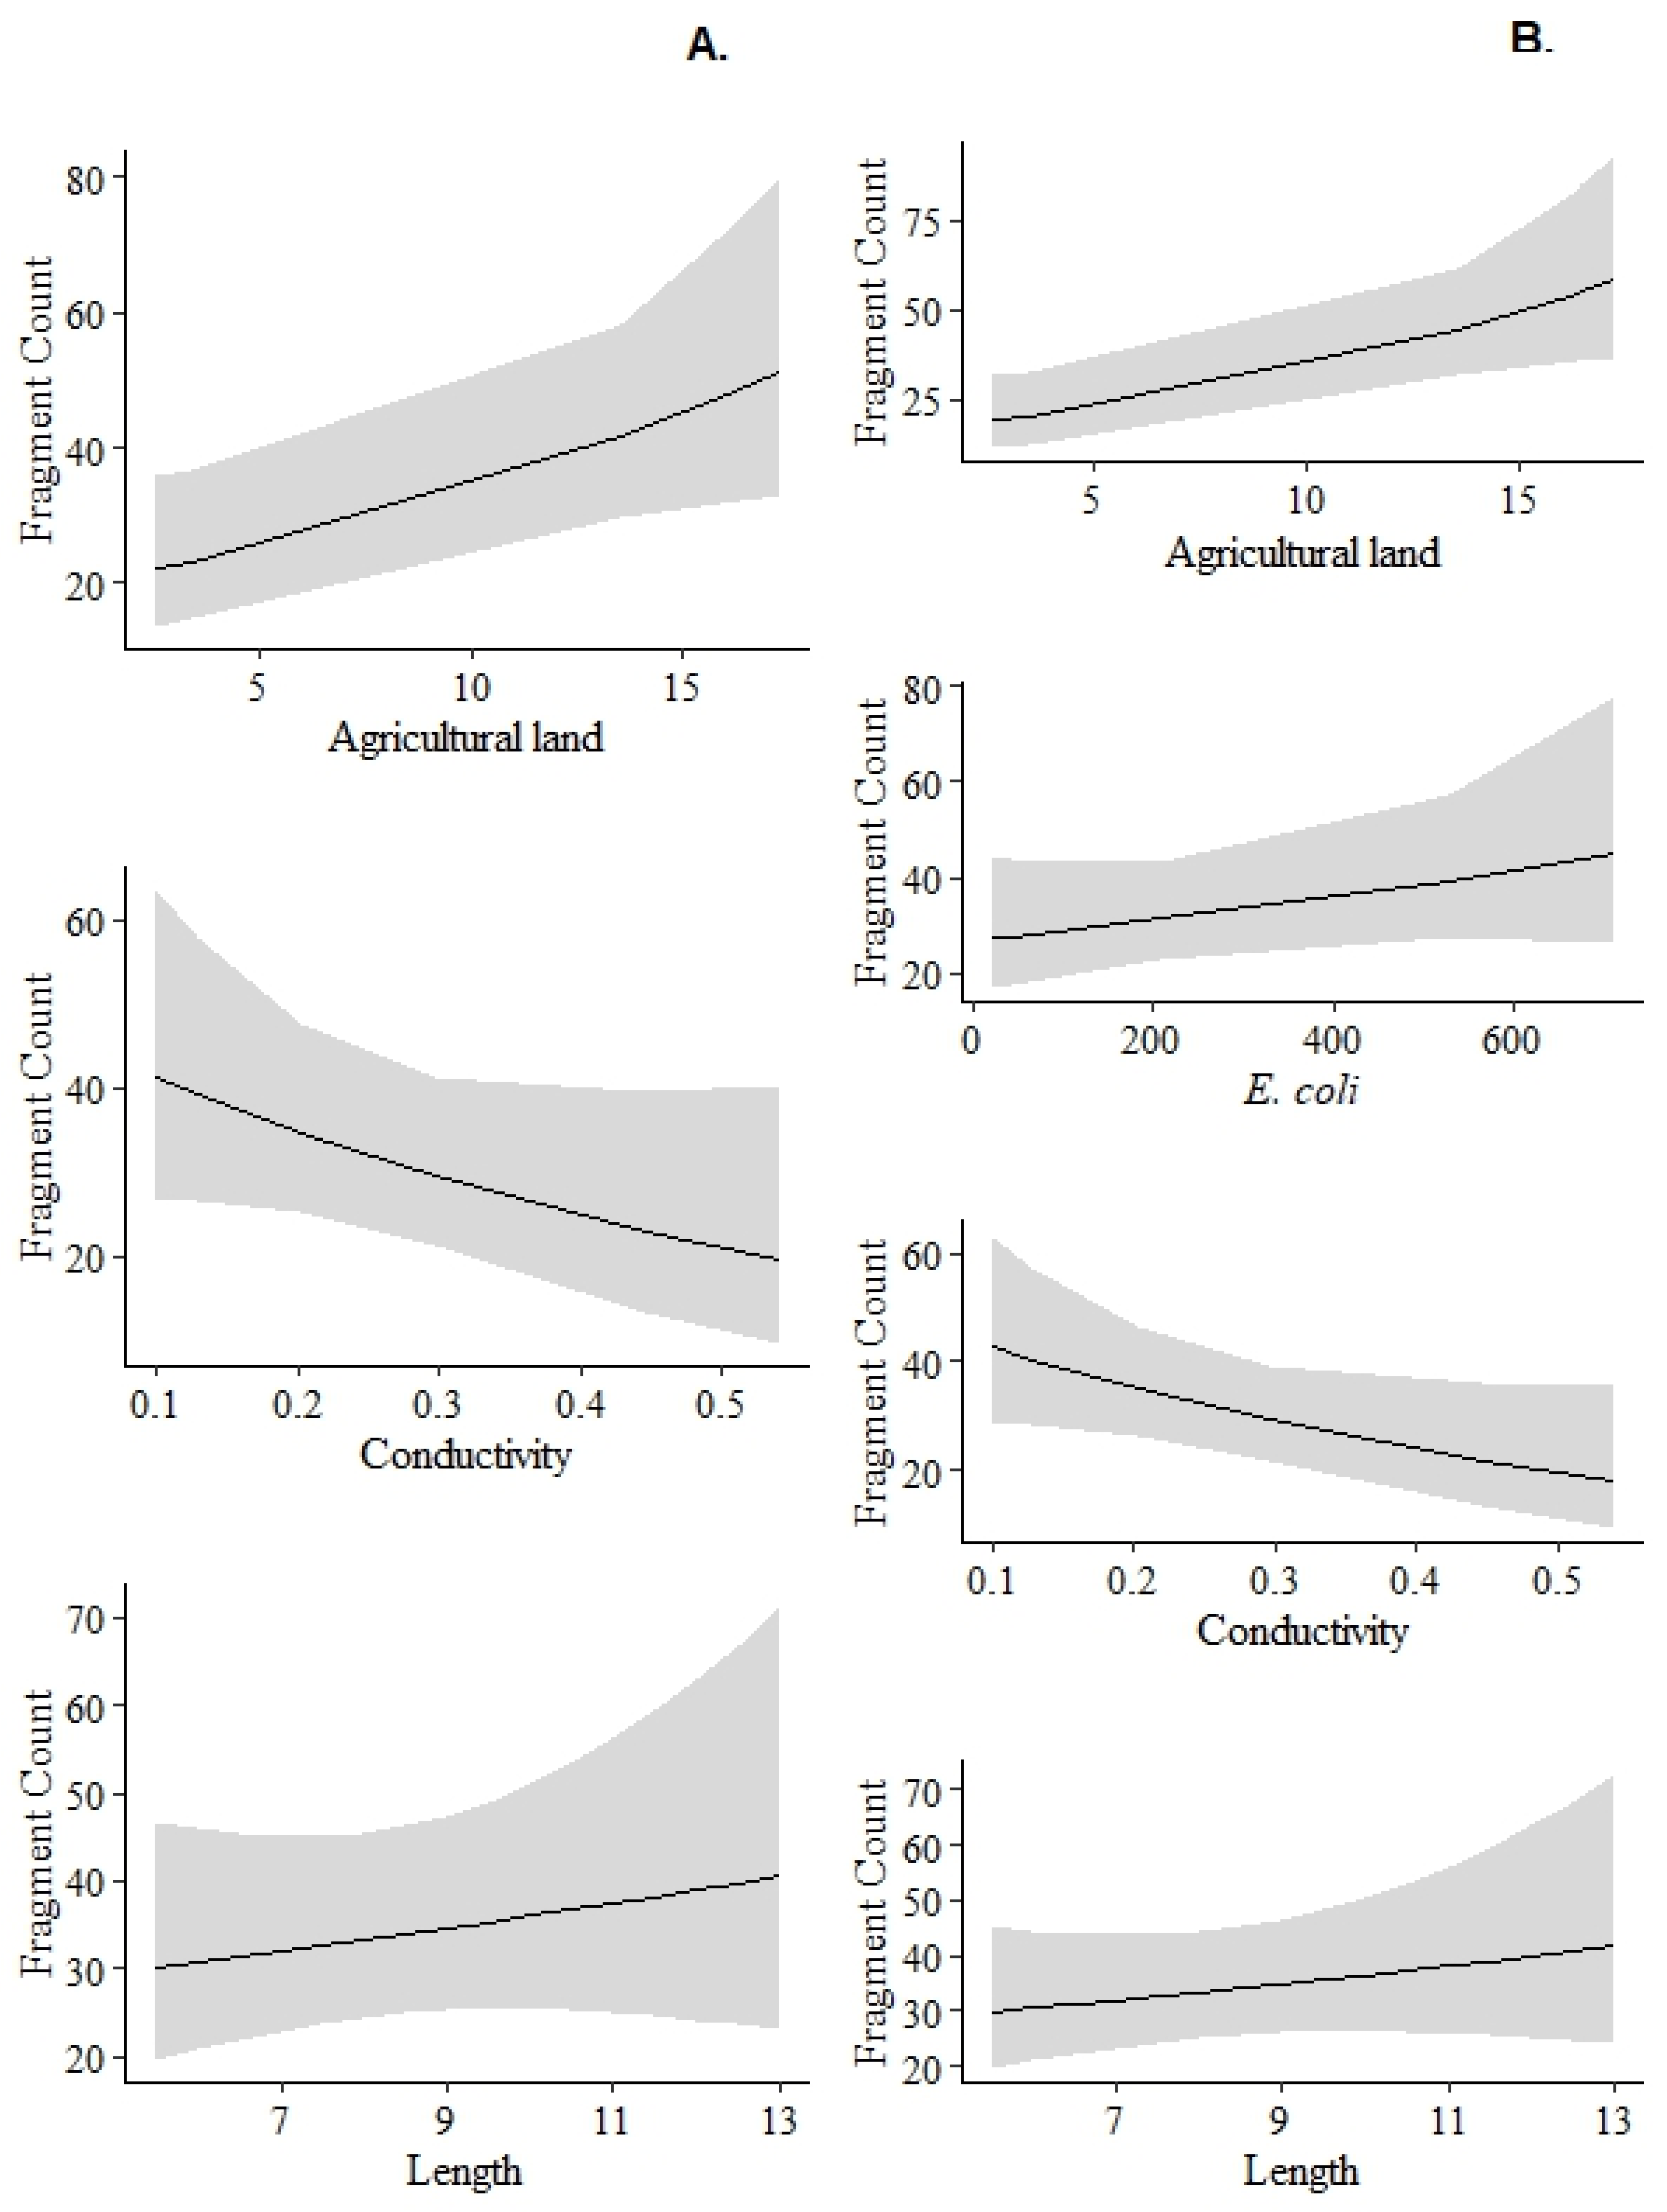
3.4. Relationship Between Microplastic Consumption and Environmental Variables

While seven out of the twenty models were a significantly better fit (p < 0.05), two had the lowest AIC (Table A1, Figure 5) The most parsimonious model (lower AIC, lower # of covariates, Marginal R2 = 0.387, Conditional R2 = 0.679) demonstrated that the counts of microplastics in the fish significantly increased with an increasing percentage of agricultural lands in the watershed (incidence ratio = 1.06, CI 1.01–1.11, p < 0.01) (Figure 5 left). Particle counts also tended to decline with increased water conductivity (incidence ratio = 0.18, CI 0.02–1.51 (Figure 5A)), however, this relationship was not statistically significant (p > 0.05). Fish body length was also included in this model, but again the relationship with microplastic particles was non-significant (p > 0.05) The second-best model included levels of E. coli in addition to the same variables selected in the previous model (Figure 5B). Consistently, the number of particles in the fish increased with an increased percentage of agricultural lands (incidence ratio = 1.08, CI 1.02–1.04, p < 0.001)). The numbers of particles also tended to increase with the levels of E. coli (incidence ratio = 1, CI 1.0–1.0), and fish length (incidence ratio = 1.05, CI 0.94–1.16) and decline with increased water conductivity (incidence ratio = 0.15, CI 0.02–0.1.04), but these relationships were not statistically significant (p > 0.05). For both models, DHARMa’s residual vs. the predicted plot indicated that the models fitted well and there was no major violation of models’ assumptions (Figure A3 and Figure A4).

4. Discussion

We identified microplastics in the gastrointestinal tracts of each of our fifty-five sampled northern hogsuckers, pointing to widespread microplastic contamination within North Central Appalachia. The most abundant microplastic type found was fibers, supporting trends identified in [33,34,35]. In addition, we found that microplastic counts were positively correlated with the body length of sampled individuals, supporting findings in [28,36], which these studies attribute to an individual’s prey size and age. However, diverging results have been identified in Pazos et al., 2017 [37], and it should be noted that our size range was limited (5.6 cm–12.8 cm), indicating that all fish were likely juveniles with similar prey sizes. Therefore, we recommend more investigation into the relationship between microplastic abundances and body length factors. We also identified several environmental correlates, including agricultural land usage (positive), E. coli (positive), and specific conductance (negative), which collectively point to local human disturbances as the overarching driver of microplastic abundance in the region.
Our study found a similar number of microplastic particles per individual and a broader range [38,39,40,41,42,43,44], with few exceptions [45], when compared with a subset of comparable experiments based on a literature review we conducted (Table 2). The northern hogsuckers in Appalachia had microplastic counts 1.13 times higher than the average of the reviewed studies assessing microplastics in the GI tracts of freshwater fish globally. Parker et al., 2021 [11] and Oza et al., 2024 [46] summarized findings that benthic fish typically ingest more microplastics than their pelagic counterparts in the same environment, which may contribute to their slightly above average particle counts, especially as they are also underrepresented in the field. This comparison of our results with the literature, however, includes multiple studies using different methodological protocols, which may lead to a wide range of results and possible over/underestimates depending on the microplastic extraction procedure [11]. Additionally, our average counts may be slightly overestimated due to procedural contamination, as evidenced by the controls, which had an average of nine particles per site (Appendix A).
Pointing to the pervasiveness of microplastic contamination in the region is the 100% occurrence of microplastic particles in the 55 sampled northern hogsuckers, similar to the high abundances seen in other global freshwater studies [22,39,40,41,42], except for those with extremely stringent digestion and enumeration protocols [43]. This emphasizes the breadth of microplastic pollution in not only marine, but also freshwater species/settings. Despite the widespread occurrence of microplastic in our study area, the results demonstrated that there is spatial variation in contamination, supporting our hypothesis (H1) that contamination would vary among sites. In fact, we measured a range between, on average, 116.22 particles/fish at one site in Big Sandy Creek and only 17.75 particles/fish at Wheeling Creek.
This variability we found among sites can be partially explained by the results we found supporting our second hypothesis (H2), that the amount of microplastics identified would be associated positively with urban and/or agricultural land cover. The occurrence of high microplastic levels in agricultural settings as opposed to forested/unmanaged regions is corroborated by data from other regional soil evaluation studies that connect agricultural land use to human activities [46,49]. Potential explanations for this relationship could include increased irrigation/runoff in agricultural settings, the practice of plastic mulching [50], or the use of sewage sludge fertilizers [51,52], which are generated during the wastewater treatment process. It should be noted, however, that plastic mulching is not a widely used practice in the area and would likely contribute to high levels of microplastic fragments as opposed to microplastic fibers in samples.
Although more research is needed to test this hypothesis, the positive association we found between agricultural lands and the abundance of microplastics in fish stomachs could also be explained by microplastic contamination from atmospheric deposition. Atmospheric deposition highly contributes to the pervasiveness of microplastic pollution [53], and points to more global/regional sourcing of microplastics over the local drivers we assumed were the predominant source of input. In the case of Appalachia, it could be especially relevant given the relatively rural setting. Even our “urban” sites are categorized as developed open space, developed low intensity, and developed medium intensity areas [54] and only account for an average of 8.5% of land cover across streams. Additionally, Elnahas et al., 2024 [55] details an atmospheric deposition rate of 68 microplastics daily per square meter in South Central Appalachia, indicating that atmospheric deposition could be an important driver of microplastic abundance patterns. Evidence of the transfer of these pollutants from regions of higher input to more rural areas has been identified in locations as remote as the desert [56] and Antarctica [57]. Overall, agriculture lands are highly erodible and consequently their surface layers are highly mobile, thus, microplastics of direct agricultural origin (e.g., sludge or mulch) or indirect (e.g., atmospheric deposition), are more likely to run-off into streams than plastics deposited within forested areas.
In addition to agricultural lands, a relationship appears to exist between microplastics and other variables, including E. coli, specific conductance, and fish body length. Our E. coli hypothesis (H3) appears to be supported as we observed a positive association between microplastic amounts where E. coli levels were higher. This could be due to increased sewage input, linked to increased microplastic pollution [58,59], at sites with a higher presence of E. coli. As mentioned above, most of the areas within study watersheds are rural and houses tend to rely on individual septic systems rather than centralized public wastewater treatment [60]. Septic tanks require regular maintenance and upkeep to function and subsequent pollution from poorly maintained septic tanks is well established [61,62,63]. Along with sewage nutrients and bacteria (e.g., E. coli as an indicator), laundry wastewater containing microplastic fibers could be another problematic local source.

5. Conclusions

Overall, we conclude that microplastic contamination is present and widespread in freshwater ecosystems in North Central and surrounding Appalachian regions throughout three major watersheds (the Monongahela, Cheat, and Ohio watersheds). Evidence of microplastic particles was found in 100% of the samples from the benthic northern hogsucker and the most commonly found particle type was fibers. Potential sources of microplastic pollution point to agricultural activity, wastewater treatment, and atmospheric deposition. Due to the high atmospheric presence and agricultural runoff, mitigation efforts should focus on best practices to catch microplastic loads before their entrance into local watersheds. Future studies should be conducted to further bridge identified research gaps in freshwater fishes, benthic feeders, atmospheric deposition of microplastics, the relative role of local vs. global contributors of microplastic pollution, and the relationship between types of human activity/development and microplastic abundance in local organisms.

Supplementary Materials

The following supporting information can be downloaded at: https://www.mdpi.com/article/10.3390/su17072926/s1, Table S1: Raw Data.

Author Contributions

Conceptualization, I.M.T., B.A.M. and C.C.A.; methodology, I.M.T., B.A.M. and C.C.A.; formal analysis, I.M.T., B.A.M. and C.C.A.; investigation, I.M.T.; writing—original draft preparation, I.M.T.; writing—review and editing, I.M.T., B.A.M. and C.C.A.; visualization, I.M.T., B.A.M. and C.C.A.; project administration, B.A.M. and C.C.A.; funding acquisition, B.A.M. and C.C.A. All authors have read and agreed to the published version of the manuscript.

Funding

This research received no external funding, but received partial support from the West Virginia University Research Office and the National Institute of Food and Agriculture, US Department of Agriculture, McIntire Stennis project under 1026001 (Brent A. Murry) and 1026124 (Caroline C. Arantes).

Institutional Review Board Statement

The animal study protocol was approved by the Ethics Committee of West Virginia University and State Department of Natural Resources, WV (IACUC # 2205053799, WV collection permit # 2022-283).

Informed Consent Statement

Informed consent was obtained from all subjects involved in the study.

Data Availability Statement

The original contributions presented in this study are included in the article/Supplementary Materials. Further inquiries can be directed to the corresponding authors.

Acknowledgments

We wish to acknowledge Katherine Adase and Jarrett Landreth (WVU), along with David Wellman and Dustin Smith (WV DNR) for their efforts to collect the field data and Jolie Mongeau (WVU) for creating the map. We would also like to acknowledge Kaylyn Zipp for her role in producing the methodological framework.

Conflicts of Interest

The authors declare no conflicts of interest. The funders had no role in the design of the study; in the collection, analyses, or interpretation of data; in the writing of the manuscript; or in the decision to publish the results.

Appendix A

Contamination values were reported as the type, count, mean length, and total length of particles in the same manner as the specimens. A total of 498 microplastic particles were identified in control groups, with an average of 9.05 per fish. A total of 90.16% of the identified plastics were composed of fibers, followed by 4.82% sheets, 3.41% foams, and 1.61% fragments.
Figure A1. Relationship between the average number of microplastic particles at each site in samples and control groups.
Sustainability 17 02926 g0a1
Figure A2. Relationship between the average length of microplastic particles at each site in samples and control groups. The average fragment length of the controls was 0.68 mm, with a range of 0.06 mm–7.08 mm compared to the average fragment length of the samples, which was 0.71 mm with a range of 0.04 mm–4.77 mm.
Sustainability 17 02926 g0a2
Figure A3. DHARMa’s residual vs. predicted plot indicating that there was no major violation of model’s assumptions (model MP ~ Agricultural land + Conductivity + FishTL + (1|Site)). The dots represent the residuals of the model plotted against the predicted values. The black lines represent the zero residual line, where the residuals are equal to zero. Residuals symmetrically distributed around this line indicate no strong trends. The red asterisk indicate a large residual value relative to the others.
Sustainability 17 02926 g0a3
Figure A4. DHARMa’s residual vs. predicted plot indicating that there was no major violation of model’s assumptions (model MP ~ Agricultural land + Conductivity + E. coli+ FishTL + (1|Site)). The dots represent the residuals of the model plotted against the predicted values. The black lines represent the zero residual line, where the residuals are equal to zero. Residuals symmetrically distributed around this line indicate no strong trends.
Sustainability 17 02926 g0a4
Table A1. Seven models that showed statistically significant better fits based on Likelihood Ratio Tests (LRTs). Only the two models with lowest AIC (bold) were presented in results and discussed.
ModelDfAICBICLogLiK DevianceChisqPr(>Chisq)
MP ~ Agricultural land + Conductivity+ FishTL + (1|Site)6414.2425.55−201.1402.22.0391<0.05
MP ~ Agricultural land + Conductivity + E. coli+ FishTL + (1|Site)7414.89428.13−200.44400.895.4312<0.05
MP ~ Forest + Conductivity + (1|Site)5415.45424.91−202.72405.450.6051<0.05
MP ~ Area +FishTL + (1|Site)5415.91425.37−202.95405.910.2282<0.05
MP ~ Forest + Area + (1|Site)5416.05425.51−203.03406.050.5367<0.05
MP ~ Forest +FishTL + (1|Site)5416.14425.6−203.07406.140.4234<0.05
MP ~ Agricultural land + Area+ Conductivity + E. coli+ FishTL + (1|Site)8416.81431.94−200.4400.815.3509<0.05

References

  1. Shahul Hamid, F.; Bhatti, M.S.; Anuar, N.; Anuar, N.; Mohan, P.; Periathamby, A. Worldwide distribution and abundance of microplastic: How dire is the situation? Waste Manag. Res. J. A Sustain. Circ. Econ. 2018, 36, 873–897. [Google Scholar] [CrossRef]
  2. Bajt, O. From plastics to microplastics and organisms. FEBS Open Bio 2021, 11, 954–966. [Google Scholar] [CrossRef] [PubMed]
  3. Yu, F.; Wu, J.; Wang, H.; Bao, Y.; Xing, H.; Ye, W.; Li, X.; Huang, M. Interaction of microplastics with perfluoroalkyl and polyfluoroalkyl substances in water: A review of the fate, mechanisms and toxicity. Sci. Total Environ. 2024, 948, 175000. [Google Scholar] [CrossRef] [PubMed]
  4. Salawu, O.A.; Olivares, C.I.; Adeleye, A.S. Adsorption of PFAS onto secondary microplastics: A mechanistic study. J. Hazard. Mater. 2024, 470, 134185. [Google Scholar] [CrossRef]
  5. An, L.; Liu, Q.; Deng, Y.; Wu, W.; Gao, Y.; Ling, W. Sources of Microplastic in the Environment. In Microplastics in Terrestrial Environments: Emerging Contaminants and Major Challenges; He, D., Luo, Y., Eds.; Springer International Publishing: Cham, Switzerland, 2020; pp. 143–159. [Google Scholar] [CrossRef]
  6. De Falco, F.; Gullo, M.P.; Gentile, G.; Di Pace, E.; Cocca, M.; Gelabert, L.; Brouta-Agnésa, M.; Rovira, A.; Escudero, R.; Villalba, R.; et al. Evaluation of microplastic release caused by textile washing processes of synthetic fabrics. Environ. Pollut. 2018, 236, 916–925. [Google Scholar] [CrossRef]
  7. Golwala, H.; Zhang, X.; Iskander, S.M.; Smith, A.L. Solid waste: An overlooked source of microplastics to the environment. Sci. Total Environ. 2021, 769, 144581. [Google Scholar] [CrossRef]
  8. Collard, F.; Gasperi, J.; Gabrielsen, G.W.; Tassin, B. Plastic Particle Ingestion by Wild Freshwater Fish: A Critical Review. Environ. Sci. Technol. 2019, 53, 12974–12988. [Google Scholar] [CrossRef]
  9. Blettler, M.C.M.; Abrial, E.; Khan, F.R.; Sivri, N.; Espinola, L.A. Freshwater plastic pollution: Recognizing research biases and identifying knowledge gaps. Water Res. 2018, 143, 416–424. [Google Scholar] [CrossRef]
  10. Zandaryaa, S. Freshwater Microplastic Pollution: The State of Knowledge and Research. In Plastics in the Aquatic Environment—Part I; The Handbook of Environmental Chemistry, Volume 111; Stock, F., Reifferscheid, G., Brennholt, N., Kostianaia, E., Eds.; Springer International Publishing: Cham, Switzerland, 2022; pp. 255–272. [Google Scholar] [CrossRef]
  11. Parker, B.; Andreou, D.; Green, I.D.; Britton, J.R. Microplastics in freshwater fishes: Occurrence, impacts and future perspectives. Fish Fish. 2021, 22, 467–488. [Google Scholar] [CrossRef]
  12. Bellasi, A.; Binda, G.; Pozzi, A.; Galafassi, S.; Volta, P.; Bettinetti, R. Microplastic Contamination in Freshwater Environments: A Review, Focusing on Interactions with Sediments and Benthic Organisms. Environments 2020, 7, 30. [Google Scholar] [CrossRef]
  13. Sarijan, S.; Azman, S.; Said, M.I.M.; Jamal, M.H. Microplastics in freshwater ecosystems: A recent review of occurrence, analysis, potential impacts, and research needs. Environ. Sci. Pollut. Res. 2021, 28, 1341–1356. [Google Scholar] [CrossRef]
  14. Talbot, R.; Chang, H. Microplastics in freshwater: A global review of factors affecting spatial and temporal variations. Environ. Pollut. 2022, 292, 118393. [Google Scholar] [CrossRef] [PubMed]
  15. Jang, M.; Shim, W.J.; Cho, Y.; Han, G.M.; Song, Y.K.; Hong, S.H. A close relationship between microplastic contamination and coastal area use pattern. Water Res. 2020, 171, 115400. [Google Scholar] [CrossRef] [PubMed]
  16. Choi, Y.R.; Kim, Y.-N.; Yoon, J.-H.; Dickinson, N.; Kim, K.-H. Plastic contamination of forest, urban, and agricultural soils: A case study of Yeoju City in the Republic of Korea. J. Soils Sediments 2021, 21, 1962–1973. [Google Scholar] [CrossRef]
  17. Klemmensen, N.D.R.; Sobrino Blanco, M.; Vollertsen, J. Assessing microplastic contamination in Icelandic soils: Insights from remote, agricultural, and urban environments. Sci. Total Environ. 2024, 955, 177215. [Google Scholar] [CrossRef]
  18. Simon, T.P.; Dufour, R. Development of Index of Biotic Integrity Expectations for the Ecoregions of Indiana: V. Eastern Corn Belt Plain; EPA 905-R-96-002; U.S. Environmental Protection Agency, Region V, Water Division, Watershed and Nonpoint Source Branch: Chicag, IL, USA, 1997; p. 73. [Google Scholar]
  19. Lau, J.K.; Lauer, T.E.; Weinman, M.L. Impacts of Channelization on Stream Habitats and Associated Fish Assemblages in East Central Indiana. Am. Midl. Nat. 2006, 156, 319–330. [Google Scholar] [CrossRef]
  20. Dane, H.; Şïşman, T. A morpho-histopathological study in the digestive tract of three fish species influenced with heavy metal pollution. Chemosphere 2020, 242, 125212. [Google Scholar] [CrossRef]
  21. Driehaus, E.R.; Landreth, J.; Adase, K.; Smith, D.; Wellman, D.; Arantes, C.C.; Murry, B.A. Length-Weight Relationships for 44 Central Appalachian Fish Species. J. Appl. Ichthyol. 2023, 2023, 5573054. [Google Scholar] [CrossRef]
  22. Zipp, K. Integration of Fisheries Ecology with the Assessment of Microplastic Consumption in Black Bass in the Upper Ohio River Drainage. Master’s Thesis, West Virginia University, Morgantown, WV, USA, 2022. Graduate Theses, Dissertations, and Problem Reports. Available online: https://researchrepository.wvu.edu/etd/11241 (accessed on 2 January 2025).
  23. Hajovsky, P.A. Microplastic Ingestion of Juvenile Fish in Corpus Christi Bay and Upper Laguna Madre, Texas. Ph.D. Thesis, Texas A&M University, Corpus Christi, TX, USA, 2019. Available online: https://hdl.handle.net/1969.6/87888 (accessed on 30 January 2025).
  24. Karami, A.; Golieskardi, A.; Choo, C.K.; Romano, N.; Ho, Y.B.; Salamatinia, B. A high-performance protocol for extraction of micro-plastics in fish. Sci. Total Environ. 2017, 578, 485–494. [Google Scholar] [CrossRef]
  25. Estahbanati, S.; Fahrenfeld, N.L. Influence of wastewater treatment plant discharges on microplastic concentrations in surface water. Chemosphere 2016, 162, 277–284. [Google Scholar] [CrossRef]
  26. Rochman, C.M.; Brookson, C.; Bikker, J.; Djuric, N.; Earn, A.; Bucci, K.; Athey, S.; Huntington, A.; McIlwraith, H.; Munno, K.; et al. Rethinking microplastics as a diverse contaminant suite. Environ. Toxicol. Chem. 2019, 38, 703–711. [Google Scholar] [CrossRef] [PubMed]
  27. Beckingham, B.; Apintiloaiei, A.; Moore, C.; Brandes, J. Hot or not: Systematic review and laboratory evaluation of the hot needle test for microplastic identification. Microplastics Nanoplastics 2023, 3, 8. [Google Scholar] [CrossRef]
  28. Lopes, C.; Raimundo, J.; Caetano, M.; Garrido, S. Microplastic ingestion and diet composition of planktivorous fish. Limnol. Oceanogr. Lett. 2020, 5, 103–112. [Google Scholar] [CrossRef]
  29. Gad, A.K.; Midway, S.R. Relationship of Microplastics to Body Size for Two Estuarine Fishes. Microplastics 2022, 1, 211–220. [Google Scholar] [CrossRef]
  30. Covernton, G.A.; Davies, H.L.; Cox, K.D.; El-Sabaawi, R.; Juanes, F.; Dudas, S.E.; Dower, J.F. A Bayesian analysis of the factors determining microplastics ingestion in fishes. J. Hazard. Mater. 2021, 413, 125405. [Google Scholar] [CrossRef]
  31. Brooks, M.E.; Kristensen, K.; Benthem KJ van Magnusson, A.; Berg, C.W.; Nielsen, A.; Skaug, H.J.; Mächler, M.; Bolker, B.M. glmmTMB Balances Speed and Flexibility Among Packages for Zero-inflated Generalized Linear Mixed Modeling. R J. 2017, 9, 378–400. [Google Scholar]
  32. Hartig, F. DHARMa: Residual Diagnostics for Hierarchical (Multi-Level/Mixed) Regression Models. R Package Version 0.4.7. 2024. Available online: https://github.com/florianhartig/dharma (accessed on 11 March 2025).
  33. Suaria, G.; Musso, M.; Achtypi, A.; Bassotto, D.; Aliani, S. Textile Fibres in Mediterranean Surface Waters: Abundance and Composition. In Proceedings of the 2nd International Conference on Microplastic Pollution in the Mediterranean Sea; Cocca, M., Di Pace, E., Errico, M.E., Gentile, G., Montarsolo, A., Mossotti, R., Avella, M., Eds.; Springer International Publishing: Cham, Switzerland, 2020; pp. 62–66. [Google Scholar] [CrossRef]
  34. Gago, J.; Carretero, O.; Filgueiras, A.V.; Viñas, L. Synthetic microfibres in the marine environment: A review on their occurrence in seawater and sediments. Mar. Pollut. Bull. 2018, 127, 365–376. [Google Scholar] [CrossRef]
  35. Sanchez-Vidal, A.; Thompson, R.C.; Canals, M.; De Haan, W.P. The imprint of microfibres in southern European deep seas. PLoS ONE 2018, 13, e0207033. [Google Scholar] [CrossRef]
  36. McNeish, R.E.; Kim, L.H.; Barrett, H.A.; Mason, S.A.; Kelly, J.J.; Hoellein, T.J. Microplastic in riverine fish is connected to species traits. Sci. Rep. 2018, 8, 11639. [Google Scholar] [CrossRef]
  37. Pazos, R.S.; Maiztegui, T.; Colautti, D.C.; Paracampo, A.H.; Gómez, N. Microplastics in gut contents of coastal freshwater fish from Río de la Plata estuary. Mar. Pollut. Bull. 2017, 122, 85–90. [Google Scholar] [CrossRef]
  38. Wagner, J.; Wang, Z.-M.; Ghosal, S.; Murphy, M.; Wall, S.; Cook, A.-M.; Robberson, W.; Allen, H. Nondestructive Extraction and Identification of Microplastics from Freshwater Sport Fish Stomachs. Environ. Sci. Technol. 2019, 53, 14496–14506. [Google Scholar] [CrossRef] [PubMed]
  39. Zhang, L.; Xie, Y.; Zhong, S.; Liu, J.; Qin, Y.; Gao, P. Microplastics in freshwater and wild fishes from Lijiang River in Guangxi, Southwest China. Sci. Total Environ. 2021, 755, 142428. [Google Scholar] [CrossRef] [PubMed]
  40. Dalu, T.; Themba, S.T.; Dondofema, F.; Wu, N.; Munyai, L.F. Assessing microplastic abundances in freshwater fishes in a subtropical African reservoir. Discov. Sustain. 2024, 5, 360. [Google Scholar] [CrossRef]
  41. Khan, H.S.; Hasan, J.; Manik, M.; Farukh, M.A.; Shahjahan, M. Pervasiveness of microplastics in the gastrointestinal tract of some selected fish species from Turag River alongside the capital city of Bangladesh. Emerg. Contam. 2024, 10, 100309. [Google Scholar] [CrossRef]
  42. Al Mudhar, M.H.I.; Sumberartha, I.W.; Hassan, Z.; Rahmansyah, M.S.; Tamalene, M.N. Examination of Microplastic Particles in Reef Fish Food in Ternate Island Waters, Indonesia. Jordan J. Biol. Sci. 2021, 14, 853–858. [Google Scholar] [CrossRef]
  43. Bosshart, S.; Erni-Cassola, G.; Burkhardt-Holm, P. Independence of microplastic ingestion from environmental load in the round goby (Neogobius melanostomus) from the Rhine river using high quality standards. Environ. Pollut. 2020, 267, 115664. [Google Scholar] [CrossRef]
  44. Corradini, F.; Casado, F.; Leiva, V.; Huerta-Lwanga, E.; Geissen, V. Microplastics occurrence and frequency in soils under different land uses on a regional scale. Sci. Total Environ. 2021, 752, 141917. [Google Scholar] [CrossRef]
  45. Zhang, Y.; Wang, K.; Chen, W.; Ba, Y.; Khan, K.; Chen, W.; Tu, C.; Chen, C.; Xu, L. Effects of land use and landscape on the occurrence and distribution of microplastics in soil, China. Sci. Total Environ. 2022, 847, 157598. [Google Scholar] [CrossRef]
  46. Oza, J.; Rabari, V.; Yadav, V.K.; Sahoo, D.K.; Patel, A.; Trivedi, J. A Systematic Review on Microplastic Contamination in Fishes of Asia: Polymeric Risk Assessment and Future Prospectives. Environ. Toxicol. Chem. 2024, 43, 671–685. [Google Scholar] [CrossRef]
  47. Milne, M.H.; Helm, P.A.; Munno, K.; Bhavsar, S.P.; Rochman, C.M. Microplastics and Anthropogenic Particles in Recreationally Caught Freshwater Fish from an Urbanized Region of the North American Great Lakes. Environ. Health Perspect. 2024, 132, 077004. [Google Scholar] [CrossRef]
  48. Horton, A.A.; Jürgens, M.D.; Lahive, E.; Van Bodegom, P.M.; Vijver, M.G. The influence of exposure and physiology on microplastic ingestion by the freshwater fish Rutilus rutilus (roach) in the River Thames, UK. Environ. Pollut. 2018, 236, 188–194. [Google Scholar] [CrossRef] [PubMed]
  49. Pérez-Guevara, F.; Roy, P.D.; Kutralam-Muniasamy, D.; Shruti, V.C. Cover of microplastic data underreporting and progress toward standardization. Sci. Total Environ. 2022, 829, 154727. [Google Scholar] [CrossRef]
  50. Chen, H.; Jia, Q.; Zhao, X.; Li, L.; Nie, Y.; Liu, H.; Ye, J. The occurrence of microplastics in water bodies in urban agglomerations: Impacts of drainage system overflow in wet weather, catchment land-uses, and environmental management practices. Water Res. 2020, 183, 116073. [Google Scholar] [CrossRef] [PubMed]
  51. Adhikari, S.; Kelkar, V.; Kumar, R.; Halden, R.U. Methods and challenges in the detection of microplastics and nanoplastics: A mini-review. Polym. Int. 2022, 71, 543–551. [Google Scholar] [CrossRef]
  52. Rolsky, C.; Kelkar, V.; Driver, E.; Halden, R.U. Municipal sewage sludge as a source of microplastics in the environment. Curr. Opin. Environ. Sci. Health 2020, 14, 16–22. [Google Scholar] [CrossRef]
  53. Klein, M.; Bechtel, B.; Brecht, T.; Fischer, E.K. Spatial distribution of atmospheric microplastics in bulk-deposition of urban and rural environments—A one-year follow-up study in northern Germany. Sci. Total Environ. 2023, 901, 165923. [Google Scholar] [CrossRef]
  54. Jin, S.; Dewitz, J.; Danielson, P.; Granneman, B.; Costello, C.; Smith, K.; Zhu, Z. National Land Cover Database 2019, A New Strategy for Creating Clean Leaf-On and Leaf-Off Landsat Composite Images. J. Remote Sens. 2023, 3, 0022. [Google Scholar] [CrossRef]
  55. Elnahas, A.; Gray, A.; Lee, J.; AlAmiri, N.; Pokhrel, N.; Allen, S.; Foroutan, H. Atmospheric Deposition of Microplastics in South Central Appalachia in the United States. ACS EST Air 2025, 2, 64–72. [Google Scholar] [CrossRef]
  56. Wang, F.; Lai, Z.; Peng, G.; Luo, L.; Liu, K.; Huang, X.; Xu, Y.; Shen, Q.; Li, D. Microplastic abundance and distribution in a Central Asian desert. Sci. Total Environ. 2021, 800, 149529. [Google Scholar] [CrossRef]
  57. Illuminati, S.; Notarstefano, V.; Tinari, C.; Fanelli, M.; Girolametti, F.; Ajdini, B.; Scarchilli, C.; Ciardini, V.; Iaccarino, A.; Giorgini, E.; et al. Microplastics in bulk atmospheric deposition along the coastal region of Victoria Land, Antarctica. Sci. Total Environ. 2024, 949, 175221. [Google Scholar] [CrossRef]
  58. Sun, X.; Jia, Q.; Ye, J.; Zhu, Y.; Song, Z.; Guo, Y.; Chen, H. Real-time variabilities in microplastic abundance and characteristics of urban surface runoff and sewer overflow in wet weather as impacted by land use and storm factors. Sci. Total Environ. 2023, 859, 160148. [Google Scholar] [CrossRef] [PubMed]
  59. Kunz, A.; Schneider, F.; Anthony, N.; Lin, H.-T. Microplastics in rivers along an urban-rural gradient in an urban agglomeration: Correlation with land use, potential sources and pathways. Environ. Pollut. 2023, 321, 121096. [Google Scholar] [CrossRef] [PubMed]
  60. Goldstein, L. To Build a Septic System an Analysis of EPA’s New Environmental Justice Policies for Rural Communities Lacking Adequate Wastewater Sanitation. Georget. Environ. Law Rev. 2023, 36, 131–164. [Google Scholar]
  61. Withers, P.J.A.; May, L.; Jarvie, H.P.; Jordan, P.; Doody, D.; Foy, R.H.; Bechmann, M.; Cooksley, S.; Dils, R.; Deal, N. Nutrient emissions to water from septic tank systems in rural catchments: Uncertainties and implications for policy. Environ. Sci. Policy 2012, 24, 71–82. [Google Scholar] [CrossRef]
  62. Withers, P.J.; Jordan, P.; May, L.; Jarvie, H.P.; Deal, N.E. Do septic tank systems pose a hidden threat to water quality? Front. Ecol. Environ. 2014, 12, 123–130. [Google Scholar] [CrossRef]
  63. Richards, S.; Paterson, E.; Withers, P.J.A.; Stutter, M. Septic tank discharges as multi-pollutant hotspots in catchments. Sci. Total Environ. 2016, 542, 854–863. [Google Scholar] [CrossRef]
Figure 1. Study Area: Sites are numbered: 1. Wheeling Creek, 2. Fishing Creek, 3. Pawpaw Creek, 4. West Fork, 5. Deckers Creek, 6. Big Sandy Creek, and 7. Dry Fork. Watersheds are color coded: highlighted green is the Ohio River Basin, yellow is the Monongahela River Basin, and blue is the Ohio River Basin.
Sustainability 17 02926 g001
Figure 2. Average microplastic particle length at each site. Stream names are indicated as part of the site names and watersheds they belong to are indicated in legend (blue columns belong to the Cheat River Watershed, yellow to the Monongahela River, and green to the Ohio River).
Sustainability 17 02926 g002
Figure 3. (A) Relationship between average length of microplastic particles and fish total length; (B) relationship between microplastic particle total length and fish total length; and (C) relationship between number of microplastic particles and fish total length.
Sustainability 17 02926 g003
Figure 4. Average number of microplastic particles found in fish GI tracts at each site. Stream names are indicated as part of the site names and watersheds they belong to are indicated in legend (blue columns belong to the Cheat River Watershed, yellow to the Monongahela River, and green to the Ohio River). Different letters denote statistically significant differences between groups.
Sustainability 17 02926 g004
Figure 5. Plots of effects of environmental factors on microplastics particle counting in northern hogsucker for the best (A) and second best (B) models.
Sustainability 17 02926 g005
Table 1. Environmental variable measurements per stream, including percent developed land, percent forested land, percent agricultural land, area of the site (km2), mean specific conductance (S), and E. coli (colony forming units (CFU)/100 mL) levels. Data for West Fork are not included because they are unavailable.
Site% Developed% Forested% AgriculturalArea (km2)Mean Specific Conductance (S)Mean E. coli Levels (CFU/100 mL)
Dry Fork4.6689.523.44129.060.099620.9
Big Sandy6.375.2817.26538.3230.1283208.73
Pawpaw7.5381.0113.55108.4840.4472526.45
Wheeling11.0770.9416.38770.9440.540643.85
Deckers17.1364.7516.49163.4870.2969114.7
Fishing4.6491.752.57565.4470.2026711.25
Table 2. Descriptive values from eight studies analyzing microplastics in the GI tracts of freshwater fish globally. Location, species, mean (items/individual), range (items/individual), occurrence (% of fish GI tracts containing microplastics), separation method, identification method, and source are included. VI—Visual Inspection, FTIR—Fourier Transform Infrared Spectroscopy, HN—hot needle test, CM—color morphology, and RS—Raman Spectroscopy. It is important to note that due to diversity in morphology/composition of microplastics, we lack standardized protocols for sampling as well as methods for extraction, identification, and quantification [47]. Thus, separation and identification techniques are included as possible factors influencing abundances across studies.
LocationSpeciesMean Count (Items/Individual)Range (Items/Individual)Occurrence (%)SeparationIdentificationSource
Lake Huron, USSalvelinus fontinalis0.40–237Pulsed Ultrasonic ExtractionVI, FTIRWagner et al., 2019 [38]
Lake Ontario, USOncorhynchus mykiss0.5
Lake Erie, USMicropterus dolomieu0.7
Lijiang River, CNCyprinus carpio0.40.3–18130% H2O2VI, μ-FTIRZhang et al., 2021 [39]
Pelteobagrus fulvidraco0.3
Mystus macropterus1
Pelteobagrus vachelli0.4
Point Marion (Spring 2020), USMicropterus dolomieu6017–17010010% KOHVI, HNZipp, 2022 [22]
Micropterus salmoides6912–227
Micropterus punctulatus275–102
Morgantown (Spring 2020), USMicropterus dolomieu5416–110
Micropterus salmoides3711–75
Micropterus punctulatus317–76
Opekiska (Spring 2020), USMicropterus dolomieu4412–101
Micropterus salmoides5722–165
Micropterus punctulatus247–52
Point Marion (Fall 2019), USMicropterus dolomieu585–281
Micropterus salmoides6320–191
Micropterus punctulatus4411–153
Nandoni Resevoir, ZAMicropterus punctulatus5.60–2586.655% HNO3VI, CMDalu et al., 2024 [40]
Oreochromis mossambicus12.30–39
Coptodon rendalli11.41–68
Micropterus salmoides29.311–40
Micropterus punctulatus135–23
Tilapia sparrmanii5.30–19
Chiloglanis paratus0.50–3
Labeo cylindricus25.42–47
Lake Ontario, CABrown bullhead930–140010020% KOH, density separation, Fe(II)SO4, Fe(II)SO4 heptahydrate, 30% H2O2, density separation with CaCl2, 10% Alcojet detergent solutionVI, RS, μ-FTIRMilne et al., 2024 [47]
White sucker
Micropterus salmoides
Micropterus dolomieu
Ambloplites rupestris
Esox lucius
Basel, DENegobius melanstomus000ATL BufferVI, FTIRBosshart et al., 2020 [43]
Thames River, UKRutilus rutilus0.60–633NoneVI, RSHorton et al., 2018 [48]
Big Sandy downstream, USHypentelium nigricans116.2227–27410010% KOHVI, HNthis paper
Big Sandy upstream, US3225–84
Dry Fork, US23.7517–31
Decker’s, US23.517–35
Pawpaw, US52.3344–62
West Fork, US22.6714–30
Fishing downstream, US19.1313–30
Fishing upstream, US20.868–27
Wheeling, US17.7513–24
Disclaimer/Publisher’s Note: The statements, opinions and data contained in all publications are solely those of the individual author(s) and contributor(s) and not of MDPI and/or the editor(s). MDPI and/or the editor(s) disclaim responsibility for any injury to people or property resulting from any ideas, methods, instructions or products referred to in the content.

