Article

Biostimulants Do Not Mitigate the Effects of Pasture Dieback in the Australian Wet Subtropics

1
Faculty of Science and Engineering, Southern Cross University, 1 Military Rd, Lismore, NSW 2480, Australia
2
New South Wales Department of Primary Industries and Regional Development, 4 Marsden Park Rd, Tamworth, NSW 2568, Australia
*
Author to whom correspondence should be addressed.
Sustainability 2025, 17(7), 3013; https://doi.org/10.3390/su17073013
Submission received: 5 March 2025 / Revised: 25 March 2025 / Accepted: 25 March 2025 / Published: 28 March 2025

Abstract

:
Pasture dieback is a disorder that causes the deterioration and death of susceptible tropical grass pastures in Eastern Australia. Previous reports from the Australian dry subtropics have suggested that biostimulants may be effective in mitigating the effects of pasture dieback. In this study, in two experiments (1 and 2), biostimulant products were applied to dieback-affected pastures, and pasture growth biomass and nutritional attributes (neutral detergent fiber and crude protein) were assessed 30 days after application compared to a control (water application only) treatment. In a third experiment (exp 3), biostimulant products were applied to a pasture prior to dieback incursion, and plant symptoms were assessed 16 days after application. In experiments 1 and 2, after 30 days, there was no significant difference in biomass production or nutritional attributes between any biostimulant treatments and the control, with mean biomass yields of 471 ± 61 kg ha−1 at site 1 and 1371 ± 78 kg ha−1 at site 2. In experiment 3, plant dieback symptoms progressed evenly across all plots, with no significant effect between treatments 16 days after treatment application. There was no evidence that the tested biostimulants were effective in preventing the spread of dieback or improving pasture recovery from dieback.

1. Introduction

Pasture dieback is a condition that affects tropical pasture grasses, inhibiting plant growth and often leading to plant death [1]. The disorder appears as yellowing or reddening in mature leaves [2], which can ultimately cause the gradual death of susceptible grass species, decreasing pasture productivity and significantly reducing feed availability [1]. Numerous pasture species are impacted, including buffel grass (Cenchrus ciliaris L.), panic grass (Megathyrsus maximus [Jacq.] B.K. Simon and S.W.L. Jacobs), creeping bluegrass (Bothriochloa insculpta [Hochst. ex A. Rich.] A. Camus), and multiple paspalum species (Paspalum spp.) [1,3]. Pasture dieback is associated with the presence of pasture mealybug (Heliococcus summervillei; Brookes, 1978 [4]) [5], although the exact cause of the disease remains contentious.
The current outbreak of the condition was reported in the state of Queensland, Australia, in 2012 and was estimated to potentially have affected over 4 million ha by 2019 [6]. Pasture dieback has continued to spread in Queensland [7] and south into the state of New South Wales (NSW), where it continues to spread southward [8,9,10]. The NSW north coast region typically experiences warm and humid weather conditions, which are favorable for the growth of tropical perennial grasses, including Rhodes grass (Chloris gayana Kunth), setaria (Setaria sphacelata [Schumach.] Stapf and C.E. Hubb.) and kikuyu (Cenchrus clandestinus [Hochst. ex Chiov.] Morrone). These grasses are important for the red meat and dairy industries on the north coast and are also susceptible to pasture dieback [1,9].
A range of management options have been trialed to restore pasture production after pasture dieback incursion. These include burning, fertilizing, and renovating affected pastures; re-seeding with more tolerant grasses; and spraying various chemicals. However, success has been varied [11]. In addition, several studies from the state of Queensland have suggested that biostimulants can mitigate the effects of pasture dieback and/or help pasture recovery [12,13,14,15].
A biostimulant is a compound administered to plants aimed at enhancing growth and/or stress tolerance through means other than providing essential plant nutrients [16]. Studies conducted in central Queensland reported an improvement in pasture productivity when the commercial biostimulant products RC3 (active ingredients: trimercapto-S-triazine and potassium [K] humate), sea minerals, and K humate were applied to dieback-affected land [12,13,14]. However, the mechanisms by which these products mitigate the effects of pasture dieback are unclear, and whether such products can reduce the impacts of pasture dieback or assist in pasture recovery from pasture dieback in other environments is unknown. This study, therefore, examined the effects of a range of commercial biostimulant products on (i) plant growth and the recovery of grass pastures on dieback-affected land (experiments 1 and 2) and (ii) their effectiveness in preventing an incursion of pasture dieback (experiment 3). The hypothesis was that biostimulant products can reduce the initial impact of pasture dieback and improve pasture recovery in dieback-affected land in a wet, subtropical environment. Their effectiveness would provide an option for managing pasture dieback and restoring productivity in NSW.

2. Materials and Methods

2.1. Experimental Sites

Three field experiments were conducted during the summer–autumn of 2023–24 on commercial grazing properties in northeast NSW, Australia. Experiments 1 and 2 were established on the same farm near the town of Alstonville, NSW, Australia, in adjacent paddocks. The third experiment was established at a farm in Yorklea, about 10 km from Casino, NSW, Australia. Select physicochemical properties of the 0–10 cm layer of soil and the soil classification for each site are shown in Table 1. Monthly and long-term average rainfall and temperature data were obtained from Bureau of Meteorology (BOM) automatic weather stations located at Lismore Airport, NSW (station number 058214, 17 km from sites 1 and 2) and Casino Airport (station number 058208, 8 km from Site 3).
Prior to dieback, both paddocks at Alstonville consisted of a diverse mix of grass species, including setaria, kikuyu, Rhodes grass, and broadleaf paspalum (Paspalum mandiocanum Trin.). Pasture dieback impacted the paddocks in 2021, resulting in significant grass death and subsequent broadleaf weed invasion. Prior to dieback, the pasture at experiment 3 (Yorklea) was predominantly Rhodes grass and creeping bluegrass. Symptoms of pasture dieback were first observed in 2022.

2.1.1. Experiment 1

Following the incursion of pasture dieback in 2021, the paddock was periodically grazed by steers without management interventions (no re-sowing, fertilization, or herbicide use) until November 2023, when the experiment was established. In the first week of November 2023, two weeks prior to treatment application, the paddock was slashed to a 5 cm height, and a botanical composition survey categorizing pasture species was conducted. The groundcover percentage of each species present was estimated in five quadrats (0.5 m × 0.5 m) located 1 m apart along the center of the long axis of each plot. Across the experimental area, Setaria and blue couch (Digitaria didactyla Willd.) were the most prevalent, comprising 31% and 26% of groundcover, respectively. Other species included broadleaf weeds at 13%, paspalum (Paspalum dilatatum Poir.) at 4%, white clover (Trifolium repens L.) at 3%, Mullumbimby couch (Cyperus brevifolius Endl. ex Hassk.) at 1.5%, and signal grass (Urochloa decumbens (Stapf) R.D. Webster syn. Brachiaria decumbens Stapf) at 1.5% groundcover. The remaining 20% was bare ground.
The experiment utilized a randomized block design with nine treatments and ten replicates, and each plot measured 15 m2 (3 m × 5 m). Biostimulant products were Green Earth Technology RC3 (https://greenearthtechnology.com.au, accessed on 12 December 2024), Green Earth Technology Humate Mix, Green Earth Technology Sea Mineral Mix, Seasol® Commercial seaweed concentrate (https://seasolhortandag.com, accessed on 12 December 2024), South Pacific Marine Minerals SeaEnergy (https://www.seaenergy.com.au/, accessed on 12 December 2024), and Omnia K-humate® 26% (https://www.omnia.com.au, accessed on 12 December 2024) and a combination of RC3, humate mix, and sea mineral mix (mixed treatment, herein referred to as Mixed). The other two treatments were a liquid fertilizer, Express® NPK (https://ecogrowth.com.au, accessed on 12 December 2024), and an untreated control (1 L water per plot). The recommended rate of each biostimulant product was mixed with distilled water and made up to 1 L plot−1, and treatments were applied using a pressured Nylex 5 L heavy-duty backpack sprayer (Nylex, Doncaster, Australia) with a single nozzle on 7 November 2023. The ‘Mixed’ treatment received further applications of RC3, Humate Mix, and Sea Mineral Mix on 14 November, 24 November, and 28 November 2023 (total, 4 applications). Control plots were also treated with 1 L of distilled water on these dates. Rates and nutrients supplied by each product are noted in Table 2.
Pasture biomass was harvested on 7 December 2023, 30 days after initial application, using a push mower and catcher. Whole plots were mown to 7 cm in height, and the entire harvested biomass was weighed in a tub on scales in the field. A subsample of around 1 kg was taken, weighed, and then stored in an insulated container with ice bricks before being transported to the laboratory at Southern Cross University, Lismore. Subsamples were dried in an oven at 70 °C for 96 h, with the dry weights used to back-calculate whole-plot dry matter yields. Dried samples were stored in the dark at 24 °C prior to the assessment of nutritional attributes.

2.1.2. Experiment 2

After pasture dieback became apparent in 2021, the paddock was regularly grazed by steers. The paddock was sown with oats (Avena sativa L.) and barley (Hordeum vulgare L.) in March 2022 and re-sown with a mix of setaria and signal grass in May 2023. The paddock was largely volunteer oats and barley throughout winter 2023, with the emergence of tropical grasses observed in October/November 2023. The field experiment was set up in March 2024. A relatively uniform area was selected and divided into 72 plots. A botanical survey was conducted using the same procedure described in experiment 1. Setaria accounted for 49% of groundcover, and the remainder was broadleaf weeds (16%), blue couch (14%), signal grass (11%), Rhodes grass (4%), and bare ground (7%). Restricted randomization was carried out using the R package DIGGer (https://nswdpibiom.org/austatgen/software/, accessed on 12 December 2024) [18,19] to select 54 of the 72 plots that had a high proportion of setaria and a low proportion of couch grass. This was meant to minimize the chance that the different tolerances of these species to pasture dieback did not confound the results. An optimum randomization of nine treatments with six replicates was determined, and five design options were developed. GenStat was used to test the significance of treatment allocations for each ‘botanical composition’ category. There were no significant differences (p < 0.05) for any category across the five designs, indicating effective randomization. The design with the least significance was chosen for the study, therefore representing restricted randomization, as opposed to the uniform randomized block design used in experiment 1.
The biostimulant products and water control treatment used in experiment 1 were applied to the 3 m × 5 m treatment plots in experiment 2. All treatments were applied using the methods described in experiment 1. The biostimulants were applied on 8 March 2024, with subsequent applications in the ‘Mixed’ treatment on 14 March, 22 March, 28 March, and 3 April 2024 (total, 5 applications).
Whole-plot biomass was harvested on 11 April 2024 using a mower and a catcher as per experiment 1. Fresh weight was recorded, and a subsample of around 1 kg was taken and weighed. Subsamples were dried in an oven at 70 °C for at least 96 h until constant weight. Subsample dry weights were used to calculate whole-plot dry matter yields and then stored in the dark at 24 °C for assessment of nutritional attributes.

2.1.3. Experiment 3

Pasture dieback was first observed at one end of the paddock in March 2023. The dominant grass species was creeping bluegrass, with a small proportion of Rhodes grass. The paddock was rotationally grazed by cattle. A 1500 m2 area was chosen on a slope approximately 10 m outside the progressing pasture dieback-affected area with the aim of aligning the experiment directly in the path of progressive disease encroachment.
On 26 April 2024, pasture dieback severity was assessed by scoring dieback symptoms using a scale ranging from 1 (no symptoms) to 10 (plant death) (Figure 1) at 20 random locations across the site. Pasture mealybugs were also surveyed at these locations. Plant and soil samples were collected at each point using a 25 cm × 25 cm quadrat. All plant material in the quadrat was cut at ground level with shears, and 500 g of soil was sampled to a depth of 10 cm from the center of the quadrat. Plant and soil samples were placed in separate plastic zip-lock bags and stored in an insulated container in the field before being transferred to a laboratory at Southern Cross University Lismore for analysis. The number of pasture mealybugs was counted for both plant and soil material under a bright fluorescent light lamp with a 10x magnifying lens and recorded for each sample. The survey indicated the presence of mealybugs (average 245 mealybugs m−2), although there were no dieback symptoms (overall site dieback score = 1). The experimental site was thus established in this area.
The experiment was established on 13 May 2024, with 9 treatments in a randomized block design with 10 replicates. Seven biostimulant products, two fertilizers, and a control were assigned to the 90 plots, each measuring 3 m × 5 m. Treatments were applied using the same methods as experiments 1 and 2, with a subsequent application of products in the ‘Mixed’ treatment occurring on 21 May 2024 (total, 2 applications). Plots were scored for pasture dieback symptoms on 29 May 2024, 16 days after the initial application of treatments.

2.2. Assessment of Nutritional Attributes

Biomass subsamples collected from experiments 1 and 2 were assessed for crude protein (CP) and neutral detergent fiber (NDF) concentrations. Analyses were performed using near-infrared reflectance spectroscopy (NIRS). Dried tissue samples were ground using a mill to pass through a 1 mm diameter sieve. Ground samples were scanned with a NeoSpectra Scan™ device (© 2024 SWS software, Curridabat, Costa Rica), and CP and NDF were predicted.

2.3. Climatic Conditions

Experiments 1 and 2 received >140 mm over the 4-week duration of the experiments (Table 3). Daily maximum temperatures ranged from 23 to 28 °C, and daily minimums ranged from 15 to 20 °C (Table 3). Experiment 3 received around 100 mm. Daily maximum temperatures ranged from 18 to 27 °C, while minimum temperatures ranged from 8 to 17 °C. Rainfall, average minimum temperatures, and maximum temperatures over the experiment duration at all sites were similar to the long-term averages for that period of the year (Table 3).

2.4. Statistical Analysis

The biomass and nutritional data from experiments 1 and 2 were independently subjected to a one-way analysis of variance (ANOVA) [20] (GenStat 29.0) to determine if biostimulants significantly affected plant growth or pasture nutritional attributes post-application, with block as a random effect. Block had no effect on dry matter yield in experiment 1 or nutritional attributes in either experiment. However, there was an effect in experiment 2 on dry matter yield (p < 0.05). Subsequent testing showed there was no interaction between block and treatment on dry matter yield. For experiment 3, the range in symptom scores assessed 16 days after initial treatment was not significant. Therefore, a one-sample t-test was used to examine if the symptom score for each treatment was statistically different from the initial site score of 1.

3. Results

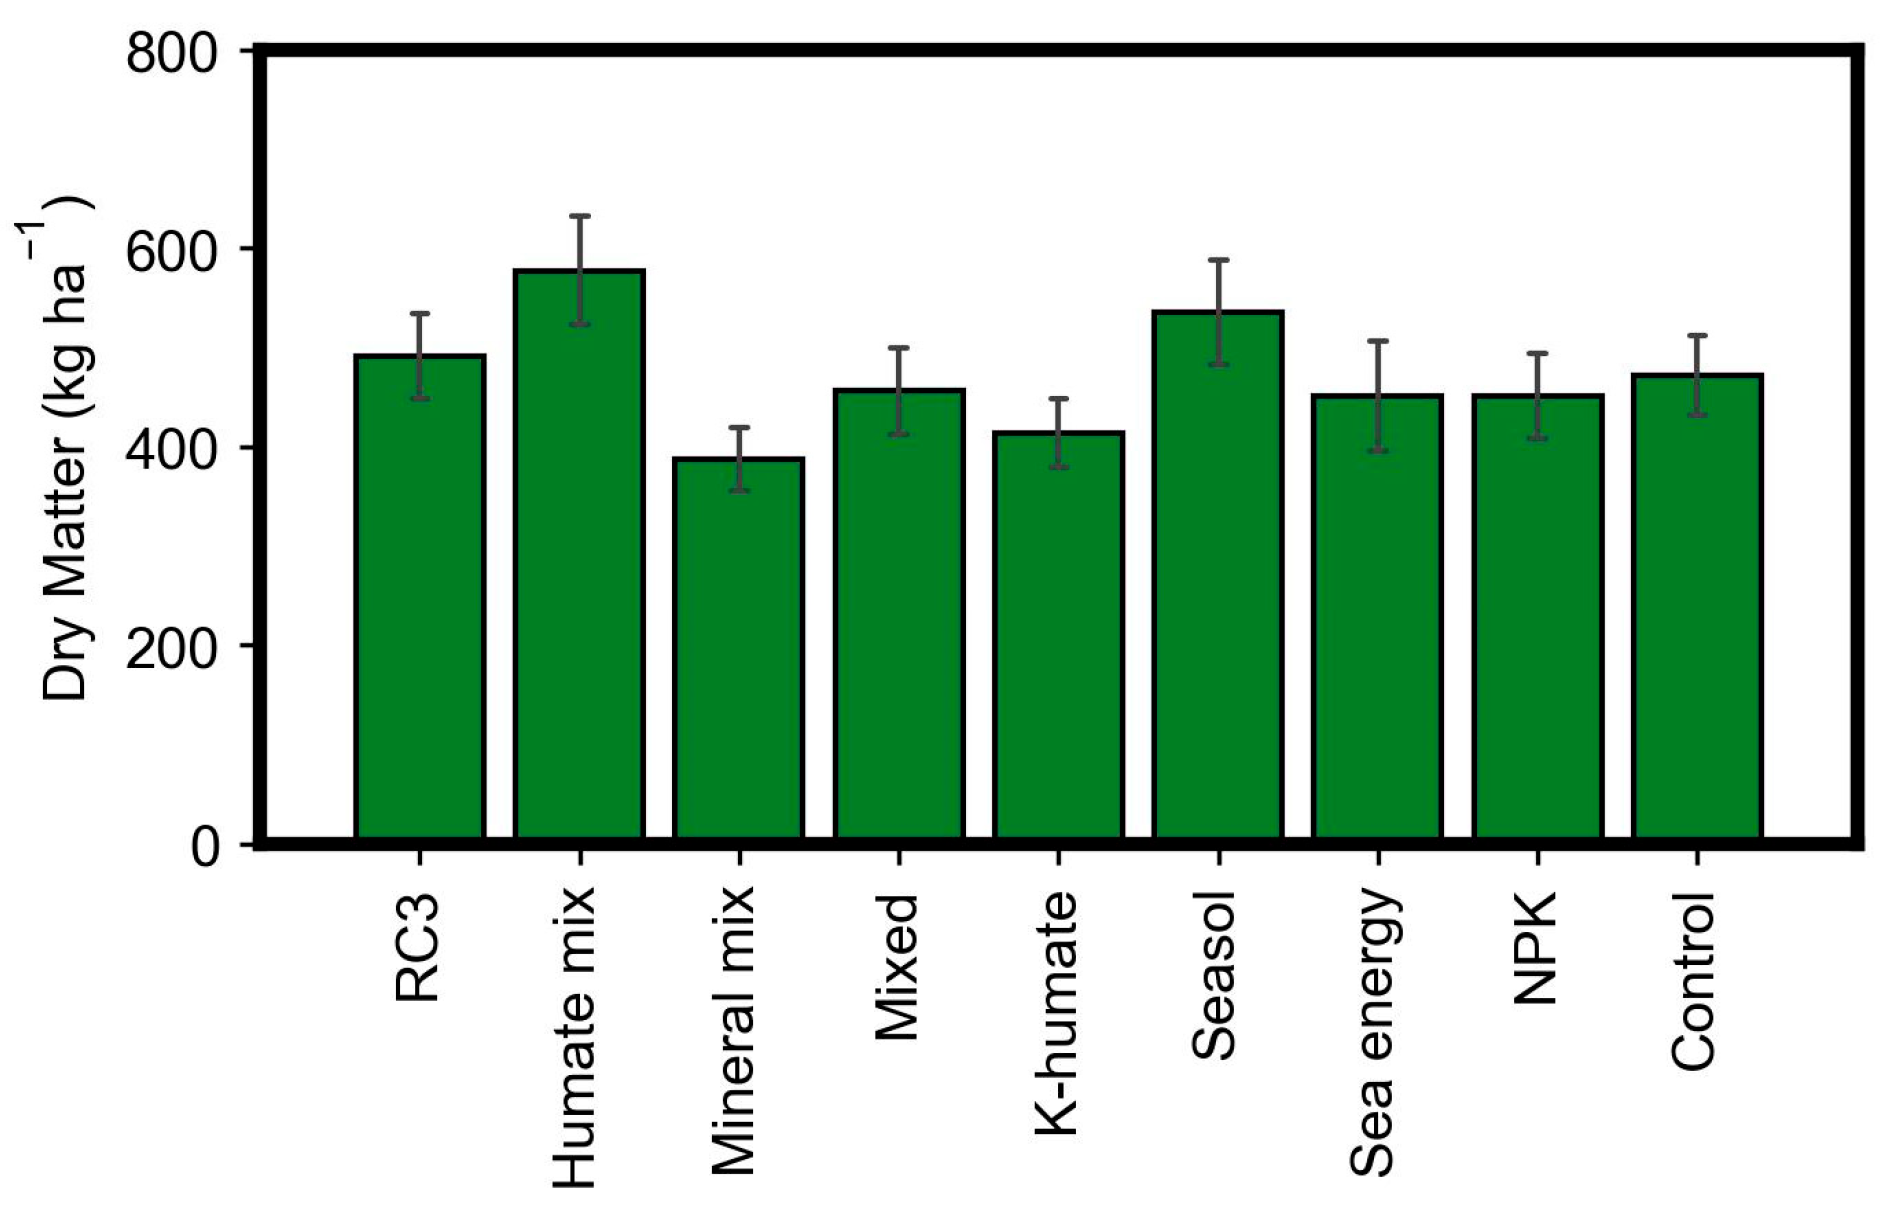
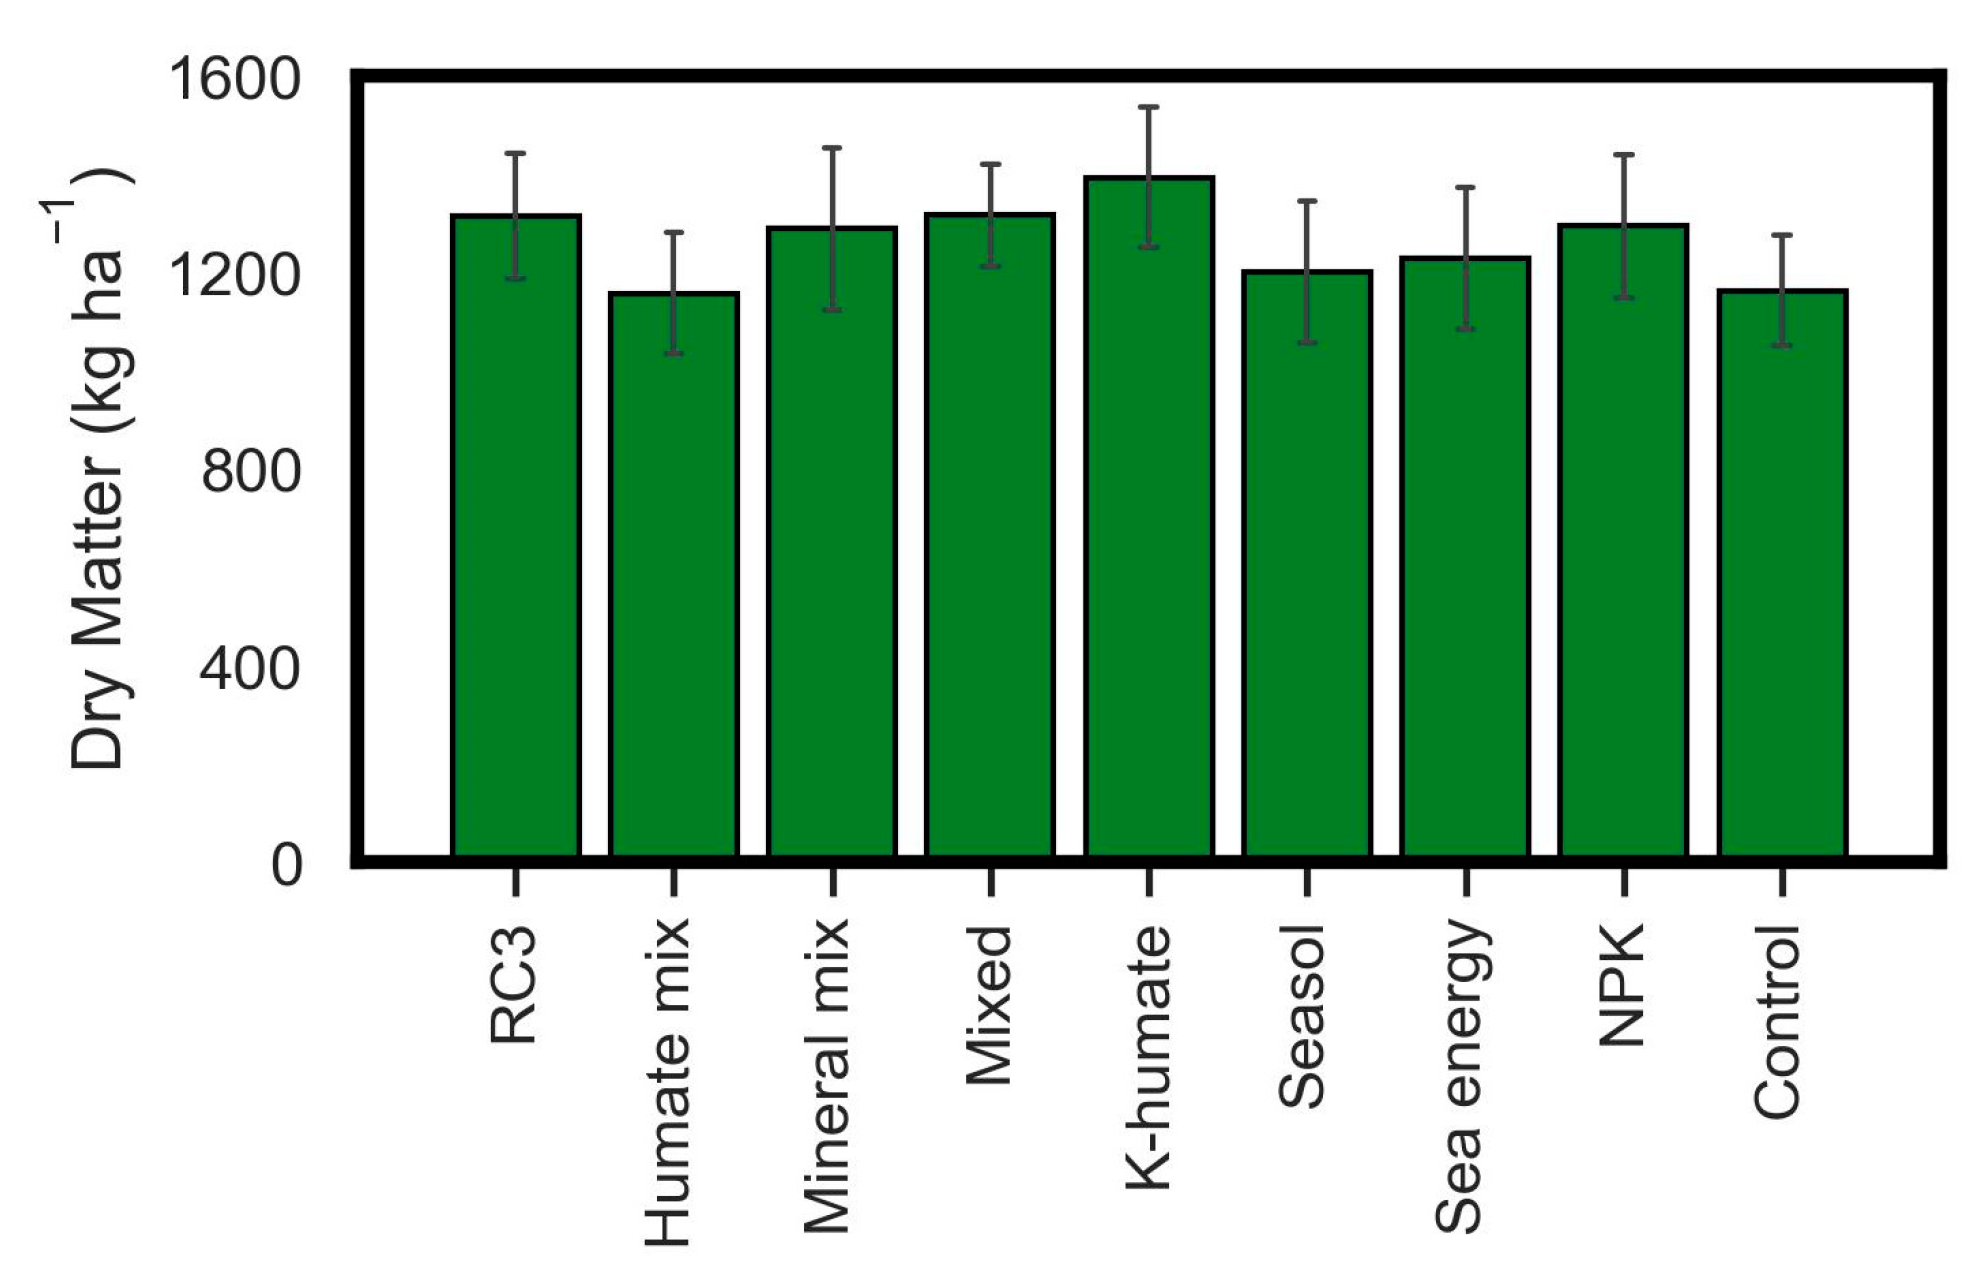
There was no significant difference between treatments for pasture biomass yield in experiments 1 or 2 at 30 days after biostimulant application (experiment 1: p = 0.12; experiment 2: p = 0.89). The mean pasture biomass in experiment 1 was 471 ± 61 kg DM ha−1 (mean ± SE), while the pasture in experiment 2 yielded 1371 ± 78 kg DM ha−1 (Figure 2 and Figure 3, respectively). Similarly, biostimulants had no significant effect on either CP (p = 0.293) or NDF (p = 0.872) concentrations. In experiment 1, CP concentrations ranged from 9% to 13%, while NDF ranged from 45% to 63%. In experiment 2, the ranges of CP and NDF were smaller; CP ranged from 10–13%, and NDF ranged from 58 to 59%.
In experiment 3, all plots showed pasture dieback symptoms 16 days after initial biostimulant application. However, no treatment had any significant effects on symptom scores (p = 0.99), with mean scores ranging from 4.1 to 4.7 (Figure 4).

4. Discussion

Despite good seasonal conditions, none of the biostimulant products or mixes tested affected pasture recovery from dieback (experiments 1 and 2). Similarly, the biostimulants did not reduce the development of pasture dieback symptoms during an initial incursion (experiment 3). Therefore, the hypothesis that biostimulant products could improve pasture recovery from dieback (experiments 1 and 2) and minimize the impact of initial pasture dieback incursion (experiment 3) was not supported by the experimental data.
At first glance, our findings appear to be at odds with those from studies conducted in central Queensland. Whitton et al. [12,13,14] reported that K-humate, sea minerals, and the same RC3 growth promotant used in our study assisted pasture recovery from dieback. However, studies that tested RC3 [12] and sea minerals [13] also found that the biomass production of a pasture sprayed with these biostimulants was not significantly greater than the control 20 weeks and 11 months after treatment application. Thus, our data are in fact consistent with those of Whitton et al. [12,13], in that the biostimulant products did not improve pasture recovery in dieback-affected lands compared to the control treatments.
The literature indicates that there can be productivity benefits to forage grasses from biostimulant application [21], so the lack of response from both pasture growth and nutritional attributes could be due to product application rates or specific environmental conditions. However, the recommended rates were applied, including a mix that was applied repeatedly, so this is unlikely to be the issue. Additionally, the environmental conditions (Table 3) were favorable for pasture growth. It is recognized that while the benefits of biostimulants on plant growth have been extensively researched, their mechanism(s) of action is not always understood [16,21]. It has been suggested that the optimal dose should be determined for individual grass species, as excessive quantities of biostimulants can result in toxic effects [21]; however, even the biomass yield of the pasture that received repeated applications of the mix of three products (the Mixed treatment) was not significantly different from the control, suggesting that neither a stimulative nor toxic effect occurred. Dose–response experiments for biostimulant products may be warranted to attempt to optimize the application rates of specific products for the pasture species examined. It is also possible that the 30 day experimental period in experiments 1 and 2 was insufficient to detect changes that could occur over the longer term.
One proposed mechanism for the efficacy of biostimulants is the application of small amounts of nutrients to the soil, which stimulates soil biological activity, leading to the further mineralization of soil nutrients [22]. For this reason, we included a fertilizer containing low doses of nitrogen (N), phosphorus (P), and K (Express® NPK) to determine if any potential growth responses due to biostimulants could be attributed to fertilizer microdosing. While total soil N (around 0.5%) was relatively high at all three experimental sites, P and K constraints are well documented in basalt-derived Ferralsols [23], and these constraints were reflected in the relatively low Bray 2 P concentrations (7–16 mg kg−1) and low exchangeable K (0.17–0.27 cmol+ kg−1) (Table 1). The amounts of NPK applied in the Express® NPK treatment (around 1 kg N ha−1 and 2.3 kg P and K ha−1) are low compared to typical fertilizer doses in subtropical pasture systems [24] but provided more N, P, and K than any of the biostimulant treatments. That the Express® NPK treatment had no significant impact most likely indicates that the application rates were insufficient to stimulate a detectable increase in biomass production.
A number of management options have been evaluated to manage dieback-affected pastures. However, due to the dynamic nature of pasture dieback and the variety of livestock enterprises and landscapes that the disease occurs on, no single strategy has proven successful. Instead, implementing several strategies and remaining flexible has provided the best results [25]. Four basic strategies have been developed: managing affected pastures for recovery by supporting seedling regeneration and controlling weeds; improving pastures by sowing legumes or tolerant grasses and fertilizing; and sowing an annual grain and/or forage crop to provide quality feed for livestock and/or an alternative income [3,11,25]. The fourth strategy, controlling pasture mealybugs via either pesticides or fire, has been the least successful, with mixed results [11,25]. Other management options warrant investigation. In the wet subtropics, these include the use of tolerant grass species or grazing management.

5. Conclusions

While biostimulants may have some benefits to plant growth in specific situations, this study found no evidence that the biostimulant products tested could mitigate the effects of pasture dieback. In light of this, other management options, including the use of tolerant grass species or grazing management, should be explored further to minimize the impact of pasture dieback in the wet subtropics.

Author Contributions

Conceptualization, T.J.R., E.N.M. and S.P.B.; formal analysis, A.J.G.; investigation, E.N.M.; writing—original draft preparation, E.N.M.; writing—review and editing, T.J.R., A.J.G. and S.P.B.; funding acquisition, T.J.R. All authors have read and agreed to the published version of the manuscript.

Funding

This research was funded by NSW Local Land Services through the provision of a master’s scholarship to E.N.M.

Institutional Review Board Statement

Not applicable.

Informed Consent Statement

Not applicable.

Data Availability Statement

The data presented in this study are available on request from the corresponding author.

Acknowledgments

We thank the two graziers who allowed us to conduct experimental work on their properties and S. Harden, NSW DPIRD, for assistance with the design of experiment 2.

Conflicts of Interest

The authors declare no conflicts of interest. The funders had no role in the design of the study; in the collection, analyses, or interpretation of the data; in the writing of the manuscript; or in the decision to publish the results.

References

  1. Buck, S. Pasture dieback: Past activities and current situation across Queensland. Project Report (Department of Agriculture and Fisheries: Brisbane, Qld) 2017. Available online: https://era.dpi.qld.gov.au/id/eprint/6521/ (accessed on 28 January 2025).
  2. Makiela, S.; Harrower, K.M. Overview of the current status of buffel grass dieback. Australas. Plant Dis. Notes 2008, 3, 12–16. [Google Scholar] [CrossRef]
  3. Peck, G.; Newman, L.; Macor, J.; Buck, S.; Taylor, B. Field tolerance to pasture dieback of 26 tropical grass varieties sown into an affected paddock. In Proceedings of the 20th Australian Society of Agronomy Conference, Toowoomba Qld, Australia, 6–10 February 2022; Available online: https://www.agronomyaustraliaproceedings.org/images/sampledata/2022/Pastures/ASApeck_g_529s.pdf (accessed on 20 January 2025).
  4. Brookes, H.M. A new species of Heliococcus Šulc from Australia and Pakistan and a redescription of Heliococcus glacialis (Newstead) Comb.N. (Homoptera: Pseaudococcidae). Aust. J. Entomol. 1978, 17, 241–245. [Google Scholar] [CrossRef]
  5. Hauxwell, C. Mealybugs and pasture dieback. Institute for Future Environments, Queensland University of Technology with Meat & Livestock Australia. 2018. Available online: https://cms.qut.edu.au/__data/assets/pdf_file/0006/786066/pasture-mealybugs-technical-note.pdf (accessed on 15 January 2025).
  6. Agforce. Pasture Dieback Survey 2019; Agforce: Brisbane Qld, Australia, 2021. [Google Scholar]
  7. McKenna, P.B.; Ufer, N.; Glenn, V.; Dale, N.; Carins, T.; Nguyen, T.H.; Thomson, M.B.; Young, A.J.; Buck, S.; Jones, P.; et al. Mapping pasture dieback impact and recovery using an aerial imagery time series: A central Queensland case study. Crop Pasture Sci. 2024, 75, CP23340. [Google Scholar] [CrossRef]
  8. Boschma, S.P.; Daly, A.; Gillespie, P.S.; Wildman, O.; Shrivasatava, M.; Jennings, N.; Geary, J.M.; Baker, S.J. Pasture dieback on the North Coast of New South Wales. 1. Initial diagnostics to identify the causal agent. In Proceedings of the 32nd Conference of the Grassland Society of NSW Inc, virtual conference, 20–21 July 2021; Available online: https://pgnsw.com.au/documents/conference-proceedings/2021/2021%20Grassland%20Conf%20Proc%20B5%20-%20CP1%20-%20Boschma%20-%20Pasture%20dieback%20NC%20NSW%20-%20Diagnostics%20%20-%20WEB%20ver.pdf (accessed on 28 January 2025).
  9. Boschma, S.P.; Jennings, N.; Geary, J.M.; Baker, S.J. Pasture dieback on the North Coast of New South Wales. 2. Symptom development and current recommendations. In Proceedings of the 32nd Conference of the Grassland Society of NSW Inc., virtual conference, 20–21 July 2021; Available online: https://pgnsw.com.au/documents/conference-proceedings/2021/2021%20Grassland%20Conf%20Proc%20B5%20-%20CP2%20-%20Boschma%20-%20Pasture%20dieback%20NC%20NSW%20-%20Symptoms%20-%20WEB%20ver.pdf (accessed on 28 January 2025).
  10. Gibson, A.J.; McGregor, H.; Rose, T.J.; Jennings, N. The spread of mealybug-associated pasture dieback into the New South Wales wet subtropics. Aust. Geogr. 2024, 55, 527–539. [Google Scholar] [CrossRef]
  11. Buck, S.R.; Brazier, N.; Reid, D.J. Management solutions for pasture dieback: Outcomes of field research. In Proceedings of the 20th Agronomy Australia Conference, Toowoomba Qld, Australia, 6–10 February 2022; Available online: https://www.agronomyaustraliaproceedings.org/images/sampledata/2022/Pastures/ASAbuck_s_532s.pdf (accessed on 20 January 2025).
  12. Whitton, M.M.; Ren, X.; Yu, S.J.; Irving, A.D.; Trotter, T.; Bajagai, Y.S.; Stanley, D. Sea minerals reduce dysbiosis, improve pasture productivity and plant morphometrics in pasture dieback affected soils. Sustainability 2022, 14, 14873. [Google Scholar] [CrossRef]
  13. Whitton, M.M.; Ren, X.; Yu, S.J.; Trotter, T.; Stanley, D.; Bajagai, Y.S. Remediation of pasture dieback using plant growth promotant. Agronomy 2022, 12, 3153. [Google Scholar] [CrossRef]
  14. Whitton, M.M.; Ren, X.; Yu, S.J.; Irving, A.D.; Trotter, T.; Bajagai, Y.S.; Stanley, D. Humate application alters microbiota—mineral interactions and assists in pasture dieback recovery. Heliyon 2023, 9, e13327. [Google Scholar] [CrossRef] [PubMed]
  15. Ren, X.; Whitton, M.M.; Yu, S.J.; Trotter, T.; Bajagai, Y.S.; Stanley, D. Application of phytogenic liquid supplementation in soil microbiome restoration in Queensland pasture dieback. Microorganisms 2023, 11, 561. [Google Scholar] [CrossRef] [PubMed]
  16. du Jardin, P. Plant biostimulants: Definition, concept, main categories and regulation. Sci. Hort. 2015, 196, 3–14. [Google Scholar] [CrossRef]
  17. Rayment, G.E.; Lyons, D.J. Australian Laboratory Handbook of Soil and Water Chemical Methods; Inkata Press: Port Melbourne, Australia, 2011. [Google Scholar]
  18. R Core Team. R: A Language and Environment for Statistical Computing; R Foundation for Statistical Computing: Vienna, Austria, 2017; Available online: https://www.R-project.org/ (accessed on 22 January 2024).
  19. Coombes, N. DiGGer, a Spatial Design Program; Biometric Bulletin NSW Department of Primary Industries: Orange, NSW, Australia, 2009. [Google Scholar]
  20. Bewick, V.; Cheek, L.; Ball, J. Statistics review 9: One-way analysis of variance. Crit. Care. 2004, 8, 130–136. [Google Scholar] [PubMed]
  21. Mackiewicz-Walec, E.; Olszewska, M. Biostimulants in the Production of Forage Grasses and Turfgrasses. Agriculture 2023, 13, 1796. [Google Scholar] [CrossRef]
  22. Roche, D.; Rickson, J.R.; Pawlett, M. Moving towards a mechanistic understanding of biostimulant impacts on soil properties and processes: A semi-systematic review. Front. Agron. 2024, 6, 1271672. [Google Scholar] [CrossRef]
  23. Moody, P.W. Chemical fertility of krasnozems—A review. Aust. J. Soil Res. 1994, 32, 1015–1041. [Google Scholar] [CrossRef]
  24. Fulkerson, W.J.; Slack, K.; Hennessy, D.W.; Hough, G.M. Nutrients in ryegrass (Lolium spp.), white clover (Trifolium repens) and kikuyu (Pennisetum clandestinum) pastures in relation to season and stage of regrowth in a subtropical environment. Aust. J. Exp. Agric. 1998, 38, 227–240. [Google Scholar] [CrossRef]
  25. Anon. Management of Pasture Dieback. Department of Agriculture and Forestry, Queensland. 2024. Available online: https://futurebeef.com.au/wp-content/uploads/2024/03/2227-Pasture-dieback-A4-brochure_WEB_FINAL.pdf (accessed on 28 January 2025).
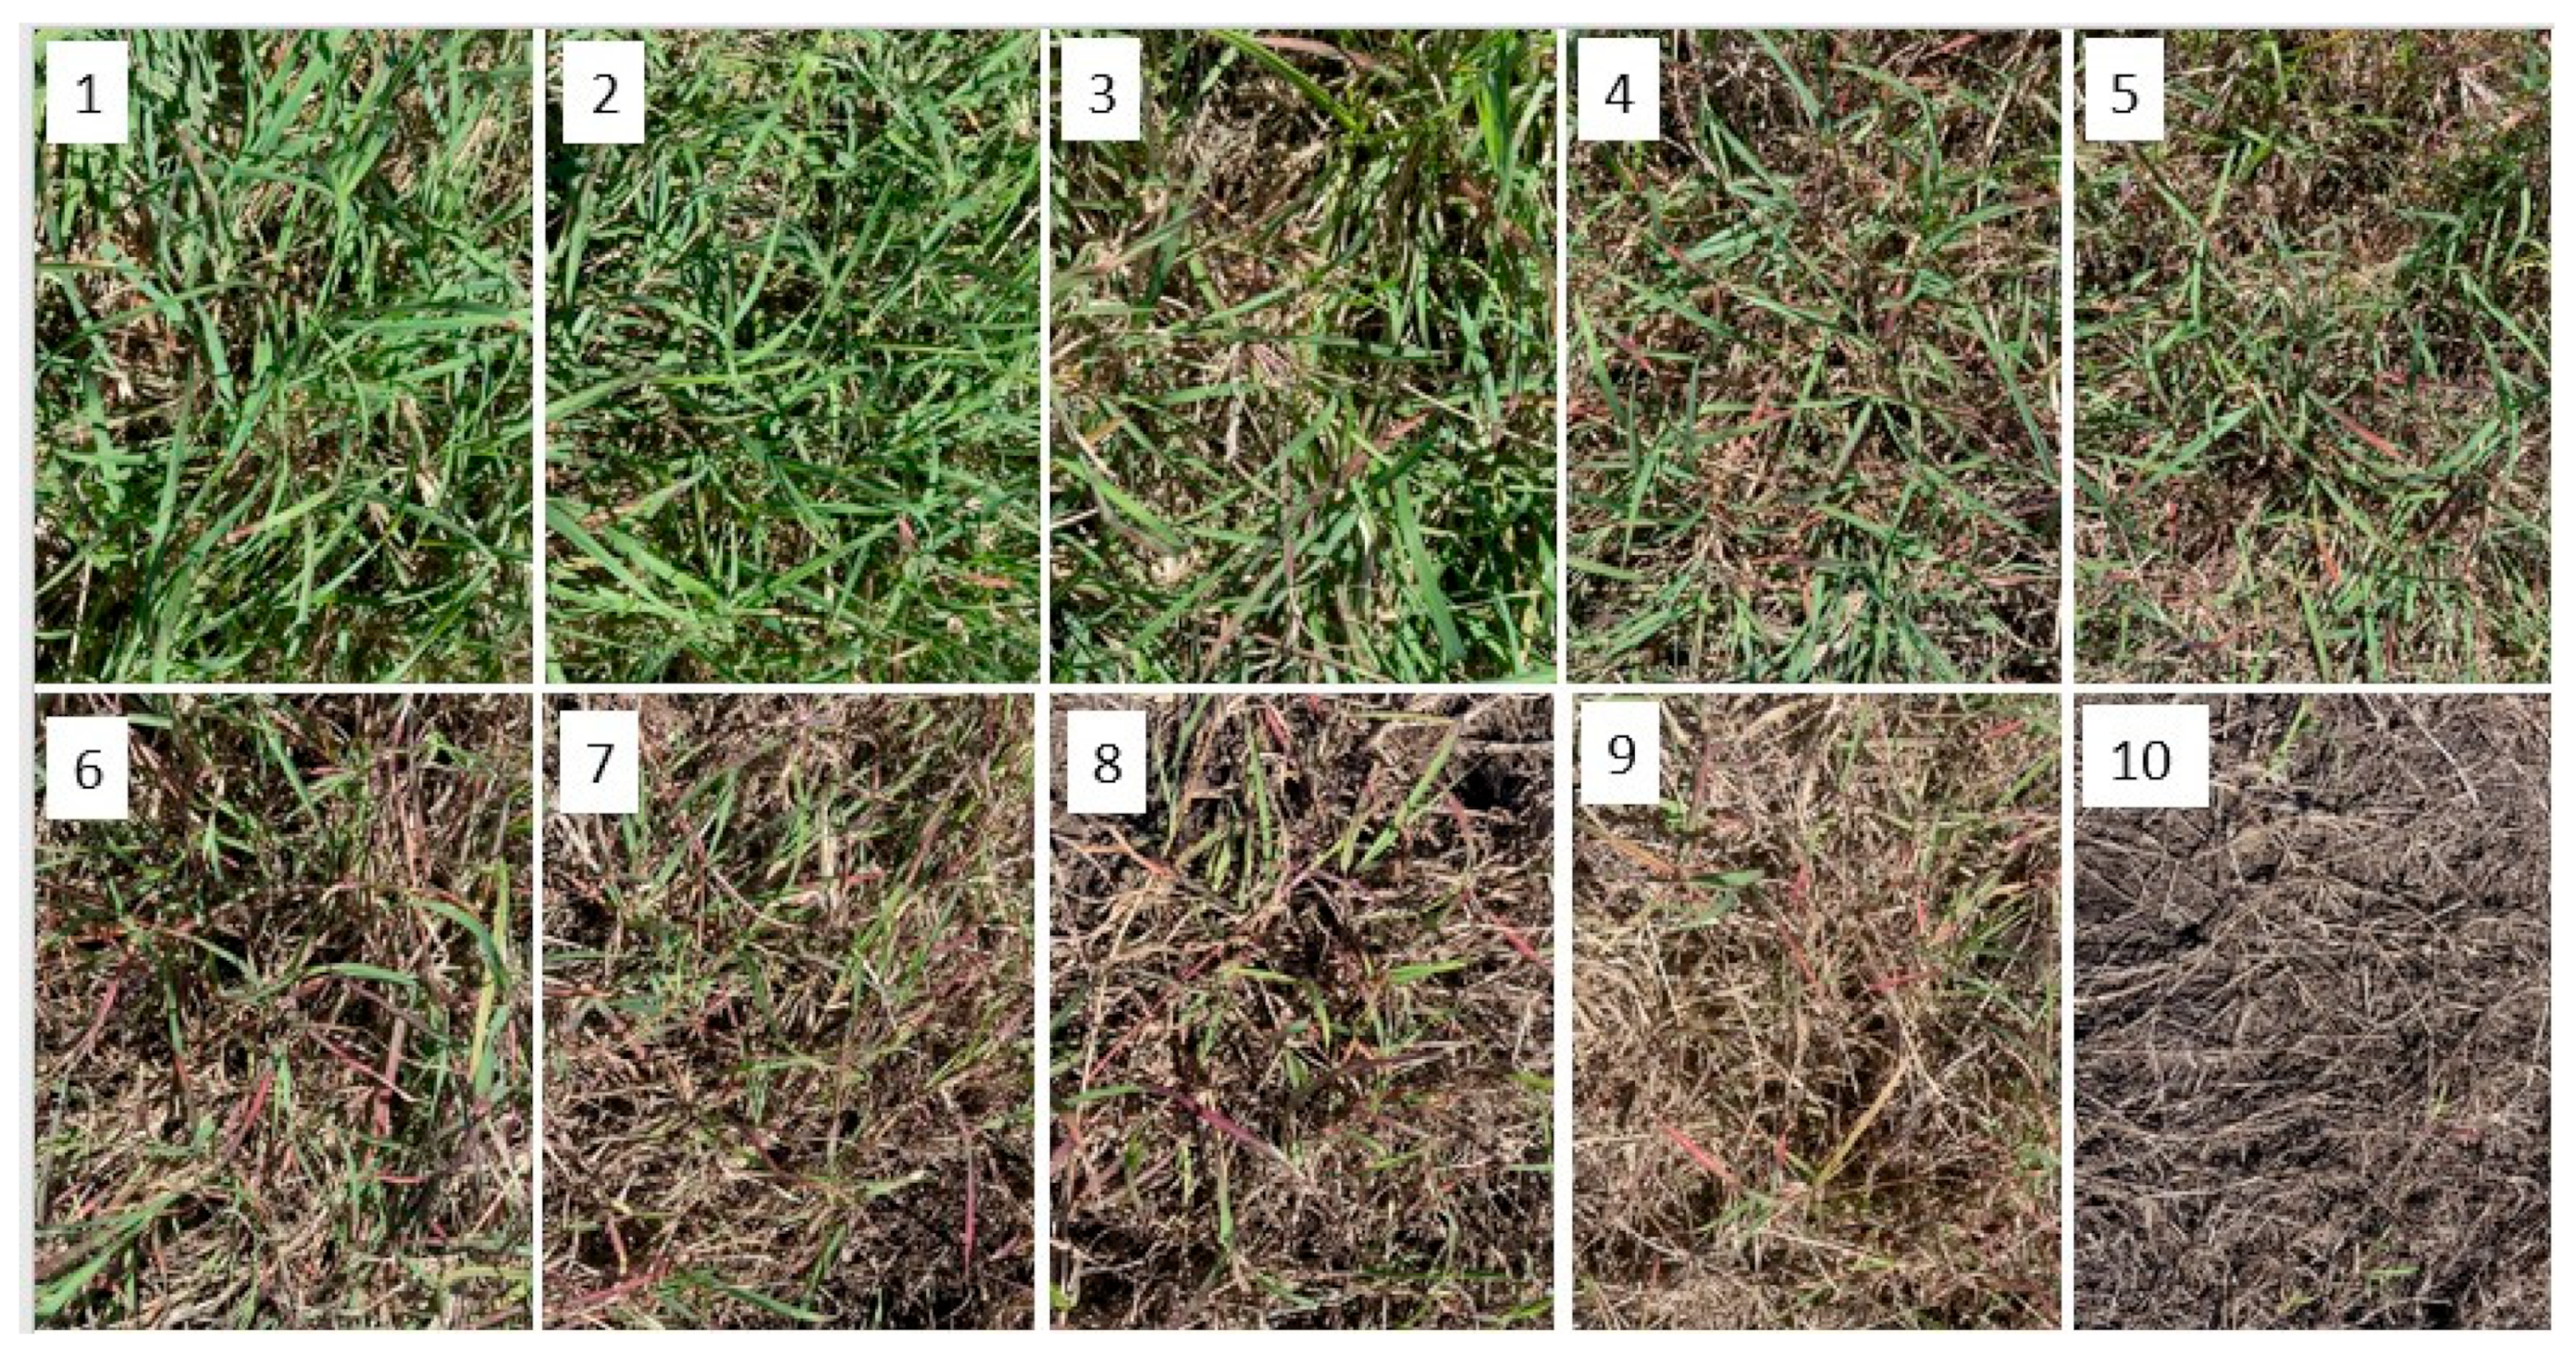
Figure 1. Pasture dieback ranking scores based on symptoms in creeping bluegrass. A score of 1 indicates no symptoms, while a score of 10 indicates complete death of plants.
Sustainability 17 03013 g001
Figure 2. The effect of biostimulant application on pasture dry matter yield (kg ha−1) 30 days after initial application in experiment 1. Error bars represent the standard error.
Sustainability 17 03013 g002
Figure 3. The effect of biostimulant application on pasture dry matter yield (kg ha−1) 30 days after initial application in experiment 2. Error bars represent the standard error.
Sustainability 17 03013 g003
Figure 4. Plant symptom scores across treatments in experiment 3, 16 day after treatment application. Error bars represent the standard error, while the dashed horizontal line represents the baseline site score of 1 assessed on 26 April 2024.
Sustainability 17 03013 g004
Table 1. Key physicochemical properties of the 0–10 cm layer of soils at the three experimental sites. Methods of analysis are from Rayment and Lyons [17].
Site 1Site 2Site 3
Location28°52′02″ S, 153°26′10″ E28°52′01″ S, 153°26′14″ E28°58′31″ S, 153°04′12″ E
Topsoil textureClay–loamClay–loamClay–loam
pH (water)5.75.46.2
Total carbon (%)6.35.56.4
Total nitrogen (%)0.560.480.48
Phosphorus (mg kg−1) (Bray 1)16721
Sulfur (mg kg−1)20329
Exchangeable cations (cmol+ kg−1)
   Potassium0.270.171.10
   Calcium3.51.816.0
   Magnesium2.31.58.1
   Sodium0.180.120.32
   Aluminum0.100.350.01
Table 2. Biostimulant and fertilizer products, active ingredients, application rates, and nutrients applied per application in experiments 1, 2, and 3.
Product DetailsRC3Humate MixSea Mineral MixSeasol CommercialSea EnergyK HumateRC3 + Humate Mix + Sea Mineral Mix (Mixed)Express® NPK
Active ingredientsTrimercapto-S-triazine and humateHumateMarine mineralsSeaweed extractMarine mineralsHumateTrimercapto-S-triazine, humate, marine mineralsMacro- and micro-nutrients
Application rate (mL plot−1)345101515303, 45 & 1022.5
Nutrients applied (g ha−1)
  Nitrogen2.2410.019.28.45243975
  Phosphorus18850.2319.53141032250
  Potassium2.04148749.41108922250
  Calcium0.12.70.20.7448.52.9105
  Magnesium*1.45232.1568175257.5
  Sulfur5.84.8763.2279.3870
  Copper*0.0020.00030.00040.020.005*5.4
  Iron0.0080.10.010.30.036.50.17.5
  Manganese0.00010.030.00040.0060.00093.10.037.9
  Zinc0.00050.0080.0010.0030.012.50.017.6
  Boron0.00060.021.80.021.11.21.81.9
* Concentrations were below the instrumental detection limit, so the amount applied per ha could not be calculated.
Table 3. Mean minimum and maximum temperatures (°C), monthly rainfall (mm), and long-term average (LTA) rainfall for experiments 1 and 2 (Alstonville) and for experiment 3 (Yorklea). (Source: Climate Data Online, Bureau of Meteorology).
Experiment 1Experiment 2Experiment 3
Duration1 November 2023–7 December 20238 March 2024–11 April 202426 April 2024–29 May 2024
Total Rainfall (mm)149223106
LTA Rain (mm)9718271
Average Minimum Temperature (°C)161713
LTA Minimum Temperature (°C)181714
Average Maximum Temperature (°C)282723
LTA Maximum Temperature (°C)302826
Disclaimer/Publisher’s Note: The statements, opinions and data contained in all publications are solely those of the individual author(s) and contributor(s) and not of MDPI and/or the editor(s). MDPI and/or the editor(s) disclaim responsibility for any injury to people or property resulting from any ideas, methods, instructions or products referred to in the content.