Article

The Structure and Influencing Mechanisms of the Global Palm Oil Trade: A Complex Network Perspective

School of Business Administration, Northeastern University (China), Shenyang 110167, China
*
Author to whom correspondence should be addressed.
Sustainability 2025, 17(7), 3062; https://doi.org/10.3390/su17073062
Submission received: 24 January 2025 / Revised: 27 March 2025 / Accepted: 28 March 2025 / Published: 30 March 2025

Abstract

:
Against the backdrop of rapid growth in the food processing and biofuel industries across many countries, the global palm oil market has become a critical component of international agricultural trade. This study analyzes the evolution of the global palm oil trade network using palm oil trade data from 182 countries and identifies the associated influencing mechanisms to ensure the security of the international palm oil supply chain. The main findings are as follows: (1) over the past two decades, the global palm oil trade network has increasingly taken on a single, large-community structure, reflecting trends toward globalization and integration; however, it remains heavily concentrated around two core countries: Malaysia and Indonesia. (2) The degree of connectivity between countries in the global palm oil trade has steadily increased. While Malaysia and Indonesia continue to dominate the network, other communities have progressively shrunk in size. (3) In addition to Malaysia and Indonesia, countries such as the Netherlands, Germany, Italy, Singapore, and the United Arab Emirates (UAE) have become key players in the global palm oil trade network. (4) Quadratic assignment procedure (QAP) correlation and regression analyses show that differences in population, geographic distance, and institutional distance have significant and stable negative impacts on trade relationships, whereas the presence of a common language has a positive effect.

1. Introduction

The global palm oil trade market is a crucial component of international agricultural trade. As the world’s primary source of edible oil, palm oil is not only recognized as the leading vegetable oil but also holds a dominant position in terms of export volume in the edible oil trade. Therefore, understanding the dynamics of the palm oil trade network is vital for ensuring the security of the global palm oil supply chain. As an important agricultural product, the production process of palm oil requires the input of various goods and non-goods, such as raw materials [1]. Differences in the supply of raw materials can lead to disruptions throughout the supply chain, with multiple stakeholders, including farmers, wholesalers, importers, exporters, retailers, and logistics contractors, employing appropriate technologies at different stages of the supply chain to add value to the final product (e.g., using various additives for extended shelf-life). Different levels of the supply chain face varying costs and risks. In the global palm oil trade, maintaining the security of the supply chain and mitigating risks and costs are key factors affecting market stability and sustainable development practices. Key producing countries, such as Indonesia and Malaysia, are located in Southeast Asia, a region characterized by complex and fluctuating geopolitical conditions. As the global palm oil trade network continues to evolve, intergovernmental cooperation is becoming ever more important, which not only enhances the coordination of the global trade network but also contributes to stability within the international community.
The latest data from the Food and Agriculture Organization (FAO) indicate that both the production and consumption of palm oil have demonstrated a steady growth trend. Global palm oil production for the latest season is projected to reach 79.46 million tons, accounting for over 30% of total global vegetable oil production. Southeast Asia remains the world’s primary producer and exporter of palm oil, dominating the global market share in both production and exports. Ramadhani and Santoso (2019) validated the significant comparative advantage of Malaysia and Indonesia in the international palm oil trade [2]. Their favorable geographic locations provide a suitable natural environment for oil palm cultivation, and the abundance of land resources coupled with low labor costs gives both countries a cost advantage in terms of palm oil trade [3]. Additionally, strong governmental support [4] has enabled Malaysia and Indonesia to maintain a stable and significant competitive edge in the global palm oil trade [5,6,7]. In 2022, Indonesia’s palm oil production showed significant growth, reaching 48.5 million tons, with a slight increase expected by 2024. Meanwhile, Malaysia’s production reached 18.93 million tons. Together, these two countries account for more than 80% of global palm oil exports, exerting a major influence on the supply–demand dynamics and price trends in the international palm oil trade market. Meanwhile, the global palm oil trade network is highly complex and dynamic, being shaped by various mechanisms. At present, external shocks such as regional conflicts, trade protectionism, and global climate change are influencing trade patterns. Additionally, some countries are altering their palm oil import and export flows by adjusting tariff policies and strengthening environmental regulations, further increasing the unpredictability of the global palm oil trade landscape.
Existing literature on the palm oil trade has primarily focused on areas such as comparative advantages, price transmission mechanisms, and the relationship between futures and spot markets [8]. The factors influencing the palm oil trade have also attracted considerable attention, with much of the focus being placed on classical factors such as the Trade Restrictiveness Index (TRI), tariffs, and trade agreements [9,10]. Ahmad Hamidi et al. (2022) calculated the technical efficiency of palm oil exports and found that the global palm oil export sector suffers from low technical efficiency, although major exporters still have significant export potential [11]. Go and Lau (2019) analyzed the relationship between the palm oil spot and futures markets, investigating mean and volatility spillover effects during the 2010–2018 period [12]. Lee et al. (2022) and Myat and Tun (2019) used random forest models to forecast international palm oil prices, offering guidance to importers and exporters regarding trade decisions and highlighting pathways for the sustainable development of the palm oil futures market [13,14].
Some scholars have also examined the geographical distribution and relationships within the global palm oil trade, including factors such as the selection of trade partners, shifts in trade patterns, and the impacts of trade risks. Adhikari et al. (2023) highlighted that policy adjustments in various countries are key drivers of the global palm oil trade [15]. Ahmad Hamidi et al. (2022) conducted an in-depth analysis of palm oil exports, emphasizing that palm oil is the most widely produced vegetable oil globally and plays a crucial role in ensuring global food security [11]. Some scholars have begun to attempt to explain the changes in the palm oil trade network from the perspective of global value chains, embedding product supply chain analysis into network analysis. Furthermore, these studies focus on key actors at different stages of the supply chain and explore the issue of power distribution. At its core, this is still a study of the sustainability of the global palm oil supply chain [16,17,18]. Oosterveer (2015) analyzed emerging dynamics in palm oil supply from a global network perspective, noting that in newly developed global governance systems, the roles of private companies and social organizations have increasingly surpassed those of national governments [19].
However, studies on the structural characteristics of palm oil trade networks from an international perspective have predominantly focused on exports from core countries such as Malaysia and Indonesia, as well as inter-regional industrial trade and sustainability [20,21,22,23,24,25,26]. This further underscores the importance of this study’s global perspective in exploring the characteristics and driving forces behind palm oil trade networks.
In traditional trade analysis, the gravity model is primarily used to study the determinants of bilateral trade. Based on this, scholars have developed a concrete understanding of the various dependencies within bilateral trade relationships. The gravity model generally focuses on how trade networks depend on relationships such as culture, distance, and language rather than identifying specific patterns within the trade network [27]; as such, the results are often more intuitive and easier to explain from an economic perspective. However, its assumptions are overly simplified, which can lead to complex non-linear relationships being neglected. It is somewhat lacking when it comes to analyzing multi-lateral trade relationships involving multiple interconnections. To overcome the limitations of traditional trade analysis methods when examining the highly complex and large-scale global palm oil trade network, many scholars have turned to the more effective approach of complex network analysis.
Complex network analysis employs a range of indices, such as network density, connectivity, reciprocity, integration degree, network centrality, core–periphery structure, and community detection, to illustrate the heterogeneity, structural complexity, and dynamic characteristics of nodes within a trade network [28]. This interdisciplinary tool has been creatively applied in research to uncover the complex relationships among nodes in agricultural trade networks and the dynamic evolution of trade patterns. Its value lies not only in revealing the processes underlying the evolution of trade networks and the characteristics of trade patterns but also in highlighting the importance of different actors within the network [29,30]. Compared to traditional trade network analysis models, complex network analysis is capable of analyzing multi-party interactions and the overall structure of systems, explaining the complex relationships hidden behind the data, handling non-linear data relationships, revealing deeper network evolution characteristics, and indicating the interaction patterns and structural features between different countries in the trade network [31,32,33,34].
Using complex network analysis, many scholars have examined specific grains, cash crops, or other trade commodities to analyze the characteristics of trade network structures [27,35,36,37,38]. Wang and Dai (2021) used data from 1992 to 2018 to construct a global food trade network, exploring its dynamic evolution and offering insights into global food security [39]. Chen and Zhao (2023) conducted a complex network analysis to ensure the security of the international rice supply chain and provide evidence for global rice trade cooperation [40]. Dalin et al. (2012) and Fan et al. (2019) examined international virtual water trade related to global food trade through complex network analysis, noting that the development of international food trade has improved global water use efficiency [41,42].
In summary, existing academic studies on the palm oil trade have primarily focused on trade patterns at specific points in time, with particular attention given to core exporting countries such as Malaysia and Indonesia; however, they typically lack a detailed examination of the dynamic changes in the structure of the global palm oil trade network. Given the significant impact that the structure of the global palm oil trade network has on international food and oil security, we adopt a global perspective to address the following questions: What are the characteristics of the global palm oil trade network structure? Which countries are at the core of the network? What factors drive the development of the global palm oil trade network? This study employs complex network analysis to construct a global palm oil trade network, systematically revealing the dynamic characteristics of its structure. First, it summarizes the apparent trends in the global palm oil trade over the past 21 years (from 2003 to 2023). Based on complex network analysis, the global palm oil trade network is constructed, allowing various relevant indicators to be calculated. The data from these calculations are then analyzed to examine the evolution and intrinsic characteristics of the network structure, interpreted at three levels: global, regional, and national. Finally, QAP analysis is performed to investigate the mechanisms influencing the structure of the global palm oil trade network, thus identifying the core factors that affect the network.

2. Background and Data
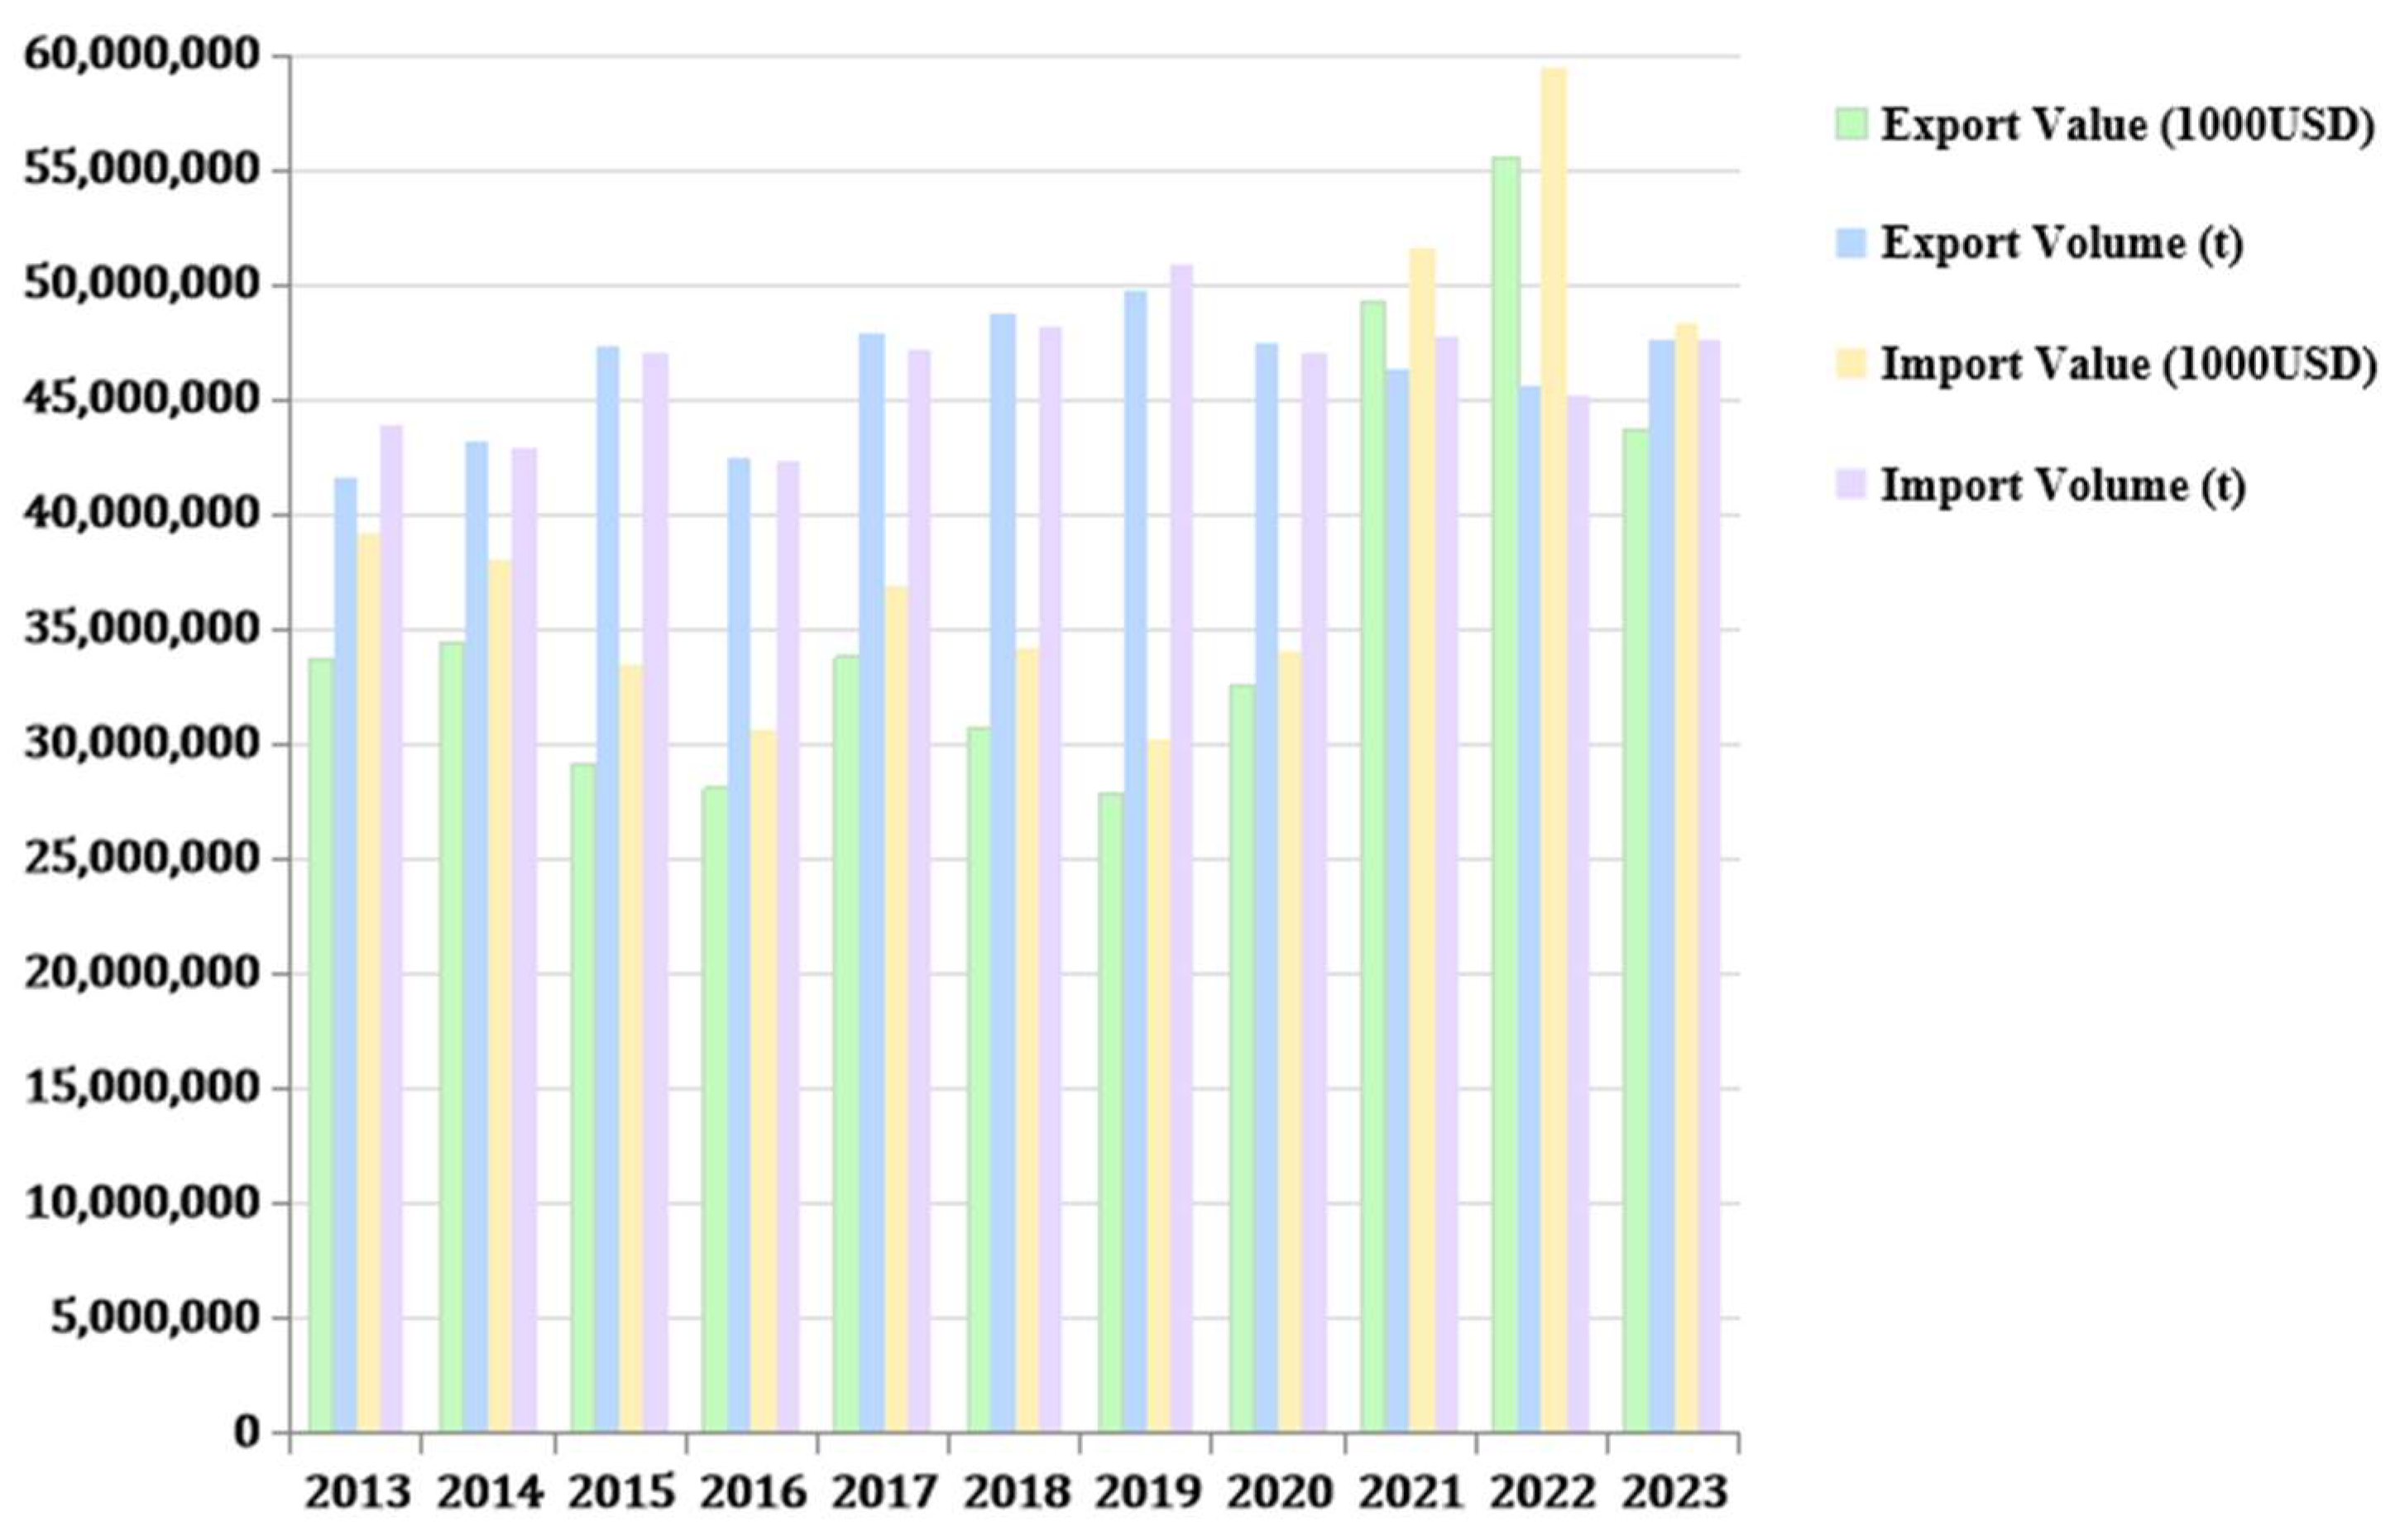
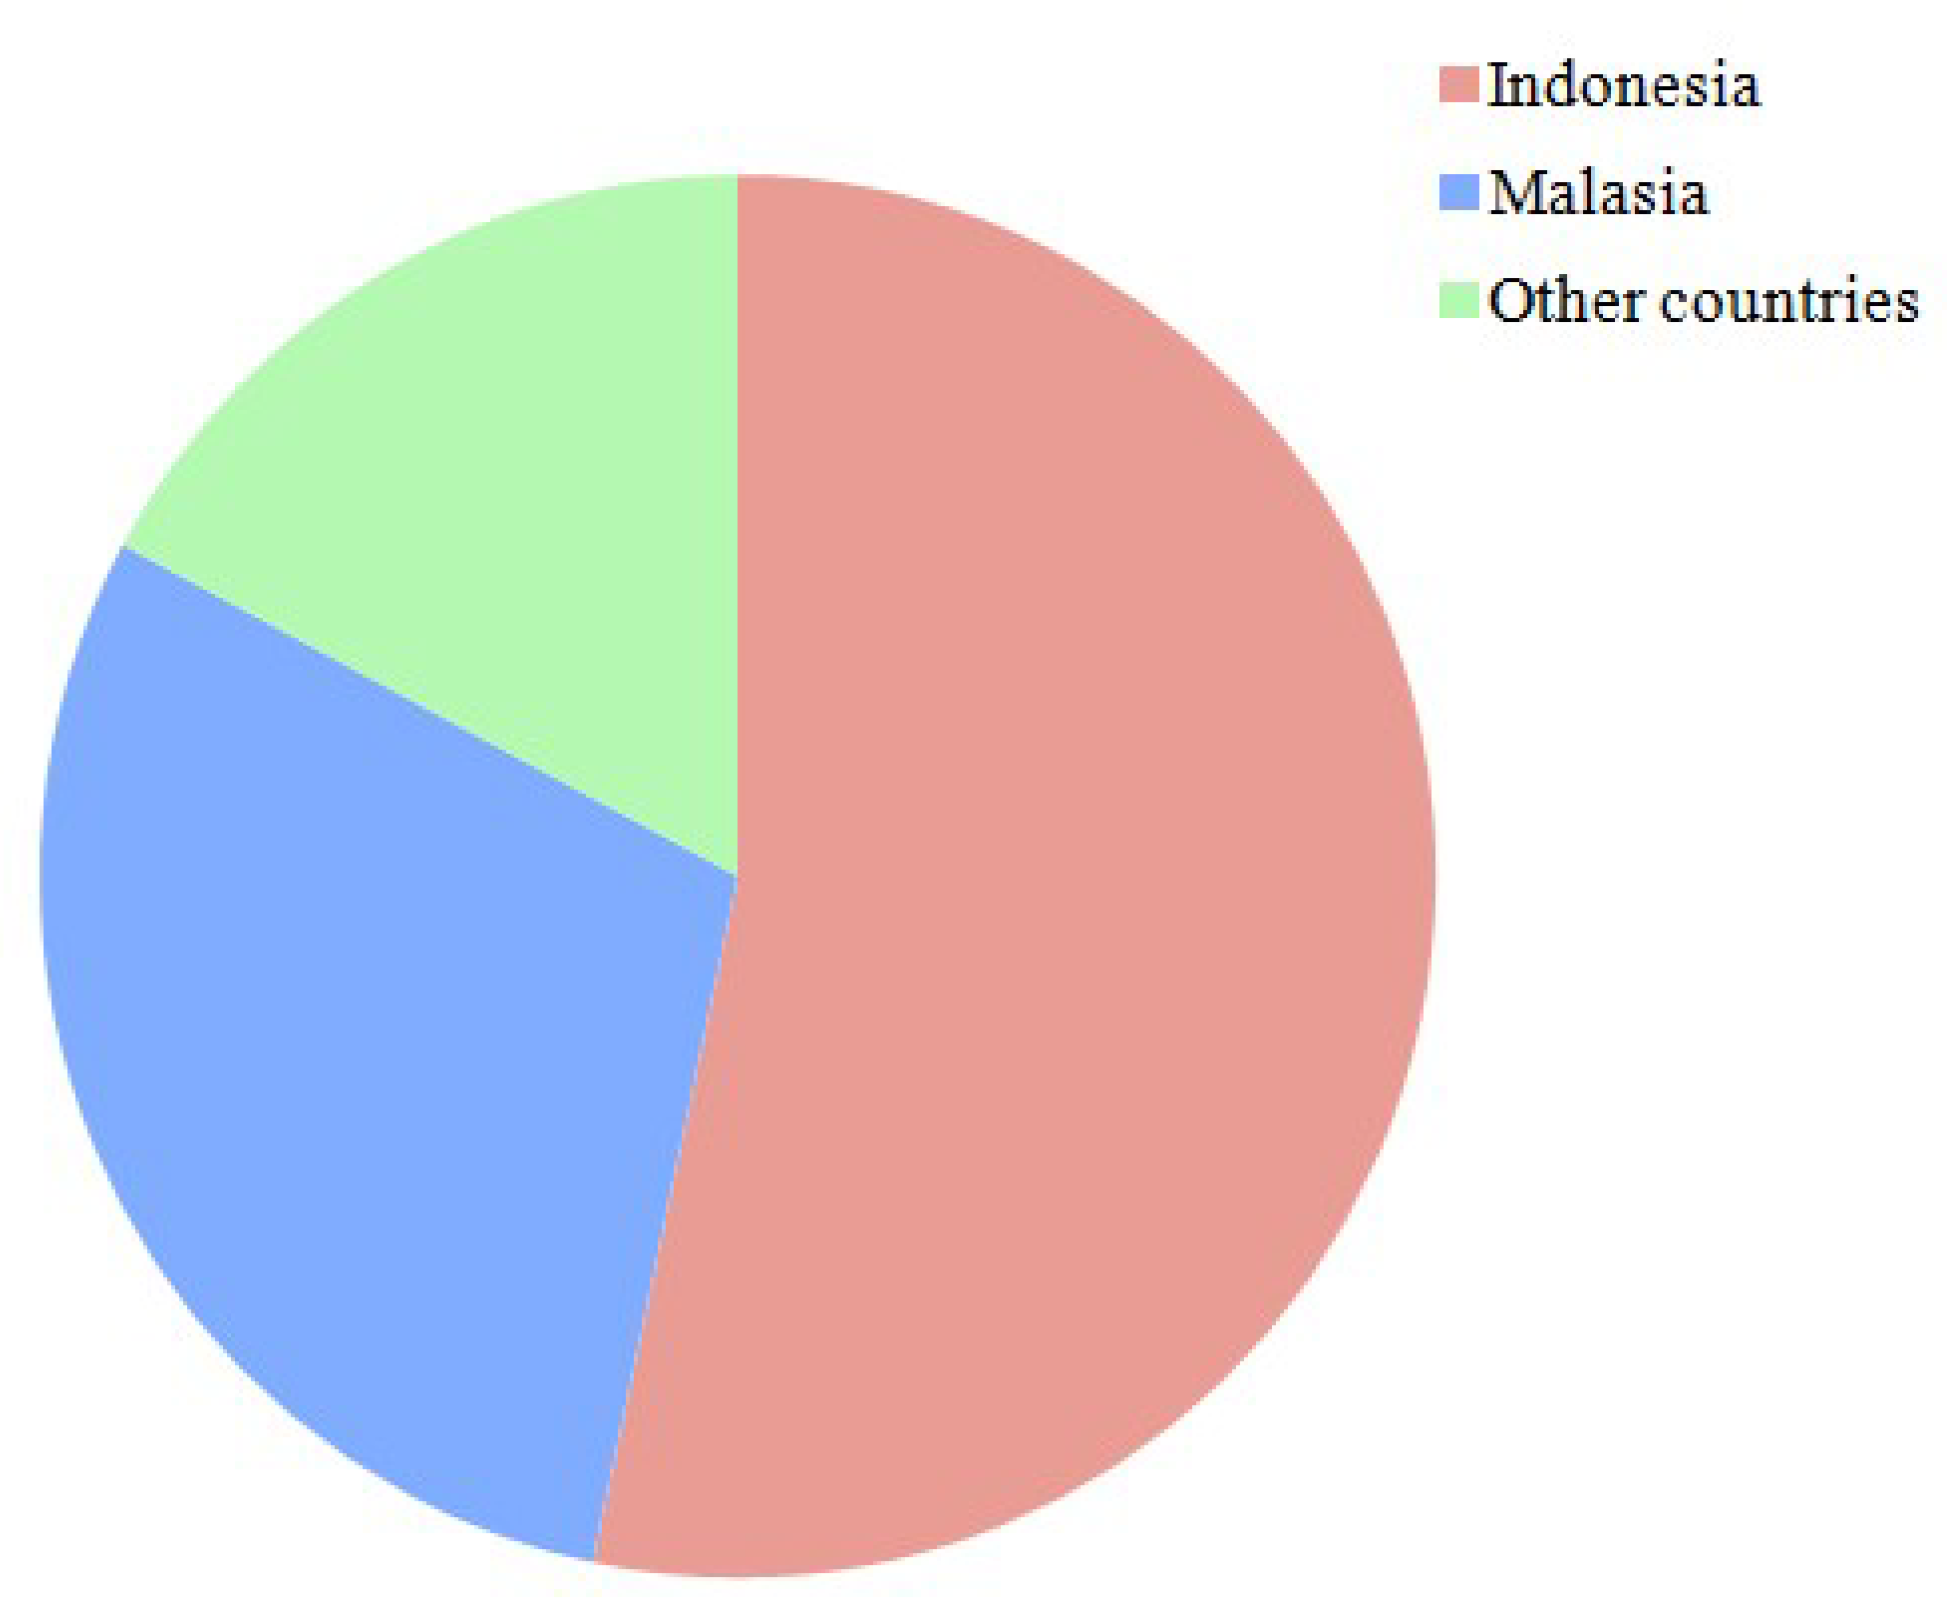
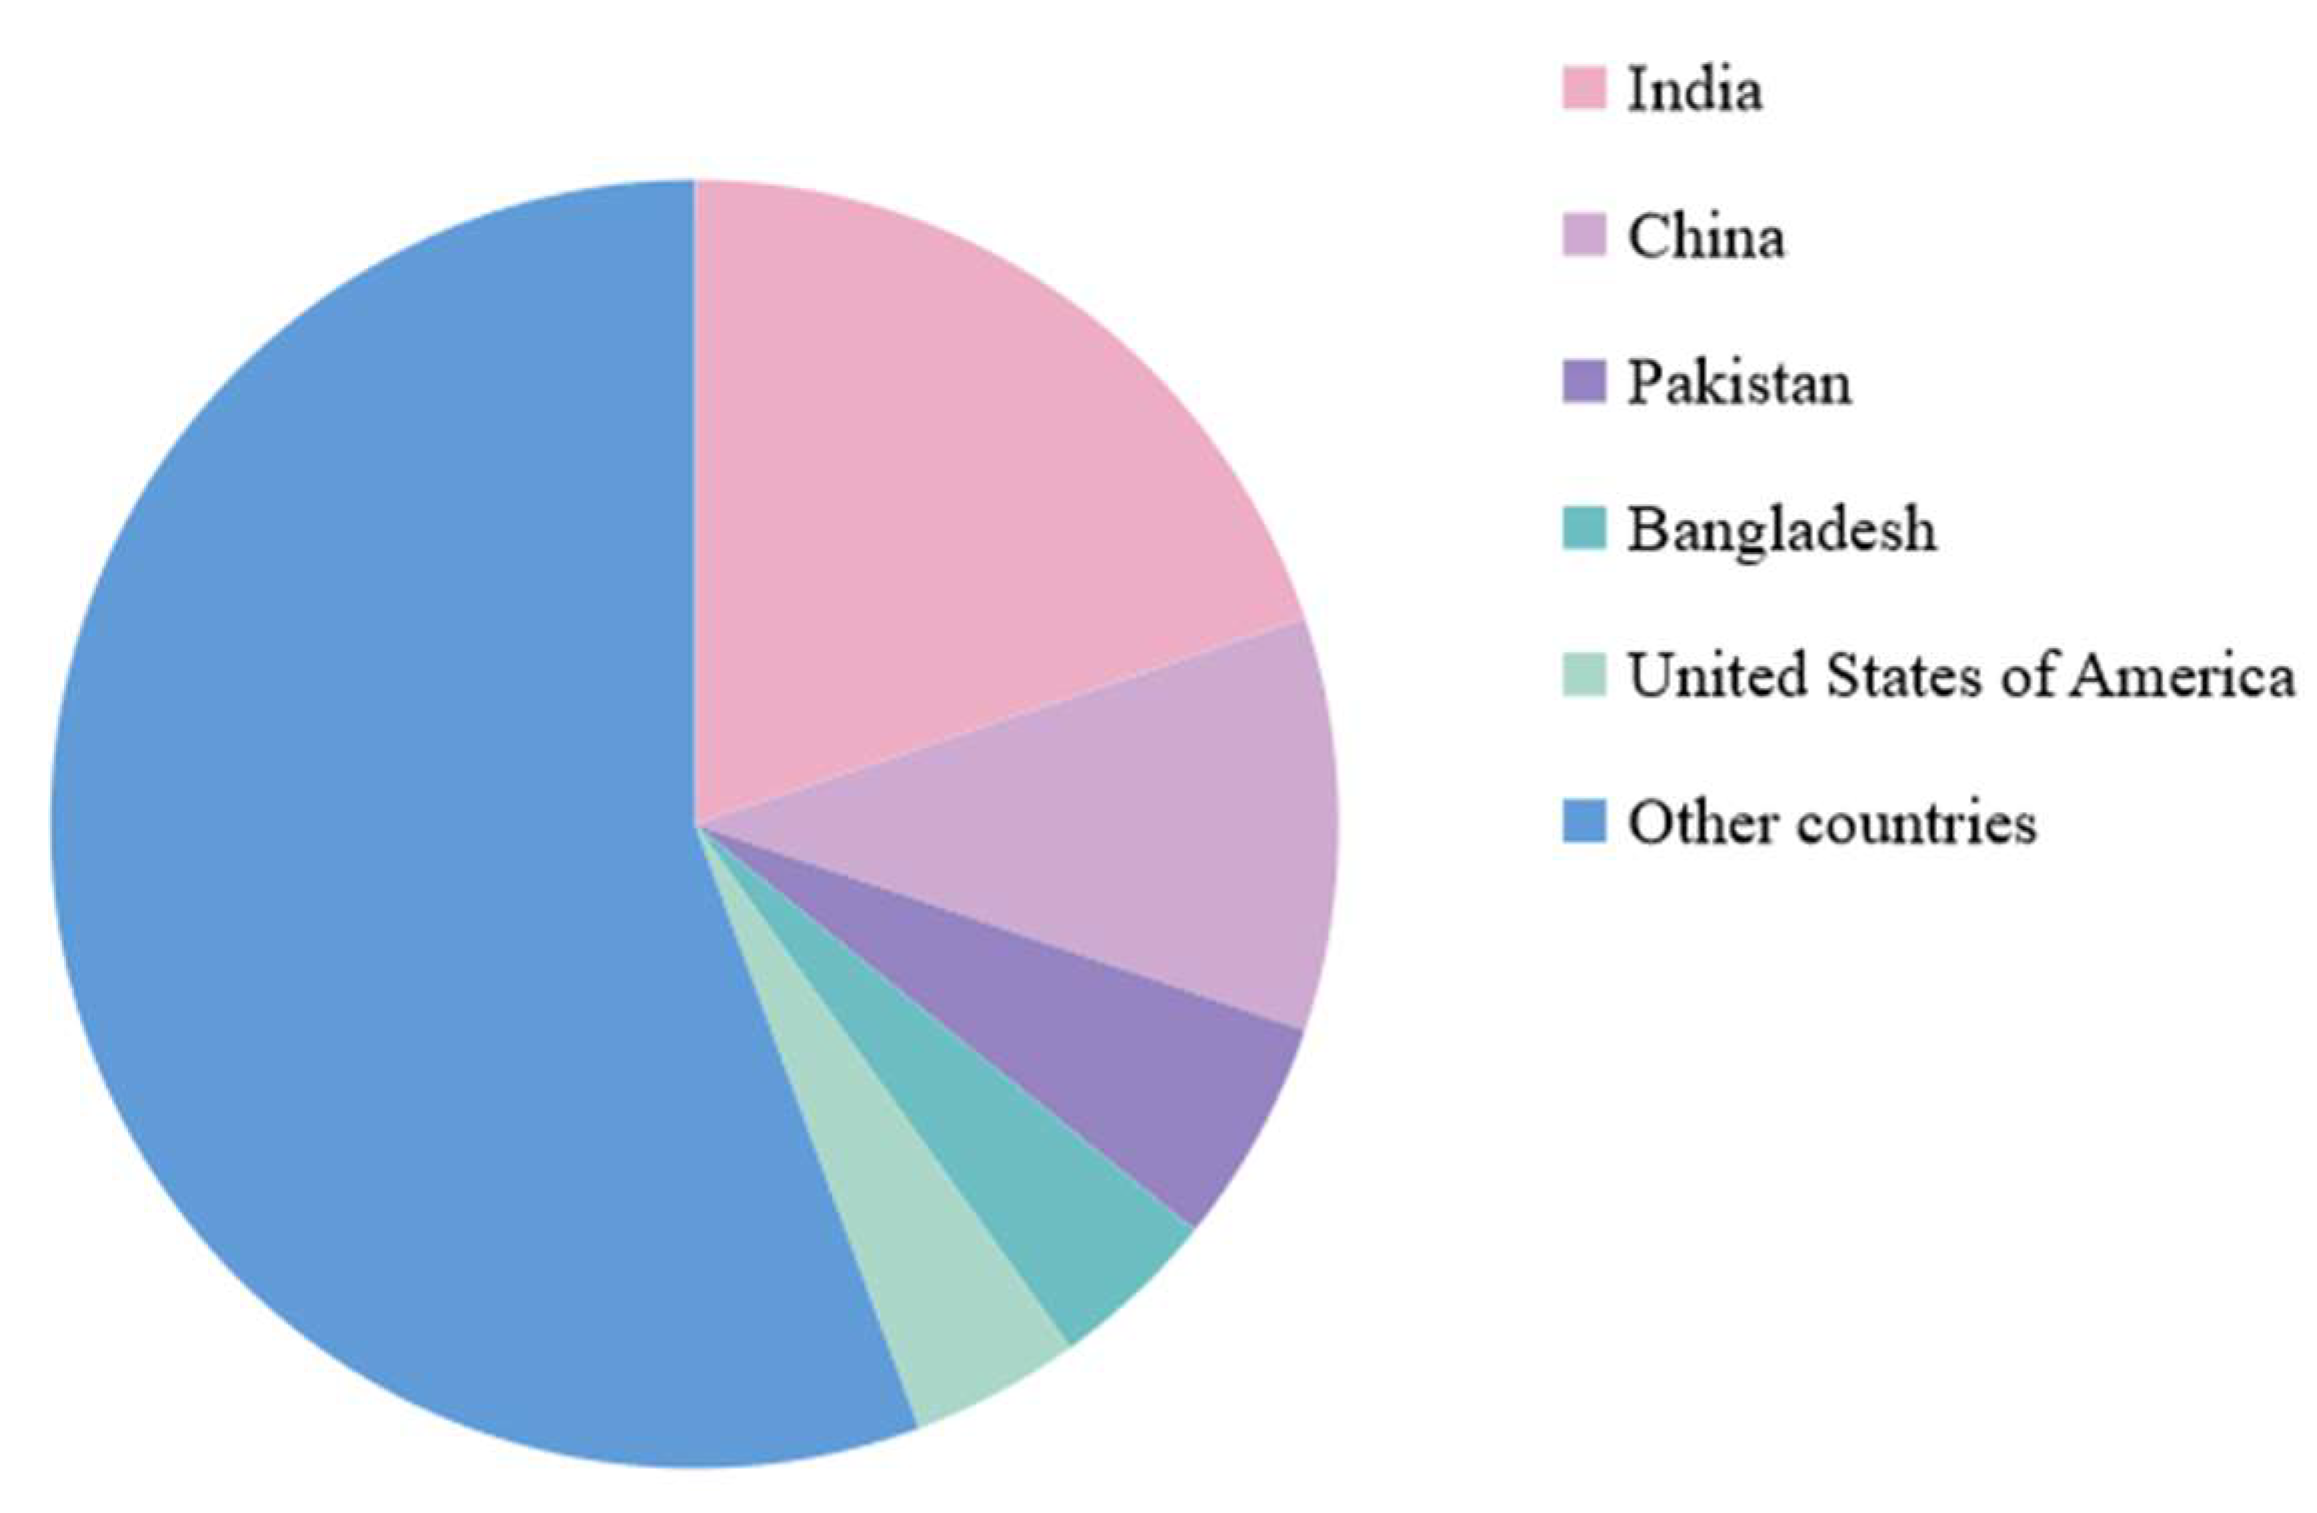
2.1. Background

As one of the most important vegetable oils globally, palm oil has become an integral part of the 21st century’s globalized “agro-food cycle” [43]. From food production to biodiesel, the palm oil industry spans diverse global sectors and generates billions of dollars. Figure 1 provides an overview of the global palm oil trade from 2013 to 2023. A vast trade network links oil palm plantations and processing factories in Southeast Asia, Africa, and Latin America to refineries and manufacturing plants in Europe, North America, China, and India, as well as to food, cosmetic, and chemical factories worldwide [44]. Over the past two decades, the global palm oil trade has been shaped by various factors, including supply and demand dynamics, economic conditions, and national policies. While experiencing fluctuations at different stages, it has generally followed a growth trend. At the beginning of the 21st century, driven by the rapid expansion of the food processing and biofuel industries, global demand for palm oil surged, and major exporters such as Malaysia and Indonesia increased their production to meet the rising international demand. While the global palm oil trade experienced some fluctuations between 2014 and 2016, it has shown a relatively stable growth trend from 2016 to the present. Overall, despite occasional setbacks, palm oil has generally expanded in global trade as a highly popular vegetable oil utilized across several key industries.
Figure 2 and Figure 3 depict the distribution of the worldwide palm oil import and export trade in 2023 by country. The cultivation of palm oil requires abundant sunlight and warm climates, which makes Indonesia and Malaysia, the two largest palm oil producers in the world, ideal locations due to their tropical climates, abundant labor, and vast land resources; for example, in 2023, their export volumes were 23 and 12 million tons, respectively. Together, their combined exports typically account for over 80% of global exports, showing dominance in the global palm oil trade. In contrast, due to climatic constraints and industrial demand, most other countries face significant gaps between palm oil production and consumption, which forces them to rely heavily on imports. China and India were the largest global importers in 2023, with imports reaching 6 and 9 million tons, respectively. Additionally, countries such as Pakistan, Bangladesh, and the United States each imported over 1 million tons. Overall, the global palm oil trade network is shaped by the specific growth requirements of palm trees and disparities in resources, technology, and markets among countries. This network is predominantly dominated by Indonesia and Malaysia, with other countries playing a supplementary role.

2.2. Data Sources and Processing

Data on global palm oil import and export volumes were sourced from the Food and Agriculture Organization of the United Nations (FAO), which spans from 2003 to 2023, covering a comprehensive 21-year period. Considering the availability of data and missing trade data for some countries while ensuring the representativeness of the sample, we selected a total of 182 countries and regions involved in the global palm oil trade as the basis for our research. Furthermore, to ensure the validity of trade network flows, re-import and re-export trade transactions were not included in the statistics. This study conducted data quality checks and pre-processing to ensure the reliability of the analysis results. Given the long-time span of the sample, trade data for a small number of countries were missing in certain years. To avoid affecting the experimental results, missing data were excluded while ensuring the integrity of the analysis [35,37,38]. In cases of discrepancies between import and export data, the import volume reported by the importing country was used as the standard [41,42]. The trade structures of 182 countries were then analyzed and encoded to construct a trade network in the form of a directed weighted matrix, in which trade flows are represented as directed edges and trade volumes as the associated edge weights.
For the QAP analysis, data on national GDP, population, and six indicators used to calculate institutional distance were sourced from the World Bank Database (WDI). Data on the geographic distances between national capitals and the presence of a common language between countries were obtained from the French Centre for Prospective Studies and the International Information Database (CPEII-Geography). Due to the relatively small annual variation in global palm oil trade volume, we selected data from 2003, 2009, 2015, and 2023 as samples for the study, aiming to reflect the factors influencing the formation of the palm oil trade network structure from 2003 to 2023. In the data analysis, a trade relationship between countries was assumed if either the reporting country or the partner country had recorded palm oil trade data [8]. Based on this assumption, a binary (0–1) trade matrix was constructed, where 1 indicates the presence of trade and 0 otherwise. For the GDP, population, and institutional distance variables, a matrix was constructed using the absolute differences between the two countries’ data [45,46,47,48]. For the distance variable, a matrix was constructed using the absolute value of the great-circle distance between the capitals of the two countries [49]. For the language variable, a binary (0–1) matrix was constructed, where 1 indicates that the two countries share an official language and 0 otherwise [50].

3. Empirical Strategy

The empirical strategy used in our study is divided into four steps. First, the theory of complex network analysis is applied to construct a global palm oil trade network model reflecting both physical and behavioral spaces. Second, various indicators from the complex network analysis system are used to calculate the key metrics needed to analyze the structural characteristics of the trade network. Next, based on the analysis results, the structural characteristics of the global palm oil trade network are examined from three perspectives: overall structure, regional structure, and national structure. Finally, the QAP analysis method is employed to explore the factors influencing the formation of these structural characteristics, leading to the final research conclusions.

3.1. Complex Network Analysis

Complex network analysis methods are increasingly being employed to study complex trade systems, offering both intuitive and quantitative insights into the spatial network patterns of trade. Unlike other analytical methods, complex network analysis treats actors as nodes and their relationships as connections, thus constructing spatial network models which provide a clearer representation of the positions of countries within the global trade network [51]. This study identifies 182 countries and regions within the global palm oil trade network as nodes, while trade connections between nodes that do not pass through other nodes are considered edges, resulting in a physical spatial network diagram through which the characteristics of the global palm oil trade network can be explored. Given the clear directional nature of palm oil trade between two countries, a directed, weighted global palm oil trade network model is constructed. The model can be expressed using Equation (1):
G = V , A , W ,
where the global palm oil trade network is represented by G, the set of nodes representing all countries involved in palm oil import and export is denoted by V, the adjacency matrix describing trade relations between countries is represented by A, and W represents the weights of the edges, specifically measuring the palm oil trade flows between countries. Each country is treated as a node, and the import–export relationships between countries form the edges of the network; that is, if palm oil trade occurs between two countries, an edge is directed from the exporting country (node i) to the importing country (node j).
To reveal the structural characteristics of the global palm oil trade network, several key indicators were calculated, as follows. First, the overall tightness of the network is considered. Indicators such as the network density (D), clustering coefficient (C), and average path length (L) provide an accurate reflection of the tightness of trade networks [52,53,54]. The network density (D) reflects the closeness of trade interactions between countries in the global palm oil trade network, with values ranging from 0 to 1, where higher values indicate greater network density and tighter connections between nodes [55]. The clustering coefficient (C) measures the distribution of nodes within a complex network, reflecting the degree of connectivity between a country and its neighboring countries. In this study, neighboring countries are not necessarily geographically adjacent; if there is palm oil trade between the two countries, they are considered neighbors. A higher clustering coefficient indicates greater clustering between countries, increasing the likelihood of forming trade blocs [56]. The average path length (L) refers to the average distance between any two nodes, representing the network’s efficiency in transmitting information (or, in this case, goods) [57]. A shorter average path length indicates higher trade transmission efficiency and accessibility, leading to increased trade efficiency between countries. The calculation formulas for the above indicators are presented in Equations (2)–(4):
D = M N N 1 ,
C = E K K 1 ,
L = 1 N ( N 1 ) × i j d i j ,
where M represents the number of trade edges in the network, N represents the number of nodes, K represents the number of trade partners, E represents the number of trade edges between trade partners, and d i j represents the geodesic distance between nodes i and j.
Next, we consider regional modularity. This study uses the modularity index Q to detect communities within the trade network, representing the degree of regional division within the modules of the global palm oil trade network [58]. The value of the modularity index ranges from −1 to 1 [59], with higher values indicating clearer regional divisions within the network and lower values suggesting weaker divisions [60]. The core–periphery structure refers to a complex network consisting of a set of tightly connected core nodes and a set of sparsely connected peripheral nodes, which primarily link to the core nodes [61]. In this study, core countries exert significant control over critical trade routes and resources, while peripheral nodes are subordinate to the core nodes.
The calculation formulas for the above indicators are presented in Equations (5)–(7):
Q = 1 2 m i , j A i j K i K j 2 m δ c i , c j ,
M A X ρ = i , j a i , j σ i , j ,
σ i , j = c i c j ,
where m represents the number of trade edges in the network, A i j denotes the trade flow between nodes I and j, and I and K j represent the total trade flows for nodeI i and j, respectively. When countriIs i and j belong to the same trade group, δ I c i , c j ) equals 1; otherwise, it equals 0. Furthermore, c indicates the centrality of each node, anI σ i , j is used to determine the presence of a core–periphery structure; in particular, the core–periphery structure exists when ρ reaches its maximum value.
Finally, the differentiation between countries is considered. This study uses node centrality to reflect each country’s position and role within the palm oil trade network, focusing on three types of centralities: degree centrality ( D C i ), closeness centrality ( C C i ), and betweenness centrality ( B C i ). Degree centrality ( D C i ) measures the number of direct connections a node has within the network, which can be simply represented by the number of neighboring nodes. Nodes with a higher degree of centrality occupy relatively important positions in the global palm oil trade network, enabling them to interact directly with multiple other nodes and serve as hubs within the trade network [62]. Closeness centrality ( C C i ) measures the proximity of a node to all other nodes in the target network, focusing on the length of the resource acquisition paths for that node. A smaller value indicates a shorter average distance, signifying stronger closeness centrality and a node that is relatively closer to other nodes in the network [63]. Betweenness centrality ( B C i ) typically indicates the strength of a country’s central role within the trade network [64], reflecting the country’s control over the entire trade network. In this study, betweenness centrality ( B C i ) represents the probability of a country being positioned between the trade nodes of other countries in the global palm oil trade network.
The formulas for calculating the above indicators are provided in Equations (8)–(10):
D C i = j = 1 n a j i ,
C C i = j = 1 n d i j ,
B C i = j n K n g j k ( i ) g j k , i j k ,
where a j i represents the number of trade connections between country i and country j, d i j denotes the geodesic distance between nodes i and j, and g j k i g j k indicates the probability that node i is on the shortest path between nodes j and k.

3.2. QAP Analysis

The quadratic assignment procedure (QAP) includes both QAP correlation and QAP regression analyses, which help to explain the correlation and regression trends between “relationships and relationships” or “relationships and attributes”. The QAP analysis does not require assumptions of independence or normally distributed data, making it particularly effective for addressing collinearity in relational data [65]. As a result, QAP analysis can provide more robust outcomes when analyzing relational data [66,67,68].
Table 1 presents the main factors influencing the formation of the global palm oil trade network structure and their explanations. Through examining the regression trends that influence the relationship in the global palm oil trade network, the QAP analysis allows for the evaluation of the following key factors shaping the structural characteristics of the global palm oil trade network.
First, according to the gravity model theory, there is a positive relationship between trade flows between countries and their economic scale. Economic fluctuations in a country inevitably impact the scale and structure of its trade, playing a driving role in the establishment of trade relations [69]. This study follows the methodology of Ruan et al. (2024), using the GDP of various economies as the explanatory variable to construct the difference matrix [45]. Second, as population size changes, the demand for palm oil products shifts, such that population size is often used as a proxy for market size [70]. Following the approach of Bai et al. (2023), this study selected population size as the explanatory variable for constructing the difference matrix [46]. Third, trade between two countries is significantly influenced by geographic and cultural factors, including variables such as the geographic distance between national capitals and whether the countries share a common language [71]. Cultural differences are also key factors influencing trade [72]. Following the approach of Chaney (2014), this study uses the geographic distance between the capitals of two countries as an explanatory variable to construct an absolute value matrix [49]. Additionally, based on Lohmann’s (2011) research [50], language is treated as a binary explanatory variable, taking a value of 1 if the countries share an official language and 0 otherwise. Fourth, the level of governance in a country significantly impacts trade relations between countries [47]. This study uses the Worldwide Governance Indicators published by the World Bank to quantify the institutional levels of economies, including voice and accountability, political stability, no violence, government effectiveness, regulatory quality, rule of law, and control of corruption [48].
Finally, following Wan and Gao (2014), this study constructs the absolute value indicator of institutional distance, denoted as r e g i i j , using Equation (11) provided below [73]. The calculated r e g i i j is then used as an explanatory variable to construct the absolute value matrix.
r e g i i j = 1 6 k 6 I i , k I j , k m a x I k m i n I k ,
where k represents the six dimensions, I i , k and I j , k denote the scores of countries i and j in dimension k, respectively, and m a x I k and m i n I k represent the maximum and minimum scores of all countries in dimension k, respectively.
QAP analysis emphasizes the correlation between two matrices. The global palm oil trade network matrix is used as the dependent variable, where the value is 1 if trade exists between two countries and 0 otherwise, thus forming a 0–1 matrix. Unlike specific trade volumes, the 0–1 matrix effectively reveals whether there is a trade link between countries, being unaffected by the size of the trade volume. This reduces the impact of global market price fluctuations and other external factors on the results, allowing us to focus more on the connectivity and dynamic adjustment patterns of the network.
As mentioned above, the structural characteristics of the global palm oil trade network are influenced by multiple factors. Previous analyses have identified key elements such as economic development, population size, geography, culture, and institutional distance, with some of these factors comprising several sub-factors. Considering the continuity and availability of data, this study utilized data from 2003, 2009, 2015, and 2023 to conduct a QAP analysis of the global palm oil trade network. The global palm oil trade network matrix was used as the dependent variable, while relationship matrices derived from various influencing factors served as independent variables, forming the following model:
P O T t = f g d p t , p o p u t , d i s t t , l a n g t , r e g i t ,
where t represents the time points (2003, 2009, 2015, and 2023), and P O T t denotes the global palm oil trade network matrix, where a value of 1 is assigned if there is trade between two countries and 0 otherwise, forming a 0–1 matrix as the dependent variable. Variables such as g d p t , p o p u t , d i s t t , l a n g t , and r e g i t represent the relational matrices of the influencing factors discussed above, serving as independent variables.
Subsequently, QAP correlation and regression analyses were performed using the social network analysis software Ucinet 6.0 in order to determine the specific impact of each factor on the structural characteristics of the global palm oil trade network.

4. Results

4.1. The Analysis of the Global Palm Oil Trade Network Structure

This section analyzes the structural characteristics of the global palm oil trade network from three perspectives: Overall structural characteristics, regional structural characteristics, and national structural characteristics. Regarding the overall structural characteristics, the key indicators for the global palm oil trade network are summarized in Table 2 (the final data presented in Table 2 are the average for each period). Over the past two decades, the network density of the global palm oil trade increased from 0.093 to 0.125, while reciprocity rose from 0.445 to 0.580. These changes indicate stronger connections and more frequent trade activities among participating countries, with growing interdependence. In the most recent period (2017–2023), reciprocity reached 0.580, surpassing the threshold of 0.5, which is typically considered indicative of moderate reciprocity. Trade activity between nodes is frequent, but differentiated characteristics still exist, with countries such as Indonesia and Malaysia having significantly higher export volumes than the global average. Additionally, the average shortest path length decreased from 1.995 to 1.910, noting that the trade distance between participating countries has shortened, trade links have become tighter, and trade activities are more efficient and accessible.
Table 3, Table 4 and Table 5 illustrate the community divisions within the global palm oil trade network over the three considered time periods within the past 21 years. The modularity index was used to divide the network into communities, excluding smaller communities with fewer participating countries and limited trade links. From 2003 to 2023, the structure of the global palm oil trade network underwent significant changes. Notably, throughout the community divisions, Community 1, led by Malaysia and Indonesia, consistently emerged as the largest one, underscoring their dominant position in the global palm oil trade. Furthermore, the number of sizable communities outside of Community 1 gradually decreased, with smaller communities merging into Community 1, driving the network toward a single large community structure. Europe, the United States, and China are the main import markets for palm oil, which is widely used in food processing, biodiesel production, and other industries with high demand. Additionally, oil-exporting countries in the Middle East play a crucial role in the global palm oil trade. Their strategic geographic location and convenient transportation links enable them to maintain close trade ties with Southeast Asian producers while establishing extensive trade networks with other importing nations, positioning them as key players in palm oil trans-shipment and regional trade. In recent years, South American and Eastern European countries have also gained prominence in the global palm oil trade.
As for the national structural characteristics, this study utilizes node strength and centrality to describe the positions of different countries within the trade network and characterize the network’s features. Table 6 presents the top ten countries in terms of both in-degree and out-degree node strength across various time periods, along with the changes in their node strength over time.
From 2003 to 2023, Malaysia and Indonesia remained dominant players in the global palm oil trade, consistently ranking first and second in both export and import volumes. This reinforces their leading position in palm oil production and trade. In addition, European countries such as the Netherlands, Germany, and Italy occupy significant roles in the palm oil trade. Although these countries cannot produce palm oil in the same quantities as Malaysia and Indonesia due to their geographic limitations, they remain key players in both imports and exports, reflecting their roles as trade and processing centers. Similarly, Singapore, as a major international trade hub, also ranks highly in both palm oil import and export.
Table 7 reflects the centralities of different nodes within the global palm oil trade network. Betweenness centrality highlights the importance of a node in connecting other nodes, with countries that exhibit high betweenness centrality playing a vital role in facilitating trade interactions. Malaysia and Indonesia consistently ranked first and second across all time periods, with their betweenness centrality being significantly higher than that of countries ranked third and beyond, underscoring their central role as connectors in the trade network. Closeness centrality measures a node’s proximity to all other nodes, indicating its position within the network. Countries with high closeness centrality have strong connections with other countries, promoting a smoother flow of information and resources. In addition to Indonesia and Malaysia, the UAE stands out in this regard. Between 2003 and 2009, the UAE ranked thirteenth in betweenness centrality and eleventh in closeness centrality. However, by 2017–2023, the UAE’s rankings had improved to seventh in betweenness centrality and fifth in closeness centrality. Overall, the UAE’s position in the global palm oil trade network has shown a gradual upward trend, reflecting its increasing participation and growing influence in the international market.
Overall, this section analyzes the evolutionary characteristics of the global palm oil trade network using export data from various countries for the years between 2003 and 2023. The global palm oil trade network has shown a relatively stable development trend. Countries involved in the global palm oil trade are becoming increasingly interconnected, with direct trade routes shortening, thus enhancing the efficiency of resource transportation. The level of intra-industry trade is deepening, international trade cooperation is strengthening, and the trade network structure remains robust. Reflecting this stable development trend, the global palm oil trade network has evolved over the past twenty years around its core trade hubs: Malaysia and Indonesia. Meanwhile, countries such as India, China, the Netherlands, the United States, and Italy have maintained stable core positions, contributing positively to the network’s steady growth. Additionally, the number of countries in semi-peripheral positions has been increasing and fluctuating annually, highlighting the potential for other countries to substitute existing trade roles in the global palm oil market [45].
In terms of exports, the global palm oil trade network has established a pattern with Indonesia and Malaysia as the core exporters. The dominance of these two countries as export hubs remains unchallenged, while countries such as the Netherlands and Thailand continue to expand their export volumes, thus gradually increasing in importance. Malaysia and Indonesia dominated global palm oil exports in 2003, with export volumes of 12,079 thousand tons and 6386 thousand tons, respectively, accounting for 57.11% and 28.07% of global exports. By 2023, Indonesia’s palm oil exports had surged to first place, increasing by 19,743 thousand tons, while Malaysia ranked second with an increase of 1386 thousand tons. At this time, these two countries accounted for 54.81% and 28.24% of global palm oil exports, respectively. Thailand and the Guatemala followed, with exports of 902 thousand tons and 873 thousand tons. At the same time, emerging exporters such as Papua New Guinea, Côte d’Ivoire, and Honduras made significant strides, increasing their exports by 202.10% from 2003 to 2023, placing them in the second tier of global exporters alongside Thailand and the Netherlands.
In terms of imports, the global palm oil trade network has developed a structure centered around India and China as the core importers. After 21 years, these two countries continue to dominate the import market, while certain countries, particularly the United States, have emerged as significant new players. India and China were the top two importers of global palm oil in 2003, with import volumes of 4026 tons and 3719 tons, respectively, accounting for 19.19% and 15.22% of the global total. In 2023, India and China remained the leading importers in the global palm oil trade network, with import volumes increasing to 9348 tons and 5895 tons, respectively. However, both countries’ share of global imports fell to 17.45% and 11.00%, respectively. Pakistan, the United States, and Bangladesh followed, with import volumes of 2984 tons, 1850 tons, and 1632 tons, respectively.

4.2. Analysis of the Mechanisms Influencing the Structure of the Global Palm Oil Trade Network

Table 8 presents the results of the QAP correlation analysis. Using the Ucinet 6.0 software with 5000 random permutations, the correlations between the global palm oil trade network matrix (POT) and matrices representing the absolute values of GDP differences (gdp), population differences (popu), capital distances (dist), common language (lang), and institutional distance (regi) were calculated.
Table 8 presents the actual correlation coefficients and significance levels at different thresholds. The correlation coefficients were derived from observed values (calculated directly from the original matrix data), reflecting the similarity or association between two matrices before any randomization. The analysis results for 2003, 2009, 2015, and 2023 revealed significant correlations of varying degrees between the global palm oil trade network (POT) and the networks representing differences in population (popu), capital distances (dist), and common languages (lang) between countries. These preliminary findings allowed for the identification of variables, such as population differences, geographic distances, common language practices, and institutional differences between countries, as key factors influencing the structural characteristics and evolution of the global palm oil trade network. Additionally, the results indicated no significant correlation between the GDP network (gdp) and the global palm oil trade network (POT), to a certain extent.
Specifically, from 2003 to 2023, the impact of population factors on the global palm oil trade network has become increasingly significant. Except for 2003, there was a negative correlation between the population disparity network and the palm oil trade network, indicating that smaller differences in population size enhance trade connections between countries, leading to closer trade relations. This suggests that countries with large populations are more likely to engage in palm oil trade with other populous nations, and trade is more likely to occur between countries with smaller population disparities.
The correlation coefficient for geographical distance was negative in all four years, with the significance level being 0 for all the years except 2003. This indicates that geographical distance has significantly influenced the evolution of the global palm oil trade network. Shorter distances reduce transportation costs and security risks while also minimizing market risks due to information asymmetry. As a result, countries tend to favor geographically closer trading partners, leading to a more stable trade network structure among nearby nations.
The correlation coefficient for language factors was positive in all four years, with most passing the 5% significance level test. This suggests that when member countries in the global palm oil trade network share a common official language, they are more likely to have similar cultural systems and customs. This cultural connection facilitates trade, increases palm oil trade volumes, and strengthens connections between nodes in the network.
Institutional differences exhibited a negative correlation with the trade network across all four years, indicating that the tightness of the trade network is inversely related to institutional differences. This means that palm oil trade tends to be more intensive between countries with smaller institutional differences, contributing to a more stable trade network structure. The significance level of this variable was very low, and for the last three years, it reached a level of 0, reinforcing the significant negative correlation between institutional differences and the trade network. Finally, the results suggest that larger economic scale differences between countries lead to a tighter palm oil trade network, although this variable did not show a significant correlation with the dependent variable in this study. This indicates that economic factors have a relatively weak or insignificant impact on the characteristics of the trade network structure.
Based on the results of the previous QAP correlation analysis, the matrices for population (popu), geographical distance (dist), common language (lang), and institutional differences (regi), which showed significant correlations with the global palm oil trade network, were included in the QAP regression analysis. Meanwhile, the GDP matrix, which exhibited a weaker correlation with the global palm oil trade network, was excluded. The number of random permutations was set to 5000, and the regression results are presented in Table 9.
The coefficient for the population (popu) was consistently negative and significant (except for a significance level of 10% in 2023), suggesting that a greater disparity in population size between two countries reduces trade volume in the global palm oil trade network. From 2003 to 2023, the coefficient fluctuated significantly but generally showed a downward trend, indicating that the negative impact of population size differences on trade is gradually weakening. This can likely be attributed to the increasing effects of economic globalization and trade liberalization, which have improved living standards and altered consumption patterns, reducing the influence of population factors on the evolution of trade networks.
The geographic distance coefficient (dist) was consistently negative and significant at the 1% level, indicating that the greater the geographic distance between capitals, the more challenging it becomes to establish trade relations and form trade links. This reflects the enduring and substantial importance of distance in international trade [74,75], particularly for homogenous goods such as palm oil, where the decline in transportation costs largely reduces the impact of psychological distance on trade rather than geographical distance [76]. The increase in globalization has encouraged countries to more actively seek out “potential customers” in nearby, under-developed regions. The author believes that this consideration takes into account the rising information costs brought about by geographic distance. The expansion of trade requires more extensive communication between buyers and sellers, which may include negotiation costs and various forms of interpersonal interaction-related costs. This increase in costs effectively offsets the decline in transportation costs [77,78,79]. Therefore, the sensitivity of international trade to distance remains significant.
The coefficient for the language variable (lang) was positive for all years, suggesting that smaller language differences facilitate the establishment of stable international trade relations. A common official language promotes communication between countries and likely reflects shared cultural values and systems, which, in turn, provides a solid foundation for the long-term development of palm oil trade networks.
The coefficient for institutional differences (regi) was negative for all four years, highlighting a stable negative impact of institutional differences on trade network formation. From 2003 to 2023, the coefficient increased from −0.057 to −0.070, indicating that the negative impact of institutional differences on trade relations has been strengthening. In particular, countries with smaller institutional differences tend to have more stable trade network relationships.

4.3. Robustness Tests

To ensure the robustness of the empirical results and improve the accuracy of the QAP model estimations, this study employed two approaches: modifying the econometric methodology and re-analyzing the data while incorporating omitted variables to verify the robustness of the findings.
The traditional gravity model is as follows:
T i j = A × G D P i G D P j D i j ,
where T i j represents the trade volume between countries I and j; A is the gravitational constant used to adjust the model’s overall size; the GDP of the two countries generally measures the size of the economies of countries i and j, represented by G D P i and G D P j , respectively; D i j is the geographical distance between the capitals of countries i and j. Taking the logarithm of both sides, the linear mode of the traditional trade gravity model can be obtained as follows:
ln T i j = α 0 + α 1 ln G D P i + α 2 ln G D P j + α 3 ln D i j ,
where α 0 , α 1 , α 2 , and α 3 are constants with α 3 being negative.
Shared borders can reduce trade costs and facilitate trade flows. A common language can facilitate trade by reducing communication and transaction costs. Population size is an important indicator of market potential, productive capacity, trade cost, and trade structure, which, together with economic size (GDP), can more fully explain and predict trade flows between countries. Therefore, adding population (popu), shared border (border), and common language (lang) variables into the gravity model can improve the explanatory power and prediction ability of the model. Thus, the linear model of the new trade gravity model is obtained as follows:
ln T i j = α 0 + α 1 ln G D P i + α 2 ln G D P j + α 3 ln D i j + α 4 ln P i j + α 5 B O R D E R i j + α 6 L A N G i j + ε i j ,
where B O R D E R i j = 0 , No   common   border 1 , Common   border , L A N G i j = 0 , No   common   language 1 , Common   language , α 0 , α 1 , α 2 ,   α 3 ,   α 4 , α 5 , and α 6 are constants with α 3 being negative; P i j is the ratio of the population size of country i and country j, indicating the difference in population size between the two countries; B O R D E R i j is a dummy variable that indicates whether countries i and j have a common border; L A N G i j is a dummy variable indicating whether country i and country j have a common language.
Through the Hausman test, it was concluded that the model is a fixed random effects model. After determining the validity of the regression model, the extended gravity model was used for regression analysis, where a step-by-step regression method was adopted. In column FE(1), only traditional gravity model variables such as economic scale and geographical distance of the two countries are added; in column FE(2), the population size of the two countries is added to expand the gravity model; in column FE(3), the control variable indicating whether the two countries speak the same language are added; and, in column FE(4), all control variables are added. The individual fixed effect model was used to perform regression on the whole sample. Table 10 below details the results of the baseline regression.
As can be seen from the table, in the four cases of stepwise regression, the impacts of the explanatory variables on the inter-country palm oil trade were significantly positive at the 1% level, indicating that the higher the economic development level of the two countries, the larger the international palm oil trade scale—which is the same as the conclusion of the QAP study. Consistent with the conclusion of the QAP study, the coefficient of geographical distance between two countries was negative, and it can be seen that the geographical distance between capitals will hinder the development of the palm oil trade between countries. Regarding the regression coefficient of control variables, it can be observed from the FE(4) column that the difference in population size between the two countries was significantly negative at the 5% level, indicating that the difference in population size between two countries reduces the trade volume of the global palm oil trade network and hinders its development—again, the same as the conclusion derived from the QAP analysis.
When incorporating omitted variables for re-analysis, this study considered economic factors, agricultural resource endowments, and trade conditions. Specifically, the exchange rate (er) was selected as an indicator of national economic development, where a matrix is constructed by calculating the absolute difference between the exchange rates of each country’s currency against the U.S. dollar [80]. Per capita arable land area (perland) was chosen to measure a country’s resource endowment, with a matrix constructed using the absolute difference in per capita arable land area between countries. Trade agreements (ta) are selected to represent external trade conditions, where a value of 1 is assigned if two countries have signed the same trade agreement and 0 otherwise, forming a binary matrix [81]. Trade composition (ct) was included as a measure of internal trade conditions, assessed as the ratio of agricultural exports to total exports of goods and services, with the matrix constructed by calculating the absolute differences between countries [82]. Table 11 presents the omitted variables included in the re-analyzed QAP analysis, along with their explanations.
All variables were included in the QAP correlation and regression analyses, and the results are presented in Table 12 and Table 13. The results in Table 12 indicate that, after incorporating variables such as per capita arable land (perland), exchange rate (er), trade agreements (ta), and trade structure (ct), the correlation coefficients of the original variables changed slightly. However, the overall trends and significance levels remained consistent with the results in Table 8, suggesting the robustness of the research conclusions.
Among the omitted variables included, the correlation coefficients of per capita arable land differences (perland) and common trade agreements (ta) were both positive, passing the 1% significance level test in most years. Countries with greater differences in per capita arable land tend to have closer ties in palm oil trade; for example, nations with larger per capita arable land may have higher palm oil production, while those with smaller land areas tend to have higher demand for palm oil products. Countries under the same trade agreement exhibit more stable connections in the palm oil trade, as trade agreements facilitate trade activities and help to maintain stable trade relationships. The correlation coefficient of trade structure differences (ct) was negative, with a significance level of approximately 5% in most years (except 2003). This suggests that economies with more similar trade structures tend to have stabler and closer palm oil trade relationships.
The exchange rate difference (er) between two countries has a positive impact on trade connections—the greater the exchange rate disparity between economies, the higher the potential for trade. However, except for passing the 10% significance test in 2003, the results for other years were not significant, suggesting that the influence of this variable on the structure of the global palm oil trade network is not substantial. Moreover, the GDP difference (gdp) between two countries remained an insignificant factor in shaping the structure of the global palm oil trade network. This finding aligns with previous research results, indicating that economic disparities between trading entities no longer play a dominant role in the current globalized market. Based on the above findings, this study excluded the gdp and er variables from the regression analysis and selected the remaining seven variables, namely, popu, dist, lang, regi, perland, ta, and ct, for regression analysis.
The results of the regression analysis are presented in Table 13. It can be seen that after adding the omitted variables, the regression coefficients of the core variables exhibited slight variations. However, the overall trend and significance remained consistent with those in Table 9, indicating the robustness of the research findings.
In addition to the core variables, the difference in per capita arable land (perland) and the presence of a common trade agreement (ta) both exerted significant positive impacts on the structure of the global palm oil trade network, with significance levels reaching nearly 1%. In contrast, trade structure differences (ct) had a negative effect, reaching a 5% significance level in most years. This suggests that beyond the impact of core variables on trade connections, palm oil trade tends to be more stable and closely linked among countries with larger differences in per capita arable land, smaller differences in trade structures, and those engaged in common trade agreements.

5. Conclusions

This study analyzed the characteristics, influencing factors, and mechanisms affecting the network structure of the global palm oil trade, additionally exploring the driving factors and their mechanisms through evolutionary path analysis. We first employed complex network analysis and QAP analysis methods using global palm oil trade data from 2003 to 2023, incorporating national annual GDP and population data, geographic distances between capitals, and indicators of whether countries share a common language for the years 2003, 2009, 2015, and 2023. Additionally, six World Governance Indicators from the World Bank Database (WDI), namely, voice and accountability, political stability and absence of violence, government effectiveness, regulatory quality, rule of law, and control of corruption, were utilized to calculate institutional distance. The key findings are as follows:
First, in terms of the overall trade network, the global palm oil trade network has evolved over the past twenty years into a more unified structure, transitioning toward a single large community. The network’s density and reciprocity have increased, with stronger connections between participating countries and more frequent and closer trade interactions, reflecting the broader forces of trade globalization and integration. Malaysia and Indonesia continue to dominate the global palm oil trade, with most of the trade still centered around these two core countries.
Second, this study examined the global palm oil trade network from three perspectives: (1) connectivity among countries involved in the global palm oil trade has increased, with trade activities becoming more frequent. While some differentiation still exists, trade has become more efficient and convenient, strengthening the network’s cohesiveness and maintaining a relatively balanced and stable structure. (2) Significant changes have occurred in the communities within the global palm oil trade network over the past twenty years. Aside from the dominant community led by Malaysia and Indonesia, the number of substantial communities has gradually decreased, with smaller communities merging into larger ones. The global palm oil trade network is thus evolving toward a single, large-community structure. (3) In addition to the dominant roles of Malaysia and Indonesia in palm oil production and trade, countries such as the Netherlands, Germany, Italy, and Singapore occupy important positions within the network. Notably, the United Arab Emirates has experienced a rising position over time, reflecting its increasing influence in the international palm oil market.
Finally, through QAP correlation and regression analyses, this study revealed that population differences, geographic distance, and institutional differences have significant and stable negative impacts on the global palm oil trade network. In contrast, language factors demonstrate significant and stable positive impacts on the network.

6. Implications

Over the past two decades, the links and reciprocity between countries involved in the global palm oil trade have increased, accompanied by the growing influence of certain countries in the trade network. On this basis, the density and reciprocity of palm oil trade networks can be further enhanced through international cooperation. Countries can reduce tariffs on palm oil and related products through bilateral or multi-lateral agreements, reduce technical trade barriers, simplify customs clearance processes, and promote the facilitation of trade. For example, countries could actively participate in regional trade agreements (e.g., RCEP and CPTPP) to expand free trade networks and enhance the density of trade networks. At the same time, information-sharing platforms focused on the supply, demand, and price of palm oil can be developed to improve market transparency while reducing trade barriers caused by geographical distance and language differences and promoting active trading networks. In addition, a mutually recognized international palm oil quality standard system and trade rules should be established, serving to clarify the quality indicators and testing methods while mitigating the increasing trade costs and trade barriers caused by differences in national systems or standards. Finally, international technical exchanges can be carried out, and transnational cooperation is encouraged in order to give full play to the comparative advantages of various countries, expand the trade network, and promote the balance and stability of the trade network structure.
Notably, with the rising price of crude oil, the importance of palm oil as a biodiesel feedstock is also increasing, and global attention is increasing on the sustainable development of renewable energy. To ensure the long-term sustainability of the global palm oil industry, countries should actively commit to the eight principles established by the Roundtable on Sustainable Palm Oil (RSPO), take responsibility for protecting natural resources and biodiversity, cooperate with international organizations, and adopt best management practices (BMPS). These practices not only aim to maximize the production capacity of palm oil but also contribute to environmental protection and promote the sustainable development of the palm oil industry on a mutually beneficial basis.
Malaysia and Indonesia have long dominated the global palm oil trade network, and as such, promoting the sustainable development of the palm oil industry in Malaysia and Indonesia is conducive to ensuring the sustainability of the global palm oil trade. In this regard, the governments of Malaysia and Indonesia can set up research and development centers for the palm oil industry, invest in the construction of modern palm oil processing plants, adopt efficient and low-carbon production technologies, and support the transition of the palm oil industry to low-carbon, high-value-added products, such as bio-based chemicals and biofuels. At the same time, strengthening carbon trading mechanisms, such as the establishment of national or regional carbon trading platforms, governmental and public agencies to prioritize the procurement of low-carbon and high-value-added palm oil products, as well as providing financial subsidies, tax breaks, and low-interest loans for low-carbon, high-value-added projects, not only can improve the competitiveness of the industry but may also help to meet the high global demand for sustainable agricultural development and low-carbon technologies. On this basis, both countries should also focus on the product certification process, aligning Malaysia’s MSPO and Indonesia’s ISPO standards with international standards such as the RSPO standard to ensure their rigor and international recognition. At the same time, growers and processors are encouraged to obtain both RSPO and domestic certification (i.e., MSPO or ISPO), with financial subsidies, tax breaks, or other incentives provided to businesses that obtain dual certification.

Author Contributions

Conceptualization, S.Z., Z.C. and S.Y.; Methodology, S.Z., Z.C., Y.C. and S.Y.; Software, S.Z., Z.C. and S.Y.; Validation, S.Z., Z.C. and S.Y.; Formal analysis, Z.C. and S.Y.; Investigation, S.Z., Z.C. and Y.C.; Resources, Z.C. and S.Y.; Data curation, Z.C., Y.C. and S.Y.; Writing—original draft, S.Z., Z.C. and S.Y.; Writing—review and editing, S.Z., Y.C. and S.Y.; Visualization, S.Z., Z.C. and Y.C.; Supervision, S.Z.; Project administration, S.Z.; Funding acquisition, S.Z. All authors have read and agreed to the published version of the manuscript.

Funding

This research was funded by the Postdoctoral Fellowship Program of CPSF under Grant Number GZC20230390 and the Fundamental Research Funds for the Central Universities under Grant Number N2406017.

Institutional Review Board Statement

Not applicable.

Informed Consent Statement

Not applicable.

Data Availability Statement

Data are available in a publicly accessible repository. Data on global palm oil import and export volumes were sourced from the Food and Agriculture Organization of the United Nations (FAO). Data on national GDP, population, and six indicators used to calculate institutional distance were sourced from the World Bank Database (WDI). Data on the geographic distances between national capitals and the presence of a common language between countries were obtained from the French Centre for Prospective Studies and the International Information Database (CPEII-Geography).

Acknowledgments

During the preparation of this work, the authors used ChatGPT(ChatGPT 3.5) for language translation. After using this tool, the authors reviewed and edited the content as needed and take full responsibility for the content of the publication.

Conflicts of Interest

The authors declare no conflicts of interest.

References

  1. Hadiguna, R.A.; Tjahjono, B. A framework for managing sustainable palm oil supply chain operations: A case of Indonesia. Prod. Plan. Control 2017, 28, 1093–1106. [Google Scholar] [CrossRef]
  2. Ramadhani, T.N.; Santoso, R.P. Competitiveness analyses of Indonesian and Malaysian palm oil exports. Econ. J. Emerg. Mark. 2019, 11, 46–58. [Google Scholar] [CrossRef]
  3. Hassanpour, B.; Ismail, M.M. Regional comparative advantage and competitiveness of Malaysian palm oil products. Oil Palm Ind. Econ. J. 2010, 10, 23–28. [Google Scholar]
  4. Maksum, A.; Muda, I.; Lubis, A.; Azhar, I.A.S. Trading of Indonesian crude palm oil supply chain and its impact on economic growth: Implementation of theory of comparative advantage and the competitive advantage of nation. Int. J. Energy Econ. Policy 2021, 11, 296–302. [Google Scholar] [CrossRef]
  5. Arsyad, M.; Amiruddin, A.; Suharno, S.; Jahroh, S. Competitiveness of palm oil products in international trade: An analysis between Indonesia and Malaysia. Caraka Tani J. Sustain. Agric. 2020, 35, 157–167. [Google Scholar] [CrossRef]
  6. Tandra, H.; Suroso, A.I.; Syaukat, Y.; Najib, M. The determinants of competitiveness in global palm oil trade. Economies 2022, 10, 132. [Google Scholar] [CrossRef]
  7. Maulana, F.R.; Sukiyono, K. Analysis of Indonesian Palm Oil Competitiveness in the Main Export Destination Countries. Indones. J. Agric. Res. 2023, 6, 68–78. [Google Scholar] [CrossRef]
  8. Yan, M.L.; Shi, W.H.; Zhou, X.L.; Yin, G.H.; Zhang, Y.; Wu, C.L. Evolution of global palm oil trade pattern and policy implications. China Oils Fats 2023, 48, 93–100. [Google Scholar]
  9. Hamidi, H.N.A.; Khalid, N.; Karim, Z.A. Palm oil trade restrictiveness index and its impact on world palm oil exports. Agric. Econ./Zemědělská Ekon. 2024, 70, 101–111. [Google Scholar] [CrossRef]
  10. Adhikari, S. Effects of Tariffs and Trade Agreements on Global Palm Oil Trade: A Gravity Model Approach. Master’s Thesis, University of Georgia, Athens, GA, USA, 2021. [Google Scholar]
  11. Ahmad Hamidi, H.N.; Khalid, N.; Karim, Z.A.; Zainuddin, M.R.K. Technical efficiency and export potential of the world palm oil market. Agriculture 2022, 12, 1918. [Google Scholar] [CrossRef]
  12. Go, Y.H.; Lau, W.Y. Palm oil spot-futures relation: Evidence from unrefined and refined products. Agricul-Tural Econ.–Czech 2019, 65, 133–142. [Google Scholar]
  13. Lee, S.; Yi, E.; Cho, Y.; Ahn, K. The path to a sustainable palm oil futures market. Energy Rep. 2022, 8, 6543–6550. [Google Scholar] [CrossRef]
  14. Myat, A.K.; Tun, M.T.Z. Predicting palm oil price direction using random forest. In Proceedings of the 2019 17th International Conference on ICT and Knowledge Engineering (ICT&KE), Bangkok, Thailand, 20–22 November 2019; IEEE: Piscataway, NJ, USA, 2016; pp. 1–6. [Google Scholar]
  15. Adhikari, S.; Poudel, D.; Gopinath, M. Is Policy Greasing the Wheels of Global Palm Oil Trade? Res. World Agric. Econ. 2023, 4, 62–77. [Google Scholar]
  16. Gereffi, G.; Humphrey, J.; Sturgeon, T. The governance of global value chains. Rev. Int. Political Econ. 2005, 12, 78–104. [Google Scholar]
  17. Gibbon, P.; Ponte, S. Trading Down: Africa, Value Chains, and the Global Economy; Temple University Press: Philadelphia, PA, USA, 2005. [Google Scholar]
  18. Appadurai, A. Modernity at Large: Cultural Dimensions of Globalization; University of Minnesota Press: Minneapolis, MN, USA, 1996; Volume 1. [Google Scholar]
  19. Oosterveer, P. Promoting sustainable palm oil: Viewed from a global networks and flows perspective. J. Clean. Prod. 2015, 107, 146–153. [Google Scholar] [CrossRef]
  20. Li, W.; Fu, D.; Su, F.; Xiao, Y. Spatial–temporal evolution and analysis of the driving force of oil palm patterns in Malaysia from 2000 to 2018. ISPRS Int. J. Geo-Inf. 2020, 9, 280. [Google Scholar] [CrossRef]
  21. Mareeh, H.Y.S.; Prabakusuma, A.S.; Hussain, M.D.; Patwary, A.K.; Dedahujaev, A.; Aleryani, R.A. Sustainability and profitability of Malaysia crude palm oil supply chain management: System dynamics modelling approach. Nankai Bus. Rev. Int. 2023, 14, 698–719. [Google Scholar]
  22. Naidu, L.; Moorthy, R. A review of key sustainability issues in Malaysian palm oil industry. Sustainability 2021, 13, 10839. [Google Scholar] [CrossRef]
  23. Tengku Hamzah, T.A.A.; Zainuddin, Z.; Mohd Yusoff, M.; Osman, S.; Abdullah, A.; Md Saini, K.; Sisun, A. The conundrum of carbon trading projects towards sustainable development: A review from the palm oil industry in Malaysia. Energies 2019, 12, 3530. [Google Scholar] [CrossRef]
  24. Gutierrez Al-Khudhairy, S.; Howells, T.R.; Bin Sailim, A.; McClean, C.J.; Senior, M.J.; Azmi, R.; Benedick, S.; Hill, J.K. Sustainable management practices do not reduce oil palm yields on smallholder farms on Borneo. Agroecol. Sustain. Food Syst. 2023, 47, 3–24. [Google Scholar] [CrossRef]
  25. Waters, K.; Altiparmak, S.O.; Shutters, S.T.; Thies, C. The Green Mirage: The EU’s Complex Relationship with Palm Oil Biodiesel in the Context of Environmental Narratives and Global Trade Dynamics. Energies 2024, 17, 343. [Google Scholar] [CrossRef]
  26. Degli Innocenti, E. Vertical Integration of the Palm Oil Sustainable Global Value Chains in Indonesia and Thailand: Sustainability Frameworks, Local Dynamics, Material and Information Flows in the Global-Local Nexus. Doctoral Dissertation, Wageningen University and Research, Wageningen, The Netherlands, 2024. [Google Scholar]
  27. Herman, P.R. Modeling complex network patterns in international trade. Rev. World Econ. 2022, 158, 127–179. [Google Scholar] [CrossRef]
  28. Huang, X.Y.; Li, G.X. Study on the Evolution of Agricultural Trade Network Patterns and Their Influencing Mechanisms in RCEP Countries—A Complex Network Perspective. Int. Econ. Trade Res. 2023, 39, 22–41. (In Chinese) [Google Scholar]
  29. Wilhite, A. Bilateral trade and ‘small-world’networks. Comput. Econ. 2001, 18, 49–64. [Google Scholar] [CrossRef]
  30. Newman, M.E. The structure and function of complex networks. SIAM Rev. 2003, 45, 167–256. [Google Scholar]
  31. Maluck, J.; Donner, R.V. A network of networks perspective on global trade. PLoS ONE 2015, 10, e0133310. [Google Scholar] [CrossRef]
  32. Wang, W.; Li, Z.; Cheng, X. Evolution of the global coal trade network: A complex network analysis. Resour. Policy 2019, 62, 496–506. [Google Scholar]
  33. Lee, J.W.; Maeng, S.E.; Ha, G.G.; Lee, M.H.; Cho, E.S. Applications of complex networks on analysis of world trade network. J. Phys. Conf. Ser. 2013, 410, 012063. [Google Scholar] [CrossRef]
  34. Fagiolo, G.; Reyes, J.; Schiavo, S. The evolution of the world trade web: A weighted-network analysis. J. Evol. Econ. 2010, 20, 479–514. [Google Scholar] [CrossRef]
  35. Li, J.; Xiao, Q.; Wu, H.; Li, J. Unpacking the global rice trade network: Centrality, structural holes, and the nexus of food insecurity. Foods 2024, 13, 604. [Google Scholar] [CrossRef]
  36. Özekicioğlu, H.; Yilmaz, B.; Alkan, G.; Oğuz, S.; Kocabaş, C.; Boz, F. Exploring the impacts of Covid-19 on the electronic product trade of the G-7 countries: A complex network analysis approach and panel data analysis. PLoS ONE 2023, 18, e0286694. [Google Scholar] [CrossRef] [PubMed]
  37. Ji, Q.; Zhang, H.Y.; Fan, Y. Identification of global oil trade patterns: An empirical research based on complex network theory. Energy Convers. Manag. 2014, 85, 856–865. [Google Scholar] [CrossRef]
  38. Bhattacharya, K.; Mukherjee, G.; Saramäki, J.; Kaski, K.; Manna, S.S. The international trade network: Weighted network analysis and modelling. J. Stat. Mech. Theory Exp. 2008, 2008, P02002. [Google Scholar] [CrossRef]
  39. Wang, J.; Dai, C. Evolution of global food trade patterns and its implications for food security based on complex network analysis. Foods 2021, 10, 2657. [Google Scholar] [CrossRef]
  40. Chen, W.; Zhao, X. Understanding global rice trade flows: Network evolution and implications. Foods 2023, 12, 3298. [Google Scholar] [CrossRef]
  41. Dalin, C.; Konar, M.; Hanasaki, N.; Rinaldo, A.; Rodriguez-Iturbe, I. Evolution of the global virtual water trade network. Proc. Natl. Acad. Sci. USA 2012, 109, 5989–5994. [Google Scholar] [CrossRef]
  42. Fan, X.; Li, X.; Yin, J.; Liang, J. Temporal characteristics and spatial homogeneity of virtual water trade: A complex network analysis. Water Resour. Manag. 2019, 33, 1467–1480. [Google Scholar] [CrossRef]
  43. Dicken, P. Global Shift: Mapping the Changing Contours of the World Economy; SAGE Publications Ltd.: Thousand Oaks CA, USA, 2007. [Google Scholar]
  44. Pye, O. A plantation precariat: Fragmentation and organizing potential in the palm oil global production network. Dev. Change 2017, 48, 942–964. [Google Scholar] [CrossRef]
  45. Ruan, Z.; Du, P.; Jiao, Y. Analysis of lithium trade patterns and influencing factors in the regions along the “Belt and Road”. PLoS ONE 2024, 19, e0307321. [Google Scholar] [CrossRef]
  46. Bai, Z.; Liu, C.; Wang, H.; Li, C. Evolution characteristics and influencing factors of global dairy trade. Sustainability 2023, 15, 931. [Google Scholar] [CrossRef]
  47. Yin, J.; Ni, Y.; Fan, Y. Tourism cooperation in the Belt and Road Initiative from economic and spatial insights. PLoS ONE 2024, 19, e0300392. [Google Scholar] [CrossRef]
  48. Low, S.W.; Kew, S.R.; Tee, L.T. International evidence on the link between quality of governance and stock market performance. Glob. Econ. Rev. 2011, 40, 361–384. [Google Scholar]
  49. Chaney, T. The network structure of international trade. Am. Econ. Rev. 2014, 104, 3600–3634. [Google Scholar]
  50. Lohmann, J. Do language barriers affect trade? Econ. Lett. 2011, 110, 159–162. [Google Scholar]
  51. Borgatti, S.P.; Foster, P.C. The network paradigm in organizational research: A review and typology. J. Manag. 2003, 29, 991–1013. [Google Scholar]
  52. Hou, Z.; Niu, X.; Yu, Z.; Chen, W. Spatiotemporal evolution and market dynamics of the international liquefied natural gas trade: A multilevel network analysis. Energies 2023, 17, 228. [Google Scholar] [CrossRef]
  53. Cong, Y.; Hou, Y.; Jiang, J.; Chen, S.; Cai, X. Features and evolution of global energy trade patterns from the perspective of complex networks. Energies 2023, 16, 5677. [Google Scholar] [CrossRef]
  54. Wang, M.; Liu, D.; Wang, Z.; Li, Y. Structural evolution of global soybean trade network and the implications to China. Foods 2023, 12, 1550. [Google Scholar] [CrossRef]
  55. Li, Y.; Peng, Y.; Luo, J.; Cheng, Y.; Veglianti, E. Spatial-temporal variation characteristics and evolution of the global industrial robot trade: A complex network analysis. PLoS ONE 2019, 14, e0222785. [Google Scholar]
  56. Kulkarni, S.; Dave, R.; Bhatia, U.; Kumar, R. Tracing spatiotemporal changes in agricultural and non-agricultural trade networks of India. PLoS ONE 2023, 18, e0286725. [Google Scholar]
  57. Zhu, X.; Liu, X. Research on the evolution of global electronics trade network structure since the 21st century from the Chinese perspective. Sustainability 2023, 15, 5437. [Google Scholar] [CrossRef]
  58. Blondel, V.D.; Guillaume, J.L.; Lambiotte, R.; Lefebvre, E. Fast unfolding of communities in large networks. J. Stat. Mech. Theory Exp. 2008, 2008, P10008. [Google Scholar]
  59. Xiao, H.; Sun, T.; Meng, B.; Cheng, L. Complex network analysis for characterizing global value chains in equipment manufacturing. PLoS ONE 2017, 12, e0169549. [Google Scholar]
  60. Zhang, Z.; Lan, H.; Xing, W. Global trade pattern of crude oil and petroleum products: Analysis based on complex network. IOP Conf. Ser. Earth Environ. Sci. 2018, 153, 022033. [Google Scholar] [CrossRef]
  61. Boyd, J.P.; Fitzgerald, W.J.; Beck, R.J. Computing core/periphery structures and permutation tests for social relations data. Soc. Netw. 2006, 28, 165–178. [Google Scholar]
  62. Hu, L.; Hu, J.; Huang, W. Evolutionary analysis of the solar photovoltaic products trade network in belt and road initiative countries from an economic perspective. Energies 2023, 16, 6371. [Google Scholar] [CrossRef]
  63. Xu, H.; Niu, N.; Li, D.; Wang, C. A dynamic evolutionary analysis of the vulnerability of global food trade networks. Sustainability 2024, 16, 3998. [Google Scholar] [CrossRef]
  64. Gao, S.; Zhang, G.; Guan, C.; Mao, H.; Zhang, B.; Liu, H. The expansion of global LNG trade and its implications for CH4 emissions mitigation. Environ. Res. Lett. 2023, 19, 014022. [Google Scholar]
  65. Wang, W.; Mao, W.; Wu, R.; Zhu, J.; Yang, Z. Study on the spatial imbalance and polarization of marine green aquaculture efficiency in China. Water 2024, 16, 273. [Google Scholar] [CrossRef]
  66. Cui, C.; Wu, X.; Liu, L.; Zhang, W. The spatial-temporal dynamics of daily intercity mobility in the Yangtze River Delta: An analysis using big data. Habitat Int. 2020, 106, 102174. [Google Scholar]
  67. Fu, J.; Huang, X.; Tong, L. Urban layout optimization in a city network under an extended quadratic assignment problem framework. Transp. A Transp. Sci. 2022, 18, 221–247. [Google Scholar] [CrossRef]
  68. McLeod, M. Tourism policy networks in four Caribbean countries. Ann. Tour. Res. Empir. Insights 2023, 4, 100113. [Google Scholar] [CrossRef]
  69. Cong, H.; Zou, D.; Gao, B.; Shao, J. Network patterns and influence factors of new energy vehicle trade along the countries of the Belt and Road. Econ. Geogr. 2021, 41, 109–118. [Google Scholar]
  70. Pu, Y.; Li, Y.; Wang, Y. Structure characteristics and influencing factors of cross-border electricity trade: A complex network perspective. Sustainability 2021, 13, 5797. [Google Scholar] [CrossRef]
  71. Wan, D.; Xu, Y.Y. A Study on the Evolution of China’s Vegetable Export Trade Patterns and Its Influencing Factors—Based on Social Network Analysis. Econ. Probl. 2024, 3, 23–29. (In Chinese) [Google Scholar]
  72. Melitz, J. Language and foreign trade. Eur. Econ. Rev. 2008, 52, 667–699. [Google Scholar] [CrossRef]
  73. Wan, L.L.; Gao, X. The Impact of Cultural, Geographical, and Institutional Distances on China’s Import and Export Trade: Empirical Evidence from 32 Countries and Regions. Int. Econ. Trade Res. 2014, 30, 39–48. (In Chinese) [Google Scholar]
  74. Berthelon, M.; Freund, C. On the conservation of distance in international trade. J. Int. Econ. 2008, 75, 310–320. [Google Scholar] [CrossRef]
  75. Smarzynska, B.K. Does relative location matter for bilateral trade flows? An extension of the gravity model. J. Econ. Integr. 2001, 16, 379–398. [Google Scholar] [CrossRef]
  76. Håkanson, L.; Dow, D. Markets and networks in international trade: On the role of distances in globalization. Manag. Int. Rev. 2012, 52, 761–789. [Google Scholar] [CrossRef]
  77. Duranton, G.; Storper, M. Rising trade costs? Agglomeration and trade with endogenous transaction costs. Can. J. Econ. /Rev. Can. D’économique 2008, 41, 292–319. [Google Scholar]
  78. Leamer, E.E.; Storper, M. The economic geography of the internet age. In Economy; Routledge: Abingdon, UK, 2017; pp. 431–455. [Google Scholar]
  79. Rauch, J.E. Networks versus markets in international trade. J. Int. Econ. 1999, 48, 7–35. [Google Scholar]
  80. Bergstrand, J.H. The gravity equation in international trade: Some microeconomic foundations and empirical evidence. Rev. Econ. Stat. 1985, 67, 474–481. [Google Scholar] [CrossRef]
  81. Duan, J.; Nie, C.; Wang, Y.; Yan, D.; Xiong, W. Research on global grain trade network pattern and its driving factors. Sustainability 2021, 14, 245. [Google Scholar] [CrossRef]
  82. Han, D.; Li, G.S. Research on the evolution and the influence mechanism of grain trade pattern between China and countries along” The Belt and Road”: From the perspective of social network. Issues Agric. Econ. 2020, 8, 24–40. [Google Scholar]
Figure 1. Global palm oil trade overview from 2013 to 2023.
Sustainability 17 03062 g001
Figure 2. Major global palm oil exporting countries in 2023.
Sustainability 17 03062 g002
Figure 3. Major palm oil importing countries globally in 2023.
Sustainability 17 03062 g003
Table 1. Explanatory variables and descriptions.
Variable NameVariable MeaningVariable Method and DescriptionData Source
gdpGross Domestic ProductConstruct a GDP difference matrix by taking the absolute difference in GDP between two countries.World Bank Database (WDI)
popuTotal National PopulationConstruct a population difference matrix by taking the absolute difference in population between two countries.World Bank Database (WDI)
distGeographic Distance Between CapitalsConstruct a distance matrix using the spherical distance between national capitals.French CEPII-Geography Database
langUse of a Common LanguageConstruct a binary language matrix, where countries with the same language are marked as 1 and others as 0.French CEPII-Geography Database
regiInstitutional DistanceConstruct an institutional distance difference matrix by taking the absolute difference in institutional distance between two countries.Calculated from World Bank Database (WDI) data
Table 2. Key indicators summary of the global palm oil trade network.
IndicatorsNetwork DensityNetwork ConnectivityAverage Shortest PathReciprocity
2003–20090.0930.7761.9950.445
2010–20160.1130.8361.9530.518
2017–20230.1250.8901.9100.580
Table 3. Main community divisions from 2003 to 2009.
Main CommunitiesMajor Countries
Community 1Malaysia, Indonesia, the Netherlands, Singapore, Italy, Germany, Denmark, etc.
Community 2China, Saudi Arabia, Sweden, Greece, etc.
Community 3the United States, UAE, Thailand, Japan, etc.
Community 4Canada, Colombia, Egypt, Lebanon, etc.
Community 5South Africa, Tanzania, Jordan, etc.
Table 4. Main community divisions from 2010 to 2016.
Main CommunitiesMajor Countries
Community 1Malaysia, Indonesia, Singapore, the Netherlands, Germany, the United States, China, etc.
Community 2Egypt, Saudi Arabia, Oman, Denmark, etc.
Community 3South Africa, Kenya, Colombia, UAE, etc.
Community 4Poland, Greece, Hungary, Austria etc.
Table 5. Main community divisions from 2017 to 2023.
Main CommunitiesMajor Countries
Community 1Malaysia, Indonesia, the Netherlands, Singapore, Germany, Denmark, the United States, China, etc.
Community 2Colombia, Ecuador, Guatemala, South Africa, etc.
Community 3Poland, Greece, Hungary, Austria, etc.
Table 6. Top 10 countries by node strength across time periods.
Ranking2003–20092010–20162017–2023
In-DegreeOut-DegreeIn-DegreeOut-DegreeIn-DegreeOut-Degree
1MalaysiaMalaysiaMalaysiaMalaysiaMalaysiaMalaysia
2IndonesiaIndonesiaIndonesiaIndonesiaIndonesiaIndonesia
3the Netherlandsthe NetherlandsUSAthe NetherlandsUSAthe Netherlands
4USASingaporethe NetherlandsGermanythe NetherlandsGermany
5ItalyItalyItalyUKItalyBelgium
6GermanyGermanySingaporeItalyGermanySingapore
7SingaporeUKGermanyBelgiumSingaporeSweden
8FranceBelgiumUKSingaporeUKItaly
9UKUSABelgiumSwedenBelgiumUK
10BelgiumFranceFranceUSAFranceSpain
Table 7. Top ten countries by centrality across time periods.
Ranking2003–20092010–20162017–2023
B C i C C i B C i C C i B C i C C i
1Malaysia 6635.704Malaysia
0.831
Malaysia
7100.097
Malaysia
0.866
Malaysia
7828.490
Malaysia
0.888
2Indonesia
5016.854
Indonesia
0.778
Indonesia
5718.932
Indonesia
0.803
Indonesia
5643.98
Indonesia
0.816
3USA
2014.967
the Netherlands
0.683
USA
2049.9665
Singapore
0.645
Singapore
2088.169
Singapore
0.676
4the Netherlands
1896.059
Singapore
0.626
Singapore
1682.788
the Netherlands
0.643
the Netherlands
1337.824
the Netherlands
0.660
5Italy
1386.014
Germany
0.613
the Netherlands
1222.203
Italy
0.630
USA
1169.708
UAE
0.634
6Singapore
1326.095
Italy
0.608
Italy
1116.207
Germany
0.617
India
795.821
Sweden
0.633
7Germany
947.728
UK
0.598
India
849.366
Belgium
0.602
UAE
788.359
France
0.629
8UK
800.327
USA
0.584
Germany
791.538
UK
0.600
Germany
779.483
Spain
0.629
9Ghana
670.302
Belgium
0.583
UK
752.141
India
0.595
Belgium
746.638
Belgium
0.625
10France
623.903
France
0.566
UAE
677.184
France
0.593
Italy
746.936
Germany
0.625
Note: B C i represents the betweenness centrality of the top ten countries; C C i represents the closeness centrality of the top ten countries.
Table 8. QAP Correlation Analysis Results of POT and Influencing Factors.
Variables2003200920152023
Obs ValueSigObs ValueSigObs ValueSigObs ValueSig
gdp1.0000.000 ***0.0170.3820.0310.308−0.0010.551
popu0.3960.059 *−0.0630.024 **−0.0160.030 **−0.0230.014 **
dist−0.1360.136−0.2270.000 ***−0.2420.000 ***−0.3590.000 ***
lang0.0250.4850.1170.035 **0.1310.020 **0.1390.006 ***
regi−0.0560.001 ***−0.0680.000 ***−0.0690.000 ***−0.0690.000 ***
Note: “Obs value” denotes the observed value, which is the actual correlation coefficient, and “Sig” represents the significance level of the results. *, **, and *** indicate significance at the 0.1, 0.05, and 0.01 levels, respectively.
Table 9. QAP regression analysis results of POT and influencing factors.
Variables2003200920152023
Std CoefSigStd CoefSigStd CoefSigStd CoefSig
popu−0.0270.046 **−0.0570.028 **−0.0100.026 **−0.0270.066 *
dist−0.1740.003 ***−0.2130.001 ***−0.2270.000 ***−0.2110.000 ***
lang0.0730.1400.0850.094 *0.0980.070 *0.1200.044 **
regi−0.0570.004 ***−0.0680.001 ***−0.0690.002 ***−0.0700.001 ***
Note: “Std Coef” represents the standardized regression coefficient, and “Sig” represents the significance level. The symbols “*”, “**”, and “***” denote statistical significance at the 10%, 5%, and 1% levels, respectively.
Table 10. Regression results.
VariablesFE(1)FE(2)FE(3)FE(4)
ln G D P i 0.299 ***
(4.60)
0.311 ***
(4.76)
0.311 ***
(4.76)
0.308 ***
(4.68)
ln G D P j 0.265 ***
(4.17)
0.270 ***
(4.24)
0.271 ***
(4.25)
0.273 ***
(4.27)
ln D i j −0.035
(−0.37)
−0.034
(−0.37)
−0.063
(−0.59)
−0.177
(−1.36)
ln P i j −0.010 **
(−2.12)
0.010 **
(−2.14)
0.010 **
(−2.14)
L A N G i j −0.382
(−0.88)
−0.168
(−0.32)
B O R D E R i j −0.599
(−1.32)
Constant−8.455 ***
(−5.35)
−8.893 ***
(−5.55)
−8.591 ***
(−5.10)
−7.626 ***
(−4.27)
F-Value39.05 ***30.06 ***24.19 ***17.67 ***
Note: The symbols “**”and “***” denote statistical significance at the 5%, and 1% levels, respectively.
Table 11. Omitted variables and explanations.
Variable NameVariable MeaningVariable Method and DescriptionData Source
perlandArable Land Per CapitaConstruct an arable land per capita difference matrix by taking the absolute difference in arable land per capita between two countries.World Bank Database (WDI)
erExchange RateConstruct an exchange rate difference matrix by taking the absolute difference in exchange rate between two countries.World Bank Database (WDI)
taTrade AgreementsConstruct a trade agreement matrix where countries with the same trade agreements are marked as 1 and others as 0.WTO Regional Trade Agreements Database
ctComposition of TradeConstruct a composition of trade difference matrix by taking the absolute difference in the composition of trade between two countries.UN Comtrade Database
Table 12. Robustness Test of QAP correlation analysis.
Variables2003200920152023
Obs ValueSigObs ValueSigObs ValueSigObs ValueSig
gdp1.0100.3760.0220.3450.0980.430−0.0010.551
popu0.4100.030 **−0.0620.025 **−0.0160.025 **−0.0230.001 ***
dist−0.1360.136−0.2970.000 ***−0.3100.000 ***−0.2510.000 ***
lang0.0910.5630.1340.045 **0.1320.025 **0.1390.006 ***
regi−0.0560.001 ***−0.0660.001 ***−0.0700.001 ***−0.0700.001 ***
perland0.0840.048 **0.0640.004 ***0.0780.000 ***0.0640.000 ***
er0.0890.062 *0.0670.3510.0460.1290.0330.462
ta0.1830.004 ***0.1760.001 ***0.1140.000 ***0.1180.000 ***
ct−0.1220.119−0.0770.023 **−0.1340.039 **−0.2450.053 *
Note: “Std Coef” represents the standardized regression coefficient, and “Sig” represents the significance level. The symbols “*”, “**”, and “***” denote statistical significance at the 10%, 5%, and 1% levels, respectively.
Table 13. Robustness Test of QAP regression analysis results.
Variables2003200920152023
Std CoefSigStd CoefSigStd CoefSigStd CoefSig
popu−0.0310.046 **−0.0220.043 **−0.0210.040 **−0.0220.046 **
dist−0.2310.000 ***−0.2130.000 ***−0.2270.000 ***−0.2110.000 ***
lang0.0660.1400.0650.069 *0.0670.029 **0.0670.044 **
regi−0.0570.000 ***−0.0680.000 ***−0.0690.000 ***−0.0700.000 ***
perland0.0450.021 **0.0440.000 ***0.0640.000 ***0.0640.000 ***
ta0.1660.001 ***0.0730.004 ***0.0780.000 ***0.0770.000 ***
ct−0.0220.060 *−0.0670.036 **−0.072−0.034 **−0.087−0.034 **
Note: “Std Coef” represents the standardized regression coefficient, and “Sig” represents the significance level. The symbols “*”, “**”, and “***” denote statistical significance at the 10%, 5%, and 1% levels, respectively.
Disclaimer/Publisher’s Note: The statements, opinions and data contained in all publications are solely those of the individual author(s) and contributor(s) and not of MDPI and/or the editor(s). MDPI and/or the editor(s) disclaim responsibility for any injury to people or property resulting from any ideas, methods, instructions or products referred to in the content.

