Abstract
The study of visitor experiences incorporating user-generated content from accommodation platforms is a distinct trend in the geography of tourism. Our research aims to better understand how this content can be instrumentalized in order to assess the viability of Airbnb accommodation ranks based on specific case studies from Greece, Italy, and Spain. The methodological frame we propose is based on two separate tools. First, the users’ reviews are summarized using sentiment analysis techniques, and the positive component is extracted as a separate indicator (predictor). The second step consists of mobilizing geographically weighted regression (GWR) to identify of the potential statistical association between the Airbnb apartments’ ranks and the quantitative outputs of sentiment analysis. The results obtained for 13 case studies are based on more than 4.6 million reviews. They clearly emphasize a gap between the rank proposed by the platform and the positive scores of sentiment analysis for the accommodation units analyzed (88,053). Despite some limitations linked to the quantity of data needed to be integrated into the investigation, the methodological frame can be transferred to other destinations, providing useful information about the potential distortions of tourism markets by the meta-description of accommodation systems.
1. Introduction
This research aims to identify the spatial structures that sentiment analysis tools detect at the scale of tourist regions (metropolitan areas, counties, and islands) located in several selected case studies from Southern Europe, i.e., Greece, Italy, and Spain. These structures can be assimilated into an apparatus of visitors’ spatial representations, and their analysis is based on the reviews available on the Inside Airbnb platform. As previous research suggests [1,2,3,4], we suspect that there is a significant difference between the evaluation of the Airbnb stock of apartments and accommodations, usually based on rankings or stars, and the textual evaluation contained in the reviews. The sentiment analysis tools can investigate and extract in a sound and condensed statistical format the level of visitors’ appreciation when applied in a rigorous context [5,6,7]. This involves cleaning and filtering the reviews, using an appropriate dictionary and a methodology that can synthesize the positive, negative, and neutral scores calculated for the text information [8,9]. One major challenge that had to be addressed in our investigation is linked to the high degree of case study heterogeneity (such as 13 metropolitan or tourist regions from three different countries), combined with the large variety of accommodation types offered by Airbnb (host rooms, villas, apartments, apart-hotels, etc.). The geographical specificities of each case study and the visitors’ socio-economic and cultural backgrounds impact the reviews both in terms of the number and descriptions of the experience. This impact generates local patterns of positive or negative evaluations of the Airbnb stock of apartments, patterns that can be assessed and measured as usual spatial structures [10,11,12]. More precisely, this research focuses on the differences between Airbnb overall rankings as they are presented in the dataset of each case study and the sentiment analysis scores of the accommodation reviews. These differences can be detected using several methods [13,14,15], but this study emphasizes the use of geographically weighted regression (GWR) as the main investigation tool [16,17]. The advantages of GWR for this analysis are derived from the fact that the output provides access to a set of local indicators that can be mapped (e.g., local R2, conditional number, slope coefficients, etc.). Considering the accommodation ratings as the explained variable and the sentiment analysis score as a predictor, GWR can be mobilized for the visualization of local clusters. The cartographic results contain the different configurations of the spatial arrangements of visitors’ perceptions. In many cases, the statistical local association between the overall rankings and the sentiment analysis synthetic results is extremely limited or insignificant.
The theoretical ground of this investigation intersects three research fields. The first one includes studies related to the online platform economy, mainly Airbnb [18], and its implications on urban tourism and land use rent in metropolitan areas [19,20,21,22]. The emergence of the online platform economy is a recent topic in the geography of tourism, with a focus on the systemic changes in accommodation choices and their territorial consequences [23,24,25]. The second direction is provided by the new interest in user-generated content, such as reviews or experience testimonials, and their impact on the client’s choices of metropolitan accommodations [26,27,28]. More precisely, this direction fuels the methodological choice of sentiment analysis tools as the main contributor to the synthesis of online Airbnb reviews [29,30,31,32]. Finally, the third direction encompasses the scientific literature dedicated to geographically weighted regression, particularly the classical works of Fotheringham et al. [33] and the subsequent applications of the method in tourism studies [34,35,36]. This theoretical framework allowed us to link concepts and methodological tools from interdisciplinary fields in a spatial approach.
Starting from these premises, the main intention of our research is to evaluate the potential association between the rankings of Airbnb accommodations and the visitors’ experiences measured by the implementation of a large-scale sentiment analysis technique of the reviews.
Regarding the structure of the paper, it is presented as follows: after Section 1 (introduction and scientific framework), Section 2 presents the methods, variables, and data sources used to achieve the previously mentioned objectives. Section 3 presents and synthesizes the results of the study, and Section 4 shows to what extent the results obtained validate the working hypothesis. The last section includes the conclusions of our study and the limitations and provides practical guidelines for tourism management and decision-making in this sector of activity.
2. Materials and Methods
The data used in this research were collected from the Inside Airbnb platform [37], a gateway for downloading relevant datasets concerning Airbnb diffusion in metropolitan areas, and supplementary datasets such as accommodation reviews. The main intention of the Inside Airbnb platform is to distribute the collected data to the scientific community so that the effects of Airbnb on the local real estate markets can be better understood in terms of rental price distortions or access to affordable housing. The studies available on the platform’s internet page emphasize the need to better regulate this form of “sharing economy”, sometimes in a highly critical way [38]. Our intention is not to be a part of this debate but to implement an analytical and methodological frame that enables a better territorial approach to the Airbnb review system. We suspect that the reviews of the apartments can be decomposed into two components: one based on place attributes and the other on tourists’ representations. This paper investigates the statistical relation between the two components and highlights the limits of the Airbnb review system in a set of selected case studies from the Mediterranean Sea region.
The study area is composed of 13 metropolitan and regional tourist areas from Greece, Italy, and Spain, such as Athens, Thessaloniki, South-Aegean Islands, Crete, Naples, Venice, Sicily, the Puglia region, Barcelona, Mallorca, Menorca, Malaga and Valencia. The choice of this research area is given by the mix of different forms of tourism specializations, starting from heliotropism and ending with cultural and business tourism. This heterogeneity of the case studies is intentional, and it serves to compare the review scales of Airbnb accommodations by comparing them to the sentiment analysis of the visitors’ descriptions of their experiences. A data collection approach was implemented for this analysis. For each of the 13 case studies (Table 1), we collected the approximate location of the Airbnb accommodations units and descriptive indicators, including the latitude and longitude, the price (by night), the number of rooms, etc.

Table 1.
General description of the case studies datasets.
The data available for download include a set of indicators describing an evaluation of the accommodation premises: the overall review rating score (scaled from 0 to 5) and the number of reviews received. The datasets are continually updated, so we have a partial description of the visitors’ perception of the Airbnb apartments, with an end date of validity in June 2024.
Each Inside Airbnb dataset was mapped as a point structure based on the pair of latitude and longitude attributes available for each accommodation. According to the indicator descriptions, the degree of precision for the location varies between 0 and 150 m. As we intended to detect the association between the review scores of an accommodation and the sentiment analysis output from visitors’ experiences based on the comments (reviews) posted on the Airbnb Platform, the degree of location precision would likely interfere with our methodological approach. However, this is an aspect of the data quality check that is out of our control. Once the mapping process was completed, 13 base maps in the WGS84 coordinate system were obtained. Each accommodation detains a unique ID (listing ID) that matches the set of comments or reviews downloaded for the case studies. The next step of our methodological investigation was the implementation of sentiment analysis techniques for each metropolitan area or tourist region available for our study. The sentiment analysis techniques are available as an integrated tool in the open-source Orange Statistical Software–Text Mining Plug-In (Version 3.38.1). The options related to the tool are rather limited compared to other software packages. There are five dictionaries available, four being multilingual and only one being English-oriented [39]. Our choice was to perform the analysis using the Vader dictionary for reasons regarding reliability and output. Compared to the other four options, when the Vader dictionary is applied in sentiment analysis, it provides 4 indicators: the positive, negative, and neutral score of speech (scaled from 0 to 1) and the compound score (scaled between −1 and 1).
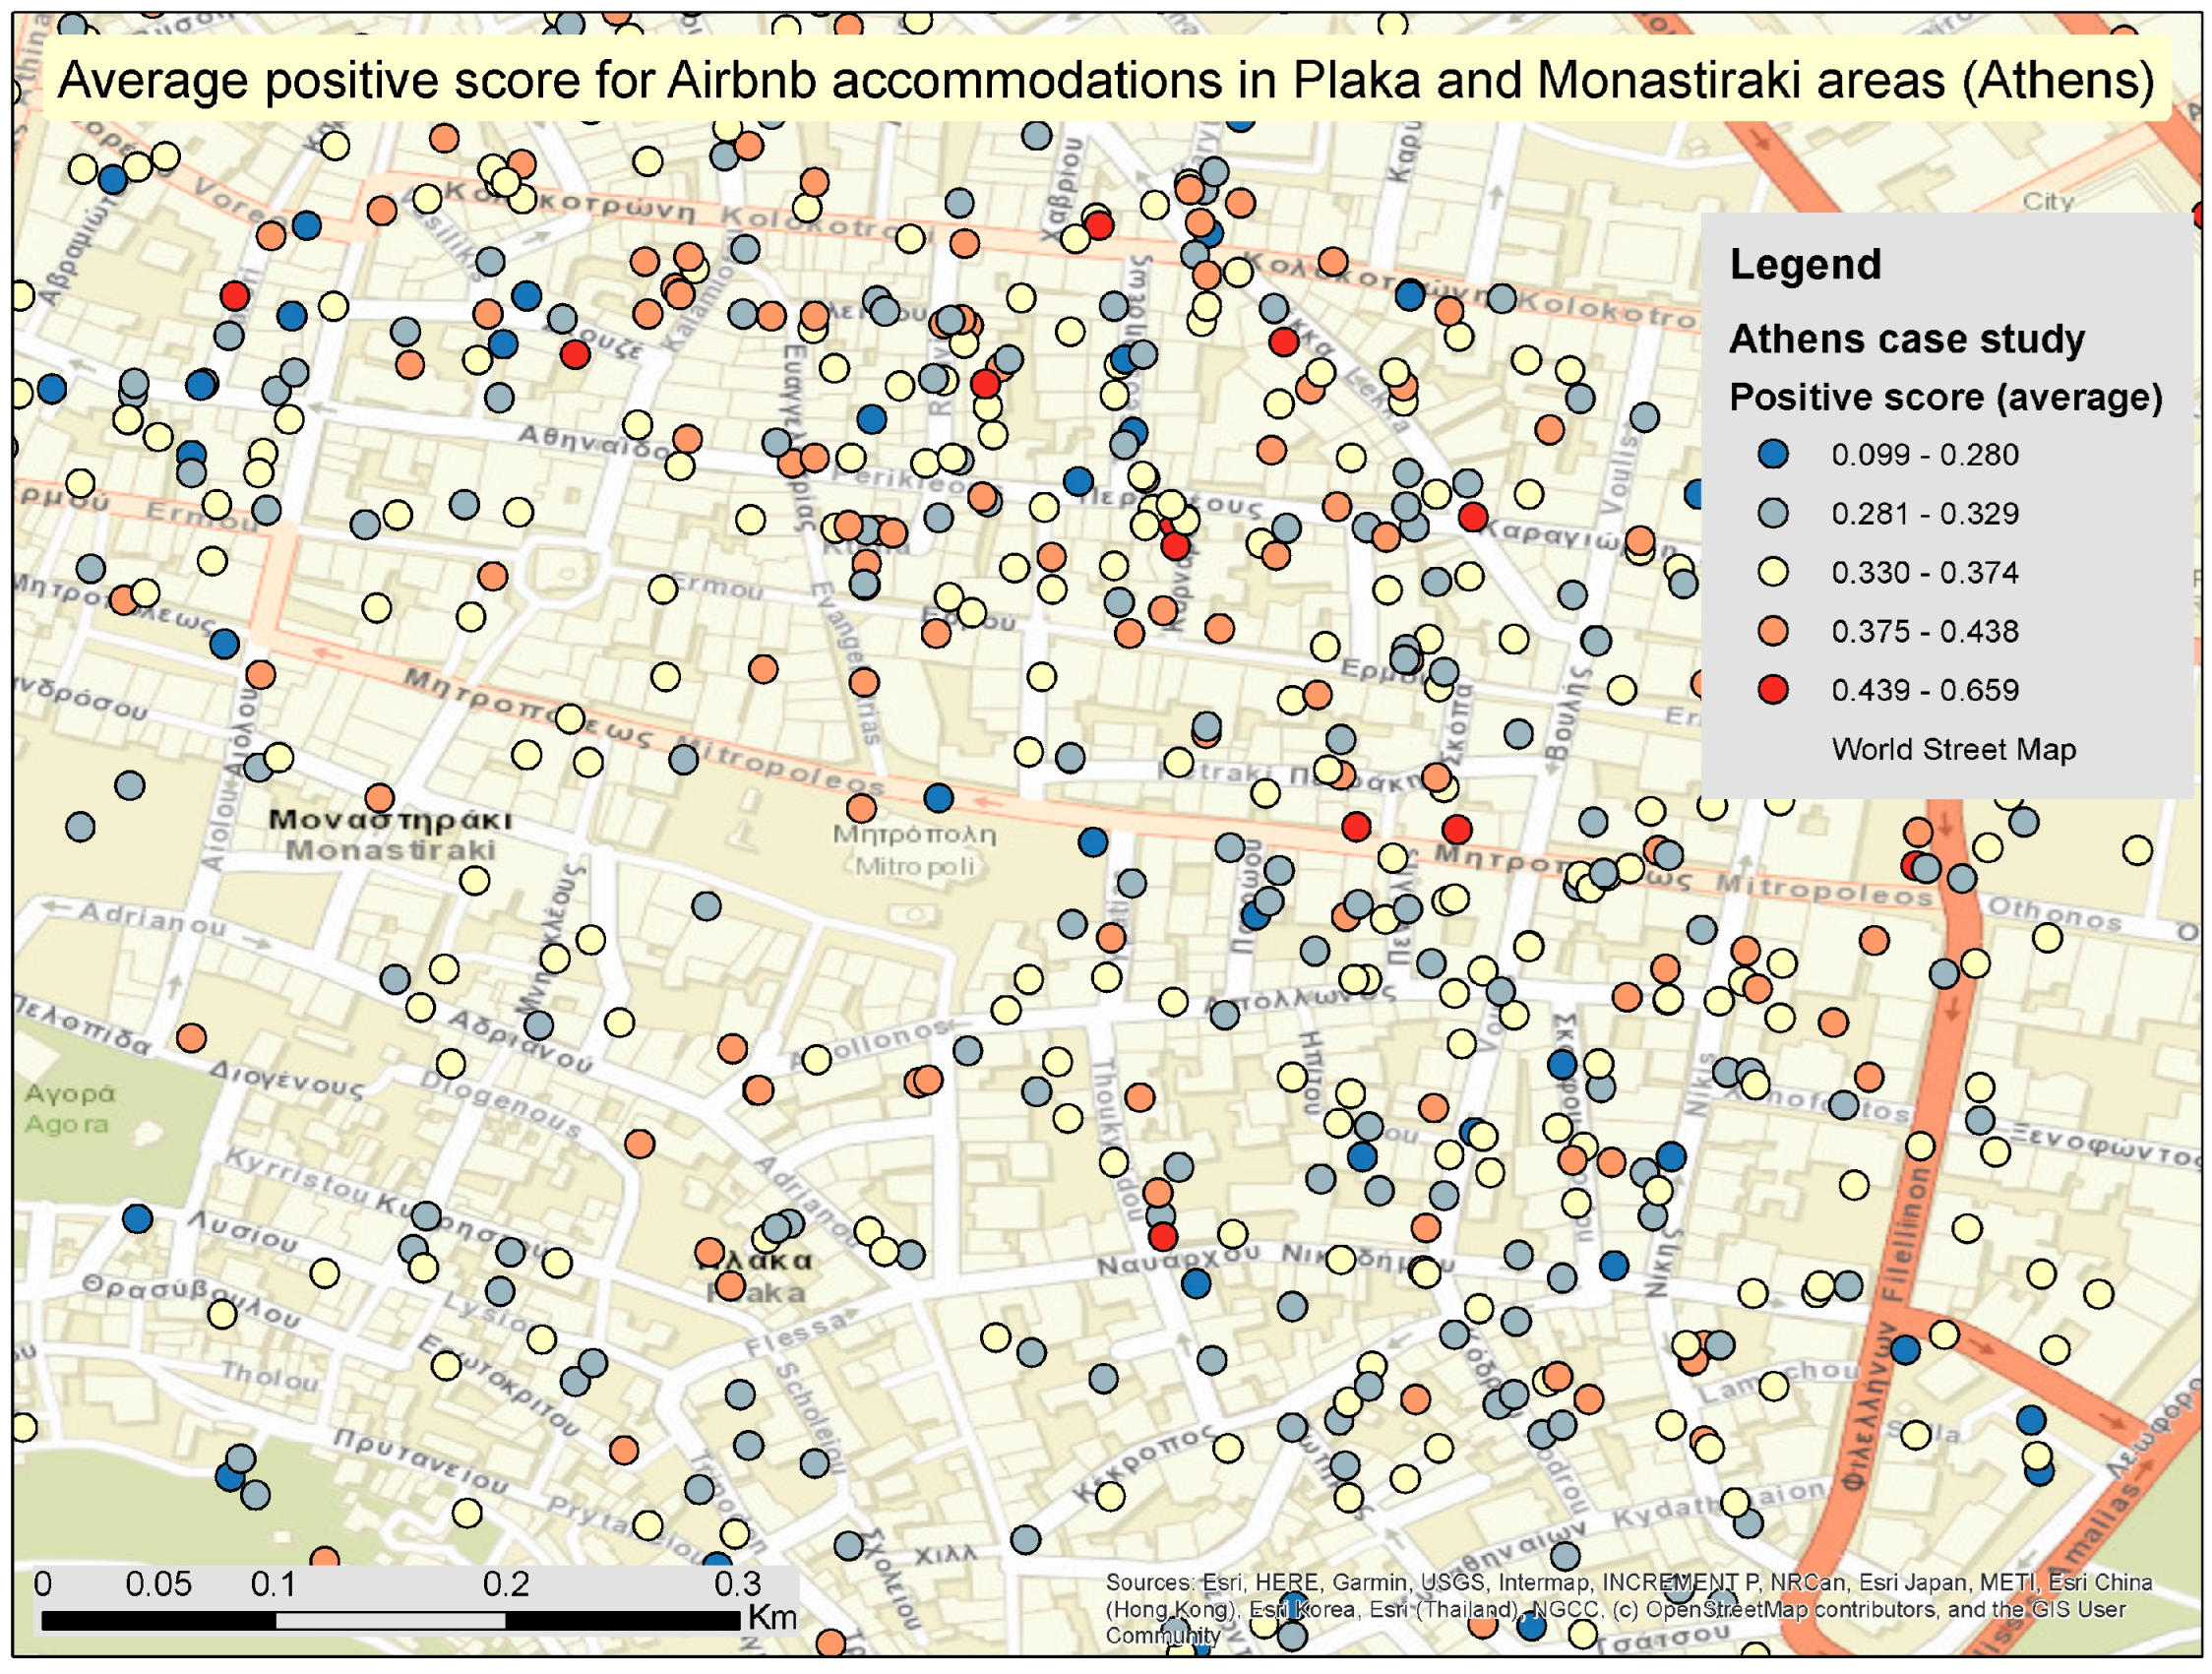
These multiple outputs can be used as a filter in order to detect non-English reviews of Airbnb users. For example, a review in another language will be automatically printed with a score of 1 on the neutral component and 0 on the compound indicator. Based on this characteristic of the tool’s implementation, we have excluded a large part of the non-English reviews, and we cleaned the initial database by eliminating approximately 28% of the visitors’ comments. The workflow in Orange Statistical Software involves importing the .csv files containing the reviews, converting these files into corpus files (internal files of the software), implementing the sentiment analysis tool, and extracting results. Finally, four synthetic indicators were obtained for each Airbnb accommodation available in the 13 case studies datasets: the average score for the positive reviews, the average score for the negative reviews, the average score for the neutral reviews, and the mean of the compound component. These results can be mapped and conserved for further analysis (Figure 1).
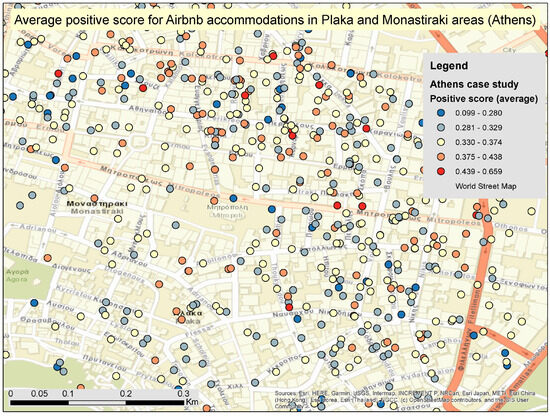
Figure 1.
Illustration of the sentiment analysis output at the scale of Athens (selected areas: Plaka and Monastiraki). Source: own representation.
The analysis of the 13 datasets showed that the number of apartments with a small number of reviews is extremely high for all the case studies. The statistical distribution of the reviews by case study is asymmetric, with the number of accommodations with no comments or only 1 review being highly dominant. This can be explained by several factors, such as new entry into the business, accommodations located in less-visited areas, or visitors’ reluctance to provide reviews. Given this situation, we have filtered the overall database using a simple criterion: if the number of reviews was larger than 6, the accommodation was retained in the datasets. Otherwise, it was eliminated. The choice for 6 reviews is derived from the geographical heterogeneity of the research area. In some cases (Crete, South Aegean Islands, or Mallorca), the reasons for Airbnb diffusion are linked to heliotropism. Tourism seasonality has an average duration of no longer than 6 months (from May to October, in general). In this case, having at least one potential review by month is a relevant and reasonable filter. Imposing this criterion severely reduced the number of premises available for each case study, but it allowed us to conserve the accommodations for which we have minimum control regarding the consistency of visitors’ experiences.
The basic statistical summary describing the output of the sentiment analysis tool underlines the relative heterogeneity in the visitors’ positive perceptions of Airbnb accommodations (Table 2). The highest means are observed in the case of Thessaloniki and Athens, while the lowest are associated with the two islands of Mallorca and Menorca. The standard deviation depicts a limited variation between the case studies, indicating a potential regional consensus on the perceptions. As a general rule, the histograms of the positive scores exhibit a moderate to high kurtosis, suggesting that the visitors’ appreciation of the accommodations is concentrated around the means.
Table 2.
Basic statistical indicators of the case studies datasets (with the average positive sentiment analysis score as a predictor).
To resume, after a massive download of indicators describing the location and the customers’ perception of Airbnb accommodations in the spatial frames of the 13 case studies, sentiment analysis was implemented on the review datasets. For each accommodation, an average score of positive, negative, or neutral perception was calculated. After filtering, the database became operational for a more in-depth investigation that aimed to establish if a statistical association exists between the review scores and the outputs of the sentiment analysis tools. In order to detect and measure this association, geographically weighted regression (GWR) was applied to each case study. We selected the GWR technique because it is much more suitable for detecting local patterns of similar spatial behavior regarding the explained variable, compared to an ordinary least squares regression (OLS), where the intensity of the association is globally taken into account. In many regards, the GWR method is optimal for the analysis of tourism economic landscapes [40,41], as it can optimally encompass the challenges of dealing with discrete spatial objects, such as hotels or other forms of accommodations. The general formalization of geographically weighted regression is apparently simple, being a source of methodological criticism for this geostatistical tool. The criticism mainly focuses on the potential risk of obtaining results biased by local multicollinearity, especially when the variables included in the modeling process exhibit patterns of local clustering. In its basic form, according to Fotheringham et al. [33,42], the GWR mathematical model is
where
- yi = estimated value for a point i;
- xi = predictor for point i;
- = intercept for i;
- = coefficients of predictors (slope) for i;
- = coordinates of point i;
- = error term associated with i.
The estimation of the coefficients is derived from a set of multiple equations, using a distance decay function that weights the values of the predictors in each point of the model’s kernel. In mainstream GIS software (e.g., ESRI ArcGIS), the kernel is negative exponential. However, more specialized tools will optionally use quadratic, Gaussian, or more mathematically complex kernels [43].
Our methodological approach was guided by a set of compulsory steps described as follows:
1. Defining the explained (Y) and explanatory variables (X): In our case, we explain the intensity of the overall review scores of each accommodation (Y) by the average positive score (X) obtained as the output of the sentiment analysis tool applied to visitors’ comments (reviews) available on the Inside Airbnb platform.
2. Optimizing the spatial lag needed for the implementation of the GWR tool: As this particular form of regression analysis demands a clear definition of the spatial context in which one will perform it, we made an option for a variable kernel of 42 neighbors. The choice of a fixed bandwidth was not an option, as it might provide unstable results in areas with a low density of accommodations. Basically, this variable kernel serves as a weighting moving window for both the Y and X variable values, capturing the degree of statistical association between the two indicators used for the analysis well. With 2 degrees of freedom extracted from the kernel size, the value of 40 points is large enough to validate the potential statistical dependency of Y as a function of X.
3. Extracting one precise output of the GWR in order to validate (or invalidate) the variance in the overall review scores of each accommodation (Y) as a function of the sentiment analysis output (X being the average score of positive reviews): Our option, in this case, was the instrumentalization of the local R2 (local coefficient of determination). This indicator is scaled between 0 and 1, with values close to one indicating an intense statistical link between the variables. Moreover, given the linear nature of the regression models, the local R2 allows us to deduce the local Pearson r coefficients of correlation by extracting their square root. This operation is necessary to validate the intensity of the statistical association between X and Y, using common tools, like a table of critical values of r, for different p values.
4. Mapping, validating, and explaining the spatial patterns observed during the evaluation of the two indicators. If the mapping process is automatically implemented in the GIS tools of spatial analysis (iterative processes in a model builder framework), the validation of the correlation between the overall review score of each accommodation (Y) and the output of sentiment analysis (X, the average score of positive reviews) is more complex. The common scientific thresholds of the p values are 0.2, 0.1, 0.05, 0.02, and 0.01. For each p-value, a minimum coefficient of correlation (deduced using the local R2) is needed for its validation. A synthesis of these constraints is available in Table 3. Given the extent of the datasets, it was impossible to deduce or calculate alternative indicators of statistical association (e.g., Spearman rank coefficient). In this case, one potential limitation of our methodological approach is the impossibility of determining the morphology of the association between the indicators analyzed. We have no information regarding the cases where, for an unspecified kernel, i, the shape of the point cloud exhibits nonlinearity.
Table 3.
Class breaks based on the statistical association between rating and sentiment analysis output.
The values contained in the table are used as uniform breaks in the discretization process of all the case studies and during the inherent mapping exercise. The accommodations with a local R2 larger than 0.0926 are characterized by a strong statistical association between the overall review scores and the average positive values of the comments’ sentiment analysis. In contrast, values of the local R2 that are smaller than the threshold will indicate a lack of a valid correlation between the two indicators. This lack of correlation will be a spatial mark for accommodations where the rating is statistically independent of its predictor, the visitors’ perception. In the next section of the paper, we analyze the morphology of the statistical correlation in each case study.
3. Results
The output of the GWR shows that the correlation between the general review scores of Airbnb accommodations and the positive component of sentiment analysis is not systematically valid. One will have many more chances to find that the overall review scores are generally independent of the positive component, indicating that the evaluation of the Airbnb apartment stock is dictated by factors that do not always overlap with the visitors’ perceptions. This general conclusion is visible on the maps of the local R2 for each case study and presents theoretical interest, both for tourism geography and behavioral studies. In the last case, the mechanism that dictates the dissociation between the rating process and the perception of the accommodation can open the way to more qualitative-based investigations using surveys and interviews. Expanding the scale of the analysis to other case studies (e.g., metropolitan areas with a lesser degree of tourism specialization) could be an opportunity to establish if the observed patterns are just a characteristic of the Southern Europe area.
We analyzed the spatial distributions of the local coefficient of determination in order to detect the local clusters of significant R2 values in different territorial contexts. Given the variety of situations collected in the database, the main challenge was to aggregate the outputs of the GWR into a sound visual and scientific product. This is the reason why we have aggregated the 13 case studies at national levels (Greece, Italy, and Spain), extracting the general conclusions of our investigation and the particular deviations from the observed regularities in the distribution of the local R2.
In the case of Greece (Figure 2), the heterogeneity of the case studies interferes with the elaboration of general rules extracted from the observation of the analyzed indicator (local R2). In the case of Athens, the high values of the local coefficient of determination are concentrated in a set of neighborhoods characterized by proximity and accessibility to the main attractions.
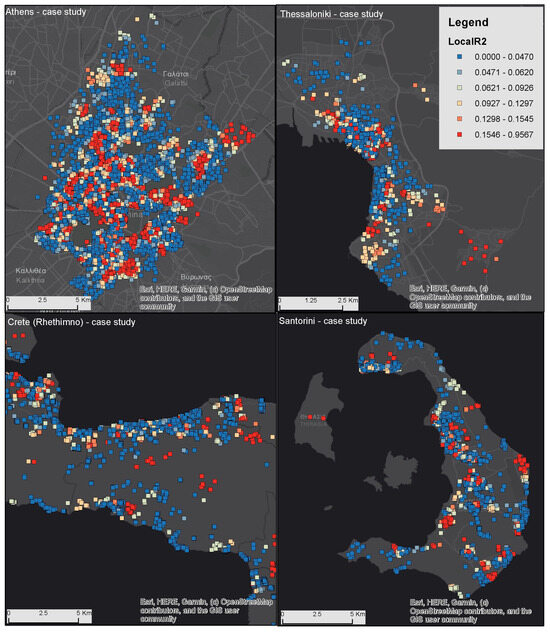
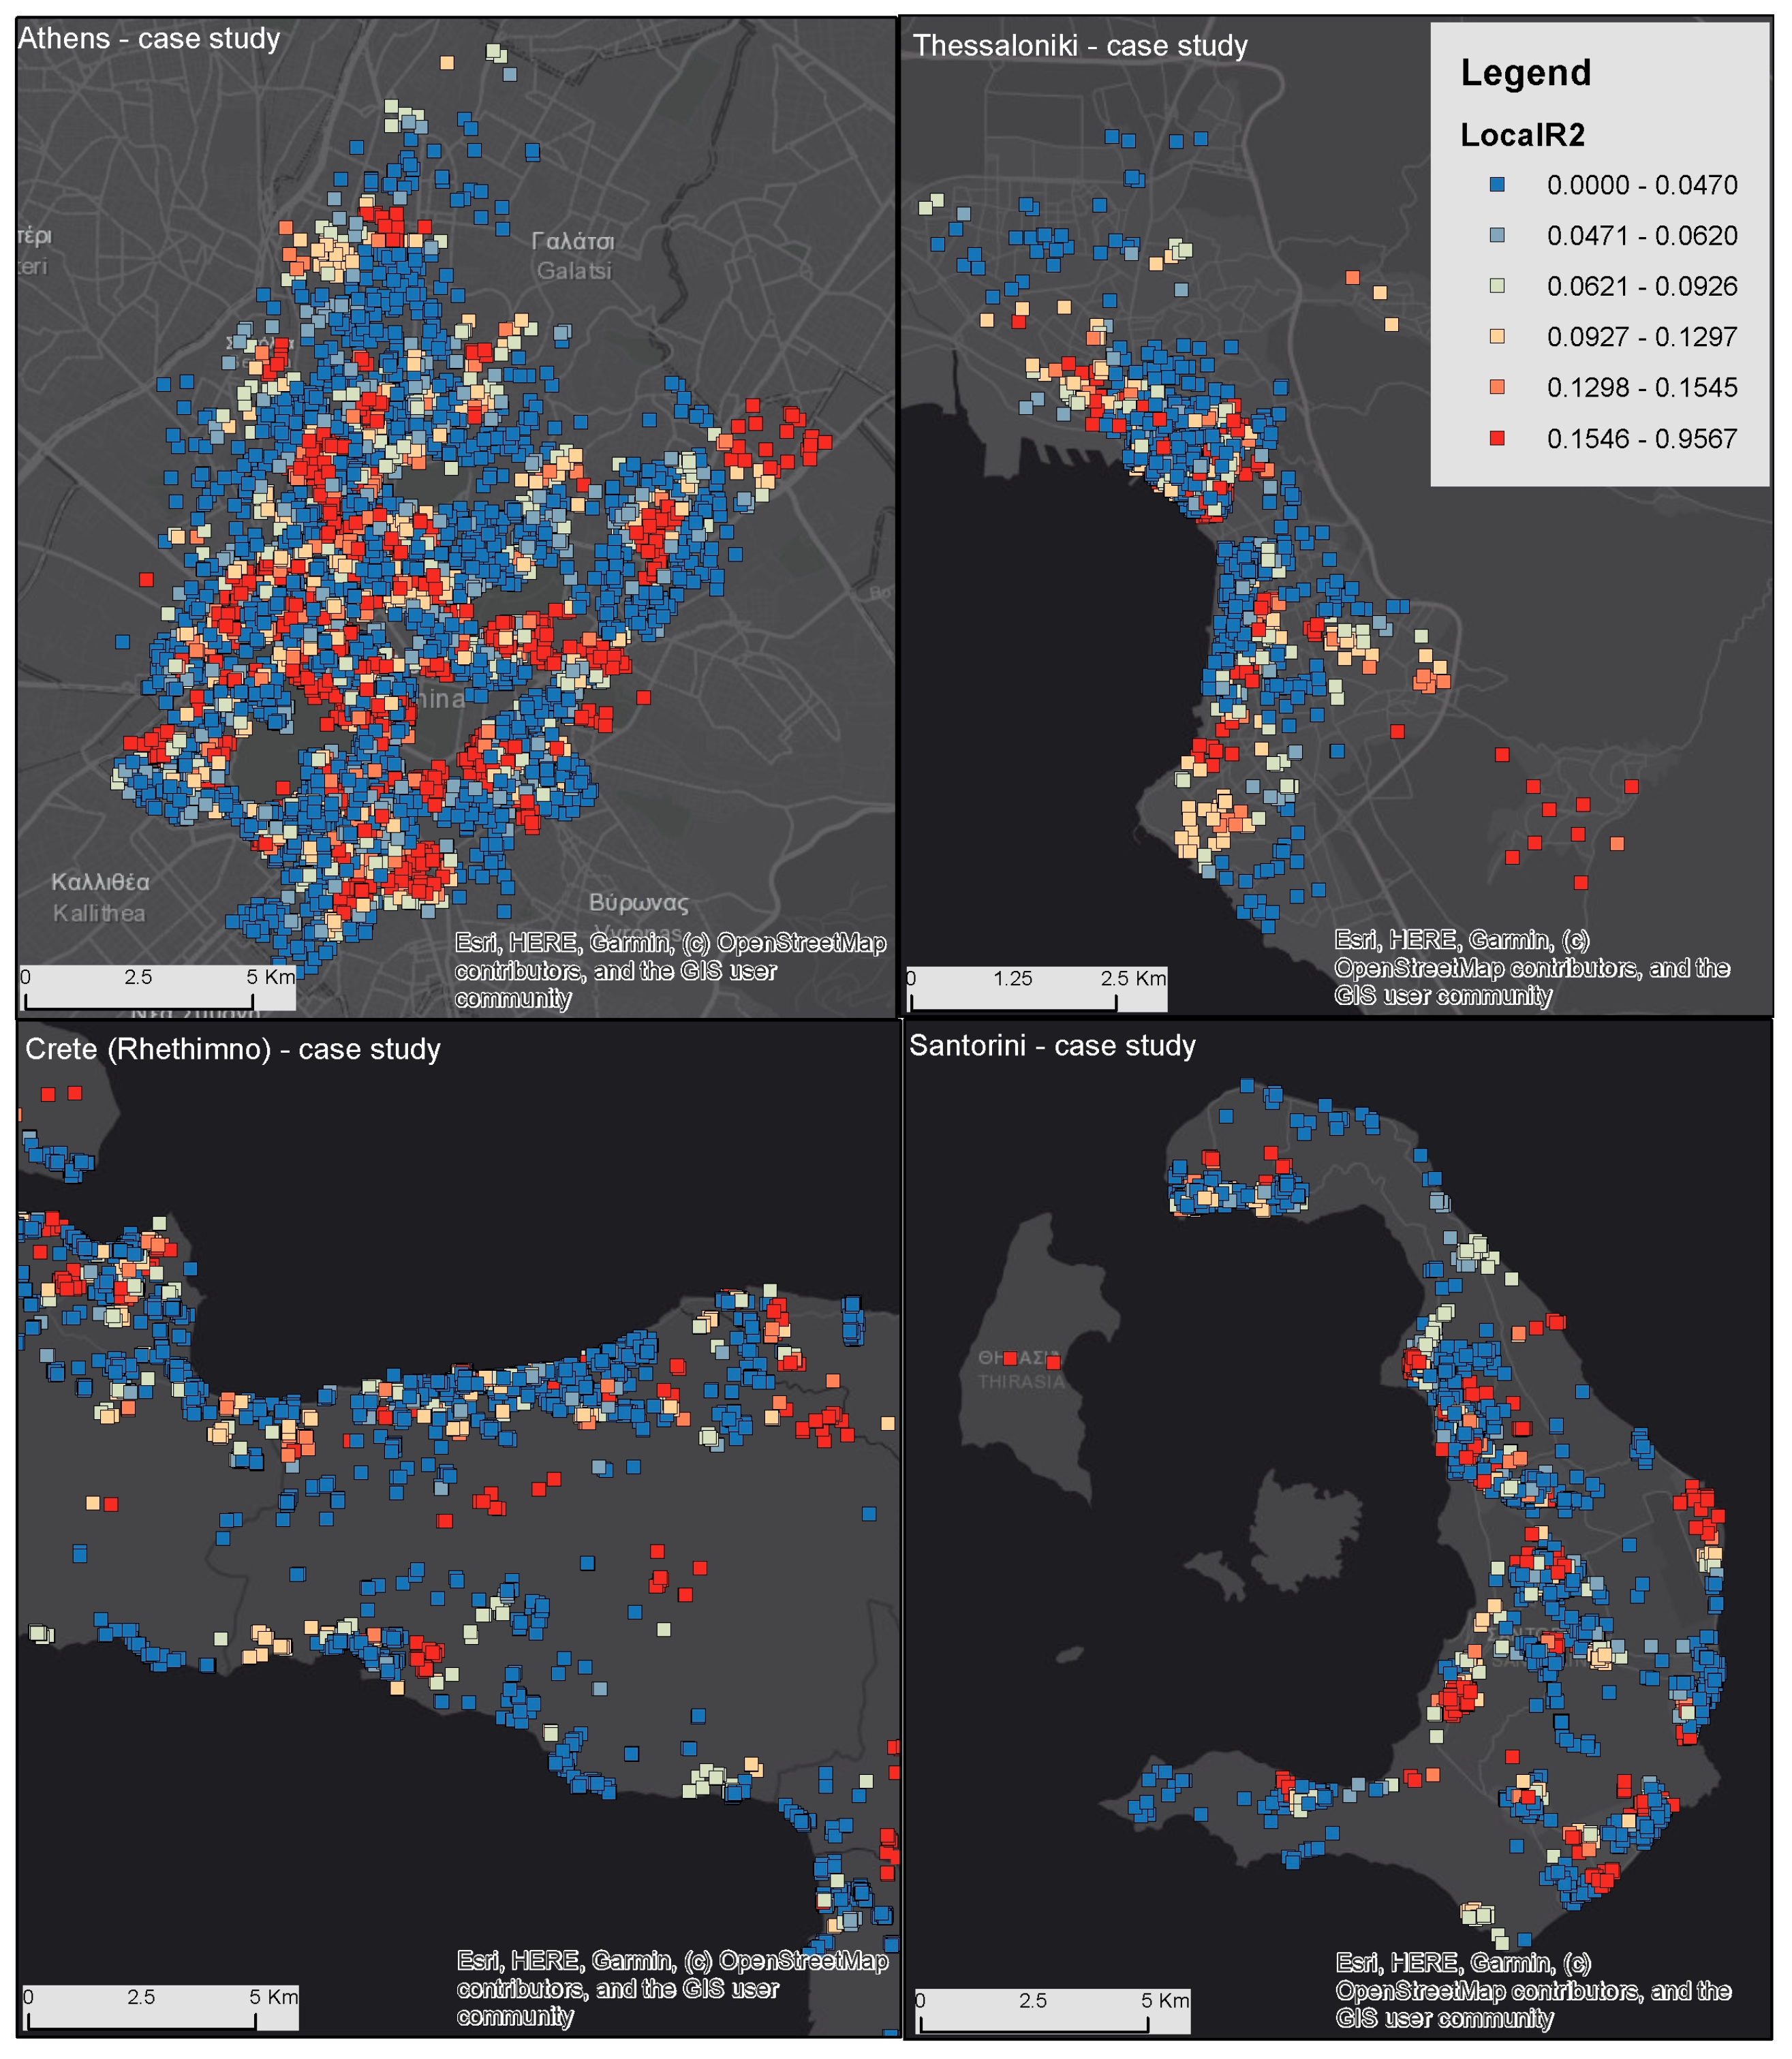
Figure 2.
Statistical association between sentiment analysis output and Airbnb ranking score-selected case studies in Greece. Source: own representation.
These pools of concentration are separated by areas where the correlation between the two indicators is rather poor, highlighting the presence of less visited areas of Athens–such as common neighborhoods with residential or academic functions, the higher-class parts of the city, or areas with a higher degree of negative perception (e.g., Omonia Street). The patchwork visible in the spatial distribution of the local R2 indicator and its associated gradients leads us to the conclusion that the overall accommodations ranking is only partially linked to the positive score obtained during the sentiment analysis of the visitors’ comments. In the case of Thessaloniki, the situation is somehow different. As a general rule, the low values of the local R2 are dominant in the city center, and higher values are observed in the peripheries. The same pattern is also visible in the case of the Cretan cities, especially those investing in massive strategies for attracting tourists (e.g., Rhethimno).
The last case studies analyzed from the South Aegean Islands and the degree of heterogeneity in the observed distribution of the local R2 are an invitation to an idiographic approach. It is hard to detect common patterns in the spatial repartition of the local R2, as each island offers its own pattern. Overall, the South Aegean Islands present a ratio of valid association between the overall accommodation ranking and the positive component of the sentiment analysis, at least when compared to Crete. In the case of Santorini, for example, the pools of high values of the R2 are relatively numerous, taking into account the size of the island and its diversity. They are located in somehow surprising areas such as Agios Georgios, Monolithos, or Megalochori, with the mainstream destinations (Imerovigli, Fira, or Oia) being dominated by lower values of the indicator. The key research findings from the Greece case studies support our initial hypothesis: there is a dissonance between the Airbnb accommodation rankings and the visitors’ reviews, which can be of interest to the management of tourism activities at the local scale. Basically, one average tourist seeking to rent an Airbnb apartment or villa in Greece will be generally confronted with two potential opposite situations: the visitors’ reviews systematically over-rate or penalize the accommodations, in some cases with values that go beyond +/−0.5 points of rating, on the scale from the 0 to 5, specific for the explained values in the geographically weighted regression model.
A similar situation is visible in the case of the Italian metropolitan areas and regions included in the research (Figure 3). Naples proposes a particular spatial pattern in the distribution of the local R2. The intensely touristified neighborhoods from the city core (Spanish Quarter, Porto, Plazza del Plebiscito, etc.) are areas where the values of the indicator are high (>0.0926) and clustering. The rest of the metropolitan area of Naples, except Vomero or the airports’ proximities, hosts accommodations with values under the chosen threshold.
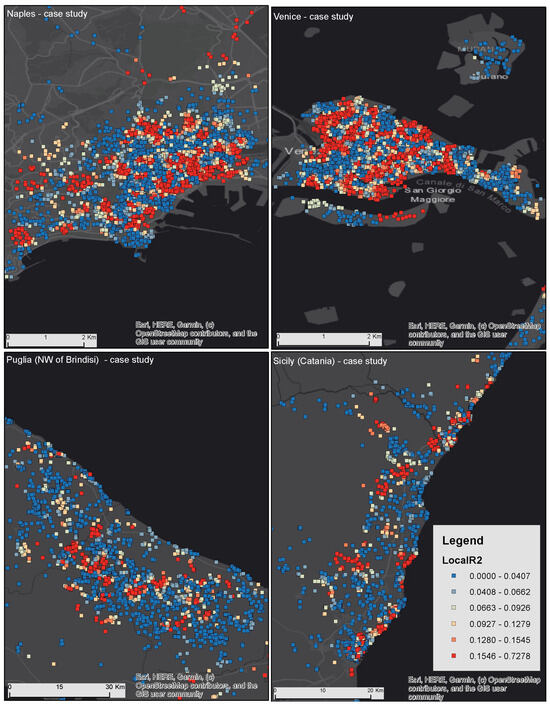
Figure 3.
Illustration of the sentiment analysis output in the case of some Italian metropolitan areas and regions. Source: own representation.
Venice depicts a pattern close to Naples, with two supplementary remarks: the number of high-value clusters is considerably higher, given the size of the study area, and the case study works in a binomial way, with the city of Mestre included in the analysis. Without being a systematic rule, the clusters of significant values are associated with the presence of major attractions and the Grand Canal, with the inner quarters and neighborhood being depicted by lower and statistically insignificant values for the local coefficient of determination. The other two case studies (Sicily and the Puglia Region) are more complex in spatial extent and exhibit a multitude of local situations. The general regularity observed during the analysis is the reduction in clusters of high values of the local R2. What is dominant in the statistical landscape are local coefficients smaller than the validity threshold of 0.0926, suggesting that the tourist areas that are not endowed with metropolitan cores are less prone to present a relevant association between the accommodation rankings and the positive component on the sentiment analysis of the reviews.
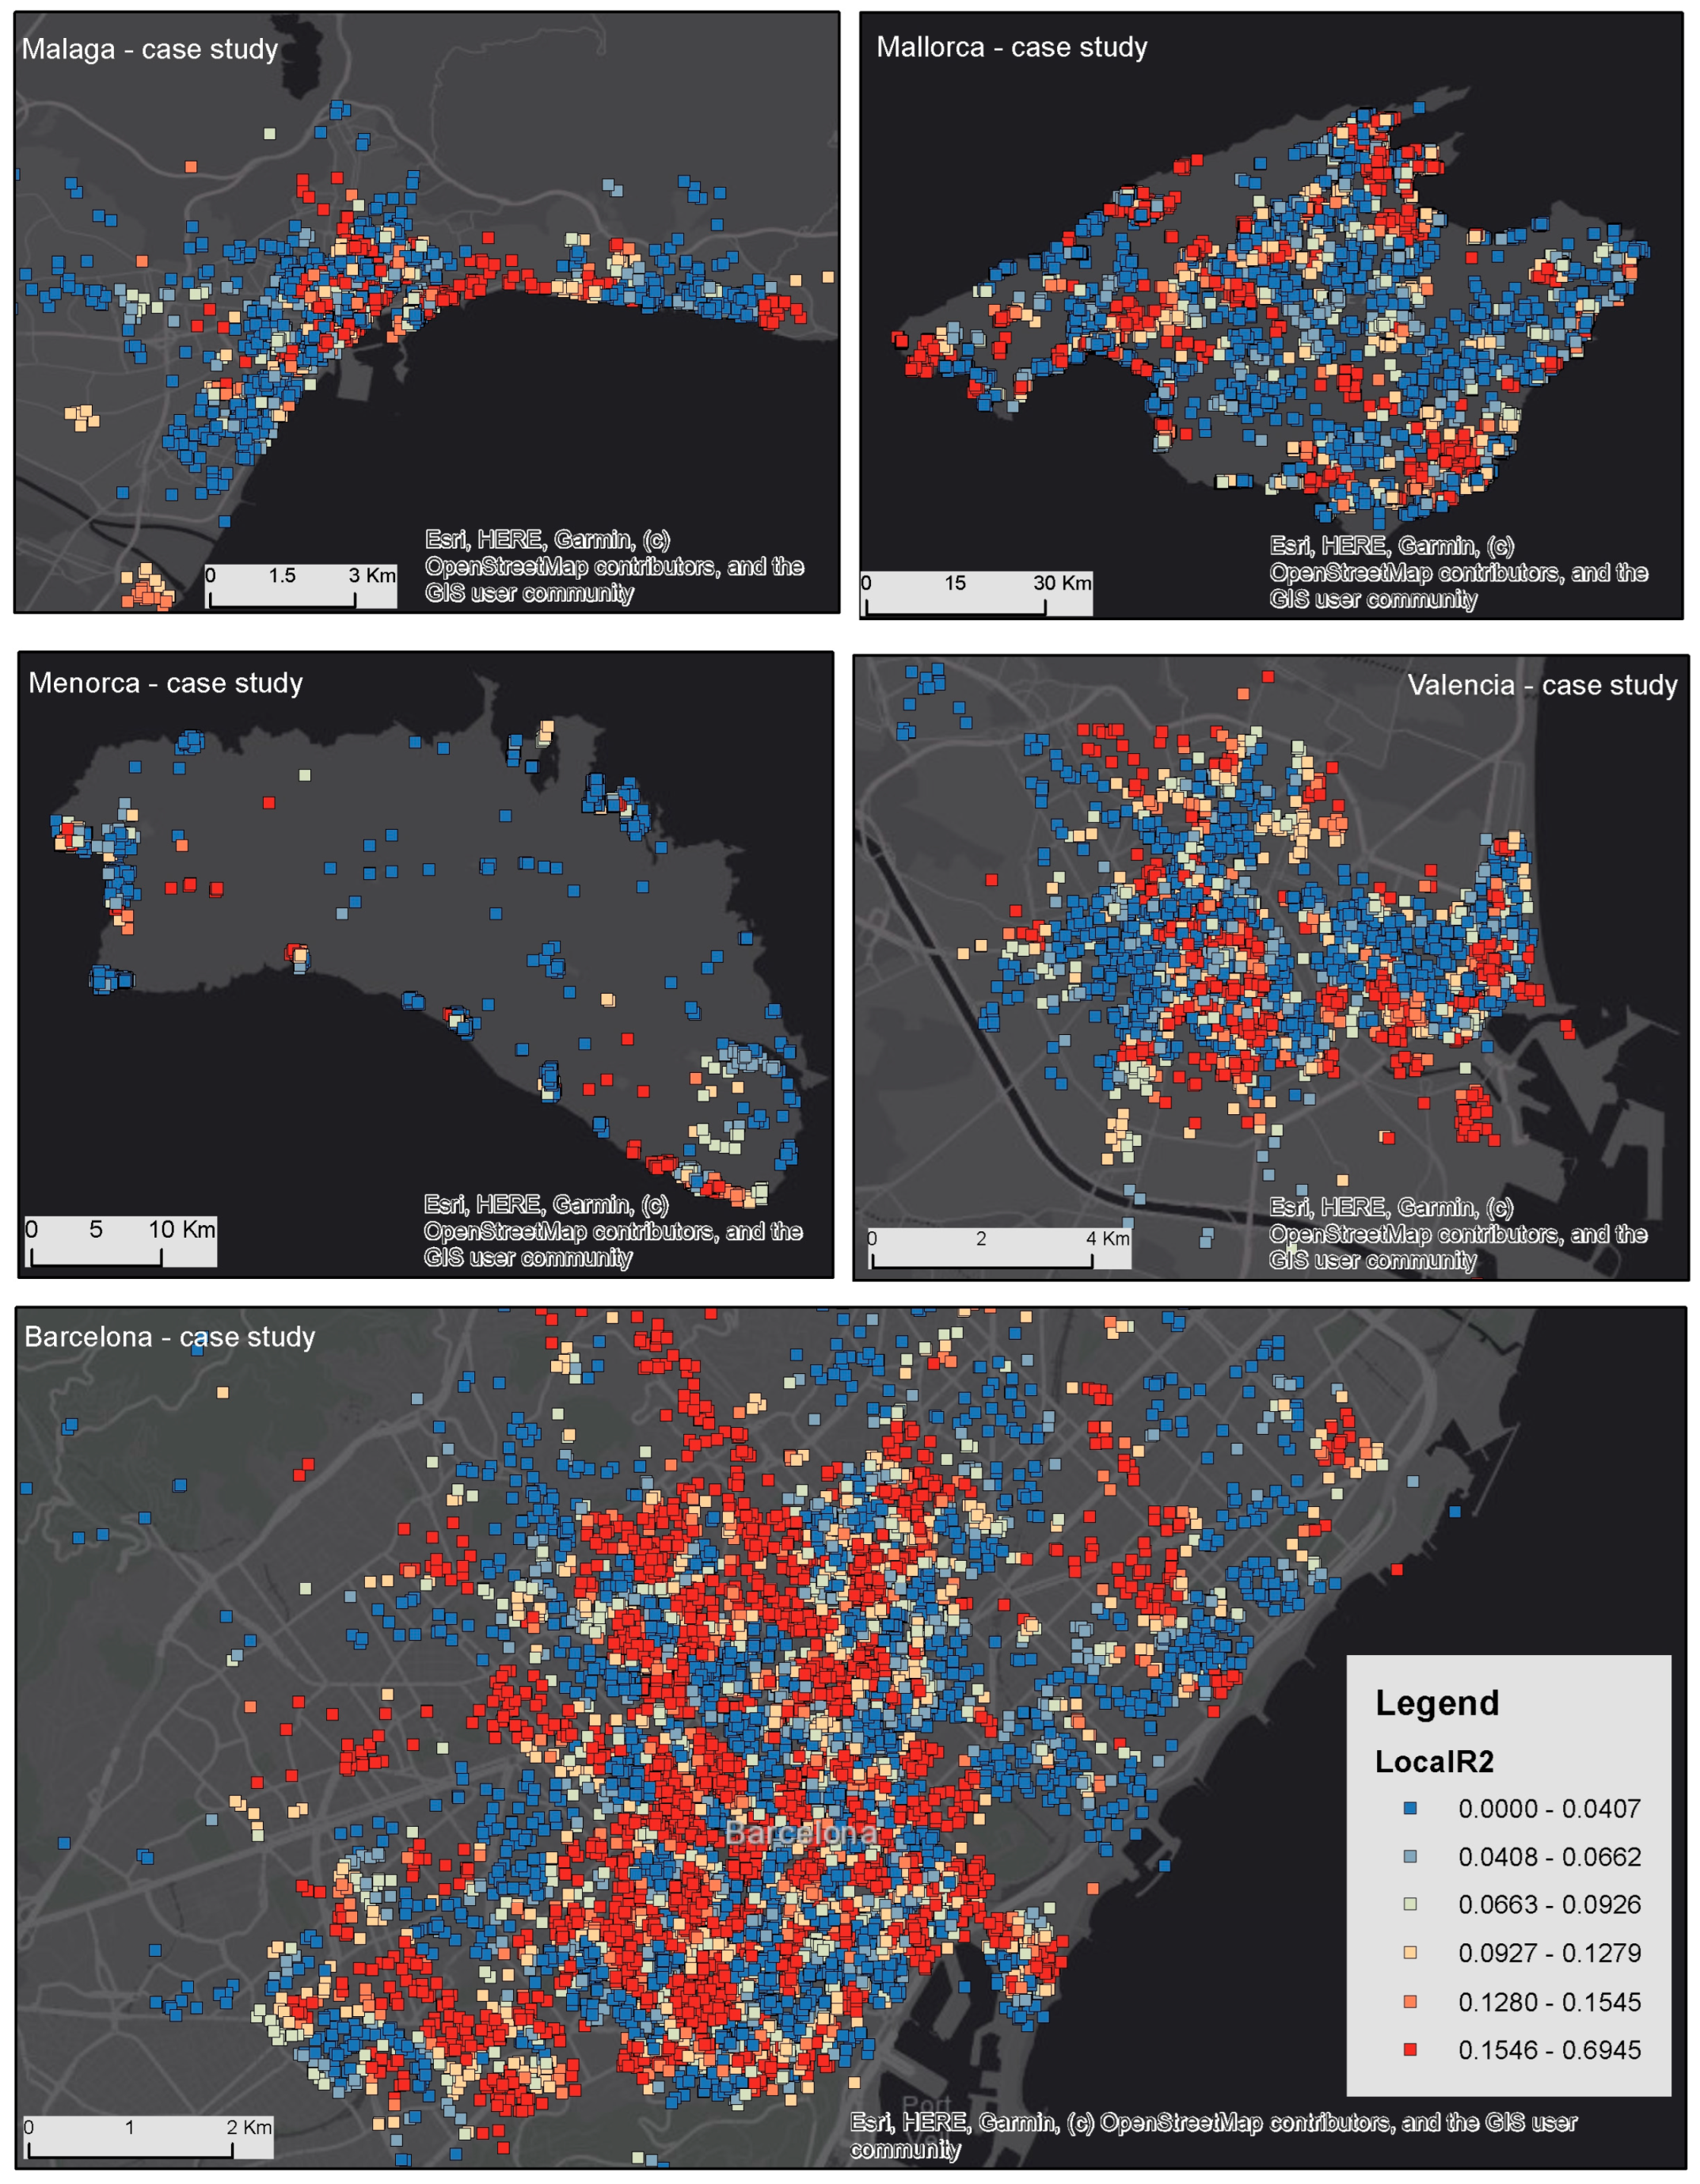
The case of Spain is particularly interesting because it aggregates different tourist regions, from islands (Mallorca and Menorca) to metropolitan areas, with different spatial footprints, attractions, and functions in the urban system (Figure 4).
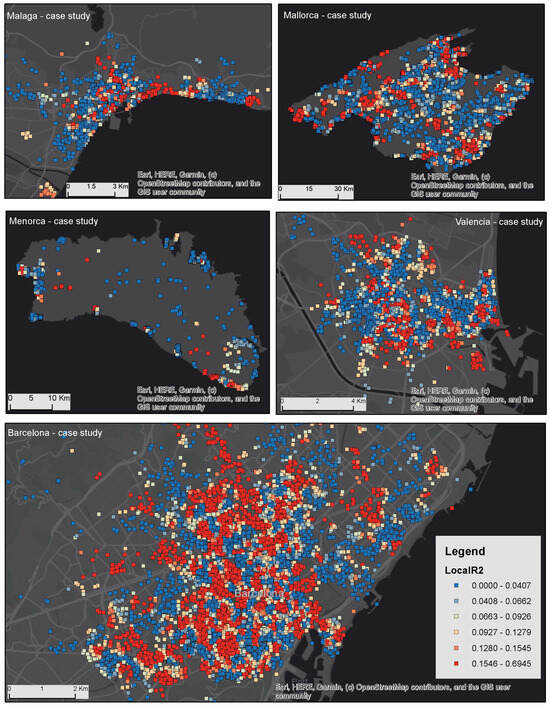
Figure 4.
Illustration of the sentiment analysis output in the case of some Spanish metropolitan areas and regions. Source: own representation.
In all the five case studies conducted in this research, the ratio between the valid local coefficient of correlation (Pearson r), calculated as the square roots of the local R2, and the untrusted ones is considerably high. The highest level of statistical association between the overall review scores and the positive component of the accommodations sentiment analysis is visible in the case of Barcelona, where 51% of the apartments of the dataset have values for the local R2 that are larger than 0.0962 (a p-value of 5%). The opposite situation is present in Menorca, with only 23%. The other three case studies ranged between 39% and 43%. To understand how the pools of concentration of high values for the local R2 are determined by the urban or insular tourism markets, further research will need to extend the frame of analysis and detect other potential factors of interference, such as the distance to the local attractions, the presence of urban amenities and the visibility of the neighborhoods or tourism places and hot spots. In the next section of the article, we discuss secondary findings provided by geographically weighted regression, insisting on their potential to provide a new research direction for further studies.
4. Discussion
All 13 case studies indicate that the association between the rankings of Airbnb accommodations and the user’s experiences is only partially validated, as such areas of metropolitan and tourism regions exhibit values lower than the validity threshold imposed by the local R2 (0.0926). The local R2 was calculated using geographically weighted regression, an option more appropriate for our approach for two reasons. The first one is linked to the alternative methods available, like the classical OLS (ordinary least squares regression). The implementation of the OLS on the 13 datasets showed that it was not appropriate; the quality of the adjustments was systematically lower than 0.1. The second reason is linked to the potential of the GWR to give us access to the spatial patterns that govern the accommodation rankings as a function of the sentiment analysis components (mainly the positive one). As was already proved by the cartographic outputs, the local context plays an important role in the territorial deployment of the local R2. Specific neighborhoods, urban amenities, major axes of circulation, repulsive areas of the city, or the distance to the beach are all capable of explaining why clusters of high values are installed in the tourism landscape. Still, they are not able to explain how much of this observed association is over-rating or penalizing the rankings of the accommodations. In this section, we provide a synthesis of these two trends (Table 4) through an analysis of the residuals obtained by the GWR implemented in the 13 case studies.
Table 4.
Assessment of relevant residuals of the GWR by case study.
The distribution of the GWR residuals can be interpreted in two ways:
- -
- The significant positive residuals indicate a situation of rank over-rating (measured by the overall review scores of the accommodations) compared to the average value of the positive component from sentiment analysis;
- -
- The significant negative residuals indicate a situation of under-rating the ranks (measured by the overall review scores of the accommodations) when the same predictor is used.
In canonical regression models, the significance of the residuals can be approached by multiple methods. In our analysis, we investigated the distribution of the standardized residuals (mean of 0, standard deviation of 1), using a value of 1 (−1) as a class break.
The GWR tool showed that not all the accommodations benefit from a clear statistical association between the two indicators. In this case, the detection of significant residuals was applied to data with a local R2 higher than 0.0926 (a valid correlation between the explained and predicted variable for a p of 0.05).
One of the limits of our method is given by the fact that the validity of the residuals, from the point of view of their distribution, was not completely assessed. For example, the tests of spatial autocorrelation were ensured, but the local analysis of the residual distribution for normality was not implemented because such a statistical tool is not available in Arc GIS.
The synthetic data from the table show that the situations of over- and under-rating Airbnb accommodations are asymmetric, no matter the metropolitan area or the tourism region. The significantly large negative residuals (penalizing the ranking of the accommodations) are systematically dominant in all 13 case studies. Basically, an Airbnb apartment with a standardized residual lower than −1 will have an overall review rating lower than the positive score predicted by the sentiment analysis. In the same logic, when an accommodation has a standardized residual larger than 1, its rank is over-estimated based on the positive review score. Explaining this distribution demands a more in-depth analysis of other factors interfering with the morphologies of geographically weighted regression. Two potential categories of candidate exploratory predictors can be envisaged: internal indicators (accommodation price, number of beds, amenities, availability, etc.) and the variables describing the spatial position in the metropolitan area or the tourist region. As a general rule, the stock of positive and negative residuals is directly linked to the number of valid observations (local R2 > 0.0926).
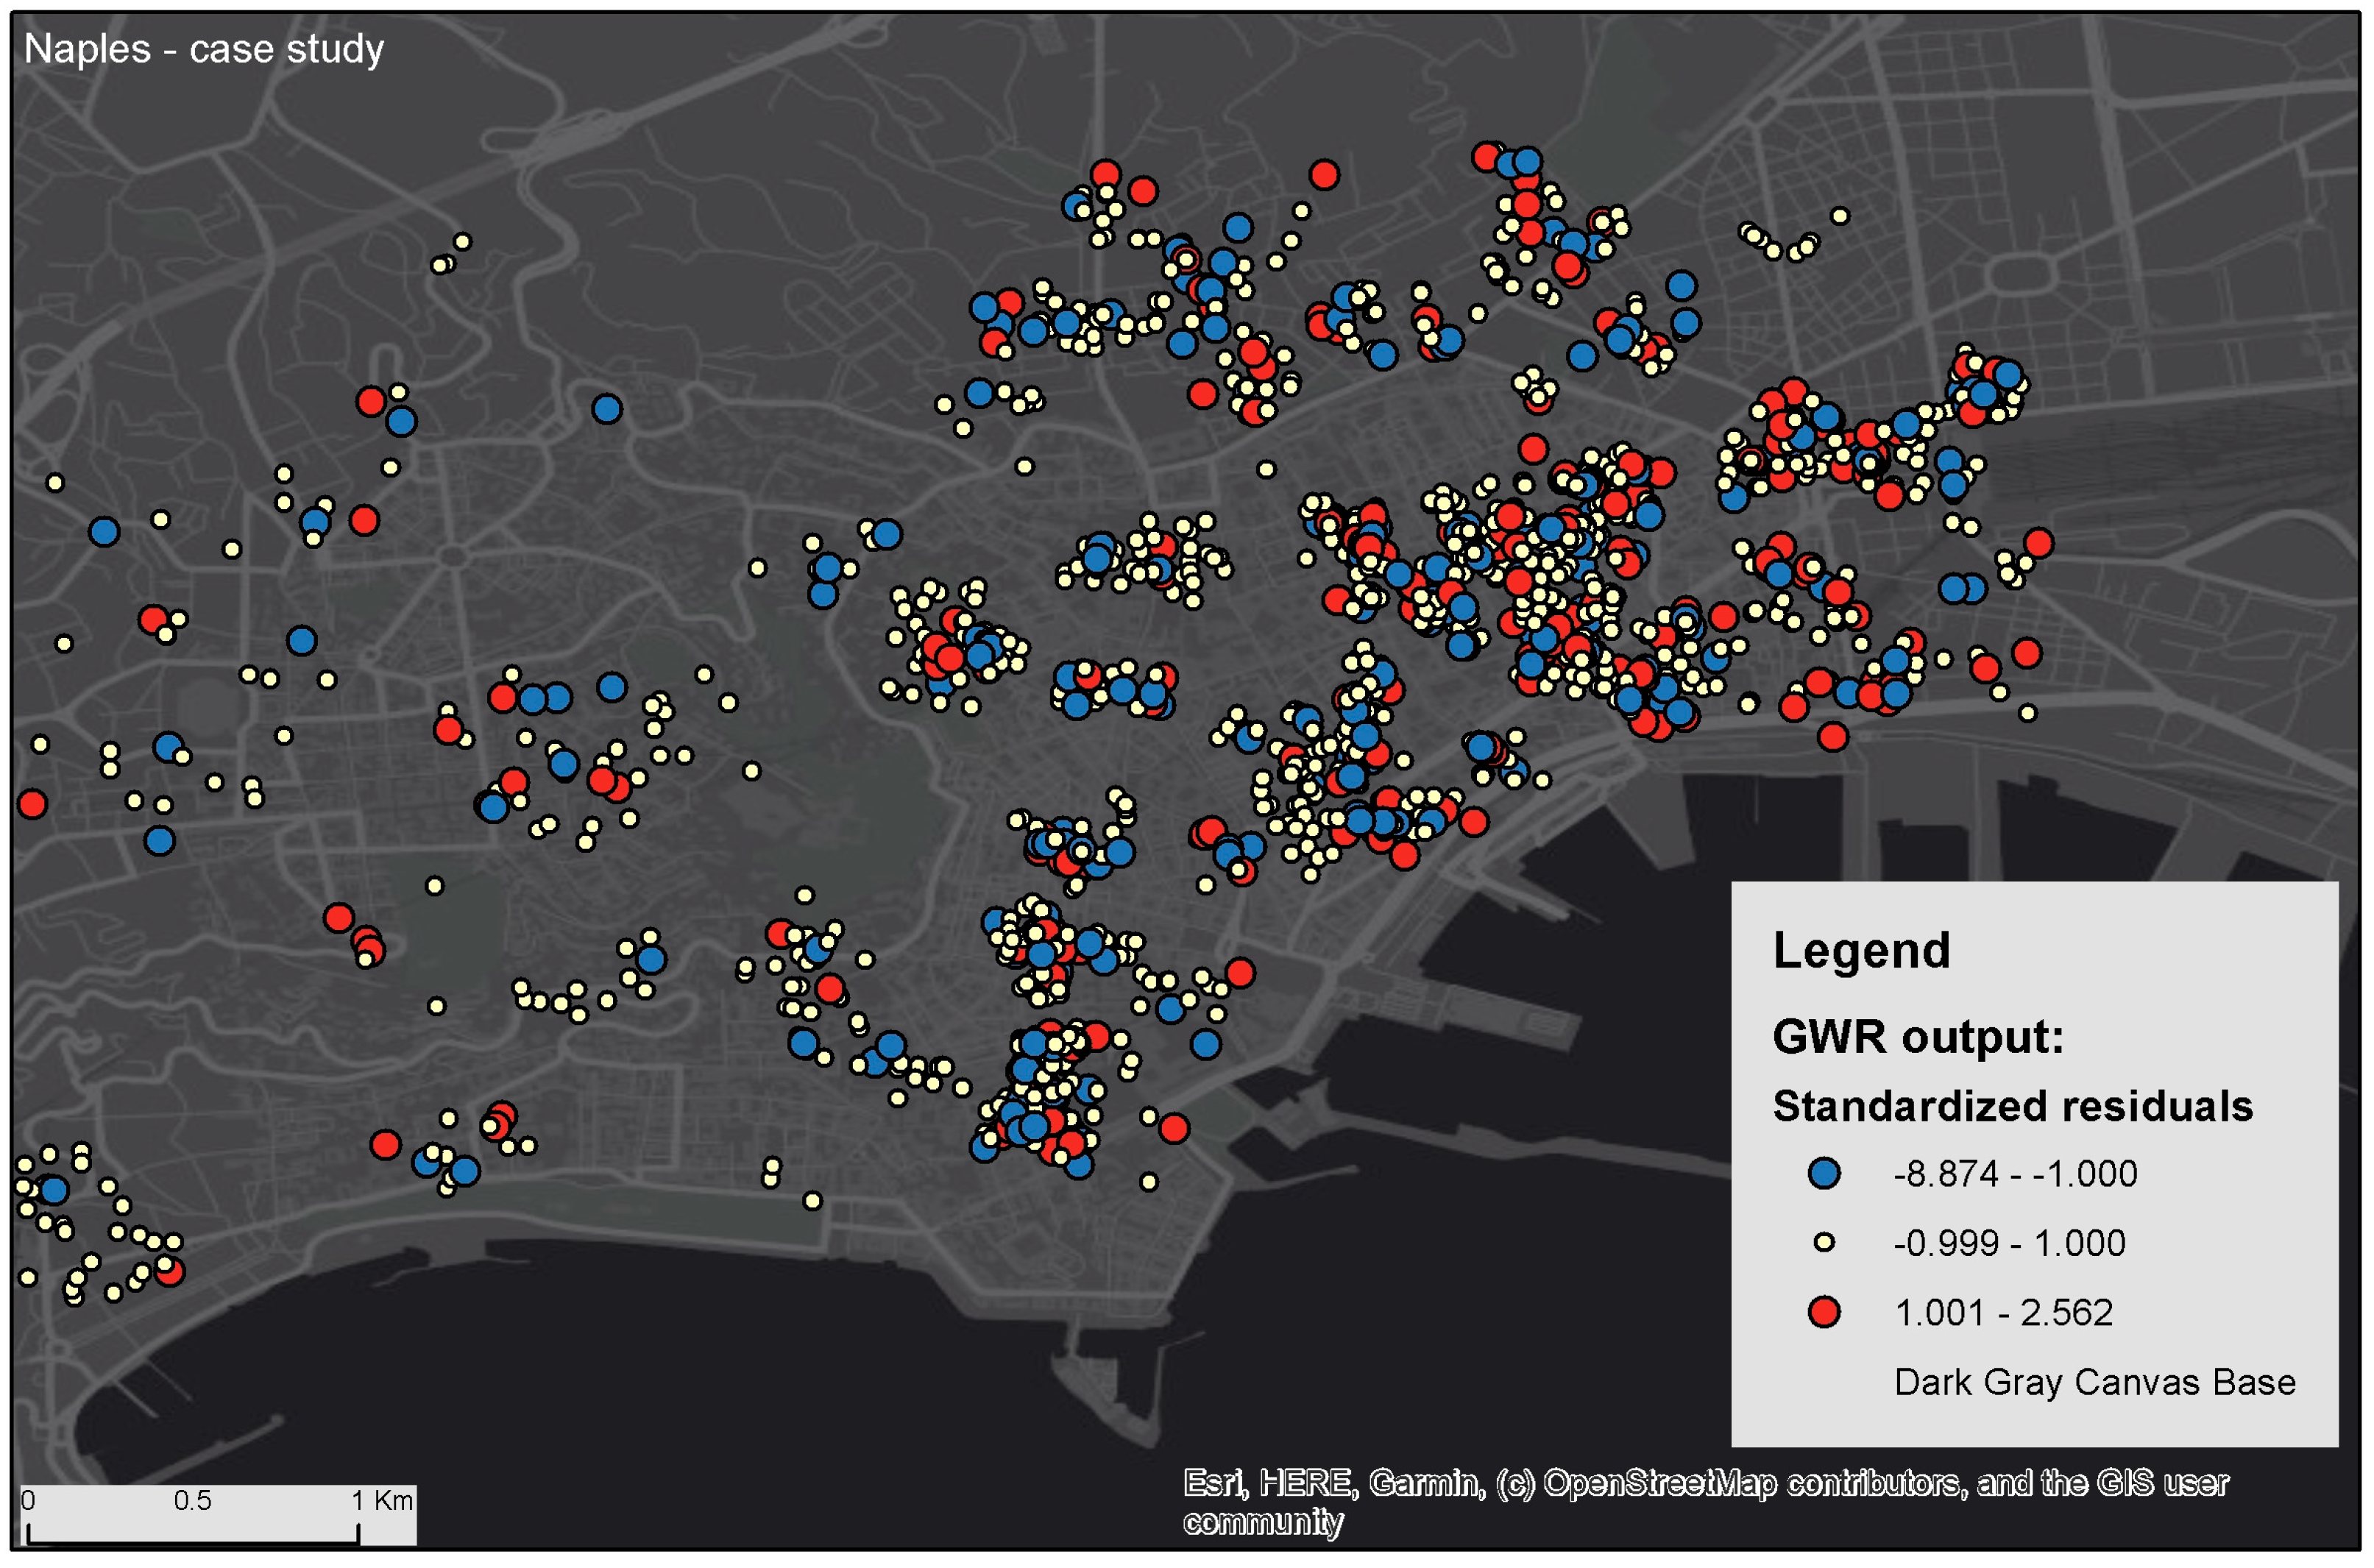
The added value of the residual investigation is given by its mapping outputs. Using only three classes of values, the spatial distribution of the residuals identifies the accommodations that are suspected to be over and under-rated by the GWR model. When tested on Naples (Figure 5), the map shows that the positive and negative residuals exhibit trends of positive spatial-autocorrelation (a low Moran’s I of 0.04 and a p-value of 0.01). The test of incremental spatial autocorrelation also shows that the diameter of a homogeneous region, from the perspective of the residual distribution, will not transgress a limit of 2237 m at the scale of Naples.

Figure 5.
The spatial distribution of the standardized residuals of GWR in Naples. Predicted variable: Airbnb accommodations rank. Explanatory variable: Average positive score obtained by sentiment analysis. Source: own representation.
From the perspective of further investigations, collecting and visualizing the residual distribution for all the case studies might allow for a better understanding of the linkage between the rating of the accommodations and the visitors’ experiences in situ. Moreover, better forms of GWR approaches can be performed by integrating supplementary indicators in the explanatory variable frame: price, distance to tourist attractions, and amenities or accommodation endowments [44,45].
5. Conclusions
This research analyzed the spatial patterns of visitor experience across 13 tourism regions from Southern Europe, encompassing metropolitan areas, islands, and NUTS3 from Greece, Italy, and Spain. By comparing Airbnb rankings with sentiment analysis outputs derived from visitors’ reviews, the study revealed significant differences between these two, thus emphasizing the limitations of the traditional accommodation rating systems. By using geographically weighted regression (GWR), it was possible to uncover spatial variations in the overall ranking versus positive reviews, offering a new perspective on the complex relationship between visitors’ subjective perceptions and the scores provided on the Airbnb platform. The findings confirm that the alignment between Airbnb rating and sentiment analysis outputs is sometimes inconsistent and context-dependent. While specific regions, such as central tourist hubs in Athens, Naples, Venice, and Barcelona, exhibit stronger statistical associations, many areas show weak or insignificant statistical associations. These variations might be explained by the influence of local factors, such as proximity to attractions, urban visibility, or the socio-economic characteristics of specific neighborhoods. For instance, highly touristified neighborhoods in Naples and Venice systematically displayed higher local R2 values, while regions lacking metropolitan attributes, like Menorca, exhibited significantly weaker correlations.
The residual analysis provided deeper insights into the tendencies of over- and under-rating among Airbnb accommodations, but it was applied on a limited scale. Significant positive residuals suggest accommodations rated higher than predicted by the sentiment analysis positive scores, while negative residuals indicate under-rated properties. The dominance of negative residuals across the 13 case studies points to a systemic undervaluation of accommodations, where overall numerical scores fail to capture the nuances and richness of user experiences. This discrepancy may be fueled by factors like cultural biases, the number of reviews, or specific accommodation attributes that are not reflected in the sentiment scores. The cartographic outputs demonstrated the importance of local contexts, revealing clustering patterns in areas with high tourist visibility, such as Plaka in Athens, the Grand Canal in Venice, and central Barcelona. These clusters also highlight the role of urban structures and amenities in shaping visitor experiences and perceptions. Despite its quantitative methodological approach, the study faced several limitations. The precision of location data, inherent biases in the sentiment analysis tools based on Orange Statistical Software, and the exclusion of non-English reviews may raise some challenges to the robustness of the findings. Moreover, while the GWR analysis effectively identified spatial patterns, it relied on a specific threshold for local R2 values, which may not fully account for the complexity of visitor experiences.
The implications of this research are not limited only to the academic sphere, offering practical guidelines for tourism management and decision-making actors. By identifying areas where Airbnb ratings diverge from the reviews’ sentiment analysis outputs, stakeholders can better address visitor expectations and adjust the quality of accommodation services.
While traditional rating systems provide a standard measure of potential place attractiveness, sentiment analysis and geostatistical tools like GWR offer a more nuanced and localized perspective on the stock of accommodations. This integrated approach paves the way for further exploration into the intersection of tourism, customer-generated content, and urban geography, contributing to a better understanding of the platform economy’s impact on tourism landscapes.
In terms of sustainable local development, investigating the gap between rating and perception can fuel the debate on the role that platform economies (e.g., Airbnb, Booking, Trip Advisor, etc.) are supposed to play in metropolitan areas and the management of tourist destinations in general. We suspect that if the dissociation between the two indicators increases, there will be negative consequences for the tourism market, demanding specific regulatory measures to counter the negative effects.
Author Contributions
Conceptualization, A.R. and O.G.; methodology, A.R. and O.M.S.; software, A.R.; validation, A.R., O.G. and M.I.; formal analysis, O.M.S.; investigation, resources and data curation, A.R.; writing—original draft preparation, A.R. and O.M.S.; writing—review and editing, M.I.; visualization, O.M.S. and O.G.; supervision, A.R. and O.G.; project administration, A.R.; funding acquisition, O.M.S. All authors have read and agreed to the published version of the manuscript.
Funding
The APC was funded by the Department of Geography, Faculty of Geography and Geology, “Alexandru Ioan Cuza” University of Iași, Romania.
Institutional Review Board Statement
Not applicable.
Informed Consent Statement
Not applicable.
Data Availability Statement
The data and the mapping outputs are available on demand; they are not currently stored online.
Acknowledgments
This research was supported by the Department of Geography, Faculty of Geography and Geology, “Alexandru Ioan Cuza” University of Iași, Romania.
Conflicts of Interest
The authors declare no conflicts of interest.
References
- Gutiérrez, J.; García-Palomares, J.C.; Romanillos, G.; Salas-Olmedo, M.H. The eruption of Airbnb in tourist cities: Comparing spatial patterns of hotels and peer-to-peer accommodation in Barcelona. Tour. Manag. 2017, 62, 278–291. [Google Scholar]
- Heo, C.Y.; Blal, I.; Choi, M. What is happening in Paris? Airbnb, hotels, and the Parisian market: A case study. Tour. Manag. 2019, 70, 78–88. [Google Scholar]
- Yrigoy, I. Rent gap reloaded: Airbnb and the shift from residential to touristic rental housing in the Palma Old Quarter in Mallorca, Spain. Urban Stud. 2019, 56, 2709–2726. [Google Scholar] [CrossRef]
- Albuquerque, H.; Quintela, J.A.; Marques, J. The Impact of Short-Term Rental Accommodation in Urban Tourism: A Comparative Analysis of Tourists’ and Residents’ Perspectives. Urban Sci. 2024, 8, 83. [Google Scholar] [CrossRef]
- Jardim, S.; Mora, C. Customer reviews sentiment-based analysis and clustering for market-oriented tourism services and products development or positioning. Procedia Comput. Sci. 2022, 196, 199–206. [Google Scholar]
- Saraswathi, N.; Rooba, T.S.; Chakaravarthi, S. Improving the accuracy of sentiment analysis using a linguistic rule-based feature selection method in tourism reviews. Meas. Sens. 2023, 29, 100888. [Google Scholar]
- Nawawi, I.; Ilmawan, K.F.; Maarif, M.R.; Syafrudin, M. Exploring Tourist Experience through Online Reviews Using Aspect-Based Sentiment Analysis with Zero-Shot Learning for Hospitality Service Enhancement. Information 2024, 15, 499. [Google Scholar] [CrossRef]
- Asghar, M.Z.; Khan, A.; Ahmad, S.; Kundi, F.M. A review of feature extraction in sentiment analysis. J. Basic Appl. Sci. Res. 2014, 4, 181–186. [Google Scholar]
- Sharma, H.D.; Goyal, P. An Analysis of Sentiment: Methods, Applications, and Challenges. Eng. Proc. 2023, 59, 68. [Google Scholar] [CrossRef]
- Cheng, M.; Jin, X. What do Airbnb users care about? An analysis of online review comments. Int. J. Hosp. Manag. 2019, 76, 58–70. [Google Scholar]
- Lawani, A.; Reed, M.R.; Mark, T.; Zheng, Y. Reviews and price on online platforms: Evidence from sentiment analysis of Airbnb reviews in Boston. Reg. Sci. Urban Econ. 2019, 75, 22–34. [Google Scholar]
- Qiu, W.W.; Yu, H.T.; Tsai, C.H.K.; Chen, M.H.; Kim, H. Understanding the value of host-guest intimacy behind online reviews of Airbnb. Int. J. Hosp. Manag. 2023, 115, 103599. [Google Scholar]
- Harris, P.; Brunsdon, C.; Charlton, M. Geographically weighted principal components analysis. Int. J. Geogr. Inf. Sci. 2011, 25, 1717–1736. [Google Scholar]
- Voltes-Dorta, A.; Sánchez-Medina, A. Drivers of Airbnb prices according to property/room type, season and location: A regression approach. J. Hosp. Tour. Manag. 2020, 45, 266–275. [Google Scholar]
- Lidiawaty, B.R.; Nasution, A.H.; Putra, A.R.; Tjahyanto, A. Design Science Research for Developing Risk Tourism Mapping Based on Visitor Sentiment Review. Procedia Comput. Sci. 2024, 234, 1672–1680. [Google Scholar] [CrossRef]
- Wheeler, D.C.; Tiefelsdorf, M. Multicollinearity and correlation among local regression coefficients in geographically weighted regression. J. Geogr. Syst. 2005, 7, 161–187. [Google Scholar]
- Iliopoulou, P.; Krassanakis, V.; Misthos, L.M.; Theodoridi, C. A Spatial Regression Model for Predicting Prices of Short-Term Rentals in Athens, Greece. ISPRS Int. J. Geo-Inf. 2024, 13, 63. [Google Scholar] [CrossRef]
- Ding, K.; Niu, Y.; Choo, W.C. The evolution of Airbnb research: A systematic literature review using structural topic modeling. Heliyon 2023, 9, e17090. [Google Scholar]
- Guttentag, D. Airbnb: Disruptive Innovation and the Rise of an Informal Tourism Accommodation Sector. Curr. Issues Tour. 2015, 18, 1192–1217. [Google Scholar]
- Zervas, G.; Proserpio, D.; Byers, J.W. The Rise of the Sharing Economy: Estimating the Impact of Airbnb on the Hotel Industry. J. Mark. Res. 2017, 54, 687–705. [Google Scholar]
- Dolnicar, S. A review of research into paid online peer-to-peer accommodation. Ann. Tour. Res. 2019, 75, 248–264. [Google Scholar] [CrossRef]
- Adamiak, C. Current state and development of Airbnb accommodation offer in 167 countries. Curr. Issues Tour. 2019, 25, 3131–3149. [Google Scholar] [CrossRef]
- Hall, C.M.; Page, S.J. The Geography of Tourism and Recreation–Environment, Place and Space, 4th ed.; Routledge: Oxfordshire, UK, 2014; pp. 140–172. [Google Scholar]
- Williams, S.; Lew, A.A. Tourism Geography. Critical Understandings of Place, Space and Experience, 3rd ed.; Routledge: Oxfordshire, UK, 2014; pp. 256–290. [Google Scholar]
- Backer, E.; Leisch, F.; Dolnicar, S. Visiting Friends or Relatives? Tour. Manag. 2017, 60, 56–64. [Google Scholar]
- Filieri, R.; McLeay, F. E-WOM and Accommodation an Analysis of the Factors That Influence Travelers’ Adoption of Information from Online Reviews. J. Travel Res. 2014, 53, 44–57. [Google Scholar] [CrossRef]
- Litvin, S.W.; Goldsmith, R.E.; Pan, B. A Retrospective View of Electronic Word-of-mouth in Hospitality and Tourism Management. Int. J. Contemp. Hosp. Manag. 2018, 30, 313–325. [Google Scholar] [CrossRef]
- Gretzel, U.; Yoo, K.H. Use and Impact of Online Travel Reviews. In Information and Communication Technologies in Tourism; O’Connor, P., Höpken, W., Gretzel, U., Eds.; Springer: Vienna, Austria, 2008; pp. 35–46. [Google Scholar]
- Liu, S.Q.; Mattila, A.S. Airbnb: Online targeted advertising, sense of power, and consumer decisions. Int. J. Hosp. Manag. 2017, 60, 33–41. [Google Scholar] [CrossRef]
- Kirilenko, A.P.; Stepchenkova, S. Tourism research from its inception to present day: Subject area, geography, and gender distributions. PLoS ONE 2018, 13, e0206820. [Google Scholar] [CrossRef]
- Hu, H.H.; Kandampully, J.; Juwaheer, T.D. Relationships and impacts of service quality, perceived value, customer satisfaction, and image: An empirical study. Serv. Ind. J. 2009, 29, 111–125. [Google Scholar] [CrossRef]
- Fradkin, A.; Grewal, E.; Holtz, D. Reciprocity and unveiling in two-sided reputation systems: Evidence from an experiment on Airbnb. Mark. Sci. 2021, 40, 1013–1029. [Google Scholar] [CrossRef]
- Fotheringham, A.S.; Brunsdon, C.; Charlton, M. Geographically Weighted Regression: The Analysis of Spatially Varying Relationships; Wiley: Hoboken, NJ, USA, 2002; pp. 27–64. [Google Scholar]
- Li, J.; Galley, M.; Brockett, C.; Gao, J.; Dolan, B. A Diversity-Promoting Objective Function for Neural Conversation Models. In Proceedings of the Conference of the North American Chapter of the Association for Computational Linguistics: Human Language Technologies, San Diego, CA, USA, 12–17 June 2016. [Google Scholar]
- Yang, Y.; Fik, T. Spatial effects in regional tourism growth. Ann. Tour. Res. 2014, 46, 144–162. [Google Scholar] [CrossRef]
- Wang, Z.; Liu, Q.; Xu, J.; Fujiki, Y. Evolution characteristics of the spatial network structure of tourism efficiency in China: A province-level analysis. J. Destin. Mark. Manag. 2020, 18, 100509. [Google Scholar] [CrossRef]
- Platform Failures: How Short-Term Rental Platforms Like Airbnb Fail to Cooperate with Cities and the Need for Strong Regulations to Protect Housing. Available online: https://insideairbnb.com (accessed on 15 December 2024).
- Wang, D.; Nicolau, J.L. Price determinants of sharing economy based accommodation rental: A study of listings from 33 cities on Airbnb. com. Int. J. Hosp. Manag. 2017, 62, 120–131. [Google Scholar]
- Valence Aware Dictionary and Sentiment Reasoner (VADER). Available online: https://github.com/cjhutto/vaderSentiment (accessed on 15 December 2024).
- Zhang, H.; Zhang, J.; Lu, S.; Cheng, S.; Zhang, J. Modeling hotel room price with geographically weighted regression. Int. J. Hosp. Manag. 2011, 30, 1036–1043. [Google Scholar]
- Sthapit, E.; Jano Jiménez-Barreto, J. Exploring tourists’ memorable hospitality experiences: An Airbnb perspective. Tour. Manag. Perspect. 2018, 28, 83–92. [Google Scholar]
- Lu, B.; Charlton, M.; Harris, P.; Fotheringham, A.S. Geographically weighted regression with a non-Euclidean distance metric: A case study using hedonic house price data. Int. J. Geogr. Inf. Syst. 2014, 28, 660–681. [Google Scholar]
- Schaback, R.; Wendland, H. Kernel Techniques: From Machine Learning to Meshless Methods. Acta Numer. 2006, 15, 1–97. [Google Scholar]
- Alharbi, Z.H. A Sustainable Price Prediction Model for Airbnb Listings Using Machine Learning and Sentiment Analysis. Sustainability 2023, 15, 13159. [Google Scholar] [CrossRef]
- Zhao, C.; Wu, Y.; Chen, Y.; Chen, G. Multiscale Effects of Hedonic Attributes on Airbnb Listing Prices Based on MGWR: A Case Study of Beijing, China. Sustainability 2023, 15, 1703. [Google Scholar] [CrossRef]

Disclaimer/Publisher’s Note: The statements, opinions and data contained in all publications are solely those of the individual author(s) and contributor(s) and not of MDPI and/or the editor(s). MDPI and/or the editor(s) disclaim responsibility for any injury to people or property resulting from any ideas, methods, instructions or products referred to in the content. |
© 2025 by the authors. Licensee MDPI, Basel, Switzerland. This article is an open access article distributed under the terms and conditions of the Creative Commons Attribution (CC BY) license (https://creativecommons.org/licenses/by/4.0/).