Article

Efficiency Measurement and Trend Analysis of the Hydrogen Energy Industry Chain in China

1
School of Economics, Management, and Law, Shandong Institute of Petroleum and Chemical Technology, Dongying 257000, China
2
School of Economics and Management, China University of Petroleum (East China), Dongying 257099, China
3
School of Management, Universiti Sains Malaysia, Gelugor 118000, Malaysia
*
Authors to whom correspondence should be addressed.
Sustainability 2025, 17(7), 3140; https://doi.org/10.3390/su17073140
Submission received: 7 February 2025 / Revised: 24 March 2025 / Accepted: 28 March 2025 / Published: 2 April 2025

Abstract

:
Hydrogen energy, characterized by its abundant resources, green and low-carbon attributes, and wide-ranging applications, is a critical energy source for achieving carbon peaking and carbon neutrality goals. The operational efficiency of the hydrogen energy industrial chain is pivotal in determining the security of its supply chain and its contribution to China’s energy transition. This study investigates the efficiency of China’s hydrogen energy industrial chain by selecting 30 listed companies primarily engaged in hydrogen energy as the research sample. A three-stage data envelopment analysis (DEA) model is applied to assess the industry’s comprehensive technical efficiency, pure technical efficiency, and scale efficiency. Additionally, kernel density estimation is utilized to analyze efficiency trends over time. Key factors influencing efficiency are identified, and targeted recommendations are provided to enhance the performance and sustainability of the hydrogen energy industrial chain. These findings offer valuable insights to support the development and resilience of China’s hydrogen energy industry.

1. Introduction

Hydrogen energy, as a secondary energy source with abundant sources, zero-carbon emissions, and broad application potential, is an important component in the development of a modern energy system, playing a pivotal role in establishing a new power system dominated by renewable energy and facilitating the transition of energy-consuming sectors toward green and low-carbon solutions. This is integral to building a clean, low-carbon, safe, and efficient energy infrastructure and achieving the goals of carbon peaking and carbon neutrality. In response to global climate challenges, transitioning the energy structure toward renewable sources is crucial for achieving sustainable energy development [1], with hydrogen energy serving as a key renewable energy source.
Since 2018, China’s annual hydrogen output has consistently exceeded 20 million tons, showing a steady growth trajectory. In 2023, the yearly hydrogen production reached 36.82 million tons. According to the China Hydrogen Energy Alliance, demand is projected to reach 37.15 million tons by 2030. In addition, the China National Coal Association predicts that the hydrogen market is expected to expand significantly, with an estimated value of 754.2 billion yuan by 2050, highlighting substantial development opportunities.
The hydrogen energy industry is broadly divided into three segments: upstream hydrogen production, midstream hydrogen storage and transport, and downstream applications (such as hydrogen refueling). Each link consists of a series of sub-sectors with significant economic potential. According to the Ping An Securities Research Institute, by 2030, the market sizes for upstream production, midstream storage and transport, and downstream applications are projected to reach 100 billion yuan, over 200 billion yuan, and 1 trillion yuan, respectively, positioning the hydrogen energy sector as a major “blue ocean” market.
Despite the promising outlook, key challenges persist. Many critical technologies are still monopolized by foreign entities due to the stringent technical requirements, complex production processes, and high costs of essential materials and equipment, as well as significant technological gaps protected by strict intellectual property rights. At the same time, the upstream hydrogen cannot be fully absorbed, while the downstream hydrogen remains insufficient, mainly due to the unresolved challenges related to hydrogen storage and transportation. Therefore, it is particularly important to establish hydrogen pipelines, connect upstream hydrogen production with downstream hydrogen production, and simultaneously improve the efficiency of the upper, middle, and downstream industry chains.
China currently lacks an adequate hydrogen storage and transportation network, and downstream applications remain heavily focused on hydrogen fuel cells and their associated transport carriers. The scale and maturity of these applications are still limited, leaving substantial room for development. Policy initiatives continue to accelerate the development of green hydrogen. The Medium and Long-Term Plan for the Development of Hydrogen Energy Industry (2021–2035), released in March 2022, defines the strategic positioning of hydrogen energy in China’s future energy structure, sets phased development goals for the hydrogen industry, and puts forward a range of application scenarios. This marks the first national medium- and long-term plan for China’s hydrogen energy sector.
In August 2023, the National Standards Commission, along with the National Development and Reform Commission, the Ministry of Industry and Information Technology, the Ministry of Ecology and Environment, the Ministry of Emergency Management, and the National Energy Administration, jointly issued the Guide to the Construction of the Hydrogen Energy Industry Standard System (2023 version). This document systematically establishes an industrial chain standard system covering hydrogen production, storage, and transportation. It aims to raise the technical threshold for hydrogen energy products, reduce costs across the industrial chain, and promote high-quality development of the hydrogen energy industry. This guide is China’s first national-level framework for standardizing the hydrogen energy industry.
Given these opportunities and challenges, it is crucial to promote the effective and orderly development of the hydrogen energy industry. To this end, this paper focuses on China’s hydrogen energy industrial chain, particularly analyzing three key stages: upstream hydrogen production, midstream hydrogen storage and transportation (including tankers and pipeline conveyance), and downstream hydrogen applications (such as fuel cell systems and hydrogen refueling station construction). A three-stage data envelopment analysis (DEA) model is employed to accurately measure the production efficiency across the entire hydrogen energy industry chain and at each stage, providing a comprehensive evaluation of actual production efficiency. Furthermore, kernel density estimation is used to analyze trends in efficiency changes at each stage, offering precise policy support for the development of the hydrogen energy industry. Finally, this study emphasizes that addressing technological bottlenecks, optimizing the upstream, midstream, and downstream segments, and improving the efficiency of the entire hydrogen energy value chain are essential for achieving high-quality industry development.

2. Literature Review

Under the dual-carbon target, the development of the hydrogen energy industry chain represents a strategic opportunity. While short-term issues, such as high costs and inadequate infrastructure, continue to constrain industrial development, the hydrogen energy sector is poised to become a crucial generator of economic growth in the long run. To strengthen China’s hydrogen energy industry and supply chain and secure leadership in hydrogen energy development, technological innovation is key to industrial development. Achieving cost reduction is essential for securing market competitiveness. The stability and resilience of industrial and supply chains are prerequisites for the rapid growth of the hydrogen energy sector and the high-quality development of the regional economy. Establishing robust evaluation systems enables objective assessments of regional economic development and supports informed decision making.

2.1. Resilience and Security Levels of Industrial and Supply Chains

Industrial and supply chains are the lifeblood and cornerstone of economic development, playing a critical role in ensuring stable growth and meeting societal demands. The resilience of industrial and supply chains refers to their ability to prevent disruption, restore their original state, or achieve renewal and upgrading after experiencing internal and external disturbances and shocks [2]. This resilience is fundamental for adapting to rapid changes in global and domestic environments, mitigating risks, and maintaining continuity in operations. The intrinsic link between resilience and security levels in industrial and supply chains is significant. Resilience serves as the foundation for achieving a high level of security, while security acts as a prerequisite for further enhancing resilience [3]. Therefore, resilience and security levels in industrial and supply chains are interdependent, forming a symbiotic relationship that ensures stability and adaptability.
The measurement of resilience and security levels in industrial and supply chains has gained significant attention in academic and policy research. Policy incentives, including subsidies, tax incentives, and regulatory guidance, play a crucial role in promoting the development of hydrogen energy. For instance, direct subsidies for upstream hydrogen production and downstream hydrogen utilization can effectively increase both supply and demand within the hydrogen energy sector. Using methods, such as the entropy approach, to evaluate indicators and analyzing comprehensive resilience scores in six southern cities, studies have revealed that enhancing resilience in industrial and supply chains is a complex and systematic project, requiring comprehensive planning, coordinated advancement, and targeted interventions to address the diverse internal and external challenges faced by industrial and supply chains. Feasible paths to enhance resilience include leveraging the advantages of the new national system, building a unified national market, and promoting the digitalization and green transformation of industries. Effectively utilizing open cooperation platforms is crucial for improving the completeness and stability of national industrial and supply chains, as well as for enhancing control over their openness [4]. Although significant progress has been made in research on industrial chain resilience, studies specifically focusing on the resilience of hydrogen energy industry chains remain limited, representing a key direction for future efforts.

2.2. Research on Measurement of Industrial Chain Efficiency

2.2.1. Definition and Dimensions of Industrial Chain Efficiency

Industrial chain efficiency refers to the overall performance of an industrial chain in economic activities [5]. It manifests specifically in the ability of various node enterprises within the chain to achieve effective resource allocation, efficient production operations, and the delivery of products that meet market demands. This efficiency acts as a crucial indicator for measuring the overall operational status of an industrial chain, reflecting the relationship between inputs and outputs [6].
The primary aspects of industrial chain efficiency include production efficiency, allocation efficiency, technical efficiency, and market efficiency. Production efficiency refers to the ability of production links within the chain to convert inputs into outputs. It encompasses technical efficiency, equipment utilization rates, and labor productivity, where high efficiency indicates the capacity to produce more products or services with the same input or to use fewer resources for an equivalent output. Allocation efficiency measures how effectively resources are distributed among various node enterprises to meet market demands. Efficient resource allocation ensures that products and services meet consumer preferences and demands, thereby enhancing the overall competitiveness of the industrial chain [7].
Technical efficiency reflects the chain’s capability to adopt and integrate advanced technologies into the production process, thereby improving production efficiency, reducing production costs, and enhancing overall benefits. Market efficiency pertains to the chain’s ability to acquire resources, sell products, and respond to market changes in the marketplace [8]. Efficient market operations ensure market competitiveness, responsiveness to changes, and growth in market share. In addition, in a perfectly competitive market, enterprises at various nodes within the chain achieve optimal resource allocation and maximize production efficiency, which serves as a benchmark for evaluating industrial chain efficiency. Beyond economic benefits, improving industrial chain efficiency also involves maximizing social welfare, including minimizing environmental impacts and enhancing societal well-being [9].
Enhancing industrial chain efficiency requires a multifaceted approach. Technological innovation, such as adopting advanced technologies and conducting independent research and development, can improve production efficiency and product quality. Optimizing resource allocation reduces production costs and enhances the overall efficiency of the industrial chain. Strengthening market operations by expanding market reach, increasing market share, and boosting competitiveness enhances market efficiency. Improving collaboration mechanisms between upstream and downstream enterprises fosters resource sharing and complementary advantages, thus enhancing overall performance.
Industrial chain efficiency is a complex concept encompassing production, allocation, technical, and market efficiency. Achieving higher efficiency requires comprehensive consideration of multiple approaches, including technological innovation, resource optimization, strengthened market operations, and improved collaboration mechanisms [10].

2.2.2. Industrial Chain Efficiency Indicator System

The industrial chain efficiency indicator system serves as a vital tool for evaluating the operational efficiency and effectiveness of an industrial chain [11]. This system encompasses multiple aspects and dimensions to ensure a comprehensive assessment of industrial chain efficiency. Key components of this indicator system are outlined below.
Overall efficiency indicators include the value-added ratio, operational costs, and profit margins of the industrial chain. The value-added ratio measures the degree of value creation from input to output, reflecting the chain’s overall value-generation capability. Operational costs include production costs, transactional expenditures, and logistics expenses, reflecting the economic efficiency of industrial chain operations. Profit margins, calculated as the ratio of overall profits to total revenue, measure the economic benefits generated by the chain.
Production efficiency indicators evaluate aspects, such as per capita output, equipment utilization rate, and energy efficiency. Per capita output refers to the average value or output created by each employee in the industrial chain, reflecting labor efficiency, while the equipment utilization rate measures equipment usage efficiency, indicating the economic returns on production equipment investments [12]. Energy utilization efficiency refers to the ratio of energy consumption to output, reflecting the economy of energy usage.
Resource allocation efficiency indicators focus on the effectiveness of resource use within the chain. These include the raw material utilization rate, which measures the conversion efficiency of raw materials into final products, and the capital turnover ratio, which reflects the efficiency of capital utilization. Additionally, the degree of supply chain collaboration measures the level of coordination among upstream and downstream enterprises, which directly influences resource allocation efficiency.
Technological innovation efficiency indicators address the role of innovation in enhancing efficiency and include metrics, such as the R&D input–output ratio, patent application volume, and the speed of new product launches. The input–output ratio refers to the proportion of R&D investment to technological innovation outcomes, reflecting technological innovation efficiency. Patent application volume measures the level of activity and achievements in technological innovation within the industrial chain [13], while the speed of new product launches refers to the time taken for new products to move from R&D to market, reflecting the commercialization speed of technological innovation.
Market efficiency indicators measure the chain’s performance in market-related activities. These include market share, which reflects market competitiveness [14]; customer satisfaction, which measures the extent to which the chain meets customer needs; and market response speed, which assesses adaptability to market changes or customer demands.
Environmental and social responsibility efficiency indicators emphasize sustainable development and corporate responsibility. Resource consumption intensity (i.e., the number of natural resources consumed) and pollutant emissions (i.e., the amount of pollution generated) evaluate the chain’s environmental impact, while the degree of social responsibility fulfillment assesses its compliance with laws and regulations, the protection of employee rights, and participation in community development [15].
The industrial chain efficiency indicator system provides a framework for evaluating the operational status of an industrial chain. Indicators, such as the value-added ratio, operational costs, and profit margins, offer insights into overall economic performance in activities, revealing the industrial chain’s comprehensive capabilities in resource allocation, production operations, and market demand satisfaction. Production efficiency is an important component of industrial chain efficiency, reflecting the industrial chain’s ability to convert inputs into outputs during the production process [16]. Production efficiency indicators, such as per capita output and equipment utilization rate, provide an intuitive measure of the chain’s efficiency at the production level. Resource allocation efficiency indicators, such as raw material utilization rate and collaboration degrees, involve issues of resource coordination, information sharing, and benefit distribution among upstream and downstream enterprises, identifying opportunities for optimization within the chain. Technological innovation and market adaptability are important driving forces for sustainable development [17]. R&D input–output ratio, patent application volume, and product launch speeds reflect innovation performance, highlighting bottlenecks and opportunities to support targeted innovation strategies. Market efficiency indicators, such as customer satisfaction and market responsiveness, measure the industrial chain’s performance in meeting market demands and adaptability in a dynamic environment competition.
While scholars both domestically and internationally have achieved significant progress in researching industrial chain efficiency and its influencing factors, studies focusing on the hydrogen energy industrial chain remain limited. Given hydrogen energy’s status as one of the most promising emerging industries, further research is needed to refine measurement methods, develop robust indicator systems, and analyze the external environmental factors affecting industrial chain efficiency.

2.2.3. Industrial Chain Efficiency Measurement Models

Industrial chain efficiency measurement models are essential tools for evaluating and quantifying the performance of an industrial chain or its critical links. Among the commonly used models is the data envelopment analysis (DEA) model, a non-parametric efficiency evaluation method that uses linear programming to construct a production frontier and assess the relative efficiency of decision-making units (DMUs). In industrial chain efficiency evaluations, various enterprises, departments, or production links within the industrial chain can be regarded as DMUs, with efficiency measured by comparing input–output data. Common DEA models include the CCR model, which assumes constant returns to scale and evaluates overall technical efficiency; the BCC model, which accounts for variable returns to scale by decomposing efficiency into pure technical efficiency and scale efficiency [18]; and the slack-based model (SBM), a more refined DEA variant that addresses inefficiencies caused by input redundancy and output shortfalls. These DEA models are advantageous as they do not require a predefined production function form and are effective for multi-input, multi-output situations while providing directions and magnitudes for efficiency improvement [19].
The stochastic frontier analysis (SFA) model is another important approach. This parametric method incorporates assumptions about the production function and random error terms to assess efficiency. Specifically, SFA evaluates the impact of each environmental variable on the slack variable by considering the influence of external factors on redundant variables. This approach is particularly valuable for improving evaluation accuracy by accounting for external influences and providing specific values and distribution characteristics of efficiency losses [20].
For dynamic analysis, the Malmquist productivity index model is often applied. This model evaluates changes in productivity over time by comparing the input–output data of DMUs across different periods. It further decomposes these changes into technological progress and variations in technical efficiency, making it an effective tool for tracking efficiency trends and identifying underlying causes [21].
In addition to these primary models, methods, such as the analytic hierarchy process (AHP), fuzzy comprehensive evaluation method, and TOPSIS method, are used to evaluate and rank nodes or links within the industrial chain. These methods are useful for identifying key efficiency bottlenecks and optimizing resource allocation [22]. The choice of an appropriate model depends on the research objectives, data availability, and the specific characteristics of the industrial chain. For example, the DEA model is suitable for multi-input, multi-output analyses, while the SFA model may be more appropriate for scenarios requiring consideration of random factors, and the Malmquist productivity index model is effective for assessing temporal changes in productivity.
To ensure meaningful evaluations, accurate and complete data are essential. Preprocessing steps, such as standardization and normalization, help address potential issues, like missing data or abnormal values, thereby improving the reliability of the results [23]. Once the evaluation is complete, interpreting and analyzing the evaluation results becomes critical for identifying efficiencies and formulating strategies for improvement. These insights can guide industrial chain optimization efforts and inform management decision making.
The selection and application of industrial chain efficiency measurement models require careful consideration of the research objectives, data characteristics, and industrial chain characteristics [24]. Thoughtful use and integration of these models enhance the evaluation process and support informed decision making, enabling industries to optimize and achieve sustainable growth.

2.3. Current Status, Trends, and Countermeasures of Hydrogen Energy Development

The development of hydrogen energy is recognized globally as a critical pathway toward achieving sustainable and clean energy transitions. Hydrogen energy is considered one of the cleanest energy sources with immense development potential, with widespread application across various sectors. Developed regions, such as the United States and the European Union, have integrated hydrogen energy into their energy development strategies. Similarly, China regards hydrogen energy as a strategic emerging industry, with the sector experiencing accelerated growth [25]. This development aligns with China’s overarching goals of “carbon peaking” and “carbon neutrality”, as well as its medium- to long-term energy development plans.
In terms of hydrogen production technology, the resilience and efficiency of the hydrogen energy industry chain and supply chain hinges on advancements in production methods [26]. Current hydrogen production technologies include those based on fossil fuels, natural gas, and water electrolysis [27]. Among these, water electrolysis is viewed as the mainstream hydrogen production method of the future due to its immense potential to harness renewable energy sources, like wind and solar power. Renewable energy-powered water electrolysis provides a pathway for effectively utilizing renewable energy while addressing issues of energy consumption, representing a sustainable and clean energy solution with significant potential for further development.
The hydrogen energy industries of China, Germany, Japan, the United States, and other leading nations exhibit distinct characteristics and advantages. China has made remarkable progress in hydrogen energy technology research and development, particularly in solid-state hydrogen storage materials, achieving a globally competitive position. The industry has demonstrated strong performance in scaling up production, increasing output value, and diversifying technological approaches, supported by robust policy measures. Japan has a large number of hydrogen energy-related patents and occupies an important position in the global hydrogen energy market due to its technological leadership and comprehensive industrial chain. Germany has a strong industrial base and world-class enterprises, excelling in electrolyzer technology and making notable progress in hydrogen strategy formulation, market expansion, and international cooperation. The United States has a relatively high proportion of hydrogen production and consumption, with enterprises actively engaging in hydrogen energy technology innovation.
Table 1 presents a comparative analysis of hydrogen energy industry policies in China, Japan, Germany, and the United States. Overall, while each country prioritizes different aspects of hydrogen energy development, they all emphasize fostering innovation in the sector. Their strategies include implementing scientific and technological innovation policies, providing tax incentives and subsidies, and investing in personnel development and recruitment to drive hydrogen energy industry growth.
To promote the high-quality development of the hydrogen energy industry, several countermeasures have been proposed. China is refining its strategic planning for the hydrogen energy industry by coordinating efforts across regions and different segments of the industry chain. These measures include establishing and improving management organizations, refining standard systems, and advancing infrastructure development, such as constructing hydrogen refueling stations with reasonable supporting measures and moderate advancement. In addition, the focus is on fostering research on core technologies, expanding diverse application scenarios, and achieving multi-energy integration and complementarity [28]. These efforts aim to create a robust, sustainable, and efficient hydrogen energy ecosystem capable of meeting long-term energy goals.
From a policy perspective, China has introduced a series of measures to promote the development of hydrogen energy, ranging from national top-level industrial planning to provincial and municipal initiatives. These include subsidies for hydrogen production and utilization costs, as well as funding projects for hydrogen energy technologies under national science and technology programs. Such efforts have driven technological innovation in the hydrogen energy industry, while advancements in hydrogen energy technology have further propelled the development of China’s hydrogen energy industrial chain. However, research on quantitatively measuring the efficiency of the hydrogen energy industrial chain and analyzing trends in efficiency changes remains limited. This gap highlights the necessity of this study, which aims to provide intellectual support for the high-efficiency development of China’s hydrogen energy industrial chain through quantitative research.

3. Theoretical Analysis

3.1. Efficiency Affects the High-Quality Development of the Hydrogen Energy Industry

The efficiency of an industrial chain plays a crucial role in the high-quality development of industries, including the hydrogen energy sector. One significant impact is the enhanced ability to resist risks. Industries with high efficiency are better equipped to handle external challenges, such as fluctuations in market demand and policy adjustments, enabling them to maintain their competitive edge. Another critical aspect is resource allocation efficiency. High efficiency in the industrial chain optimizes resource allocation, streamlines processes, reduces production costs, and fosters innovation and upgrades within the industry chain.
Compared to general industries, the hydrogen energy industry exhibits more distinct characteristics across its upstream, midstream, and downstream segments. The production efficiency of each segment determines the overall production efficiency level of the entire chain. The efficiency of resource allocation determines the production efficiency of each segment, which in turn affects production costs. When resource allocation efficiency reaches its highest level, production costs are minimized.
In addition, industrial competitiveness is bolstered by high industrial efficiency. This is reflected not only in superior product quality and pricing but also in enhanced innovation capabilities and faster market responsiveness. Industrial chain efficiency can be measured by producing products of the same value with smaller inputs or producing higher-value products with the same inputs. Inputs mainly include human resources, capital, and assets, while product value is represented by operating income and profits. The higher the industrial chain efficiency, the higher the resource allocation efficiency, which also relies on innovation capabilities and market responsiveness to sustain itself. Therefore, improving the efficiency of the hydrogen energy industrial chain is integral to fostering sustainable and high-quality growth.

3.2. Main Factors Influencing the Efficiency of the Hydrogen Energy Chain

The efficiency of the hydrogen energy industrial chain is determined by several key factors. One major factor is technological innovation and R&D investment. Continuous investment in research and development, coupled with technological breakthroughs, can promote efficiency across all segments of the industrial chain, reduce costs, and strengthen the sector’s overall competitiveness. Technological breakthroughs, such as water electrolysis for hydrogen production and fuel cell systems, are particularly critical for improving the efficiency and sustainability of the hydrogen energy chain.
Another significant factor is the policy environment and market demand. Government policies play a crucial role by offering incentives and promoting collaboration among upstream and downstream enterprises, thereby creating a cooperative and efficient ecosystem. The policy environment operates by encouraging technological innovation and providing downstream consumption subsidies, exerting force on both the supply and demand sides. This dual approach propels the iterative innovation of technology within the hydrogen energy industry and stimulates the upgrading of hydrogen energy consumption, thereby attracting enterprises to invest in R&D funds and fostering a virtuous cycle of industrial ecological development. At the same time, increasing market demand stimulates the expansion of the industrial chain, facilitates product upgrading, and drives overall efficiency improvements.
Thirdly, infrastructure construction and industry chain support are essential for ensuring the efficiency and resilience of the hydrogen energy sector. Developing infrastructure, such as hydrogen refueling stations, and enhancing hydrogen storage and transportation facilities are important components affecting the resilience of the hydrogen energy industrial chain. At the same time, promoting the collaborative development of upstream, midstream, and downstream enterprises, along with strengthening supporting industries, contributes significantly to improving the efficiency of the industrial chain.

4. Study Design

4.1. Measurement Modelling

Efficiency in the hydrogen energy industry is commonly evaluated using a DEA model. However, the SBM-DEA model does not account for external environmental factors or random disturbances, potentially leading to over- or underestimation of efficiency values. To address this limitation, the three-stage DEA model proposed by Fried et al. [29] is used. The three-stage DEA model refines the traditional DEA approach by conducting a three-stage analysis to eliminate environmental factors and random noise effects, providing a more accurate efficiency assessment for DMUs.
In the first stage, the CCR and BCC models, which are radial distance function models, primarily focus on the proportional relationship between inputs and outputs. These models assume the proportional changes in inputs and outputs but fail to account for all relaxation variables comprehensively. Relaxation variables represent the extent of excessive input or insufficient output and play an important role in efficiency evaluation. By incorporating relaxation variables, the SBM-DEA model overcomes the limitations of the CCR and BCC models, which assume equal proportional changes. This enables a more accurate assessment of decision-making unit (DMU) efficiency. The SBM-DEA model not only identifies DMUs but also determines specific inputs and outputs requiring improvement, thereby enhancing the accuracy of the efficiency evaluations.
Consequently, the initial efficiency is assessed using the SBM-DEA model to evaluate each decision-making unit. Relaxation variables are used to measure the degree of deviation of DMUs from the frontier. Traditional DEA models (such as the CCR model and BBC model) are radial models, which require the input and output to change in the same proportion. The calculation results do not take into account the influence of relaxation variables and are often limited by radial and angular measures, resulting in deviation in the evaluation results. The SBM-DEA model addresses radial model slack variables by integrating input–output slack variables into the scale objective function, as follows:
γ * = m i n 1 1 m i = 1 m S i x i 0 1 + 1 s r = 1 s S r + y r 0
s . t .     x 0 = X λ + S y 0 = Y λ S + S 0 , S + 0 , λ 0
where S denotes the slack variables of inputs and outputs; λ is the linear programming weight vector; m is the number of input indicators; s is the number of output indicators. The objective function 0 < γ * 1, for the evaluated unit DMU. If γ * = 1 , the DMU is in the production frontier, in the DEA effective state, otherwise, the DMU is in the DEA ineffective state, and there is room for optimization. S and S + represent the degree to which the inputs and outputs can be improved, respectively.
The second stage employs stochastic frontier analysis to remove environmental factors and random noise effects from efficiency values. Based on Fried et al. [29], regressions are performed separately for each input slack variable, and the regression models for the input slack variables and environmental influences are set up as follows:
S i j = f Z j β i + ν i j + μ i j ,   j = 1 , 2 , n ;   i = 1 , 2 , m
ρ i = σ μ i 2 σ v i 2 + σ μ i 2
where m is the number of input indicators; n is the number of decision units; S i j is the slack value of the i input for the j decision unit; Z j = Z 1 j , , Z p j is the p EIF for the j decision unit; β j = β 1 j , , β p j is the to-be-estimated coefficient of the p EIF; ν i j is the random error term, ν i j 0 , σ v i 2 ; μ i j denotes managerial inefficiency; μ i j 0 , σ μ i 2 ; ν i j is independent of μ i j . A value of ρ i close to 1 means that the main reason for the inefficiency of the decision unit is managerial inefficiency, while a ρ i value close to 0 indicates that the inefficiency of the decision unit is due to the random error term.
The SFA model is regressed using Frontier 4.1, and based on the maximum likelihood estimation results, μ i j is calculated using the following Equation (5):
E ^ μ i j ν i j + μ i j = s i j z j β i E ^ v i j ν i j + μ i j
The formulas for adjusting the inputs for the other decision-making units are as follows:
x ^ i j = x i j m a x j z j β ^ i + m a x j μ ^ i j μ ^ i j
where x i j is the actual value of input i for decision cell j ; x ^ i j is the adjusted value of input i for decision cell j ; β ^ i is the estimated value of the parameters of the environmental variables; μ ^ i j is the estimated value of μ i j . All decision units and random errors are adjusted to be in the same environmental state.
In the final stage, the SBM-DEA model is applied again to reassess efficiency based on the adjusted data, determining the true efficiency values of each decision-making unit.

4.2. Trend Modelling

Kernel density estimation is a statistical technique used to calculate the continuous density of probability distributions of random variables. In mathematical analysis, discussing probability densities in isolation lacks practical significance; they are typically interpreted as values on the vertical axis of a two-dimensional coordinate system, with corresponding intervals on the horizontal axis. When considering a specific and finite interval, the integral of the probability density function within that interval is exactly equal to the probability of an event occurring within it. The probability distribution density can be expressed as the probability value within the interval divided by the interval length.
When estimating the overall probability distribution density from observed samples, there are two primary estimation strategies: parametric estimation and non-parametric estimation. Parametric estimation methods are based on preconceived assumptions, assuming that the population follows a known probability distribution form, estimating the parameters of the corresponding distribution through sample data. However, this method heavily relies on the specification of the population distribution model, which has certain limitations.
In comparison, kernel density estimation, as an important non-parametric estimation technique, significantly reduces the need for model structure assumptions. It does not predefine the specific shape of the population distribution but estimates the shape of the entire distribution by constructing and weighting data points in local regions, thereby demonstrating strong robustness and a low sensitivity to model bias. Due to its independence from prior assumptions and its effectiveness in handling complex, unknown, or mixed distributions, KDE is widely recognized and applied in academic research.
KDE is particularly useful for estimating the probability density function of a random variable and analyzing the efficiency distribution of industrial chain enterprises. The model assumes that there are n independent and identically distributed samples. ( x i ) is the observation value of the i th sample. KDE estimates the probability density function f x as follows:
f x = 1 n h i = 1 n K ( x x i h )
where h is the bandwidth, and K ( * ) is the kernel function. The smaller the value of the bandwidth ( h ), the less smooth the kernel density curve and the more details and data noise are embodied. Conversely, the larger the value, the smoother the kernel density curve and the fewer the details are embodied. The Gaussian kernel function is chosen for its ability to minimize unwanted high-frequency noise while retaining essential signals. This approach effectively highlights trends in the efficiency distribution, offering insights into the underlying characteristics of the data.
The kernel density estimation method generates the corresponding probability distribution diagram: (1) A higher peak indicates greater data density in that region. (2) A rightward shift of the kernel density curve signifies continuous improvement in production efficiency. (3) The distribution pattern exhibits an elongated right tail, indicating increasing disparities. The progressive elongation of the right tail over time and the broadening trend of distribution ductility suggest that the spatial gap of the hydrogen energy industry chain is gradually expanding. (4) The presence of multi-peaks indicates significant multi-polar differentiation. The transition from a bimodal to a unimodal distribution means that the polarization phenomenon is weakening. (5) A flatter and wider kernel density curve, characterized by a decrease in peak value and an increase in width, reflects a growing degree of variation among provinces. (6) If the kernel density curve shifts leftward, exhibiting a right-skewed distribution i.e., as the vertical height of the wave crest increases, the horizontal width decreases, and the number of the wave crest decreases, it suggests a trend toward numerical reduction. This pattern indicates that the efficiency gap within the hydrogen energy industry chain is narrowing, demonstrating a dynamic convergence trend.

4.3. Selection of Indicators

Input and output indicators and environmental impact factors are selected to comprehensively evaluate the efficiency and developmental environment of the hydrogen energy industrial chain. The inputs are mainly labor, capital, and production facilities, while the output indicators are measured in terms of output value and revenue. Therefore, the input indicators selected include the number of employees, main business cost, and fixed assets, while the output indicators are the main business revenue and net profit. The number of employees represents the labor force dedicated to the production and operation of the enterprise, and the main business cost, along with the enterprise management expenses, reflects the capital investment required. On the output side, the main business income and net profit show the enterprise’s production capacity and operation performance.
The research subject of the study is the production efficiency of China’s hydrogen energy industry chain, with a primary focus on the impact of external environmental factors on its input and output. When selecting these external influencing factors, it is necessary to consider the unique characteristics of the hydrogen energy industry chain as well as the commonalities it shares with other industrial sectors.
Compared to other industry chains, certain segments of the hydrogen energy industry chain exhibit distinct regional clustering characteristics. The hydrogen production segment is predominantly located in the northwest and northern regions of China. The midstream hydrogen transportation pipelines and natural gas blending pipelines are mainly distributed in the northern areas, while the downstream applications are primarily concentrated in the Beijing–Tianjin–Hebei region and in the East China, South China, and Central China regions. The commonalities shared with other industry chains include the level of economic development and the strength of government policy support.
This study does not include hydrogen energy subsidies, primarily because the methods of subsidizing hydrogen energy vary across different provinces, making it difficult to establish a unified quantitative metric. For instance, some provinces subsidize production costs, while others subsidize investments in hydrogen refueling station construction. This shortcoming will serve as a direction for future research to evaluate the effects of various subsidies.
To comprehensively assess the external environment influencing the development of the hydrogen energy industry, three environmental influencing factors are considered: the level of economic development, the strength of government support, and the degree of regional industrial agglomeration. Firstly, the level of economic development reflects the overall economic conditions of a region or country and is measured by the gross domestic product (GDP) indicator, which determines the investment capacity, market demand, and technological innovation capabilities of the hydrogen energy industry chain in the respective region. Secondly, government support characterizes the government’s policy tendency and investment in promoting hydrogen energy development and is assessed by the scientific and technological innovation investment index of the province where the enterprise is located. Government policy direction and financial support directly impact the industry’s cost structure, innovation capabilities, and market competitiveness. Thirdly, the degree of regional industrial agglomeration reflects the concentration and collaboration levels among relevant industries within a specific area and is measured by the output value of the secondary industry in the enterprise’s province. A high degree of industrial agglomeration fosters scale and synergy effects, reduces production costs, improves overall competitiveness, and aids in talent cultivation. These advantages collectively promote the sustainable growth of the hydrogen energy industry chain.
These influencing factors also exhibit certain interrelationships. A higher level of economic development in a region tends to encourage greater government prioritization of innovation activities, leading to increased investment in technological innovation for emerging industries. This, in turn, attracts more investment into the industry, gradually forming industrial agglomeration. The high-quality development of the industry consequently contributes to the region’s overall economic growth.

5. Empirical Analyses

5.1. Data Sources

Representative enterprises from each segment of the hydrogen energy industry chain were selected based on the following criteria: (1) the enterprises’ main business activities exhibit strong relevance to the upstream, midstream, and downstream sectors of the hydrogen energy industry chain; (2) the enterprises provide continuous and complete annual report data; (3) the enterprises were listed in 2011 or earlier.
Through big data retrieval, 68 enterprises were identified as having achieved significant contributions to the hydrogen energy sector. These enterprises were further screened using the aforementioned criteria, and 30 representative listed enterprises were selected, covering the upper, middle, and lower reaches of the hydrogen energy industry chain. Among these, 10 companies represent the upstream sector, 10 represent the midstream sector, and 10 represent the downstream sector. These sample companies exhibit strong sustainable development capabilities and possess a high degree of typicality and representativeness within the hydrogen energy industry.
In China, the development of hydrogen energy has been actively promoted. Since 2018, the advancement and large-scale application of hydrogen energy and fuel cell technology have steadily progressed. On 10 April 2020, the National Energy Administration officially included hydrogen in the energy category, marking the arrival of the fourth wave of development for hydrogen energy. In 2022, driven by the ongoing “Dual Carbon” strategy, policies were introduced across multiple domains, and enterprises significantly increased their investments. This year heralded the “breakout year” for the hydrogen energy industry.
Therefore, the sample period spans from 2018 to 2022, a timeframe during which hydrogen energy-related technologies experienced significant advancements and innovations. Breakthroughs in key technologies, such as water electrolysis for hydrogen production and fuel cells, have supported the development of the hydrogen energy industry chain during this period.

5.2. Efficiency Measures

5.2.1. Phase 1: SBM-DEA Results Analysis

The results of the first stage of SBM-DEA measurement, covering comprehensive technical efficiency (TE), pure technical efficiency (PTE), and scale efficiency (SE) for China’s hydrogen energy industry chain (including the upstream, midstream, and downstream segments) are shown in Table 2.
Table 2 reveals several key insights into the technical efficiency of China’s hydrogen energy industry chain from 2018 to 2022. First, the overall technical efficiency is low, with comprehensive technical efficiency values ranging between 0.4 and 0.75. Pure technical efficiency values are within the range of 0.75 and 0.85, and scale efficiency values are distributed between 0.6 and 0.85, indicating a medium efficiency level. Second, the efficiency of the upstream, midstream, and downstream segments exhibits heterogeneous characteristics. The midstream technical efficiency is lower than that of the upstream and downstream segments.
From the calculation results, more than 50% of the 10 enterprises in the midstream segment are in the stage of increasing returns to scale. The main reasons for this include the lack of overall planning, the absence of an established standard system, the need for breakthroughs in natural gas blending with hydrogen technology, and the reliance on long-tube-trailer road transportation, which is both costly and inefficient. These factors constrain the large-scale development of the midstream segment. Pipeline hydrogen transportation is the optimal method for achieving large-scale, long-distance hydrogen transportation.
In the upstream segment, pure technical efficiency aligns closely with scale efficiency, while in the midstream segment, pure technical efficiency exceeds scale efficiency. In comparison, in the downstream segment, pure technical efficiency is lower than scale efficiency. Across all segments, scale efficiency and pure technical efficiency are consistently higher than comprehensive technical efficiency. The differences in production efficiency across the upstream, midstream, and downstream segments of the hydrogen energy industry primarily stem from the following challenges: the upstream segment faces difficulties in the consumption of green hydrogen produced from wind and solar power; the midstream segment grapples with pipeline transportation technology issues; and the downstream segment suffers from a lack of hydrogen supply for applications.
Furthermore, the trends in comprehensive technical efficiency are consistent across the upstream, midstream, and downstream segments. The overall comprehensive technical efficiency and pure technical efficiency follow roughly similar trends, affected by the technological barriers in the midstream transportation segment and the limitations in large-scale transportation capacity, showing an “N-shaped” pattern characterized by an increase, followed by a decrease, and another increase. However, this pattern does not indicate significant long-term improvements.
When analyzing the underlying factors, technical efficiency is jointly determined by pure technical efficiency and scale efficiency. Pure technical efficiency represents the maximum output achievable with the existing combination of production inputs, given the existing technology and management practices, while scale efficiency reflects the impact of production scale changes on efficiency. For China’s hydrogen energy industry chain, there is considerable potential to enhance technical levels, organizational management, and economies of scale. Breakthroughs in key technologies and innovative practices are critical to achieving these improvements.
External environmental factors also significantly influence efficiency trends. During 2018–2019, the global shift toward renewable energy and heightened environmental concerns resulted in the unprecedented rapid growth of the hydrogen energy industry. This period saw notable achievements in hydrogen production, storage, transportation, and fuel cell technologies. However, from 2019 to 2021, efficiency gradually declined, mainly due to difficulties in achieving further technological breakthroughs and the disruptions caused by the COVID-19 pandemic. The global spread of the COVID-19 pandemic significantly impacted the hydrogen energy industry, subjecting it to challenges, such as a sharp decline in market demand, funding shortages, and supply chain disruptions, which have affected the overall production efficiency of the hydrogen energy industry. By 2021–2022, the industry started to recover, as weaker and less risk-resistant enterprises faced bankruptcy or were merged, while stronger firms integrated resources and optimized production capacity to improve performance.
From 2018 to 2022, China implemented a series of policies to support the development of the hydrogen energy industry. These policies included financial subsidies, tax incentives, and R&D support, aiming to improve the technical efficiency and scale efficiency of the hydrogen energy industry chain. In particular, hydrogen energy was first included in the government report in 2019, marking a period of rapid industry growth and improved efficiency within the hydrogen energy sector. However, the COVID-19 pandemic in 2020–2021, had an impact on industry operations, although efficiency improvements continued. In March 2022, China released the Hydrogen Energy Industry Planning (2021–2035) document, which played a positive role in promoting technological innovation and industrial upgrading of the hydrogen energy sector. Breakthroughs in hydrogen energy technology during this period contributed to further improvements in the efficiency of the hydrogen energy industry chain in 2022.

5.2.2. Phase 2: Analysis of Factors Affecting SFA Efficiency

The second phase of the analysis uses the SFA model to account for environmental influences and random error terms, refining the efficiency measurements of the industrial chain obtained in the first stage. Specifically, the input slack variables (calculated during the first stage) for the number of enterprise employees, business costs, and fixed assets are used to carry out a SFA regression with three environmental factors: the economic development level of the provinces, the extent of government support, and regional industrial agglomeration.
From Table 3, the significance of the regression coefficients indicates that these environmental influences have a significant effect on the input slack variables. The γ values of the three SFA regressions are much more than 1 and are significant at the 5% level, indicating that the three input slack variables are heavily influenced by environmental factors, necessitating adjustments to improve the precision of the efficiency measurements from the first stage. Additionally, the likelihood ratio (LR) test confirms the validity of the model. Since the environmental influences on input slack variables are inversely related to their influence on efficiency (i.e., environmental factors with positive effects on input slack variables have a negative influence on efficiency), the sign of the regression coefficient is used to assess these factors’ impact on efficiency.
(1)
The regression coefficients for the economic development level are negative for the slack variables of the number of employees and fixed assets and significant at the 1% level for business costs. A higher level of economic development enables the introduction of more advanced technologies and automated equipment, reducing redundancy in workforce size. At the same time, a more in-depth analysis of fixed asset investments and the adoption of advanced process technologies correspondingly decrease redundancy in fixed asset inputs, leading to more effective resource allocation. This indicates that higher regional economic development positively impacts the comprehensive technical efficiency of the hydrogen energy industry. Improved economic conditions contribute to enhanced industrial chain efficiency in various ways. First, higher regional economic levels facilitate increased investments from the government and enterprises in the clean energy sector, providing sufficient financial support for the research and development, production, and application of the hydrogen energy industry. Second, economically advanced regions tend to attract highly skilled and innovative talent, providing intellectual support for the efficient operation of the hydrogen energy industry chain. Third, in more developed regions, the closer cooperation among upstream, midstream, and downstream enterprises generates synergistic effects, improving the overall efficiency of the industrial chain.
Specifically, for upstream companies, economically advanced regions usually have more developed energy infrastructure and higher energy consumption, creating a broader market for hydrogen production enterprises. In the midstream sector, economic development influences storage and transportation enterprises primarily through market demand and logistics costs. Greater hydrogen energy demand in developed regions helps midstream companies expand their market share. For downstream enterprises, which mainly focus on end-user applications, such as transportation, industry, and construction, economically developed regions exhibit stronger demand, providing more market opportunities and driving growth in the hydrogen energy sector.
(2)
The regression coefficients of government support are positive for the slack variables of the number of employees and fixed assets, with significant impacts on all three slack variables (number of employees, operating costs, and fixed assets). Direct subsidies for scenarios with high application potential, such as midstream hydrogen pipelines and downstream fuel cells in the industrial chain, can promote hydrogen consumption and accelerate the process of green hydrogen substitution. Investing more research funds into hydrogen energy can guide technological innovation activities towards the hydrogen energy industry, supporting its high-quality development. However, this suggests that government policies in the hydrogen energy industry exhibit considerable variability and frequent adjustments, introducing uncertainties to the stable development of the industrial chain. Fluctuations in subsidy policy and their implementation can constrain financial investments in hydrogen energy projects, which, in turn, affects their progress and quality. Optimizing resource allocation and providing consistent policy guidance are essential to mitigate these challenges and enhance the efficiency of the industry chain.
Government support affects different segments of the hydrogen energy industry in distinct ways. For upstream enterprises, the impact is mainly reflected in policy subsidies, tax incentives, and R&D support. For midstream enterprises, policy support enhances infrastructure construction, logistics network optimization, and the promotion of hydrogen energy demonstration projects, ultimately reducing storage and transportation costs while improving accessibility and convenience. For downstream enterprises, policies, such as subsidies for hydrogen-powered vehicle purchases and financial support for hydrogen refueling station construction, lower user costs, facilitating the popularization and commercialization of hydrogen energy applications.
(3)
The degree of regional industrial agglomeration has a significant positive impact on the input slack variables for the number of employees and fixed assets but negatively affects operating costs. A higher contribution of secondary industry to regional GDP amplifies the positive impact on enterprise efficiency. However, the hydrogen energy industry chain faces structural challenges. The upstream segments, such as equipment manufacturing and raw material production, remain relatively weak, while downstream segments focusing on applications and markets are relatively constrained in driving overall industrial development.
For upstream enterprises, regional industrial agglomeration fosters economies of scale and synergies, reducing production costs and improving efficiency in hydrogen production. At the same time, industrial clustering promotes technological exchange and cooperation among enterprises, accelerating technological innovation and industrial upgrading. For midstream enterprises, regional industrial agglomeration optimizes logistics costs and enhances hydrogen energy supply chain efficiency, enabling storage and transportation enterprises to obtain hydrogen resources more conveniently and improve operational performance. For downstream enterprises, hydrogen energy application companies benefit from concentrated market demand and supply chain optimization, which create a favorable market atmosphere and demonstration effect, thereby promoting the widespread adoption and commercialization of hydrogen energy applications.
To address these issues, efforts should focus on optimizing and upgrading the industrial structure, coupled with rational planning of industrial agglomeration. A holistic approach to fostering the overall development of the hydrogen energy industry should be promoted, and the synergistic development of the upstream, midstream, and downstream industry chain should be strengthened. In addition, targeted investments in upstream equipment manufacturing and raw material production should be increased to improve the competitiveness and efficiency of the entire industry chain.

5.2.3. Phase 3: SBM-DEA Results Analysis

Based on the adjusted input indicators in the second stage and the original indicators, the SBM-DEA model was used to calculate the efficiency of the industrial chain and its individual links after excluding environmental influences and random interference. The calculation results are presented in Table 4.
From Table 4 and Figure 1, Figure 2 and Figure 3, the following observations emerge. First, the integrated technical efficiency and scale efficiency of the entire industry chain and its segments are significantly low, with values ranging between [0.05, 0.4]. Both measures exhibit closely aligned trends. However, the pure technical efficiency of the entire industry chain and its segment rises to nearly 1, indicating near-optimal technical effectiveness.
Second, the sharp decline in comprehensive technical efficiency indicates the critical challenges faced by China’s hydrogen energy industry chain. These include insufficient R&D investment, weak synergy across different links in the chain, outdated equipment, and a shortage of skilled talent. Due to the long R&D cycles and high costs associated with hydrogen energy technologies, many enterprises reduce their R&D budgets under financial pressure, hindering technological progress and limiting efficiency improvements. In addition, the lack of strong collaboration between segments, such as production, storage, transport, refueling, and application, reduces overall chain efficiency, while delays in equipment upgrades further exacerbate inefficiencies.
Third, the decline in adjusted scale efficiency reflects imbalances in the market, including mismatches between supply and demand, uneven development across segments of the industry chain, and insufficient policy support. Insufficiencies in scale management and limited clustering effects also highlight the need for better spatial planning and optimization of the industry chain to improve scale efficiency.
Fourth, the increase in pure technical efficiency after removing environmental influences demonstrates China’s strong foundation in hydrogen energy technology research and development, equipment manufacturing, and process optimization. Over the years, substantial progress in hydrogen energy technology innovation has enhanced production efficiency and stability, highlighting the country’s potential for further development in this sector.
Finally, when comparing the efficiency averages of different segments, the midstream segment shows the lowest efficiency, followed by the downstream segment, while the upstream segment is the most efficient. The midstream segment, which includes storage and transportation, has become a weak link, limiting the overall efficiency of the industry chain. Therefore, optimizing the scale of storage and transportation links and fostering industrial economies of scale are essential for improving the overall performance of the hydrogen energy industry chain.

5.3. Trend Analysis

Based on the efficiency of China’s hydrogen energy industry chain from 2018–2022, the kernel density estimation method is utilized to analyze the efficiency of 30 listed companies in the hydrogen energy sector at a micro level. The resulting efficiency development trends for these companies are illustrated in Figure 4, Figure 5 and Figure 6.
Figure 4 shows the kernel density distribution of the integrated technical efficiency of industrial chain enterprises. Overall, the distribution curve exhibits a single-peak shape from 2011 to 2019, with the center of the curve near the 0 scale, while the right tail of the main peak is extended, with a tendency to form a second peak near scale 1. This suggests that while the efficiency levels of industrial chain enterprises are relatively concentrated, with most operating inefficiently, a small number of companies achieve high or even relative efficiency. This reflects a bifurcation phenomenon in the efficiency of enterprises within the industrial chain.
The polarization in production efficiency within China’s hydrogen energy industry chain is mainly due to technological disparities, regional policy imbalances (with stronger policies and better infrastructure in the eastern region versus insufficient support in the central and western regions), lack of coordination in the industrial chain (high storage and transportation costs, along with technological bottlenecks limiting scalability), and significant differences in enterprise size (large firms with abundant resources versus small firms with limited capabilities).
From 2018 to 2020, the curve shifts slightly to the left, and the peak value increases, indicating a decline in efficiency for most enterprises and an increase in the number of inefficient enterprises. Between 2020 and 2021, the main peak of the kernel density curve moves to the right, and its height decreases significantly, suggesting a recovery in efficiency levels. For 2021–2022, the main peak’s height decreases further, and the width broadens, forming a low secondary peak to the right. This suggests a widening gap in efficiency levels among enterprises, with some achieving significantly higher efficiency than others. As a result, enterprises with higher efficiency will gain a more favorable market position, while less efficient enterprises may experience greater competitive pressure or even risk elimination. To enhance competitiveness, enterprises may increase investment in research and development, driving technological innovation and industrial upgrading. As the efficiency gap widens, integration across the upper, middle, and lower segments of the industrial chain may accelerate, potentially narrowing the gap once stronger collaborative relationships and synergies are formed.
From a macro perspective, some enterprises have entered the hydrogen energy sector to capitalize on its development momentum. However, due to the complexity of hydrogen energy technology and high costs, they have not achieved significant progress. As an emerging industry, the hydrogen energy sector is adopting a strategy of combining point-to-point and area-driven approaches, advancing hydrogen energy demonstration projects in an orderly fashion, and exploring effective commercialization pathways for industry development.
Figure 5 shows the kernel density distribution of pure technical efficiency. Unlike the integrated comprehensive technical efficiency curve, the pure technical efficiency curve features a tall, narrow peak centered close to scale 1. The difference in peak height for different years is pronounced, with noticeable double peaks in certain years. This indicates that the pure technical efficiency of most enterprises is relatively high and concentrated in the interval [0.9, 1], with more enterprises achieving near-efficiency levels. In 2018, the number of enterprises achieving near-efficiency was close to the number of high-efficiency enterprises, clustered near the 1 and 0.75 scales, respectively, resulting in a double-peak distribution. For 2018–2019, the double-peak state transitions into a single-peak curve, accompanied by a sharp decrease in peak height and a prolonged left tail. This suggests a small decline in pure technical efficiency for a small number of enterprises. In 2019, hydrogen energy was officially included in the Chinese government work report, marking its official integration into China’s energy system. This signaled the beginning of significant development for hydrogen energy, promoting the rapid growth of the hydrogen energy industry chain. For 2019–2020, the single-peak state is maintained, with the peak height rising and its width gradually decreasing. This suggests a narrowing gap in pure technical efficiency among enterprises in the industrial chain, with some enterprises maintaining high efficiency while a few others approached near-efficiency levels.
The kernel density distribution curve of the scale efficiency of industrial chain enterprises, as shown in Figure 6, closely resembles the curve for comprehensive technical efficiency in Figure 4. For 2018–2022, the kernel density distribution of scale efficiency maintains a single-peak shape, with the main peak positioned near the 0 scale line. However, the height of the main peak decreases, the center of the curve shifts leftward, and the trailing end on the right side of the main peak extends further. This indicates that the scale efficiency of most enterprises in the industrial chain remains relatively low and clustered around at a low-efficiency level. At the same time, a small number of enterprises exhibit high-efficiency levels, demonstrating a widening gap in scale efficiency across enterprises within the industry.

6. Conclusions, Suggestions, and Discussion

6.1. Conclusions

To study the efficiency measurement and development trend of China’s hydrogen energy industry chain, the three-stage DEA model was first employed to assess the comprehensive technical efficiency, pure technical efficiency, and scale efficiency of the industry chain as a whole, as well as the upstream, midstream, and downstream segments. Additionally, this study analyzed the influence of the external environment on the efficiency of the industry chain, identified critical shortcomings in its development [30], and assessed efficiency trends using the kernel density estimation method.
(1)
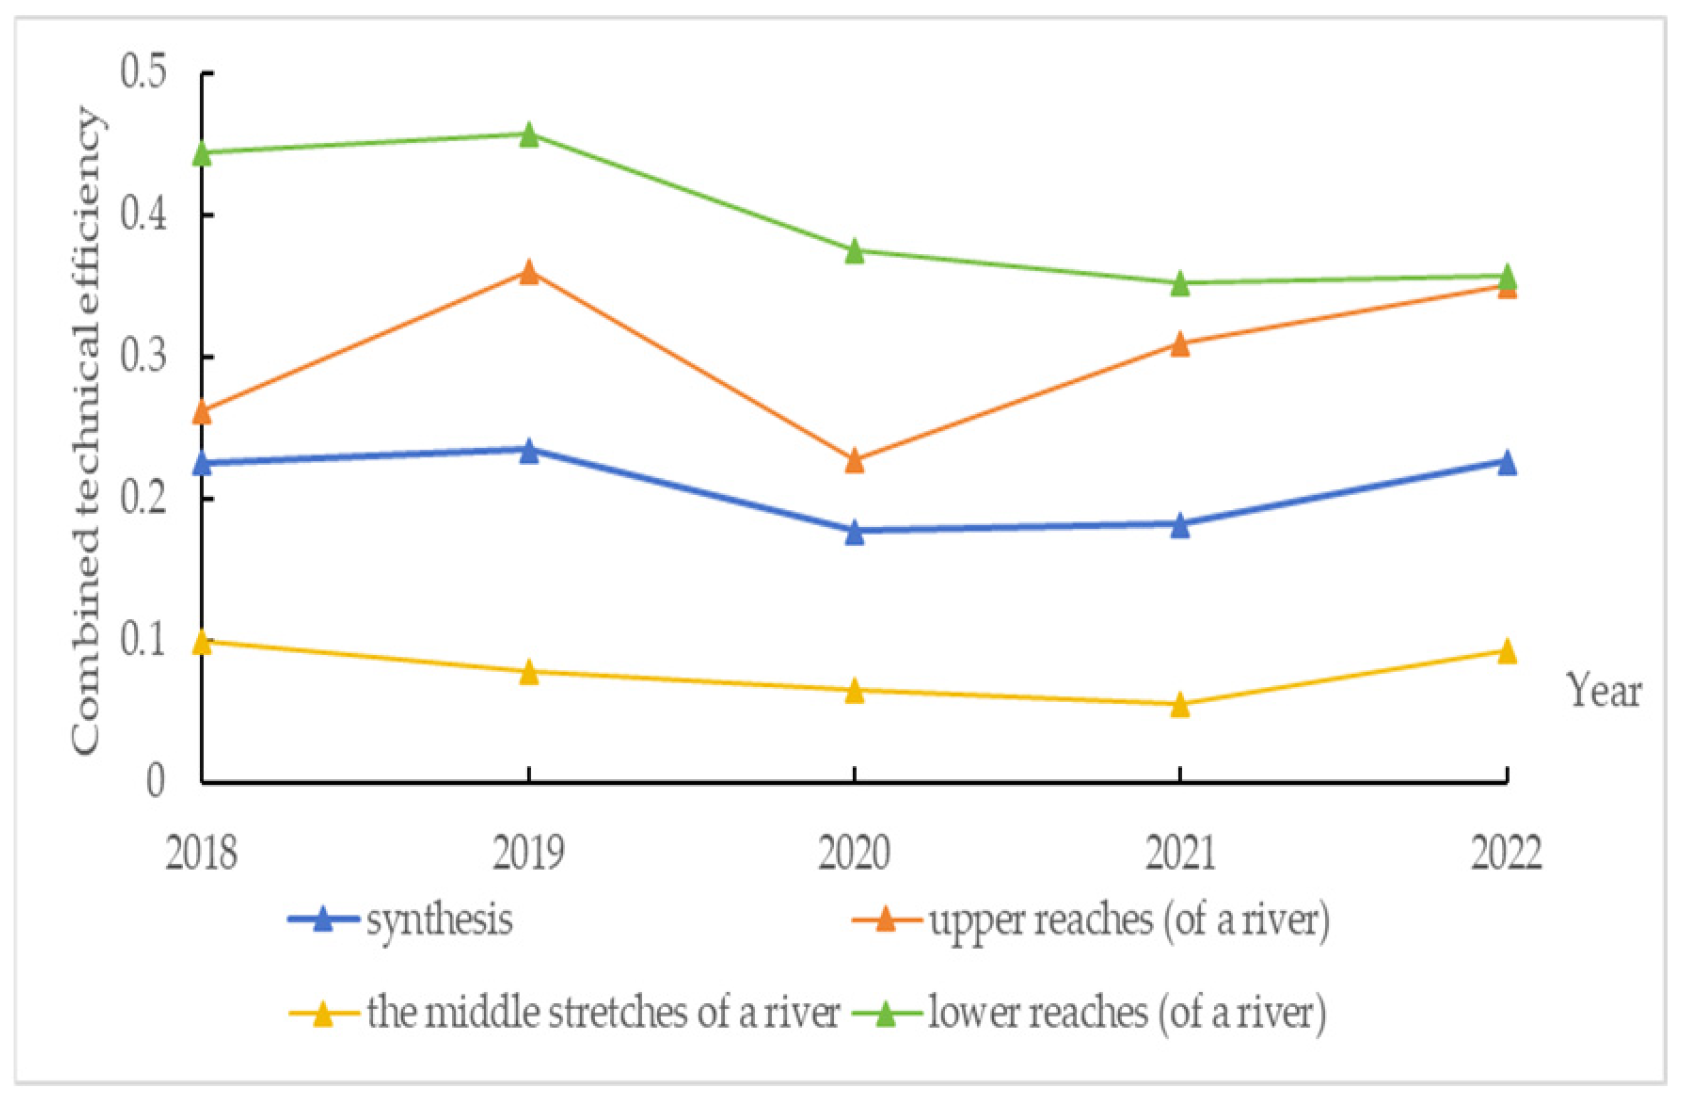
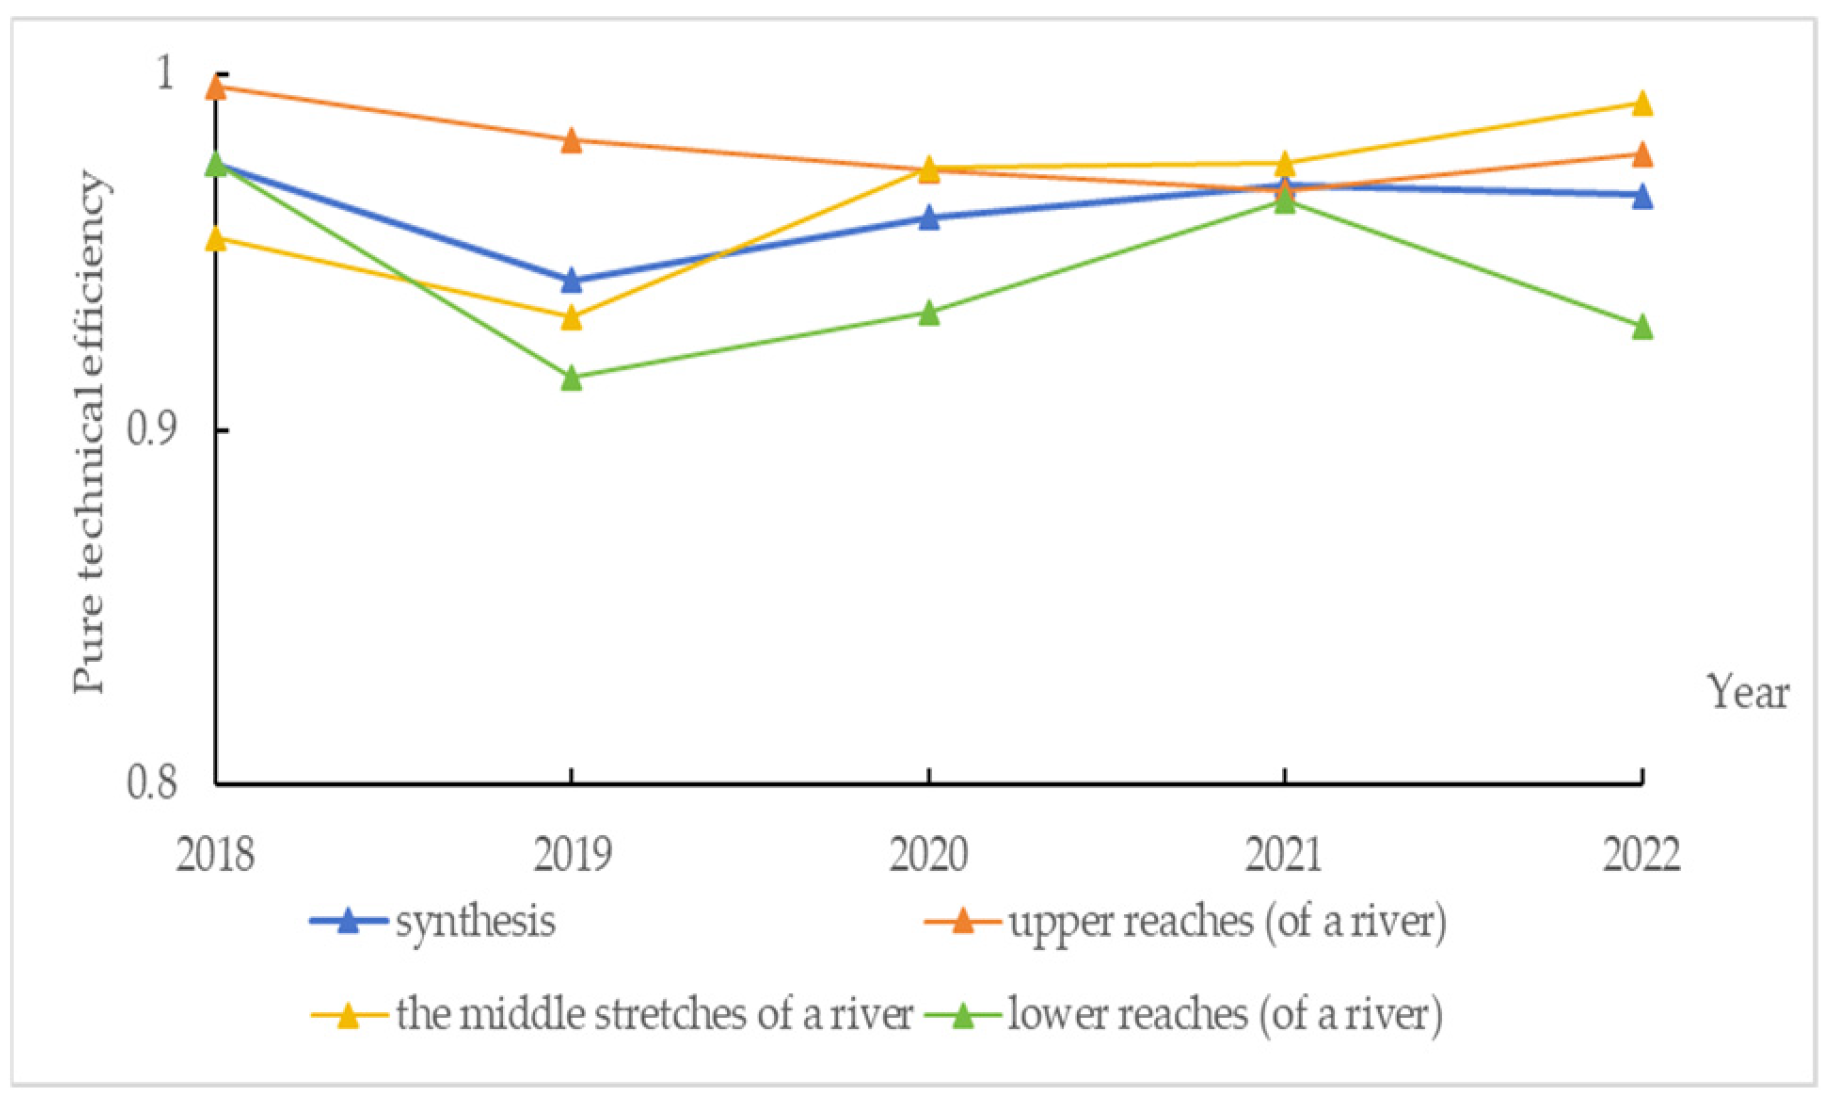
The overall comprehensive technical efficiency level of China’s hydrogen energy industry chain was low from 2018 to 2022, primarily due to low pure technical efficiency and scale efficiency, which hindered the improvement of overall technical efficiency. This emphasizes the need for simultaneous improvements in both pure technical efficiency and scale efficiency. Moreover, there was an imbalance in the efficiency development of the various segments of the industry chain, with the comprehensive technical efficiency of the midstream lagging behind that of the upstream and downstream, becoming a bottleneck. An analysis of the factors influencing the external environment reveals that the level of economic development, government support, and regional industrial agglomeration significantly impact the efficiency of the hydrogen energy industry chain [31]. After removing the influence of the external environment, the comprehensive technical efficiency of the hydrogen energy industry chain further decreased, while pure technical efficiency increased [32]. As a result, China’s hydrogen energy industry chain faces deep-seated issues, such as an irrational industrial structure, weak infrastructure, gaps in core technology, and an uneconomical industrial scale, all of which impede the improvement of the chain’s efficiency.
(2)
The trend analysis of the 2018–2022 period reveals two levels of differentiation in the efficiency development of 30 enterprises within China’s hydrogen energy industry chain, spanning the upstream, middle, and downstream sectors. High-efficiency enterprises demonstrate a more scientific and rational allocation of resources, with little to no redundancy in input and output. In contrast, low-efficiency enterprises exhibit significant redundancy in resource allocation, leading to unnecessary waste. To improve production efficiency, reduce costs, and enhance competitiveness, it is essential to further identify and utilize these resources. While some enterprises exhibit high-efficiency levels, the majority remain at middle and low-efficiency levels. The current state of these enterprises presents significant challenges in making quick changes, and it is unlikely that they can independently improve their efficiency without external support or intervention. Within each segment of the industrial chain, high-efficiency enterprises can serve as industry leaders, guiding other firms toward technological innovation and reform. By sharing experiences and technologies with low-efficiency enterprises or forming industry alliances, they can enhance communication and collaboration, thereby helping lower-performing enterprises to improve their efficiency. A key area for future research is determining how to effectively integrate point-to-point and area-driven approaches, using key points to drive broader industry development. The overall efficiency level of China’s hydrogen energy industry chain remains relatively low, mainly due to an unbalanced industrial structure, weak infrastructure, limited breakthroughs in core technologies, and diseconomies of scale. To address these challenges, prioritizing the development of leading enterprises is recommended. By allowing these firms to serve as anchors for industry-wide progress, they can drive advancements in other enterprises, ultimately facilitating an overall improvement in the efficiency of the hydrogen energy industrial chain.

6.2. Recommendations

Against the strategic backdrop of carbon peaking and carbon neutrality, the hydrogen energy industry has encountered unprecedented development opportunities. However, influenced by various factors, such as technological complexity, high investment costs, and multiple production stages, China’s hydrogen energy industry chain still faces issues, like low production efficiency and insufficient coordination. To achieve high-quality development across the entire industry chain, this study recommends adopting a policy-driven approach, combining point-to-point and area-driven strategies. The immediate goal should be to enable leading enterprises in each segment to achieve breakthroughs in key core technologies. In addition, it is also suggested that domestic and international hydrogen energy technological innovation cooperation be actively promoted, alongside strengthening standardization, industry regulation, and the efficient, coordinated development of the industry chain. The following steps will contribute to achieving this goal:
(1)
Continuously improve the level of key core technologies. Relying on national science and technology programs, it is essential to vigorously support the development of foundational materials, core components, critical equipment, and disruptive technologies within the hydrogen energy sector. Projects, such as hydrogen-powered aircraft, liquid hydrogen transport ships, offshore wind-to-hydrogen equipment, and integrated wind-solar-hydrogen storage and refueling systems, should be progressively advanced. A comprehensive hydrogen energy equipment system should be developed, covering the entire industrial chain of production, storage, transportation, and application. It is necessary to accelerate innovation in proton exchange membrane fuel cells, focusing on the development of critical materials, improving performance indicators, and expanding batch production capabilities. Efforts should be made to continuously enhance the reliability, stability, and durability of fuel cells [33]. Support should also be provided for the development of new fuel cells and other related innovations. It is necessary to promote the R&D and manufacturing of core components and essential equipment, as well as the improvement of renewable energy hydrogen conversion efficiency and the scaling of hydrogen production per unit. It is also necessary to overcome the technical challenges related to hydrogen energy infrastructure and push forward the development of key core technologies across the production, storage, transport, and application of green, low-carbon hydrogen energy [34].
(2)
Emphasize the development of industrial innovation support platforms. By focusing on critical areas and key segments of the hydrogen energy sector, efforts should be made to establish multi-level and diversified innovation platforms that accelerate the convergence of talent, technology, funding, and other essential innovation factors. Universities, research institutes, and enterprises should collaborate to establish key laboratories and cutting-edge interdisciplinary research platforms to carry out applied basic research and explore advanced hydrogen energy technologies. Relying on leading enterprises to integrate high-quality innovation resources in the industry, the establishment of industrial innovation centers, engineering research centers, technology innovation centers, and manufacturing innovation centers should be prioritized, fostering efficient collaborative innovation.
Incorporating digital technology into the hydrogen energy industry is crucial for optimizing efficiency and resource utilization. Data integration across the upper, middle, and lower reaches of the hydrogen energy industry chain, including production, storage, transportation, and application, can provide a comprehensive understanding of industry dynamics. Utilizing big data analytics can enable accurate prediction of hydrogen energy demand and optimize resource allocation. In addition, a hydrogen energy industry chain cooperation mechanism should be established to promote information sharing and collaboration at the different stages of the value chain. Strengthening industrial chain integration can foster a cluster effect, improving the overall competitiveness of the hydrogen energy sector. Digital collaboration is a key driver of industry development, and the establishment of a centralized data platform, intelligent production and management systems, and optimized energy management frameworks can further enhance operational efficiency. Strengthening collaboration among government entities, industries, academic institutions, research organizations, and application sectors, along with fostering international cooperation and exchanges, will be instrumental in advancing the competitiveness and capabilities of the hydrogen energy industry.
(3)
Promote the development of a specialized talent pool for hydrogen energy. Driven by the need for technological innovation in the hydrogen energy sector, efforts should be made to attract and cultivate high-end talent to strengthen the R&D capabilities in basic frontier technologies related to hydrogen energy. The focus should be on accelerating the cultivation of professional talents in hydrogen energy technology and equipment, thereby reinforcing the innovation foundation necessary for the industry’s growth. A sound mechanism for talent cultivation and training systems should be established. The development of local hydrogen energy talent has become a key consideration for enterprises when selecting project locations. Driven by favorable policies and industrial demand, the challenge of hydrogen energy talent shortages has seen breakthroughs in Chinese universities. Since 2019, programs, such as “Hydrogen Energy Technology Application” and “Hydrogen Energy Science and Engineering”, have been included in the undergraduate curriculum of Chinese universities. Beyond undergraduate programs, the development of hydrogen energy disciplines has expanded to include master’s and doctoral levels. Establishing a comprehensive training model encompassing undergraduate, master’s, and doctoral programs will provide strong support for cultivating talent within the hydrogen energy industry. This will accelerate the development of hydrogen energy-related disciplines and specialties and expanding the pool of hydrogen energy innovation and R&D professionals [35].
(4)
Actively pursue international collaboration in hydrogen energy technology innovation. It is necessary to encourage joint research and development of hydrogen energy science and technology, promote cooperation in the innovation of key core technologies, materials, and equipment across the entire industry chain, and actively build an international hydrogen energy innovation chain and industry chain. It is also necessary to take an active role in the development of international hydrogen energy industry standards and to adhere to the principle of joint construction and shared benefits, exploring partnerships in hydrogen energy trade, infrastructure development, and product innovation with countries involved in the “Belt and Road” initiative. Finally, it is necessary to strengthen project cooperation with countries and regions with leading hydrogen energy technologies, and to jointly explore international markets.
(5)
The establishment of a standardization and regulatory framework for the hydrogen energy industry is crucial for ensuring safety within the sector. Formulating national and industry-specific standards for hydrogen energy production, storage, transmission, and utilization, and clarifying industrial norms will help prevent safety incidents caused by improper operations or equipment failures [36]. At the same time, strengthening industrial supervision is necessary to ensure that enterprises and individuals adhere to relevant regulations, thereby enhancing the safety standards of the hydrogen energy industry. Achieving high-quality and sustainable development in the hydrogen energy sector requires coordination across the entire industry chain. This includes securing top-tier equipment from upstream manufacturers, ensuring the safe transport and storage of hydrogen by midstream companies, and facilitating its correct use by downstream consumers. Industry-wide synergy and cooperation bolster the risk resistance of the entire hydrogen energy chain. A flexible regulatory framework should be established to avoid a “one-size-fits-all” approach.
Efforts should focus on strengthening safety technology R&D, promoting pilot projects, improving industry standards and certification systems, and fostering industry–academia–research collaboration to tackle technical challenges. Policy support and incentives should be provided, and public education and industry training should be enhanced, along with leveraging international experience to promote global collaborative development. Establishing a dedicated hydrogen energy fund can provide financial support and risk protection for hydrogen-related projects. Legal frameworks should also be strengthened, incorporating hydrogen energy safety regulations and environmental protection policies. Furthermore, participation in international hydrogen energy organizations should be encouraged, strengthening exchanges and cooperation with countries that have advanced hydrogen technologies. By integrating foreign innovations, strengthening interactions with international markets, and promoting globalization efforts, the technological level and market competitiveness of China’s hydrogen energy industry can be significantly enhanced.
(6)
To optimize resource utilization and innovation, a hydrogen energy industry alliance should be established. This alliance would connect upstream and downstream enterprises, research institutions, and related stakeholders, promoting technical exchange, cooperation, and resource sharing. Collaborative innovation across the industry chain can drive efficiency and technological advancements. Building a comprehensive hydrogen storage and transportation network is another crucial step. Inspired by power grid dispatching and intelligent energy management in buildings, a unified hydrogen dispatching and management system should be implemented. Hydrogen can be transported from production sites to consumption areas through pipelines and high-pressure gas cylinders, reducing storage and transportation costs, while improving safety [37].
Expanding hydrogen application scenarios is also vital. Encouraging R&D and demonstration projects in various application fields, including hydrogen fuel cell vehicles (transportation), hydrogen-based steelmaking (industrial), and hydrogen heating (construction) can increase demand and promote industry growth. Additionally, establishing a hydrogen energy trading platform can facilitate market-oriented allocation and resource sharing. This platform would allow enterprises and individuals across the hydrogen energy value chain to buy and sell hydrogen efficiently. Drawing inspiration from intelligent building energy storage-sharing services, a resource-sharing mechanism between different segments of the hydrogen industry should be explored. These efforts, supported by policy initiatives, technological advancements, talent development, and market promotion, can ensure the coordinated growth of the hydrogen energy industry and accelerate its long-term development.
(7)
A structured industry improvement action plan should be formulated with the primary objective of enhancing efficiency, increasing technology research and development, and driving key technology innovations in the hydrogen energy sector. Introducing and assimilating international advanced technologies and equipment will accelerate the industry’s ability to innovate and adapt. Efforts should be made to expand infrastructure for hydrogen storage, production, transportation, and utilization. Optimizing hydrogen production structures is also critical, which includes increasing the proportion of hydrogen production by water electrolysis and improving the efficiency of hydrogen production from coal. To achieve sustainable and competitive industry growth, a unified energy system should be developed, ensuring seamless integration with global markets. Strengthened supervision will be necessary to maintain safety and environmental protection. Promoting international cooperation and exchanges will further advance the sector. Collaboration with internationally renowned enterprises and research institutions can drive joint research and development, accelerating the adoption and commercialization of cutting-edge hydrogen energy technologies.

6.3. Discussion

This paper introduces innovations for measuring the efficiency trends of the hydrogen energy industry chain. However, the industry faces numerous uncertainties, particularly in key and complex areas, such as hydrogen production, storage, and transportation. Factors, such as technological breakthroughs, policy changes, and market demand fluctuations, may affect investment decisions, technology research and development, and market expansion. These uncertainties may also trigger chain reactions that could lead to efficiency declines across the entire industrial chain.
Due to the current limitations in data availability, this study does not incorporate uncertainty analysis. Future research will address this gap by introducing a risk aversion strategy based on the conditional value at risk (CVaR). This approach will enable a more accurate evaluation of the risks facing the hydrogen energy industry chain under uncertainty and their potential impact on overall efficiency, mitigating these uncertainties and enhancing the resilience of the hydrogen energy industry.

Author Contributions

Conceptualization, B.L. and P.Z.; data curation, B.L.; formal analysis, P.Z. and B.L.; funding acquisition, P.Z.; investigation, B.L.; project administration, H.I. and H.D.; supervision, H.I. and H.D.; writing—original draft, B.L. and Y.Q.; writing—review and editing, P.Z., H.I. and H.D. All authors have read and agreed to the published version of the manuscript.

Funding

Shandong Provincial Social Science Planning Research Project: 23CSDJ57.

Institutional Review Board Statement

Not applicable.

Informed Consent Statement

Not applicable.

Data Availability Statement

The data supporting the plots within this paper and other study findings are available from the corresponding author upon reasonable request.

Acknowledgments

We would like to express our gratitude to the Dongying Regional High-Quality Economic Development Research Base at Shandong Institute of Petroleum and Chemical Technology for their financial support.

Conflicts of Interest

The authors declare no conflicts of interest.

References

  1. Zhao, H.; Zhu, B.; Jiang, B. Comprehensive assessment and analysis of cavitation scale effects on energy conversion and stability in pumped hydro energy storage units. Energy Convers. Manag. 2025, 325, 119370. [Google Scholar] [CrossRef]
  2. Cheng, Q. Research on the Connotation, Mechanism and Measurement of Industrial and Supply Chains–Based the Toughness of Regional Industrial and Supply Chains and Its Enlightenment to Nantong. Shanghai Econ. 2022, 6, 25–40. [Google Scholar] [CrossRef]
  3. Shi, J.; Lu, D.; Xu, L. On the Fourth Global Industrial Chain Reconstruction with China’s Industrial Chain Upgrading. Res. Financ. Econ. Issues 2022, 4, 8–117. [Google Scholar] [CrossRef]
  4. Duan, W.; Wang, B. Theories and paths to enhance the resilience of industrial chain supply chain. Chin. Soc. Sci. Today 2023, 3. [Google Scholar]
  5. Song, M. Study on the Path to Enhancing China’s Industrial Chain Resilience. Ind. Eng. Innov. Manag. 2024, 7, 148–153. [Google Scholar] [CrossRef]
  6. Wen, H.; Liang, W.; Lee, C.C. Input–output Efficiency of China’s Digital Economy: Statistical Measures, Regional Differences, and Dynamic Evolution. J. Knowl. Econ. 2023, 15, 10898–10923. [Google Scholar] [CrossRef]
  7. Cheng, L.T.W.; Lee, S.K.; Li, S.K.; Tsang, C.K. Understanding resource deployment efficiency for ESG and financial performance: A DEA approach. Res. Int. Bus. Financ. 2023, 65, 101941. [Google Scholar] [CrossRef]
  8. Wang, Q.; Wu, S.; Huang, P.; Hueng, C.J. The influence of market liquidity on the efficiency of China’s pilot carbon markets. Financ. Res. Lett. 2025, 72, 106560. [Google Scholar] [CrossRef]
  9. Oldenhof, L.; Kersing, M.; Zoonen, V.L. Sphere transgressions in the Dutch digital welfare state: Causing harm to citizens when legal rules, ethical norms and quality procedures are lacking. Inf. Commun. Soc. 2024, 27, 2704–2720. [Google Scholar] [CrossRef]
  10. Tan, J. Research on the mechanism of digital economy to enhance the innovation efficiency of high-tech industry in the context of big data. Appl. Math. Nonlinear Sci. 2024, 9, 1–14. [Google Scholar] [CrossRef]
  11. Zoitovich, K.K.; Uralovich, A.N.; Jonuzokovich, A.A. Factor analysis of industrial efficiency indicators. J. Crit. Rev. 2020, 7, 515–517. [Google Scholar]
  12. Ang, F.; Ramsden, J.S. Analysing determinate components of an approximated Luenberger–Hicks–Moorsteen productivity indicator: An application to German dairy-processing firms. Agribusiness 2024, 40, 349–370. [Google Scholar] [CrossRef]
  13. Hu, L.; Chen, F.; Zhao, R. Does Digital Inclusive Finance Increase Industry Chain Resilience in China? Sustainability 2024, 16, 6028. [Google Scholar] [CrossRef]
  14. Amiri, S.; Alinaghian, M.; Khosroshahi, H. Optimizing greenness and pricing in green product development: Addressing cannibalization and enhancing market share in a duopoly markets. Environ. Dev. Sustain. 2024, 26, 1–46. [Google Scholar] [CrossRef]
  15. Feng, H.; Guanchun, L.; Jing, H. CSR performance and firm idiosyncratic risk in a data-rich environment: The role of retail investor attention. J. Int. Financ. Mark. Inst. Money 2023, 89, 101877. [Google Scholar] [CrossRef]
  16. Fiona, S.; Jennifer, P. Measuring the academic library:Translating today’s inputs and outputs into future impact and value. Inf. Learn. Sci. 2018, 119, 109–120. [Google Scholar] [CrossRef]
  17. Alireza, A.; Tofigh, A.; Maryam, N. A firm-specific Malmquist productivity index model for stochastic data envelopment analysis: An application to commercial banks. Financ. Innov. 2024, 10, 3705–3715. [Google Scholar] [CrossRef]
  18. Mansaray, S.S.; Hongyi, X.; Sawaneh, A.I. Assessing and enhancing operational efficiency in Sierra Leone’s retail banking sector: A comparative analysis using CCR and BCC DEA models. Manag. Decis. Econ. 2024, 45, 3705–3715. [Google Scholar] [CrossRef]
  19. Zhang, J.; Zhang, Y.; Chen, Y.; Wang, J.; Zhao, L.; Chen, M. Evaluation of Carbon Emission Efficiency in the Construction Industry Based on the Super-Efficient Slacks-Based Measure Model: A Case Study at the Provincial Level in China. Buildings 2023, 13, 2207. [Google Scholar] [CrossRef]
  20. Forghani, D.; Ibrahim, M.D.; Daneshvar, S. Improving weak efficiency frontier in a variable returns to scale stochastic data envelopment analysis model. RAIRO-Oper. Res. 2022, 56, 2159–2179. [Google Scholar] [CrossRef]
  21. Lou, Y.Y.; Yang, G.L.; Guan, Z.C.; Chen, X.L.; Pan, H.; Wang, T.; Zheng, H.J. A parallel data envelopment analysis and Malmquist productivity index model of virtual frontier for evaluating scientific and technological innovation efficiency at universities. Decis. Anal. J. 2024, 10, 100384. [Google Scholar] [CrossRef]
  22. Mohanty, A.; Mohapatra, G.A.; Tripathy, K.P. Smart hospitality using IoT enabled integrated face recognition, machine learning, and fuzzy AHP for analyzing customer satisfaction measurements. Int. J. Inf. Technol. 2024, 17, 1597–1605. [Google Scholar] [CrossRef]
  23. Peter, S.C.; Whelan, J.P.; Pfund, R.A. Text Comprehension Analyses to Improve Assessment Accuracy: Demonstration Using Gambling Disorder Screening. J. Gambl. Stud. 2022, 38, 1269–1287. [Google Scholar] [CrossRef]
  24. Zulqarnain, M.; Wei, W.; Ihsan, J. Evaluating the factors of coal consumption inefficiency in energy intensive industries of China: An epsilon-based measure model. Resour. Policy 2022, 78, 102800. [Google Scholar] [CrossRef]
  25. Ling, W. Hydrogen Energy in Shandong: Building on the Momentum and Joining the Trend of Our Times. Engineering 2021, 7, 726–727. [Google Scholar] [CrossRef]
  26. Zhang, X. The Development Trend of and Suggestions for China’s Hydrogen Energy Industry. Engineering 2021, 7, 719–721. [Google Scholar] [CrossRef]
  27. Xu, S.; Yu, B. The Current Development Status and Future Prospects of Hydrogen Energy Technology in China. J. Beijing Inst. Technol. (Soc. Sci. Ed.) 2021, 23, 1–12. [Google Scholar] [CrossRef]
  28. Gao, W. The concept of hydrogen energy continues to attract attention, with listed companies positioning themselves in a trillion-level market. Econ. Inf. Dly. 2022, 3. [Google Scholar] [CrossRef]
  29. Fried, H.O.; Lovell, C.A.K.; Schmidt, S.S.; Yaisawarng, S. Accounting for Environmental Effects and Statistical Noise in Data Envelopment Analysis. J. Product. Anal. 2002, 17, 157–174. [Google Scholar] [CrossRef]
  30. Kijima, Y.; Schoemaker, R.; Tipka, A. Investigation of Radioxenon Probability Density Functions at IMS Radionuclide Stations Using a Monte Carlo Method for Background Estimation. Pure Appl. Geophys. 2024, 181, 1–11. [Google Scholar] [CrossRef]
  31. Nourelhouda, A.E. Green Entrepreneurship: External Environment Analysis on the Renewable Energy Industry in Jordan. J. Humanit. Arts Soc. Sci. 2022, 6, 275–302. [Google Scholar] [CrossRef]
  32. Ziobrowski, Z.; Rotkegel, A. Assessment of Hydrogen Energy Industry Chain Based on Hydrogen Production Methods, Storage, and Utilization. Energies 2024, 17, 1808. [Google Scholar] [CrossRef]
  33. Huo, H.; Wang, K.; Li, B. Model-based humidity observer for vehicle proton exchange membrane fuel cell based on a new sliding mode observer estimation technique. Int. J. Green Energy 2024, 21, 3601–3612. [Google Scholar] [CrossRef]
  34. Wei, L.; Yanming, W.; Yalin, X. Green hydrogen standard in China: Standard and evaluation of low-carbon hydrogen, clean hydrogen, and renewable hydrogen. Int. J. Hydrogen Energy 2022, 47, 24584–24591. [Google Scholar] [CrossRef]
  35. Ran, M.; Li, Y. Value Logic of Talent Cultivation Quality in Evaluation Model for Vocational Colleges in New Era. Educ. Reform Dev. 2024, 6, 51–56. [Google Scholar] [CrossRef]
  36. Sokhna, G.S.; Emmanuel, H.; Vincent, D. Hydrogen development in Europe: Estimating material consumption in net zero emissions scenarios. Int. Econ. 2023, 176, 100457. [Google Scholar] [CrossRef]
  37. Zhang, H.; Li, Z.; Xue, Y.; Chang, X.; Su, J.; Wang, P.; Guo, Q.; Sun, H. A Stochastic Bi-Level Optimal Allocation Approach of Intelligent Buildings Considering Energy Storage Sharing Services. IEEE Trans. Consum. Electron. 2024, 70, 5142–5153. [Google Scholar] [CrossRef]
Figure 1. Comprehensive efficiency map.
Sustainability 17 03140 g001
Figure 2. Pure technical efficiency chart.
Sustainability 17 03140 g002
Figure 3. Scale efficiency chart.
Sustainability 17 03140 g003
Figure 4. Kernel density distribution of the integrated technical efficiency of industrial chain firms.
Sustainability 17 03140 g004
Figure 5. Kernel density distribution of the pure technical efficiency of industrial chain firms.
Sustainability 17 03140 g005
Figure 6. Kernel density distribution of scale efficiency of industrial chain firms.
Sustainability 17 03140 g006
Table 1. Comparison of hydrogen energy industry policies in China, Japan, Germany, and the United States.
ItemChinaJapanGermanyUnited States
Industrial planningPlanning for the Hydrogen Energy Industry (2021–2035)Sixth Energy Basic PlanGerman National Hydrogen StrategyU.S. Hydrogen Economy Roadmap-Reducing Emissions and Driving Hydrogen Growth Across the United States
Tax incentivesHydrogen energy-related corporate income tax reduction and exemption, value-added tax incentives.A series of fiscal and tax policies, such as the “hydrogen energy industry promotion tax system”.Integrate into energy transformation and environmental protection policies, and indirectly support the hydrogen energy industry.Publish the Deflation Reduction Act, a tax credit for clean hydrogen production.
SubsidiesDirect funding subsidies, R&D subsidies, project construction subsidies, etc.Funds support the research and development of new energy technologies, the promotion of demonstration projects, and infrastructure construction.Set up special funds, provide loans, enterprise costs, etc.Funds support project research and development, demonstration applications, and infrastructure construction of the hydrogen energy industry.
Technical talentStrengthen higher education and vocational education, and train hydrogen energy professionals.Japan pays attention to education investment and cultivates local hydrogen energy technology talents.Set up scholarships, provide research positions, and attract and train hydrogen energy talents.Support the cultivation of talents in the hydrogen energy industry.
International cooperationCarry out hydrogen energy technology exchanges and project cooperation with many countries and regions.Carry out hydrogen energy trade and technical cooperation with Australia and other countries.Carry out hydrogen energy technology exchanges and project cooperation with the European Hydrogen Energy Alliance, EU member states, and other countries.Carry out hydrogen energy technology research and development and project demonstration with many countries.
Table 2. Efficiency of China’s hydrogen energy chain (phase I).
YearCombined Technical EfficiencyPure Technical EfficiencyScale Efficiency
SynthesisUpper Reaches (of a River)The Middle Stretches (of a River)Lower Reaches (of a River)SynthesisUpper Reaches (of a River)The Middle Stretches (of a River)Lower Reaches (of a River)SynthesisUpper Reaches (of a River)The Middle Stretches (of a River)Lower Reaches (of a River)
20180.49160.58160.39130.52210.71180.75820.68930.69000.69070.76710.56770.7567
20190.63560.75930.48390.69900.81840.89500.76700.79860.77670.84830.63090.8753
20200.56510.68310.40520.65180.73000.75160.71840.72040.77410.90880.56400.9048
20210.43390.53730.24640.61710.71240.75230.63530.75640.60910.71420.38790.8158
20220.70790.76330.68300.68050.83450.90170.85070.75770.84830.84650.80290.8981
Table 3. SFA regression results (phase II).
VariantNumber of Employees Input Slack VariablesOperating Cost Input Slack VariablesFixed Asset Input Slack Variables
Constant term (math.)0.1392 × 10⁵ ***
(2250.5034)
−16.4422 ***
(−15.8777)
96.7367 ***
(53.9019)
Level of economic development−0.1935 × 10⁴ ***
(−28.6420)
2.5233 ***
(3.8880)
−7.5245 ***
(−2.8047)
Government support0.1810 × 104 ***
(44.5424)
−8.1900 ***
(−3.6784)
9.3941 **
(2.1783)
Degree of regional industrial agglomeration−0.2174 × 10⁴ ***
(−1109.4432)
13.0861 ***
(8.4986)
−20.6460 ***
(−5.3881)
σ 2 0.1811 × 10⁹ ***
(0.1811 × 10⁹)
0.6343 × 10⁴ ***
(0.6292 × 10⁴)
0.1411 × 10⁴ ***
(0.1107 × 10⁴)
γ 0.8174 ***
(34.5089)
0.2544 × 10⁻² **
(2.0700)
0.5880 ***
(10.6837)
LR101.7466 ***52.3148 ***42.4716 ***
Note: Standard errors in parentheses: *** indicates significance at the 1% level, ** indicates significance at the 5% level.
Table 4. Efficiency of China’s hydrogen energy chain (phase III).
YearCombined Technical EfficiencyPure Technical EfficiencyScale Efficiency
SynthesisUpper Reaches (of a River)The Middle Stretches (of a River)Lower Reaches (of a River)SynthesisUpper Reaches (of a River)The Middle Stretches (of a River)Lower Reaches (of a River)SynthesisUpper Reaches (of a River)The Middle Stretches (of a River)Lower Reaches (of a River)
20180.22630.26220.09960.44420.97500.99660.95410.97490.23210.26310.10430.4556
20190.23510.36150.07860.45760.94230.98150.93210.91470.24950.36830.08430.5003
20200.17790.22820.06560.37610.95990.97320.97390.93330.18530.23450.06740.4030
20210.18280.30970.05580.35340.96900.96710.97520.96460.18860.32020.05720.3664
20220.22690.35120.09310.35720.96610.97780.99210.92950.23490.35920.09380.3843
Disclaimer/Publisher’s Note: The statements, opinions and data contained in all publications are solely those of the individual author(s) and contributor(s) and not of MDPI and/or the editor(s). MDPI and/or the editor(s) disclaim responsibility for any injury to people or property resulting from any ideas, methods, instructions or products referred to in the content.

