
Dynamic Minimum Service Level of Demand–Responsive Transit: A Prospect Theory Approach


Abstract
:1. Introduction
2. Materials and Methods
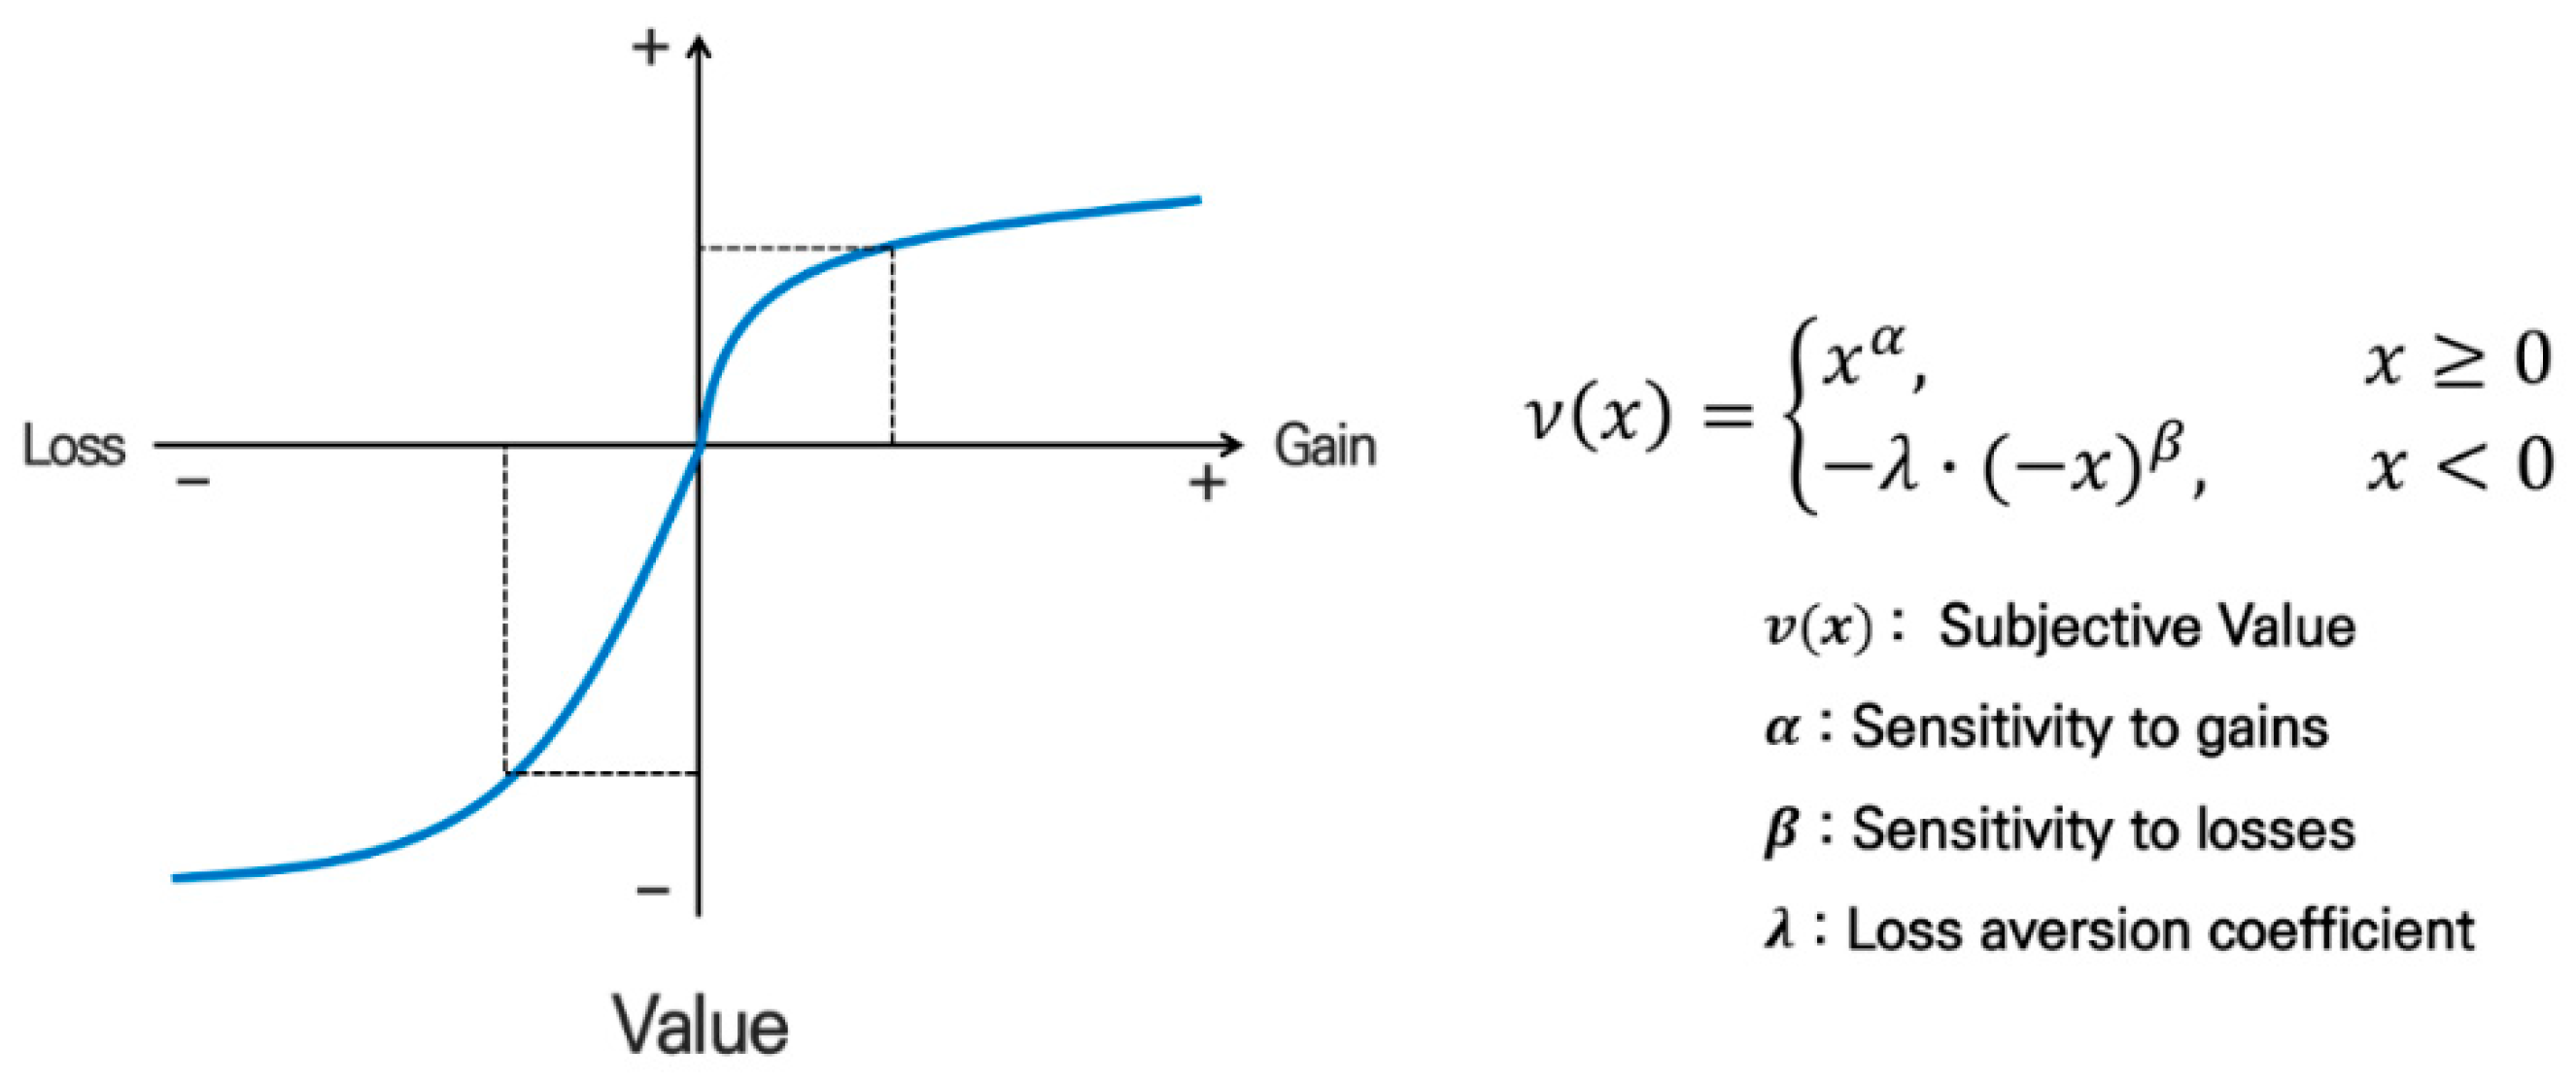
2.1. Prospect Theory
2.2. Research Procedure
2.3. Minimum Service Level Calculation Method
2.4. Methods of Examining Sensitivity and Loss Aversion
3. Results
3.1. Aggregated Results
3.2. Analysis Results by Group
3.2.1. Main Transportation Mode
3.2.2. Travel Purpose
3.2.3. Age
4. Discussion and Conclusions
Author Contributions
Funding
Institutional Review Board Statement
Informed Consent Statement
Data Availability Statement
Conflicts of Interest
References
- Kim, Y. Exploring New Directions in Public Transportation Policy. In KRIHS Policy Brief; KRIHS: Sejong City, Republic of Korea, 2008. [Google Scholar]
- Shen, S.; Ouyang, Y.; Ren, S.; Chen, M.; Zhao, L. Design and Implementation of Zone-to-Zone Demand Responsive Transportation Systems. Transp. Res. Rec. 2021, 2675, 275–287. [Google Scholar] [CrossRef]
- Kim, H.; Choi, J.; Cho, S.; Liu, F.; Jin, H.; Lim, S.; Kim, D.; Lee, J.; Joh, C.-H. Identifying Different Sources of the Benefit: Simulation of DRT Operation in the Heartland and Hinterland Regions. Sustainability 2022, 14, 16519. [Google Scholar] [CrossRef]
- Currie, G.; Fournier, N. Why Most DRT/Micro-Transits Fail—What the Survivors Tell Us about Progress. Res. Transp. Econ. 2020, 83, 100895. [Google Scholar] [CrossRef]
- Li, H.; Kim, S. Efficient Route Planning for Real-Time Demand-Responsive Transit. Comput. Mater. Contin. 2024, 79, 473–492. [Google Scholar] [CrossRef]
- Kim, S.-Y.; Kim, M.-H.; Gim, T.-H.T. Exploring the Spatio-Temporal Patterns of Demand Responsive Transport Ridership in Sejong City. J. Korea Plan. Assoc. 2024, 59, 93–103. [Google Scholar] [CrossRef]
- Cervero, R.; Beutler, J. Adaptive Transit: Enhancing Suburban Transit Services; IURD Monograph Series; University of California: Berkeley, CA, USA, 1999; Available online: https://escholarship.org/uc/item/10s0c7s0 (accessed on 22 January 2025).
- Bellini, C.; Dellepiane, G.; Quaglierini, C. The Demand Responsive Transport Services: Italian Approach. WIT Trans. Built Environ. 2003, 64, 10. [Google Scholar]
- Brand, C.; Rajé, F.; Preston, J.; Grieco, M. Transport and Access to Health Care: The Potential of New Information Technology; Final Report; Transport Studies Unit, University of Oxford: Oxford, UK, 2004. [Google Scholar]
- Giuffrida, N.; Le Pira, M.; Inturri, G.; Ignaccolo, M.; Calabrò, G.; Cuius, B.; D’Angelo, R.; Pluchino, A. On-Demand Flexible Transit in Fast-Growing Cities: The Case of Dubai. Sustainability 2020, 12, 4455. [Google Scholar] [CrossRef]
- Imhof, S.; Blättler, K. Assessing Spatial Characteristics to Predict DRT Demand in Rural Switzerland. Res. Transp. Econ. 2023, 99, 101301. [Google Scholar] [CrossRef]
- Sörensen, L.; Bossert, A.; Jokinen, J.-P.; Schlüter, J. How Much Flexibility Does Rural Public Transport Need?—Implications from a Fully Flexible DRT System. Transp. Policy 2021, 100, 5–20. [Google Scholar] [CrossRef]
- Korea Transport Institute (KOTI). Establishing Minimum Service Standards for Transportation Rights: Focus on Rural Buses and DRT; Korea Transport Institute: Sejong City, Republic of Korea, 2013; Available online: https://www.koti.re.kr/user/bbs/bassRsrchReprtView.do?bbs_no=523 (accessed on 22 January 2025).
- Transportation Research Board. Transit Capacity and Quality of Service Manual, 3rd ed.; Transportation Research Board; National Academies: Washington, DC, USA, 2013. [Google Scholar]
- Kim, G.; Jo, S.; Lee, S.; Lim, J.; Choi, S.; Lee, S.; Jung, W.; Park, S.; Jung, J.; Choi, I.; et al. Comprehensive Report on Public Transportation Survey 2023; Korea Transportation Safety Authority: Gimcheon, Republic of Korea, 2024. [Google Scholar]
- Shim, S.; Joung, J.; Oh, K.; Kim, M. A Study on Improving Minimum Level of Service for Public Transportation Using Altteul Transport Card Data. J. Korean ITS Soc. 2023, 22, 104–115. [Google Scholar] [CrossRef]
- Zahedi, S.; Koutsopoulos, H.N.; Ma, Z. Improving Demand Responsive Transit Services: Insights from the London Field Test. J. Public Transp. 2024, 26, 100107. [Google Scholar] [CrossRef]
- Mortazavi, A.; Ghasri, M.; Ray, T. Integrated Demand Responsive Transport in Low-Demand Areas: A Case Study of Canberra, Australia. Transp. Res. Part D Transp. Environ. 2024, 127, 104036. [Google Scholar] [CrossRef]
- Speranza, M.G.; Archetti, C.; Weyland, D. A Simulation Study of an On-Demand Transportation System. Int. Trans. Oper. Res. 2016, 25, 1137–1161. [Google Scholar] [CrossRef]
- Dytckov, S.; Persson, J.A.; Lorig, F.; Davidsson, P. Potential Benefits of Demand Responsive Transport in Rural Areas: A Simulation Study in Lolland, Denmark. Sustainability 2022, 14, 3252. [Google Scholar] [CrossRef]
- Ahn, K.; Kim, B.; Kim, S.; Lee, J. Utilization of Behavioral Economics in Policy Implementation; The Seoul Institute: Seoul, Republic of Korea, 2018. [Google Scholar]
- Geng, K.; Wang, Y.; Cherchi, E.; Guarda, P. Commuter Departure Time Choice Behavior under Congestion Charge: Analysis Based on Cumulative Prospect Theory. Transp. Res. Part A Policy Pract. 2023, 168, 103564. [Google Scholar] [CrossRef]
- Hu, L.; Dong, J.; Lin, Z. Modeling Charging Behavior of Battery Electric Vehicle Drivers: A Cumulative Prospect Theory Based Approach. Transp. Res. Part C Emerg. Technol. 2019, 102, 474–489. [Google Scholar] [CrossRef]
- Gao, K.; Sun, L.; Yang, Y.; Meng, F.; Qu, X. Cumulative Prospect Theory Coupled with Multi-Attribute Decision Making for Modeling Travel Behavior. Transp. Res. Part A Policy Pract. 2021, 148, 1–21. [Google Scholar] [CrossRef]
- Gao, S.; Frejinger, E.; Ben-Akiva, M. Adaptive Route Choices in Risky Traffic Networks: A Prospect Theory Approach. Transp. Res. Part C Emerg. Technol. 2010, 18, 727–740. [Google Scholar] [CrossRef]
- Zhang, C.; Liu, T.-L.; Huang, H.-J.; Chen, J. A Cumulative Prospect Theory Approach to Commuters’ Day-to-Day Route-Choice Modeling with Friends’ Travel Information. Transp. Res. Part C Emerg. Technol. 2018, 86, 527–548. [Google Scholar] [CrossRef]
- Ghader, S.; Darzi, A.; Zhang, L. Modeling Effects of Travel Time Reliability on Mode Choice Using Cumulative Prospect Theory. Transp. Res. Part C Emerg. Technol. 2019, 108, 245–254. [Google Scholar] [CrossRef]
- Yang, J.; Jiang, G. Development of an Enhanced Route Choice Model Based on Cumulative Prospect Theory. Transp. Res. Part C Emerg. Technol. 2014, 47 Pt2, 168–178. [Google Scholar] [CrossRef]
- Hong, S.; Park, S. Introducing Demand-Responsive Transit (DRT) Services in Seoul; The Seoul Institute: Seoul, Republic of Korea, 2024. [Google Scholar]
- Baier, M.J.; Sörensen, L.; Schlüter, J.C. How Successful Is My DRT System? A Review of Different Parameters to Consider When Developing Flexible Public Transport Systems. Transp. Policy 2024, 159, 130–142. [Google Scholar] [CrossRef]
- Yang, C.; Liu, B.; Zhao, L.; Xu, X. An Experimental Study on Cumulative Prospect Theory Learning Model of Travelers’ Dynamic Mode Choice under Uncertainty. Int. J. Transp. Sci. Technol. 2017, 6, 143–158. [Google Scholar] [CrossRef]
- Kahneman, D.; Tversky, A. Prospect Theory: An Analysis of Decision under Risk. Econometrica 1979, 47, 263–292. [Google Scholar] [CrossRef]
- Camerer, C.F. Prospect Theory in the Wild: Evidence from the Field; California Institute of Technology: Pasadena, CA, USA, 2017. [Google Scholar] [CrossRef]
- Walther, M.; Münster, M. Conditional Risk Premiums and the Value Function of Prospect Theory. J. Behav. Financ. 2020, 21, 74–83. [Google Scholar] [CrossRef]
- Mengov, G.; Georgiev, N.; Zinovieva, I.; Gerunov, A. Virtual Social Networking Increases the Individual’s Economic Predictability. J. Behav. Exp. Econ. 2022, 101, 101944. [Google Scholar] [CrossRef]
- Thaler, R. Toward a Positive Theory of Consumer Choice. J. Econ. Behav. Organ. 1980, 1, 39–60. [Google Scholar] [CrossRef]
- Kim, K.; Lee, Y.; Bae, S.; Hong, S. Fairness Perception and Applications of Prospect Theory. Korean J. Policy Anal. Eval. 2024, 34, 1–36. [Google Scholar] [CrossRef]
- Schwanen, T.; Ettema, D. Coping with Unreliable Transportation When Collecting Children: Examining Parents’ Behavior with Cumulative Prospect Theory. Transp. Res. Part A Policy Pract. 2009, 43, 511–525. [Google Scholar] [CrossRef]
- Guo, J.; Wang, Z.; Zhang, Z. Prospect Theory Driven-Minimum Cost Ordinal Consensus Model for Large-Scale Group Decision-Making. Inf. Sci. 2025, 698, 121794. [Google Scholar] [CrossRef]
- Liu, F.; Wang, S.-S.; Zhang, X.-Y. Building Consensus in Multi-Attribute Group Decision Making under a Prospect Theory-Driven Feedback Adjustment Mechanism. Inf. Sci. 2024, 654, 119829. [Google Scholar] [CrossRef]
- Guo, J.; Liang, X.; Wang, L. Online Reviews-Oriented Hotel Selection: A Large-Scale Group Decision-Making Method Based on the Expectations of Decision Makers. Appl. Intell. 2023, 53, 16347–16366. [Google Scholar] [CrossRef]
- Wang, L.; Wang, Y.-M.; Martínez, L. A Group Decision Method Based on Prospect Theory for Emergency Situations. Inf. Sci. 2017, 418–419, 119–135. [Google Scholar] [CrossRef]
- Wang, Y.; Zhan, J.; Zhang, C.; Xu, Z. A Group Consensus Model with Prospect Theory under Probabilistic Linguistic Term Sets. Inf. Sci. 2024, 653, 119800. [Google Scholar] [CrossRef]
- Zhou, Y.; Wang, P.; Zheng, S.; Zhao, M.; Lam, W.H.K.; Chen, A.; Sze, N.N.; Chen, Y. Modeling Dynamic Travel Mode Choices Using Cumulative Prospect Theory. Transp. Res. Part A Policy Pract. 2024, 179, 103938. [Google Scholar] [CrossRef]
- Werner, K.M.; Zank, H. A Revealed Reference Point for Prospect Theory. Econ. Theory 2019, 67, 731–773. [Google Scholar] [CrossRef]
- Ikeda, S.; Yamamura, E.; Tsutsui, Y. COVID-19 Enhanced Diminishing Sensitivity in Prospect-Theory Risk Preferences: A Panel Analysis. Rev. Behav. Econ. 2023, 10, 287–313. [Google Scholar] [CrossRef]
- Tversky, A.; Kahneman, D. Advances in Prospect Theory: Cumulative Representation of Uncertainty. J. Risk Uncertain. 1992, 5, 297–323. [Google Scholar] [CrossRef]


| Classification | MSL (Allowable Increase/Decrease (%)) | Assessment Metrics in Logistic Regression Analysis | ||
|---|---|---|---|---|
| Coefficient | ROC-AUC | |||
| Travel Cost | 0.39 | −0.057 | 0.88 | |
| In-vehicle Time | 0.40 | −0.050 | 0.88 | |
| Off-vehicle Time | 0.36 | −0.036 | 0.92 | |
| Classification | Gain Sensitivity | Loss Sensitivity | Loss Aversion Coefficient | Assessment Metrics of MLE | |
|---|---|---|---|---|---|
| Log-Likelihood | |||||
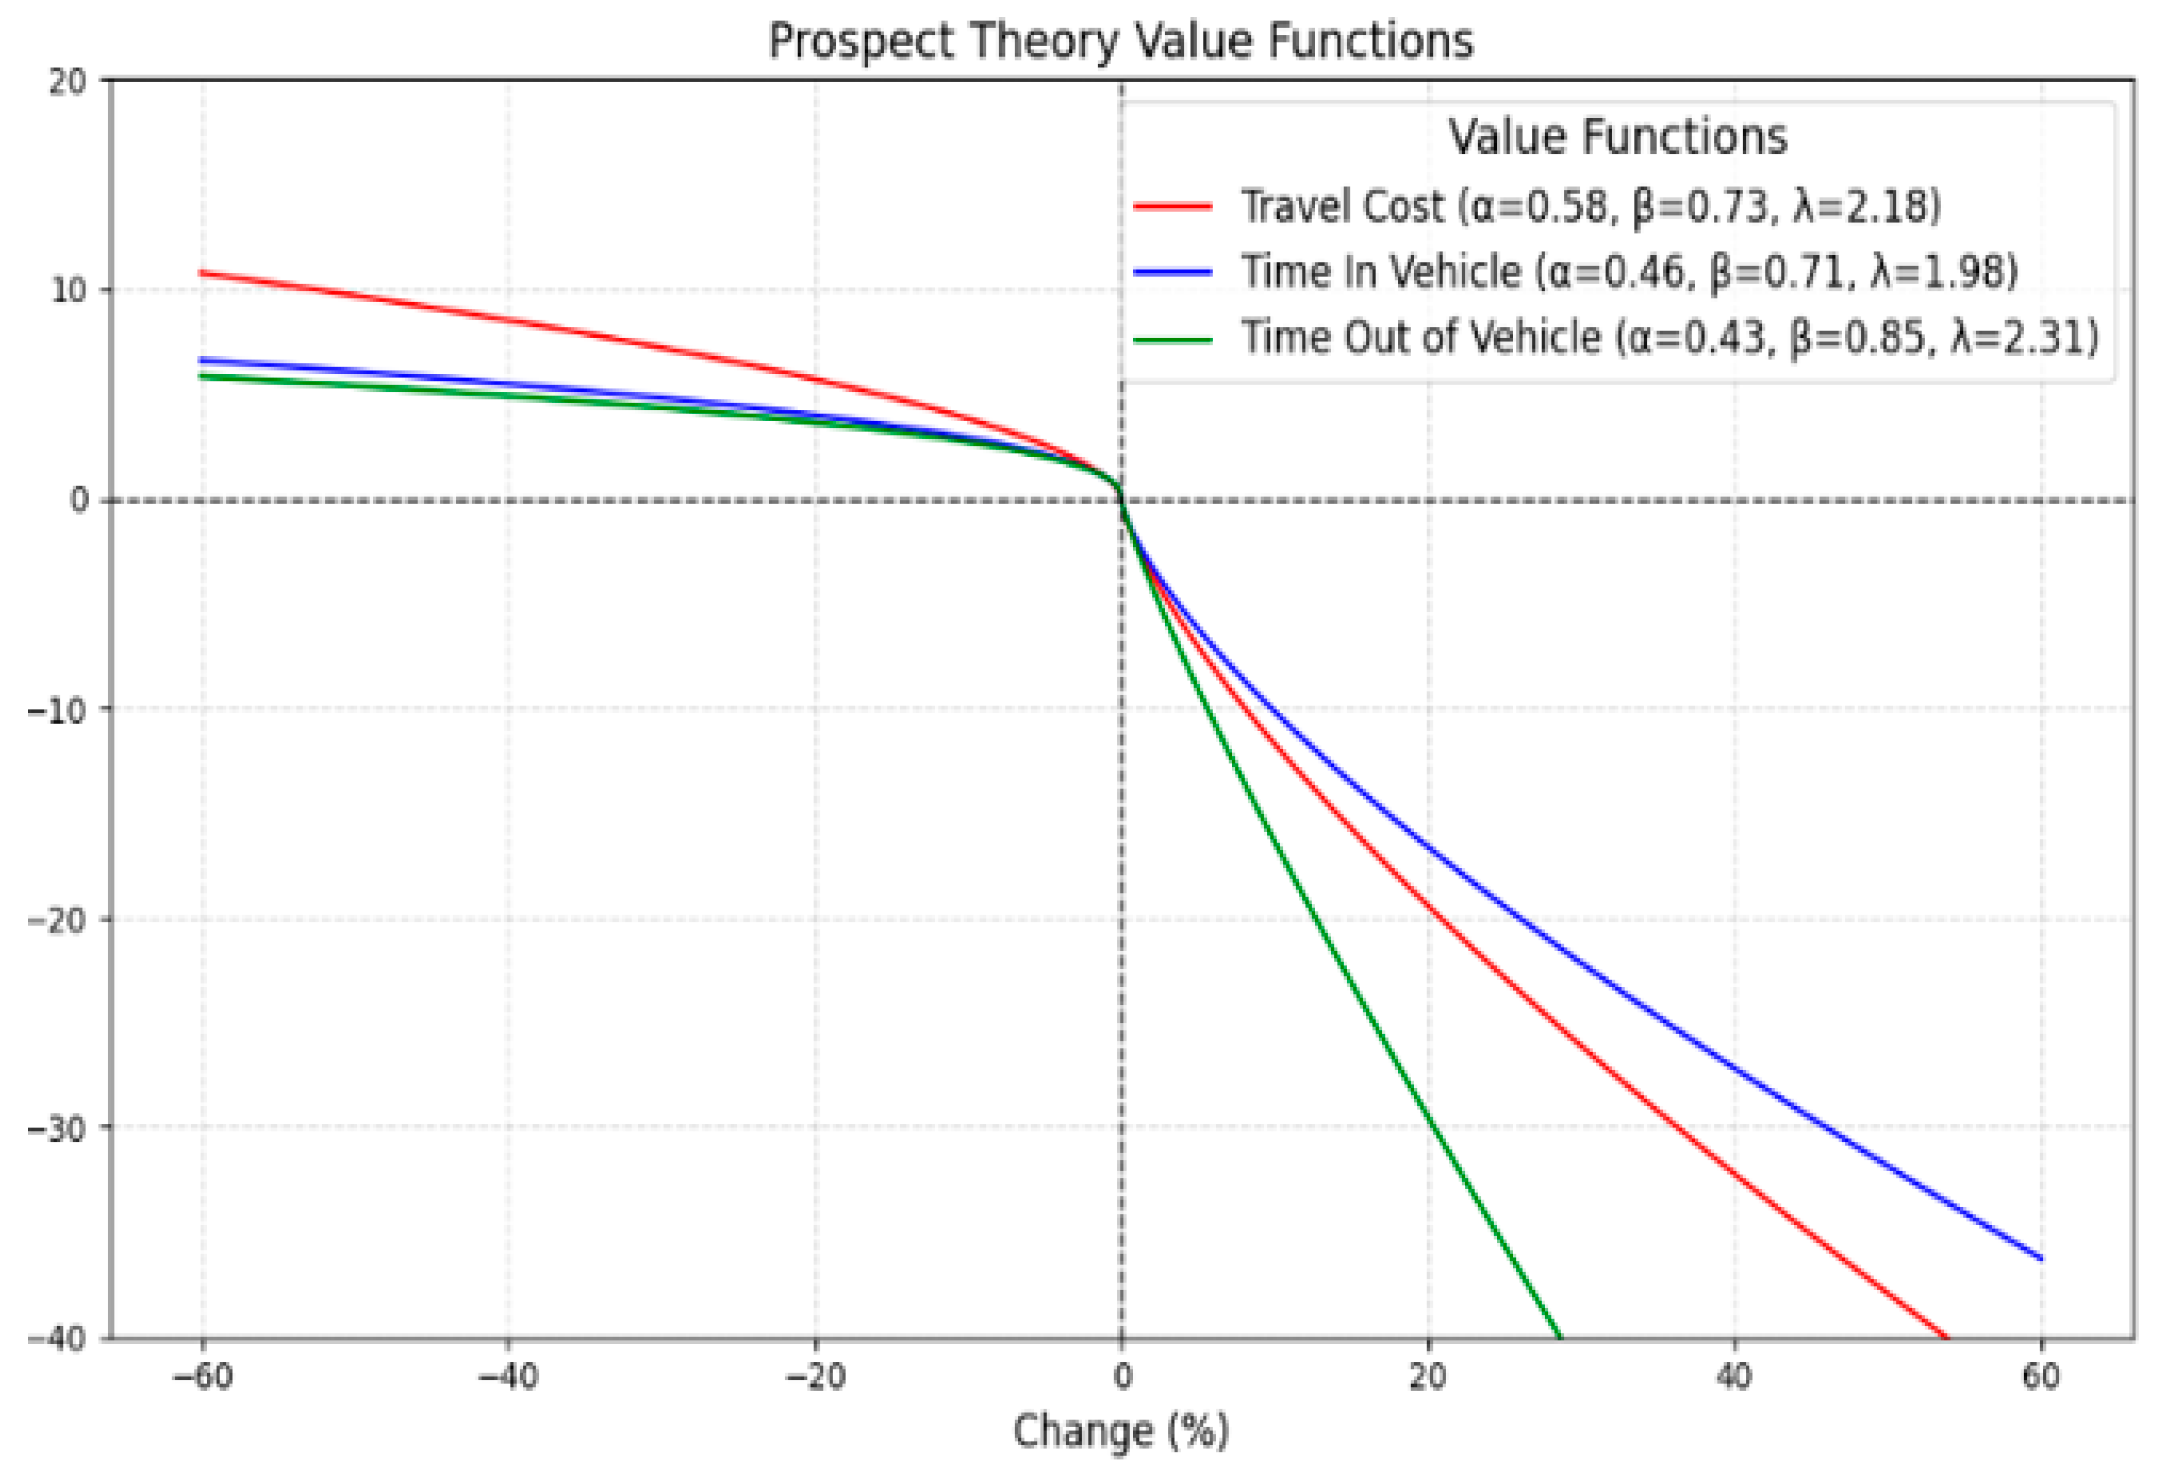
| Travel Cost | 0.58 | 0.73 | 2.18 | 0.40 | −701 |
| In-vehicle Time | 0.46 | 0.71 | 1.98 | 0.43 | −661 |
| Off-vehicle Time | 0.43 | 0.85 | 2.31 | 0.38 | −772 |
| Classification | MSL (%) | Assessment Metrics in Logistic Regression Analysis | |||
|---|---|---|---|---|---|
| Coefficient | ROC-AUC | ||||
| Private Vehicle | Travel Cost | 0.40 | −0.061 | 0.91 | |
| In-vehicle Time | 0.37 | −0.042 | 0.89 | ||
| Off-vehicle Time | 0.41 | −0.028 | 0.87 | ||
| Bus | Travel Cost | 0.35 | −0.058 | 0.89 | |
| In-vehicle Time | 0.40 | −0.051 | 0.83 | ||
| Off-vehicle Time | 0.39 | −0.033 | 0.90 | ||
| Subway | Travel Cost | 0.37 | −0.050 | 0.92 | |
| In-vehicle Time | 0.38 | −0.045 | 0.90 | ||
| Off-vehicle Time | 0.36 | −0.035 | 0.85 | ||
| DRT | Travel Cost | 0.36 | −0.056 | 0.90 | |
| In-vehicle Time | 0.40 | −0.049 | 0.87 | ||
| Off-vehicle Time | 0.37 | −0.042 | 0.84 | ||
| Classification | Private Vehicle | Bus | Subway | DRT | |
|---|---|---|---|---|---|
| Travel Cost | α (Gain Sensitivity) | 0.43 | 0.56 | 0.62 | 0.69 |
| (Loss Sensitivity) | 0.56 | 0.70 | 0.73 | 0.82 | |
| λ (Loss Aversion Coefficient) | 2.24 | 2.17 | 1.99 | 2.19 | |
| In-vehicle Time | α (Gain Sensitivity) | 0.42 | 0.48 | 0.57 | 0.52 |
| (Loss Sensitivity) | 0.61 | 0.68 | 0.82 | 0.79 | |
| λ (Loss Aversion Coefficient) | 2.28 | 1.83 | 2.07 | 2.06 | |
| Off-vehicle Time | α (Gain Sensitivity) | 0.44 | 0.62 | 0.53 | 0.47 |
| (Loss Sensitivity) | 0.63 | 0.89 | 0.79 | 0.65 | |
| λ (Loss Aversion Coefficient) | 2.39 | 2.31 | 1.98 | 1.75 | |
| Classification | MSL (%) | Assessment Metrics in Logistic Regression Analysis | |||
|---|---|---|---|---|---|
| Coefficient | ROC-AUC | ||||
| Work Commute | Travel Cost | 0.40 | −0.051 | 0.82 | |
| In-vehicle Time | 0.36 | −0.043 | 0.90 | ||
| Off-vehicle Time | 0.38 | −0.029 | 0.92 | ||
| Business | Travel Cost | 0.36 | −0.049 | 0.92 | |
| In-vehicle Time | 0.38 | −0.045 | 0.84 | ||
| Off-vehicle Time | 0.38 | −0.031 | 0.88 | ||
| School Commute | Travel Cost | 0.41 | −0.041 | 0.87 | |
| In-vehicle Time | 0.38 | −0.053 | 0.91 | ||
| Off-vehicle Time | 0.36 | −0.039 | 0.87 | ||
| Leisure and Shopping | Travel Cost | 0.36 | −0.053 | 0.93 | |
| In-vehicle Time | 0.36 | −0.057 | 0.90 | ||
| Off-vehicle Time | 0.40 | −0.045 | 0.83 | ||
| Classification | Work Commute | Business | School Commute | Leisure and Shopping | |
|---|---|---|---|---|---|
| Travel Cost | α (Gain Sensitivity) | 0.59 | 0.54 | 0.67 | 0.43 |
| (Loss Sensitivity) | 0.74 | 0.67 | 0.81 | 0.52 | |
| λ (Loss Aversion Coefficient) | 2.21 | 1.98 | 2.67 | 1.64 | |
| In-vehicle Time | α (Gain Sensitivity) | 0.49 | 0.47 | 0.42 | 0.37 |
| (Loss Sensitivity) | 0.78 | 0.69 | 0.56 | 0.49 | |
| λ (Loss Aversion Coefficient) | 2.14 | 2.01 | 1.57 | 1.34 | |
| Off-vehicle Time | α (Gain Sensitivity) | 0.46 | 0.46 | 0.41 | 0.31 |
| (Loss Sensitivity) | 0.87 | 0.81 | 0.73 | 0.58 | |
| λ (Loss Aversion Coefficient) | 2.39 | 2.28 | 1.96 | 1.56 | |
| Classification | MSL (%) | Assessment Metrics in Logistic Regression Analysis | |||
|---|---|---|---|---|---|
| Coefficient | ROC-AUC | ||||
| 20 y and Younger | Travel Cost | 0.40 | −0.046 | 0.84 | |
| In-vehicle Time | 0.41 | −0.058 | 0.84 | ||
| Off-vehicle Time | 0.37 | −0.043 | 0.83 | ||
| 30 y | Travel Cost | 0.38 | −0.057 | 0.86 | |
| In-vehicle Time | 0.39 | −0.049 | 0.82 | ||
| Off-vehicle Time | 0.36 | −0.038 | 0.85 | ||
| 40 y | Travel Cost | 0.38 | −0.058 | 0.87 | |
| In-vehicle Time | 0.38 | −0.048 | 0.87 | ||
| Off-vehicle Time | 0.36 | −0.037 | 0.86 | ||
| 50 y | Travel Cost | 0.38 | −0.061 | 0.89 | |
| In-vehicle Time | 0.36 | −0.046 | 0.87 | ||
| Off-vehicle Time | 0.40 | −0.037 | 0.89 | ||
| 60 y and Older | Travel Cost | 0.38 | −0.052 | 0.87 | |
| In-vehicle Time | 0.35 | −0.054 | 0.85 | ||
| Off-vehicle Time | 0.40 | −0.024 | 0.87 | ||
| Classification | 20 y and Younger | 30 y | 40 y | 50 y | 60 y and Older | |
|---|---|---|---|---|---|---|
| Travel Cost | α (Gain Sensitivity) | 0.62 | 0.60 | 0.54 | 0.41 | 0.54 |
| (Loss Sensitivity) | 0.81 | 0.72 | 0.70 | 0.66 | 0.74 | |
| λ (Loss Aversion Coefficient) | 2.37 | 2.09 | 1.98 | 1.92 | 2.21 | |
| In-vehicle Time | α (Gain Sensitivity) | 0.41 | 0.45 | 0.48 | 0.49 | 0.42 |
| (Loss Sensitivity) | 0.59 | 0.71 | 0.74 | 0.75 | 0.63 | |
| λ (Loss Aversion Coefficient) | 1.74 | 2.01 | 2.09 | 2.09 | 1.62 | |
| Off-vehicle Time | α (Gain Sensitivity) | 0.37 | 0.40 | 0.42 | 0.44 | 0.49 |
| (Loss Sensitivity) | 0.64 | 0.80 | 0.83 | 0.85 | 0.92 | |
| λ (Loss Aversion Coefficient) | 1.99 | 2.24 | 2.28 | 2.29 | 2.65 | |
Disclaimer/Publisher’s Note: The statements, opinions and data contained in all publications are solely those of the individual author(s) and contributor(s) and not of MDPI and/or the editor(s). MDPI and/or the editor(s) disclaim responsibility for any injury to people or property resulting from any ideas, methods, instructions or products referred to in the content. |
© 2025 by the authors. Licensee MDPI, Basel, Switzerland. This article is an open access article distributed under the terms and conditions of the Creative Commons Attribution (CC BY) license (https://creativecommons.org/licenses/by/4.0/).
Share and Cite
Jang, M.; Lee, S.; Kim, J.; Kim, J. Dynamic Minimum Service Level of Demand–Responsive Transit: A Prospect Theory Approach. Sustainability 2025, 17, 3171. https://doi.org/10.3390/su17073171
Jang M, Lee S, Kim J, Kim J. Dynamic Minimum Service Level of Demand–Responsive Transit: A Prospect Theory Approach. Sustainability. 2025; 17(7):3171. https://doi.org/10.3390/su17073171
Chicago/Turabian StyleJang, Myeonggeun, Sunghee Lee, Jihwan Kim, and Jooyoung Kim. 2025. "Dynamic Minimum Service Level of Demand–Responsive Transit: A Prospect Theory Approach" Sustainability 17, no. 7: 3171. https://doi.org/10.3390/su17073171
APA StyleJang, M., Lee, S., Kim, J., & Kim, J. (2025). Dynamic Minimum Service Level of Demand–Responsive Transit: A Prospect Theory Approach. Sustainability, 17(7), 3171. https://doi.org/10.3390/su17073171