Abstract
China’s rapidly aging population has intensified demand for long-term services and supports (LTSSs), yet geographic disparities in accessibility persist despite policy reforms like long-term care insurance (LTCI). This study evaluates spatial inequities in Chengdu, a megacity piloting LTCI, using an enhanced two-step floating catchment area (2SFCA) method with demand intensity coefficients and a spatial mismatch index (SMI). Results reveal critically low average accessibility: 0.126 LTSS beds and 0.019 formal caregivers per thousand recipients within a 60 min travel threshold. Accessibility declines sharply along urbanization gradients, with urban cores (“first loop”) exceeding suburban “second” and “third loop” by ratios of 1.5–2.1 and 2.0–8.0, respectively. Strong correlations with impervious surface ratios (R2 = 0.513–0.643) highlight systemic urban bias in resource allocation. The SMI analysis uncovers divergent spatial mismatches: home care accessibility predominates in western suburbs due to decentralized small-scale providers, while institutional care clusters in eastern suburbs, reflecting government prioritization of facility-based services. Despite LTCI’s broad coverage (67% of Chengdu’s population), rural and peri-urban older adults face compounded barriers, including sparse LTSS facilities, inadequate transportation infrastructure, and reimbursement policies favoring urban institutional care. To address these inequities, this study proposes a multi-stakeholder framework: (1) strategic expansion of LTSS facilities in underserved suburban zones, prioritizing institutional care in the “third loop”; (2) road network optimization to reduce travel barriers in mountainous regions; (3) financial incentives (e.g., subsidies, tax breaks) to attract formal caregivers to suburban areas; (4) cross-regional LTCI coverage to enable access to adjacent district facilities; and (5) integration of informal caregivers into reimbursement systems through training and telehealth support. These interventions aim to reconcile spatial mismatches, align resource distribution with Chengdu’s urban–rural integration goals, and provide scalable insights for aging megacities in developing contexts. By bridging geospatial analytics with policy design, this study underscores the imperative of data-driven governance to ensure equitable aging-in-place for vulnerable populations.
1. Introduction
1.1. Research Problem Statement
The rapid aging of the population and the rising prevalence of disabilities in China have intensified the demand–supply imbalance in long-term services and supports (LTSSs) [1]. Despite the 2016 nationwide pilot of long-term care insurance (LTCI) aimed at addressing these challenges, significant geographical disparities in spatial accessibility persist, particularly between urban and rural areas. Chengdu, a megacity in western China with a rapidly aging population and a pioneer in urban–rural integration policies, serves as a critical case study. This research addresses the following questions: How can spatial accessibility to LTSS be quantitatively evaluated in Chengdu? What are the disparities in accessibility between urban and suburban areas, and how do socioeconomic factors exacerbate these inequalities? What policy interventions can mitigate geographical barriers to equitable LTSS access?
1.2. Long-Term Services and Supports and Long-Term Care Insurance in Chengdu, China
In 2016, China launched an LTCI program in fifteen cities to address the needs of the aging population, focusing on providing essential services and financial support to older adults with disabilities [2]. The LTCI detailed the pilot scope, participant eligibility, financing mechanisms, benefit package, service provisions, management, supervision, and policy integration with the existing social healthcare system, thereby laying the foundational framework for the ongoing development and refinement of China’s LTSS policies [3]. Despite significant progress, it was still necessary to promote equality and efficiency in the equalized delivery of public services and to more effectively allocate resources at minimal cost [4].
Chengdu is the provincial capital of Sichuan Province and the most populous municipality in southwest China. It was assigned as one of two pioneer cities in this country in coordinating urban–rural development. Since 2007, efforts were made to remove the urban–rural disparity by establishing an integrated social system. Integration involved reforms in social insurance and public health [5].
As one of the 15 pilot cities, Chengdu designed its long-term care insurance policies. The Chengdu Healthcare Security Administration (CDHSA), the authority supervising the social healthcare system, implemented LTCI in consecutive phases for urban and rural residents [6,7]. The insurance is funded mainly by the social healthcare fund, participants’ contributions of their personal social healthcare accounts, and limited government subsidies. The insurance subsidizes the following three types of LTSS: (1) residential care at designated hospitals or nursing institutions; (2) informal home care provided by family members or other informal caregivers; and (3) home-visit care provided by skilled caregivers from authorized institutions [7,8]. By the end of 2021, Chengdu’s LTCI had 13,966,600 participants, ~67% of the city’s total residents, according to the 2020 census. There were seven commercial insurance companies who joined the operation of the insurance, providing services to 34,691 LTSS recipients and 194 hospitals and nursing institutions in 2022 [9].
1.3. Literature Review
1.3.1. Global Perspectives on Long-Term Services and Supports and Spatial Accessibility
Global aging has spurred extensive research on the equity and efficiency of the LTSS sector, with spatial accessibility emerging as a critical metric to evaluate service provision [10]. Spatial accessibility is widely used as an efficient method for measuring opportunities to access services as well as their geographic disparities because it emphasizes the importance of geographic barriers, distance, and time between consumers and providers [11]. In the U.S., studies highlight how rural–urban divides and transportation infrastructure gaps limit access to care, particularly for low-income and minority populations [12,13]. Similarly, in Japan, rapid aging has intensified debates on optimizing LTSS facility distribution [14]. In developing regions, challenges are compounded by fragmented healthcare systems and uneven resource allocation. For instance, Guagliardo emphasized the role of geographic barriers in perpetuating healthcare inequities in sub-Saharan Africa [15], while Wang demonstrated how road network upgrades in rural China improved spatial accessibility to primary care [15].
Various methods have been developed to measure spatial accessibility in healthcare, such as Lorenz curves [16], Gini coefficients [17], hotspot analysis [13], dynamic convergence models [18,19], and floating catchment area methods [20]. The two-step floating catchment area (2SFCA) method, initially developed to balance supply (e.g., healthcare facilities) and demand (e.g., aging populations), has been widely adopted in high-income countries to analyze disparities in access healthcare [21].
Recent methodological advancements have expanded the 2SFCA framework. Tao integrated hierarchical healthcare systems into the model to account for tiered service structures in Shenzhen, China, revealing significant disparities in access to healthcare [22]. Chen further refined the method by incorporating real-time traffic data, highlighting transportation infrastructure as a key determinant of accessibility in low- and middle-income countries [23]. Liu enhanced the 2SFCA method by incorporating population aging gradients, revealing pronounced accessibility gaps for older adults in Xi’an’s peri-urban areas [24]. However, critiques persist regarding the oversimplification of travel behaviors in traditional 2SFCA models, prompting innovations such as variable catchment radius and hybrid decay functions [25,26,27].
The integration of socioeconomic factors into accessibility models has gained traction. Radke and Mu pioneered demand-intensity coefficients to reflect income-driven utilization patterns [11], an approach later adapted in Beijing to evaluate elder care disparities [28]. Similarly, the spatial mismatch index (SMI), originally applied to housing and labor markets [29,30], has been repurposed to analyze incongruities between LTSS supply and demand. Li employed SMI to assess grain production mismatches in China, demonstrating its versatility in resource allocation studies [31].
1.3.2. Long-Term Services and Supports Reforms and Regional Disparities in China
China’s 2016 LTCI pilot marked a pivotal shift toward institutionalizing elder care. The insurance’s three service types—residential care, informal home care, and home-visit formal care—aimed to address diverse needs. However, systemic shortcomings persist. Research has shown imbalanced growth in home and community-based care institutions for older adults [32]. Long-term care workforce shortages, weak quality assurance, and unequal distribution of long-term care services in developing countries have become concerns for researchers and policymakers [1,33]. Geographical barriers to healthcare services have been identified as a significant cause of inequality in health outcomes [34]; for instance, caregivers in rural areas experience more substantial burdens in providing services than urban caregivers [35]. Xie criticized the slow growth of community-based care and workforce shortages, particularly in western provinces [36]. Regional analyses underscore stark imbalances: eastern cities like Shanghai and Beijing benefit from advanced LTSS infrastructure [37], while western regions lag due to fiscal constraints and sparse facility distribution.
The “Chengdu Model” of urban–rural integration, initiated in 2007, sought to equalize public services through infrastructure development and social insurance reforms [38]. While this model improved rural healthcare coverage, there are persistent inefficiencies in resource allocation, particularly for LTSS. In Chengdu, the proportions of underserved areas and populations for multilevel healthcare accessibility were 42% and 12%, respectively [39]. Recent studies in Sichuan province further highlight the role of road networks in narrowing spatial inequities [17], yet few have specifically examined LTSS accessibility in Chengdu, leaving a critical gap in understanding localized challenges. The spatial distribution of all service facilities, not limited to healthcare, is significantly polarized, as they are concentrated in the highly urbanized old city center of Chengdu [40]. For example, Zhang identified a 40% disparity in healthcare accessibility between urban and rural areas in Chengdu, attributing this to centralized resource allocation in city centers [41]. Although a few studies have focused on the long-term care services in Chengdu, it remains important to better understand the current imbalance between demand and supply.
1.3.3. Gaps and Justification for Chengdu-Specific Research
Despite methodological progress, the following three gaps persist in the literature:
- Geographic Bias: Most studies focus on developed eastern cities in China or developed nations, neglecting developing western megacities like Chengdu, where urbanization and aging intersect uniquely [1,3].
- Data Limitations: Reliance on coarse administrative data obscures micro-level variations. Official datasets, such as those from the Chengdu Healthcare Security Administration (CDHSA), remain underutilized in spatial analyses [42,43].
- Policy Implementation Disconnect: While the “Chengdu Model” is lauded for urban–rural integration, its impact on LTSS accessibility remains unexplored, particularly for home-visit care [38].
1.4. Innovations and Contributions
This study addresses these gaps by leveraging high-resolution government data, applying an enhanced 2SFCA-SMI framework, and providing the first comprehensive analysis of LTSS spatial accessibility in Chengdu. It aims to apply a novel spatial accessibility analysis to examine the geographic barriers to accessing LTSS in a large urbanizing area in western China.
- Representativeness of Chengdu as a Case Study
Chengdu’s dual role as a pioneer in urban–rural integration and a rapidly aging megacity (with 13.97 million LTCI enrollees by 2021) offers unique insights into spatial equity challenges. Its policies, such as equalized social insurance reforms, mirror national strategies, making findings scalable to other Chinese cities.
- First Comprehensive Spatial Accessibility Analysis of LTSS in Chengdu
This study pioneers the application of an enhanced two-step floating catchment area (2SFCA) method—integrated with a demand intensity coefficient and spatial mismatch index (SMI) to evaluate LTSS accessibility. Unlike prior studies focusing on institutional care alone, we differentiate between residential care provided by institutions and home-visit care by formal caregivers analyzing how travel distances for caregivers, and LTSS recipients shape disparities.
- Reliable Government-Sourced Data
Utilizing official datasets from the Chengdu Healthcare Security Administration (CDHSA), including insured population and LTSS recipient statistics, accredited institution directories, and census reports, ensures methodological rigor.
By doing so, it contributes to global debates on equitable aging policies while offering actionable insights for similar developing megacities. The findings offer valuable insights for policymakers aiming to improve the spatial accessibility of LTSS and ensure equitable access for all residents, regardless of their geographical location.
2. Materials and Methods
2.1. The Generalized 2SFCA Framework
The 2SFCA method is a spatial accessibility measurement conducted in two steps. In the first step, all demand nodes(locations where there is a need for care services) that fell within the catchment areas of each facility were identified and examined. Then, it calculates the supply-to-demand ratio for each facility and determines the average supply available to potential service users. The second step combines the supply-to-demand ratios from all facilities located within the catchment area of each demand node. Overall, these ratios became the spatial accessibility scores for each demand node [44].
The original version of the 2SFCA utilized a binary-distance decay function. This assumes that individuals within catchment areas have equal accessibility, whereas those outside have no accessibility. The generalized framework of the 2SFCA is as written in the following Equation (1):
where is the accessibility at demand node i, is the supply capacity at location j, Pk is the demand, () is the distance or travel time between i/k and j, and f is the general distance/travel time decay function.
The distance decay function f can be expressed in different forms such as the dichotomous form used in the traditional 2SFCA [26], continuous forms such as the Gaussian form [45], or the kernel density form [28]. This study used a Gaussian function to measure the distance-decay effect because it has fewer parameters, thus reducing subjectivity and uncertainty when applying the method. The Gaussian form of the distance decay function f can be represented as Equation (2), written as follows:
where d0 is the catchment area (threshold travel/time distance).
2.2. 2SFCA Model with Demand Intensity
Healthcare utilization is affected by demographic and socioeconomic resources, and demand intensity has been introduced to explore the impact of socioeconomic factors on LTSS [28]. In this study, we focused on the intensity of demand for facilities and their potential impact on future facility layouts. We believe that demand intensity depends on per capita income (measured by the per capita disposable income of urban residents), as it can influence the capacity to finance, thereby affecting the propensity of individuals to engage in LTSS. Thus, the coefficient of demand intensity is introduced into the model, and the equation of the 2SFCA model is modified as shown in the following Equation (3):
To account for income differences across districts, we calculate the demand intensity coefficient for district j as the ratio of the per capita disposable income of urban residents in each district to the overall per capita disposable income of urban residents in Chengdu (see Table 1). This ensures that the coefficient reflects relative income levels while maintaining comparability across regions.

Table 1.
Summary of indices of the research areas.
2.3. Spatial Mismatch Index
The spatial mismatch index (SMI) was introduced to reveal the phenomenon of spatial distribution matching among interconnected elements and has been widely applied in different research areas [29,30,31]. Given the regional disparities in the development of LTSS within the research area, home and institutional care exhibit spatial and nonsynchronous coupling. Consequently, the quantitative analysis of SMI is beneficial for further exploration. The SMI model is calculated as Equation (4):
where ei is the collective home care accessibility at node (town/street in the city and village in the rural area) i, Ei is the sum of the home-based accessibility of the whole city of Chengdu, pi is the collective home care accessibility at node i, and Pi is the sum of the institutional care accessibility of the entire city of Chengdu.
3. Case Study in Chengdu
3.1. Definition of Study Types
The research population of this study consists of an LTCI-insured population in Chengdu, as well as accredited institutions providing LTSS. As the coverage of LTCI in Chengdu is almost identical to that of the social healthcare system, exceeding 70% of the total residents, the findings of this study partially reveal the spatial supply of LTSS in the entire Chengdu metropolitan area. According to the National Institute of Aging (NIA), LTSS can be categorized into the following types: home-based care provided at home either by informal caregivers such as family members or paid formal caregivers such as skilled nurses; community and residential care, which is provided in a person’s community, such as a daycare center, or in a residential facility, such as a nursing home. In China, the latter is also often referred to as institutional care. As mentioned above, three types of care services are supported by LTCI, and only types 1 and 3 are affected by spatial accessibility to institutional LTSS facilities. Therefore, two spatial accessibility scores were measured using the 2SFCA method. For Type 1 (institutional care), accessibility scores describe the distance between older adults’ homes and LTSS institutions. For Type 3 (home-visit care), accessibility scores describe the distance for a formal caregiver to commute between older adults’ homes and workplaces. The visualization of spatial accessibility scores reflects the refined planning and allocation of LTSS institutions. An additional coefficient of demand intensity is incorporated into the model to explore the potential pattern, and a spatial mismatch index (SMI) has also been examined to reveal the interrelationship between the spatial accessibilities of home care and institutional care. In this research, the term “home care” refers exclusively to the type of “home-visit care” and does not include informal care.
3.2. Study Area and Data Sources
As the largest and developing municipality in southwestern China, Chengdu has a higher proportion of older adults (≥65 years) compared to the national average, at 13.62%. Additionally, the life expectancy in Chengdu has reached 81.52 years, which is an increase of 0.51 years from the 2019 estimate [46]. Following its urban planning and urbanization (Chengdu Municipal Land Space General Plan, 2021–2035), the city has been categorized into a “three-loops” functional area setting. The “first loop” mainly includes the core urban areas of Chengdu, which are characterized by concentrated urban resources, better economic development, and convenient transportation. The “second loop” refers to the areas surrounding the central urban district, which are key development zones of the city and have certain development potential. The “third loop” mainly covers the suburbs and county-level cities around Chengdu, which are important components of Chengdu’s urban functions. Table 1 shows the main socioeconomic indices for all 20 districts, county-level cities, and counties.
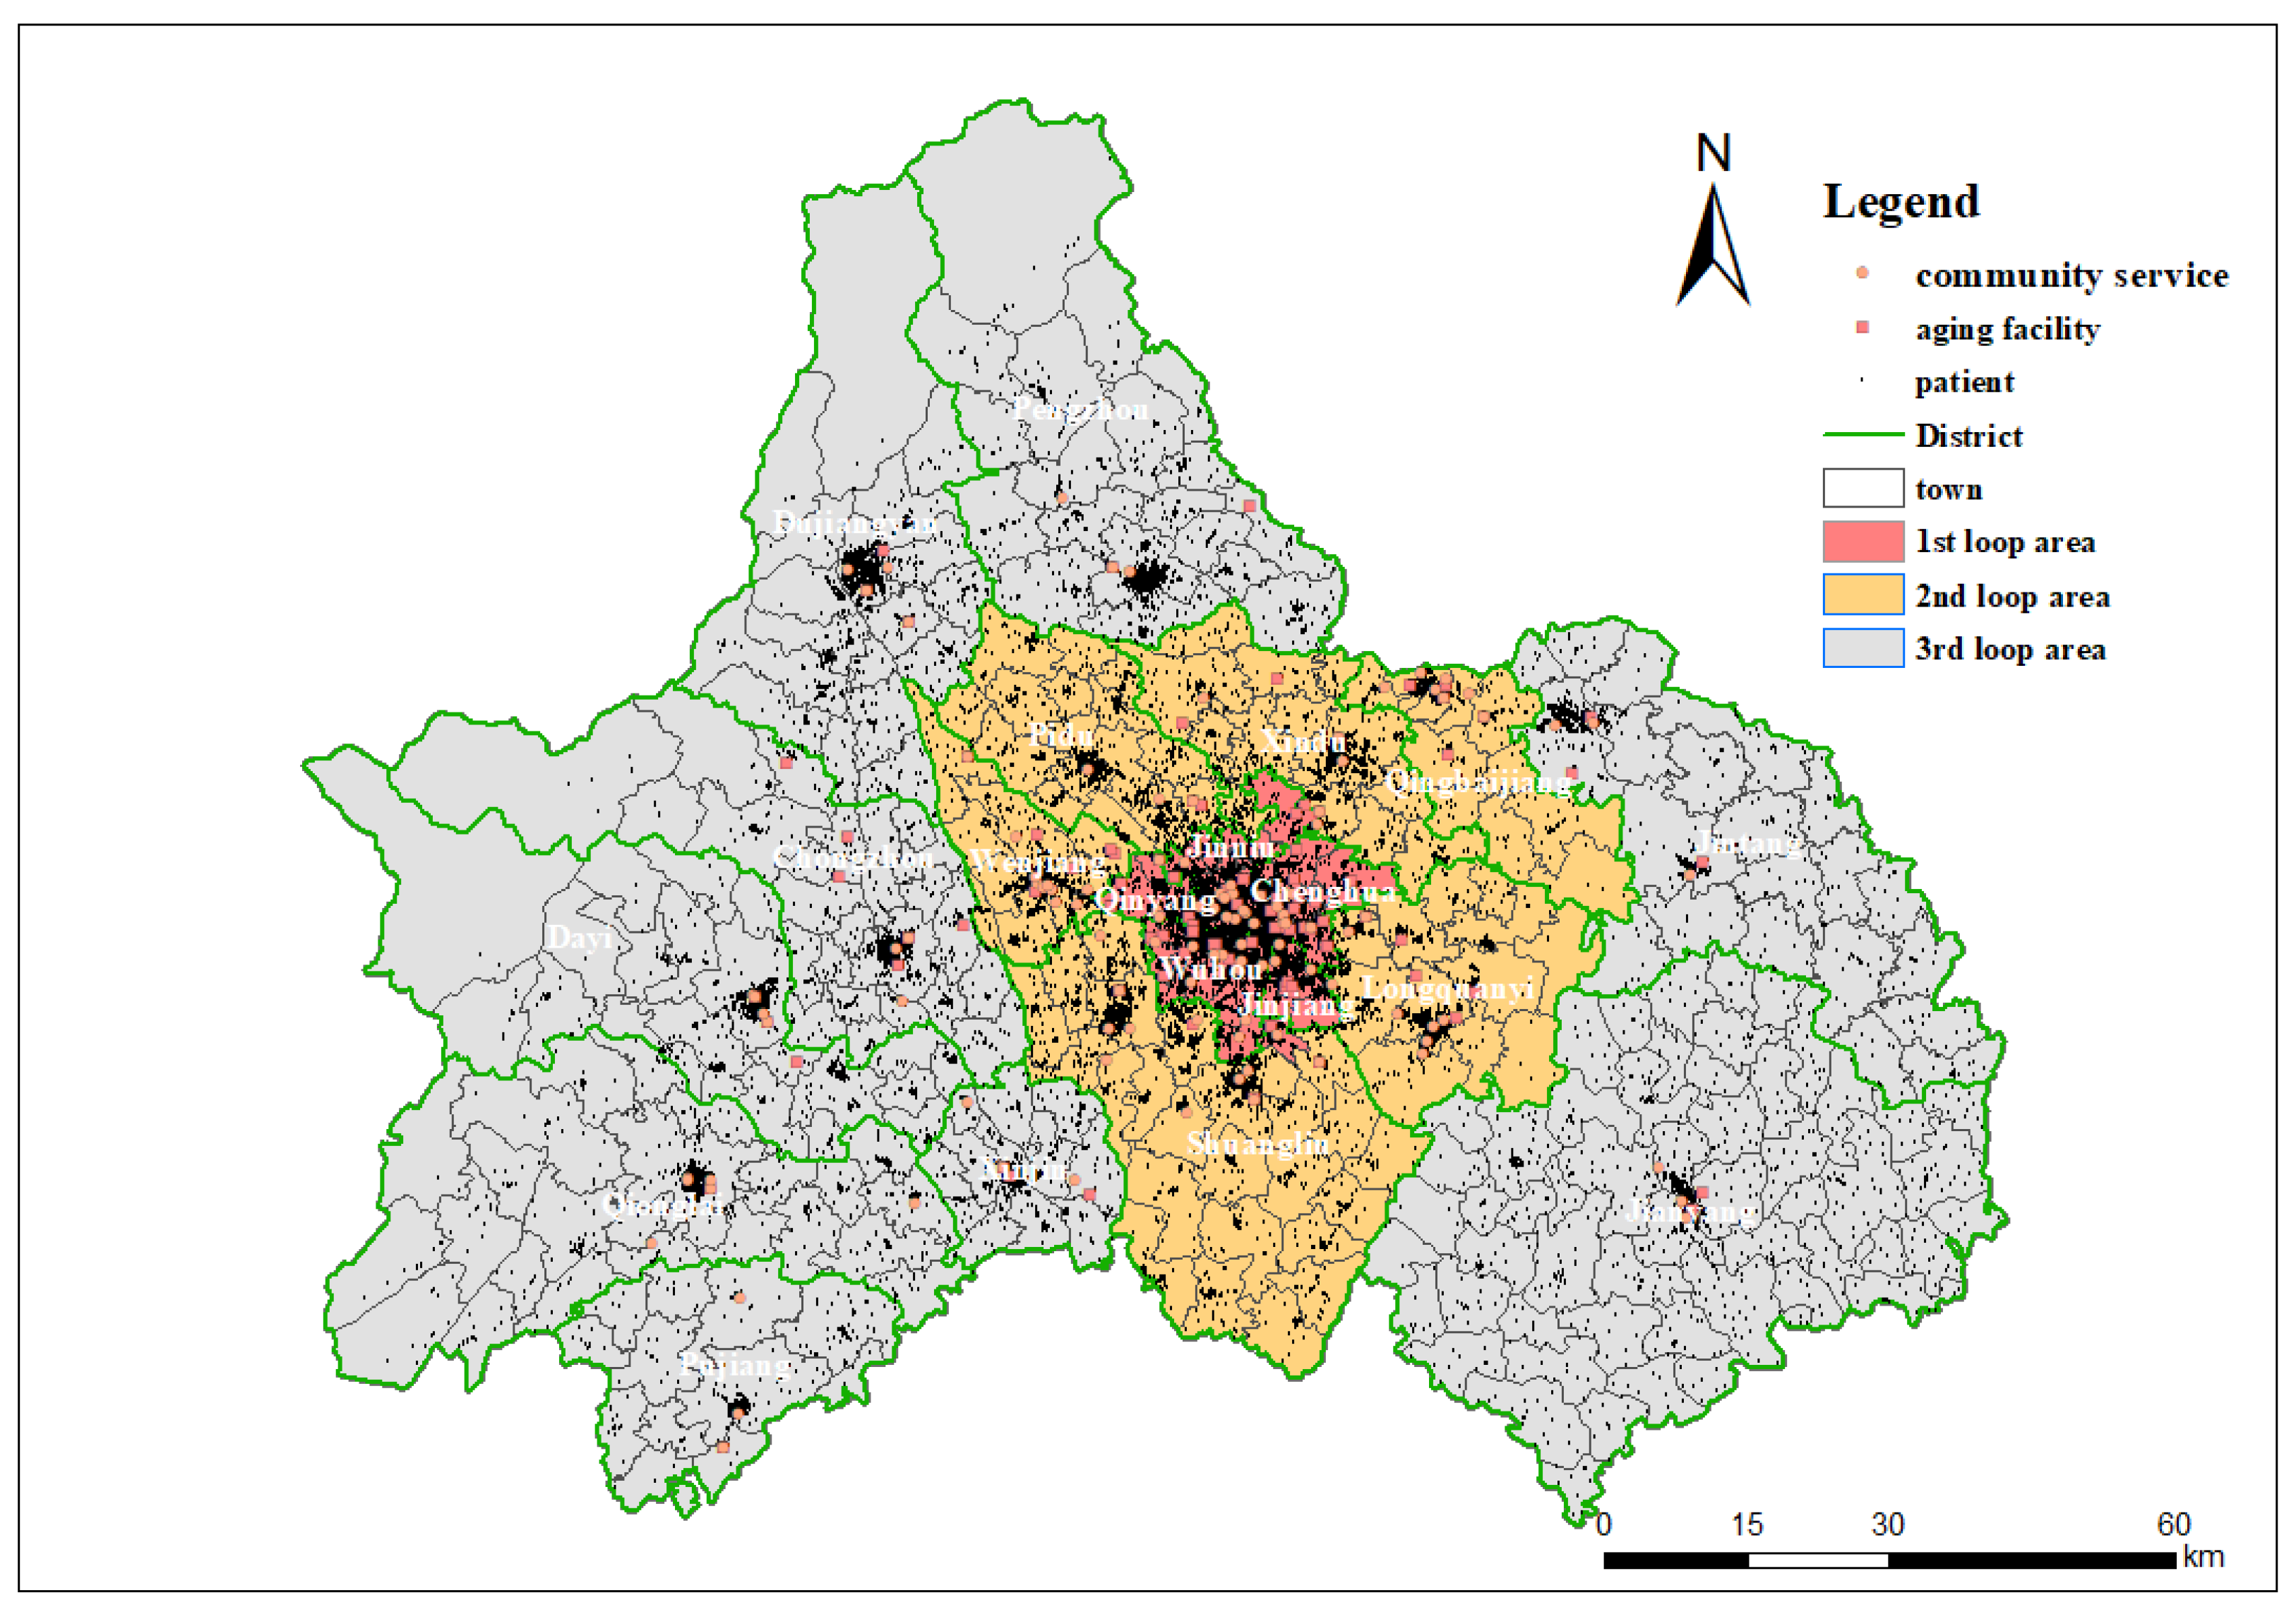
Overall, 55,645 LTSS recipients and 194 facilities were included in this study. Among all 55,645 recipients, only 34,691 were reimbursed by LTCI, and 20,954 had not yet been reimbursed by the end of 2021. Among the 194 facilities, 105 provide residential care, and 114 provide home care, with 25 institutions offering both types of services. They collectively provide 11,567 LTSS beds and 1,581 formal caregivers. The addresses of LTSS recipients and facilities were collected from the CDHSA database (restricted to the community level for privacy protection) by the end of 2021. We have re-verified the accuracy of the addresses through Baidu Map. A total of 350 recipients were excluded because of unidentified addresses, and three facilities were excluded because they were marked “inactive to provide services” by the map service. These addresses were converted into points of interest (POIs) using Amap’s Web API service and mapped using ArcGIS 10.2. Figure 1 illustrates the spatial distribution of functional areas (three-loops) and POIs in Chengdu.

Figure 1.
Functional areas of Chengdu and distribution of points of interest (POIs).
3.3. Estimating Travel Time
The estimation of travel time from LTSS recipients to providers or facilities significantly affects spatial accessibility, as the demand and supply for LTSS tend to be stable for a specific period. Some studies have considered the impact of different modes of transportation on travel time and incorporated them into models [11,28,47]. This study focuses on LTSS recipients supported by LTCI, mainly those who are eligible to obtain services with claimed reimbursements in Chengdu. Under the LTCI policy, the recipients must meet at least two criteria for disability, which means that they may have difficulty using public transportation independently. Based on a survey conducted by the CDHSA, the formal caregivers tended to use private transportation, such as cars or motorbikes, to shorten commute time. Therefore, this study does not differentiate between modes of transportation and considers travel time between POIs by private cars as the standard measure.
The travel time was calculated by setting the road-driving speed at the road level for every road within the network (see Appendix A, Table A1). The minimum travel time from a recipient to a specific facility was selected using a routing strategy with the OD matrix tool in the Network Analysis toolbox of ArcGIS [47]. In this study, the road network of Chengdu was retrieved from the Open Street Map (OSM) road network and was converted into approximately 170,000 independent roads (see Appendix A, Figure A1). We did not use online map services to introduce real-world user data estimating the travel time for a similar consideration because LTSS recipients do not have to travel during peak hours, and there is little traffic on most roads (level below secondary) [48].
The travel time threshold defines the catchment area size in the 2SFCA model. Within a particular recipient’s radius (travel time or distance), the number of LTSS facilities included is the primary supply and then decayed by a predetermined function. Hence, the catchment area size is a critical parameter in spatial accessibility analyses using the 2SFCA method. Studies have used different methods to determine appropriate travel time thresholds. For instance, it ranks all the time until a cutoff point/s and then runs a sensitivity analysis to test different threshold travel times around the baseline, estimates the cutoff by survey, and uses the average travel time [24,49].
In this study, 60 min was selected as the travel time threshold. There were two reasons for this decision. First, Chengdu’s Twelfth Five-Year Plan for Healthcare announced the campaign to establish “60-min access to healthcare”, and the 60 min accessibility was accepted as a threshold for all healthcare services, including LTSS [50]. Second, the CDHSA conducted two waves of satisfaction surveys on the LTSS recipients and their families in 2020 and 2021. Most recipients and families agreed that a 60 min travel time was comfortably acceptable for accessing LTSS [51]. We have quantified the travel duration for recipients to access the nearest LTSS facilities as a metric to evaluate the coverage associated with the specified threshold (refer to Appendix A, Figure A2). Our analysis demonstrates that a 60 min catchment area encompasses most of the study participants. Furthermore, we conducted a sensitivity analysis utilizing 54 min and 66 min thresholds as alternative parameters and determined that these variations do not significantly alter the overarching conclusions of this study.
4. Results
4.1. Spatial Accessibility and Urbanization
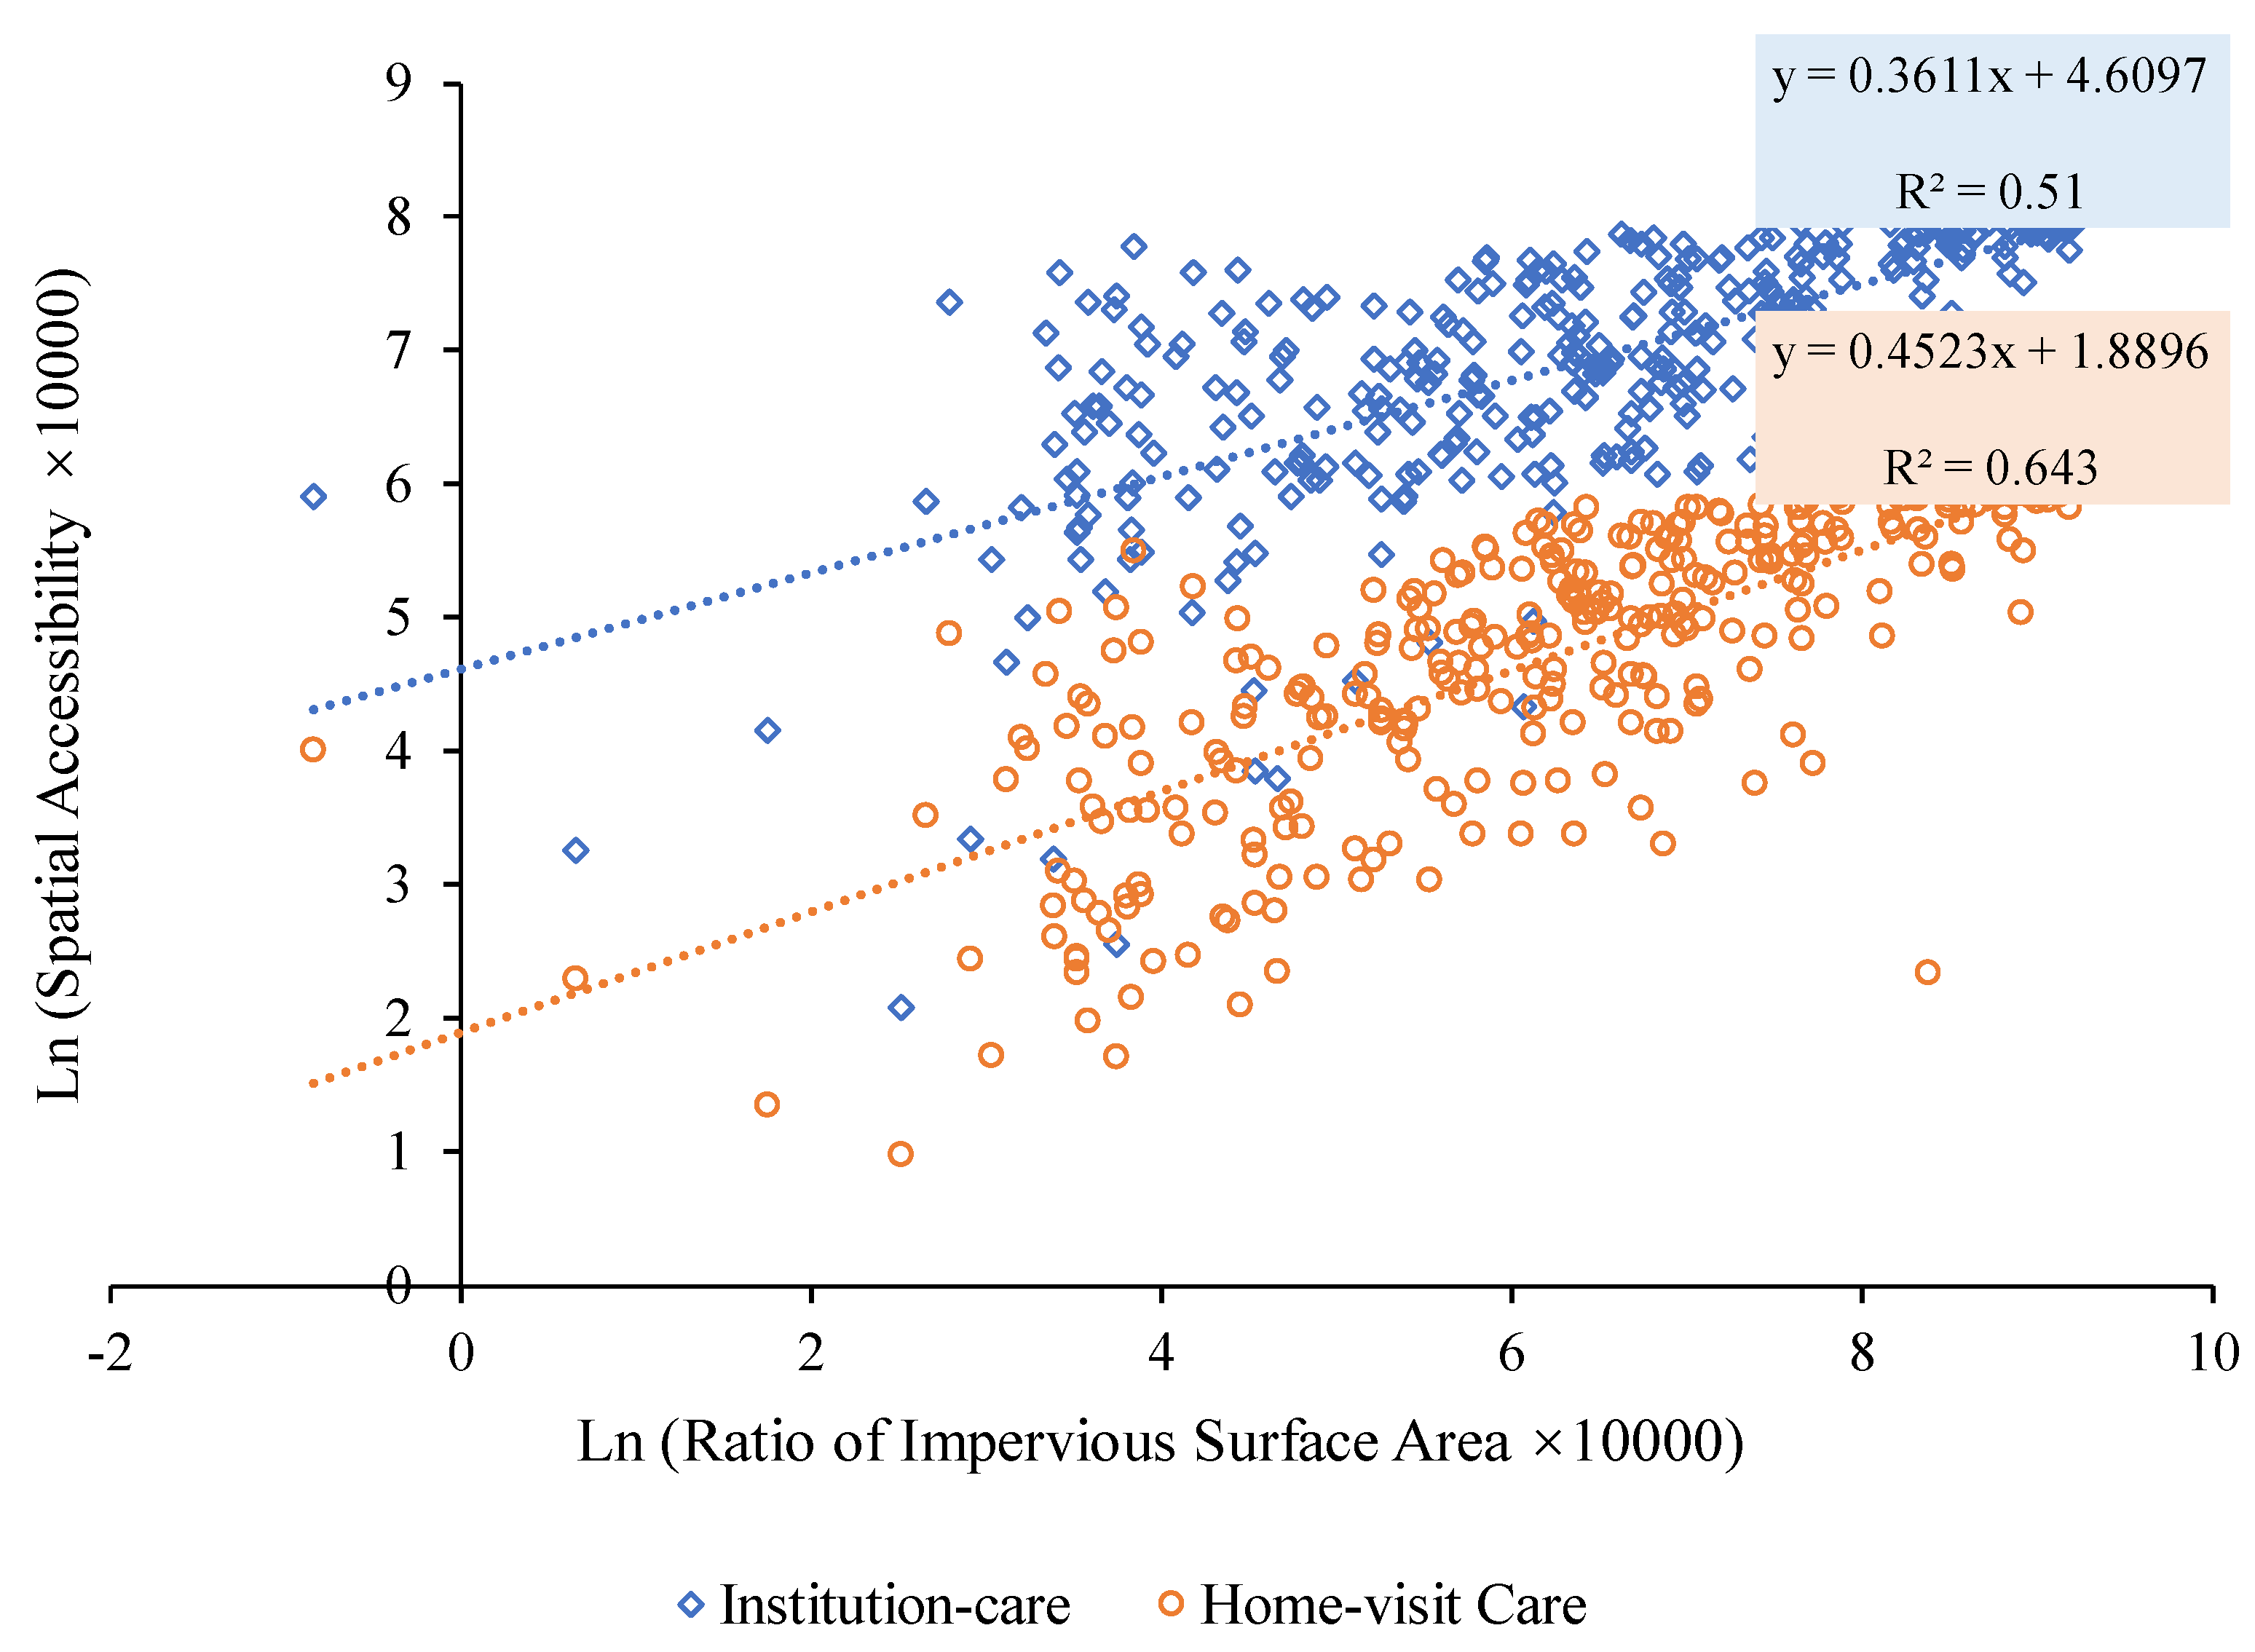
We first delved into the relationship between the spatial accessibility of LTSS and the prevailing levels of urbanization. In similar studies, impervious surfaces were crucial indicators of urbanization [52,53]. Drawing upon the “30 Meters Annual Land Cover Dataset” [54], we employed the ratio of impervious surface area to the total land area, based on 2022 data, as a robust metric to gauge the level of urbanization across various townships and streets. This spatial distribution is congruent with the “three-loops” of the functional areas, as illustrated in Figure 1. We examined the relationship between spatial accessibility and the impervious surface area ratio using a linear regression model. The results showed a robust positive link between spatial accessibility for LTSS and urbanization level (Figure 2). Spatial accessibility, as gauged by either institutional or home care, consistently exhibited a positive correlation with the ratio of the impervious surface area. The corresponding R2 values are 0.513 and 0.643, respectively.
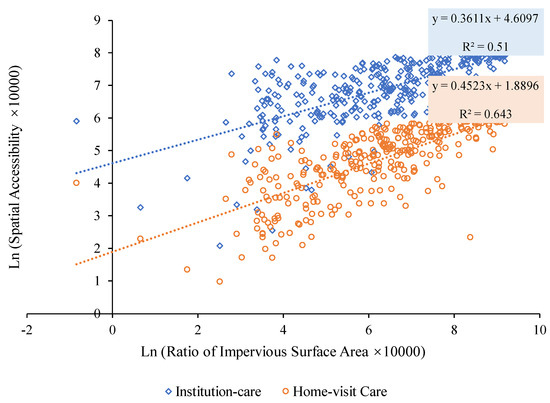
Figure 2.
Correlation analysis between spatial accessibility and the ratio of impervious surface area.
4.2. Geographic Disparities in Spatial Accessibility
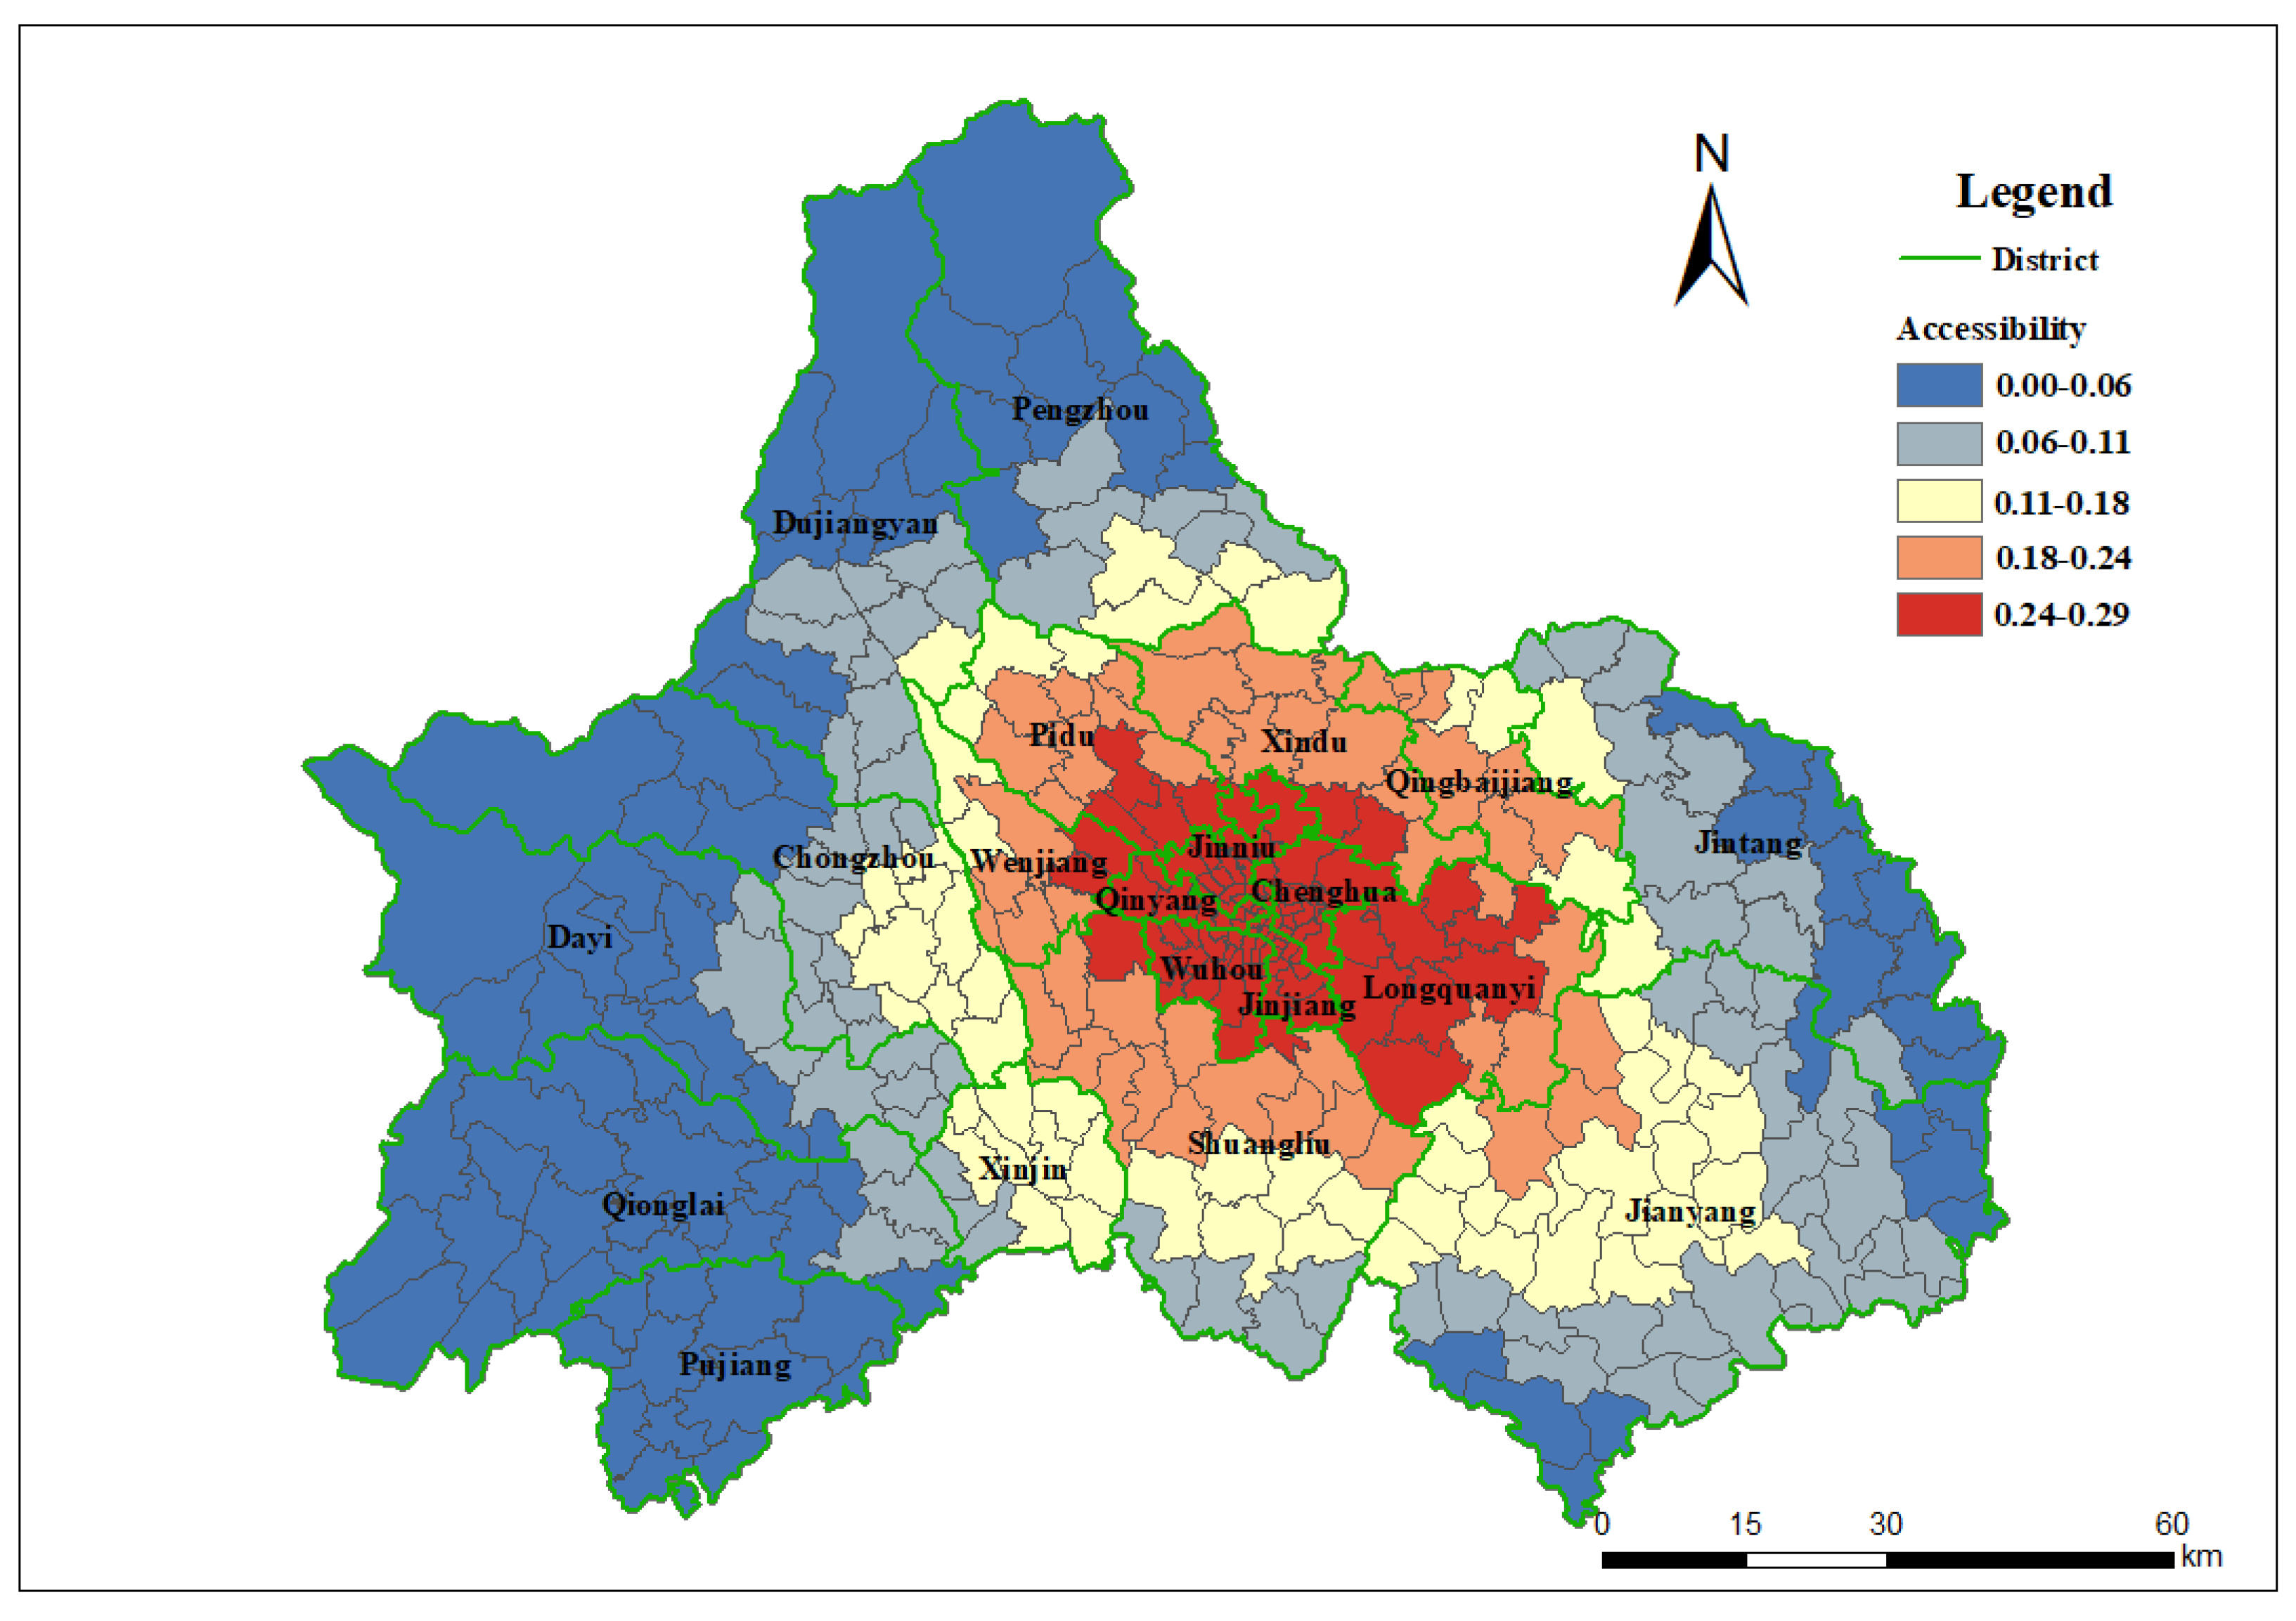
The spatial accessibility of institutional care for LTSS recipients ranged from 0.06 to 0.3. The average spatial accessibility of LTSS beds in Chengdu was 0.126. The highest spatial accessibility is 0.3, which means that 300 beds are available for thousands of LTSS recipients within a 60 min travel time.
As shown in Figure 3, the spatial distribution (including nursing homes and hospitals) was significantly polarized and consistent with the functional areas of Chengdu. The coefficient of variation, obtained by dividing the standard deviation by the average, was 0.6264, which is a prominent level. Spatial accessibility is relatively high in the city center, benefiting from the clustered older adult population and healthcare facilities. With increasing distance from the centroid of the downtown area, spatial accessibility gradually decreased. Compared with Chengdu’s functional area, the areas with higher spatial accessibility extend beyond the “first loop” and cover some communities of the “second loop”, with the highest accessibility in the Longquanyi district.

Figure 3.
Spatial accessibility of LTSS recipient for institutional care.
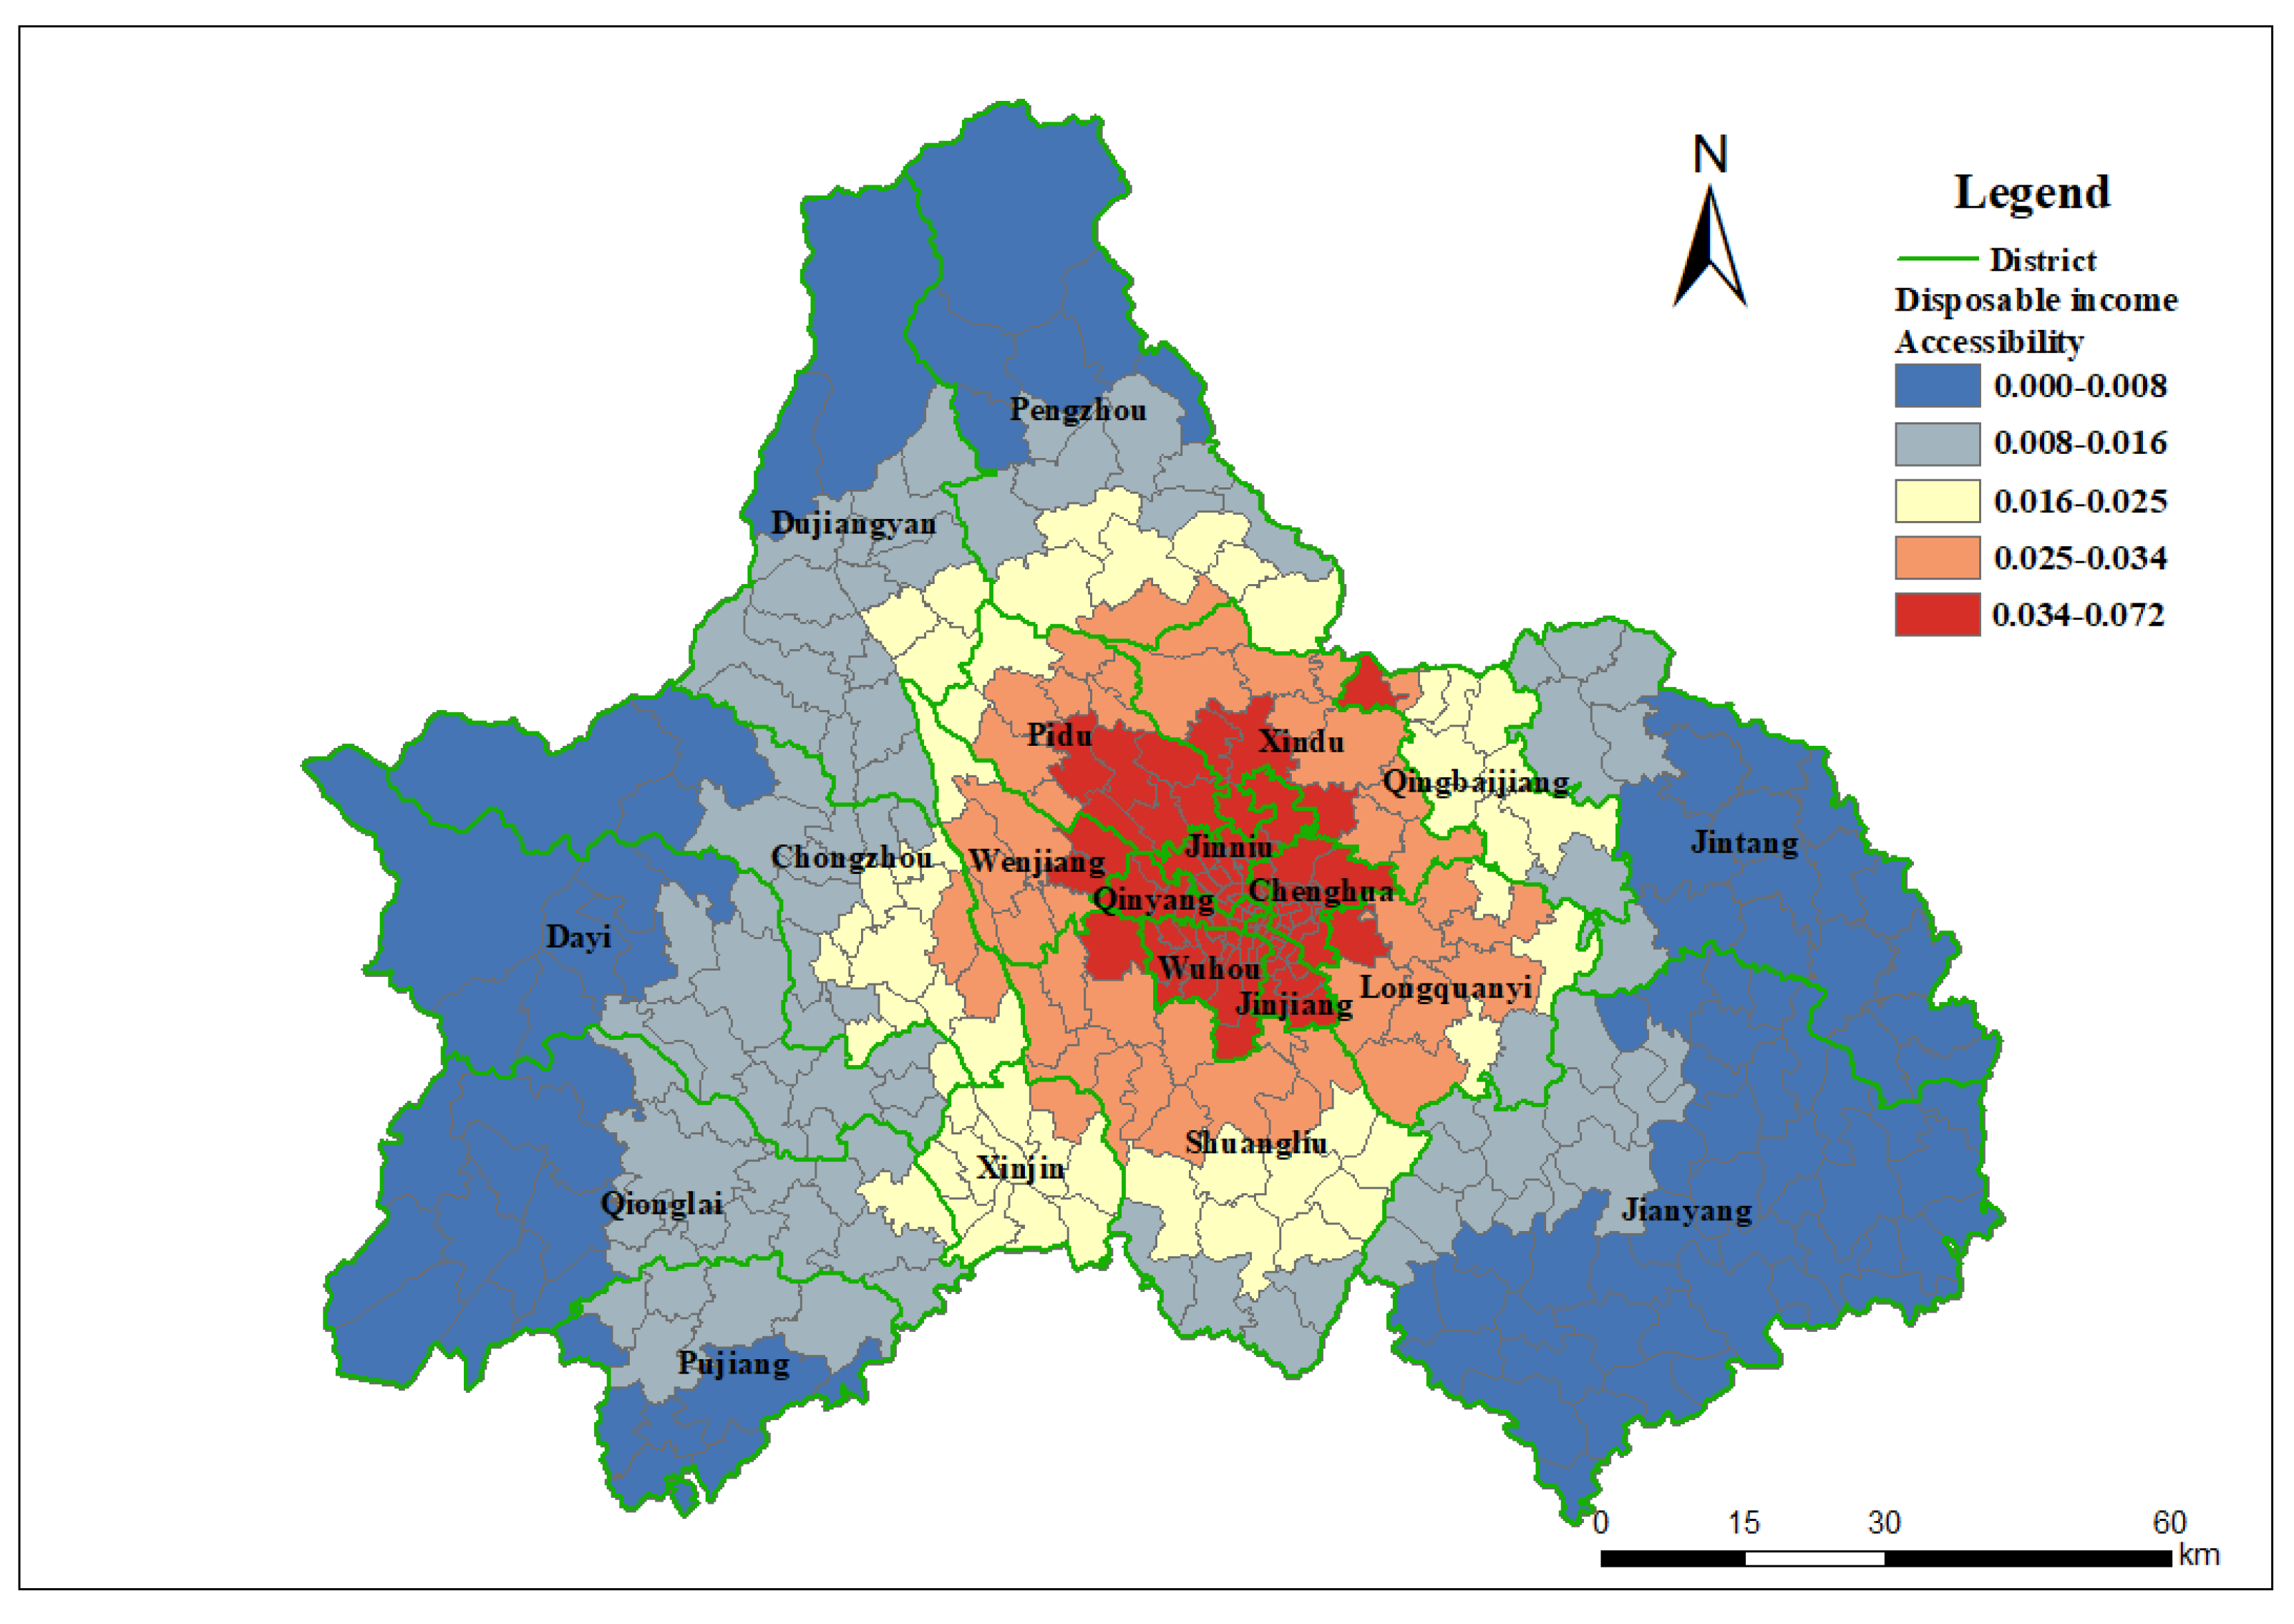
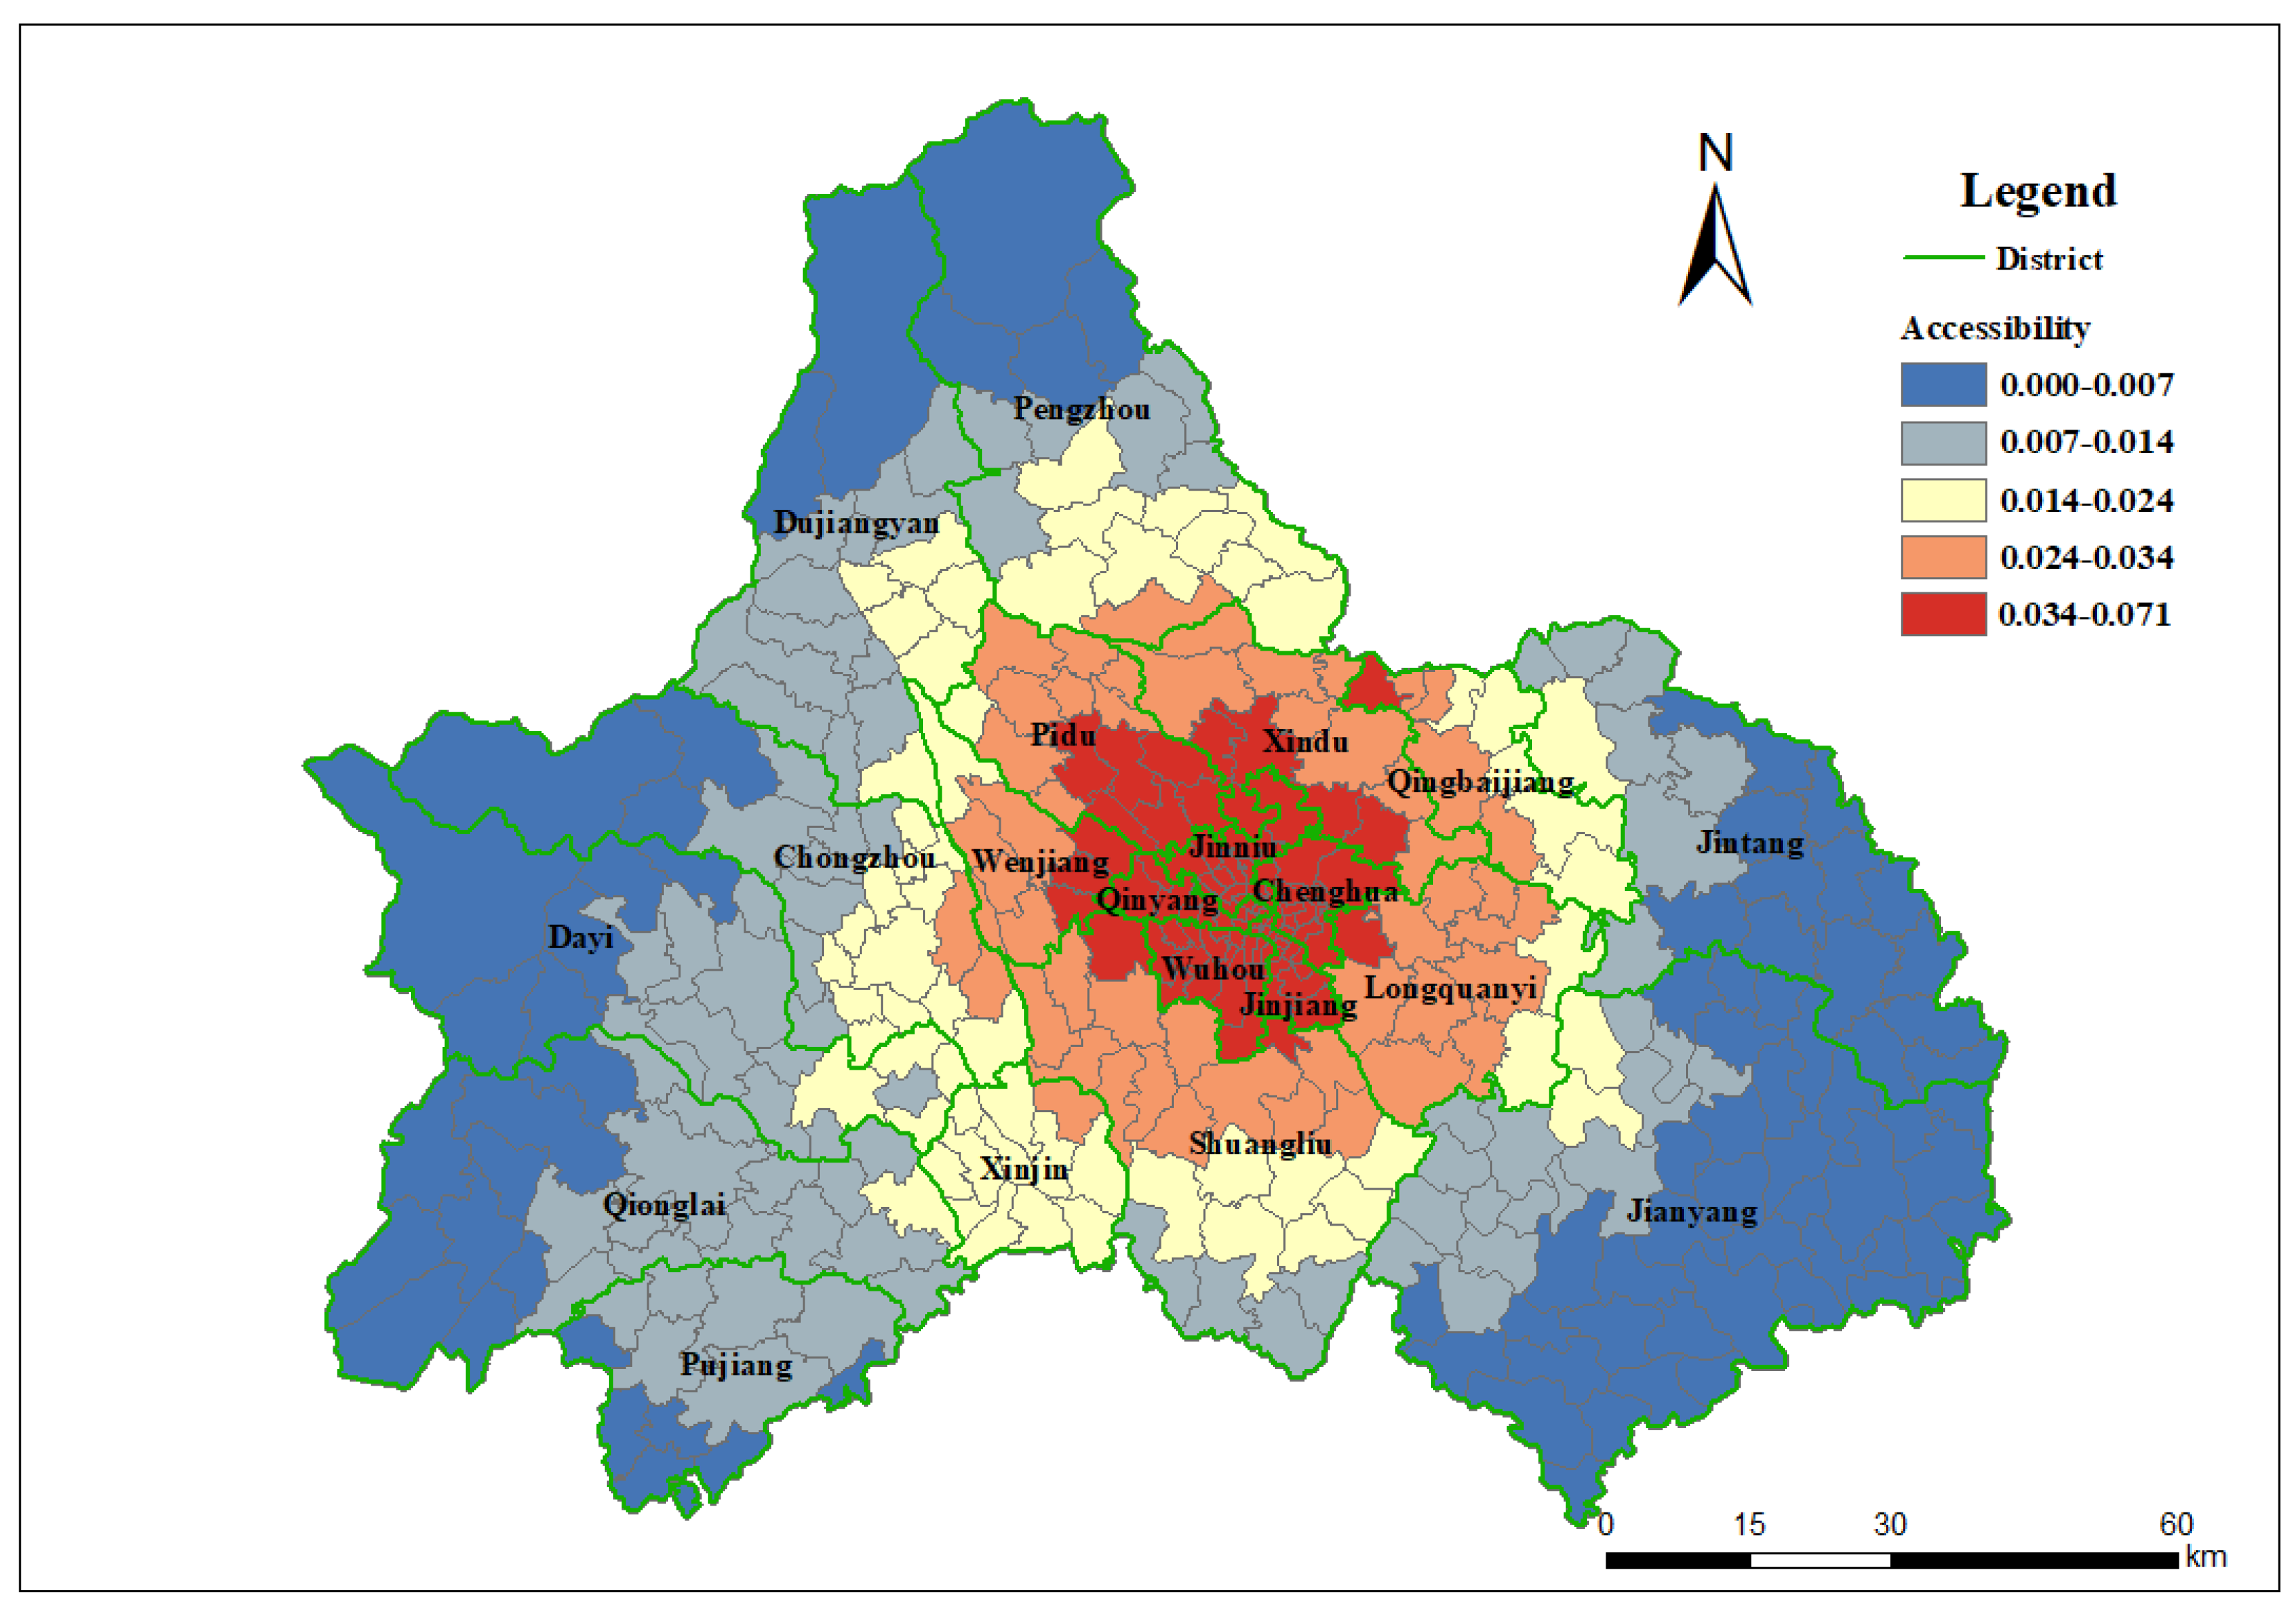
Spatial accessibility of home care ranged from 0.006 to 0.071. The average spatial accessibility in Chengdu is 0.019. The highest spatial accessibility is 0.071, meaning 71 formal caregivers dispatched by LTSS facilities are available per thousand recipients within a 60 min travel time.
As shown in Figure 4, the spatial accessibility of LTSS recipients to home care aligns with the distribution of functional areas in Chengdu. Compared with institutional care, home care has slightly higher accessibility in the northwest parts of the “second loop” areas, such as Xindu and Pidu. Simultaneously, there was an insufficient situation in the southeastern part of Longquanyi.

Figure 4.
Spatial accessibility of LTSS recipient for home care.
4.3. Impact of the Demand Intensity Coefficient
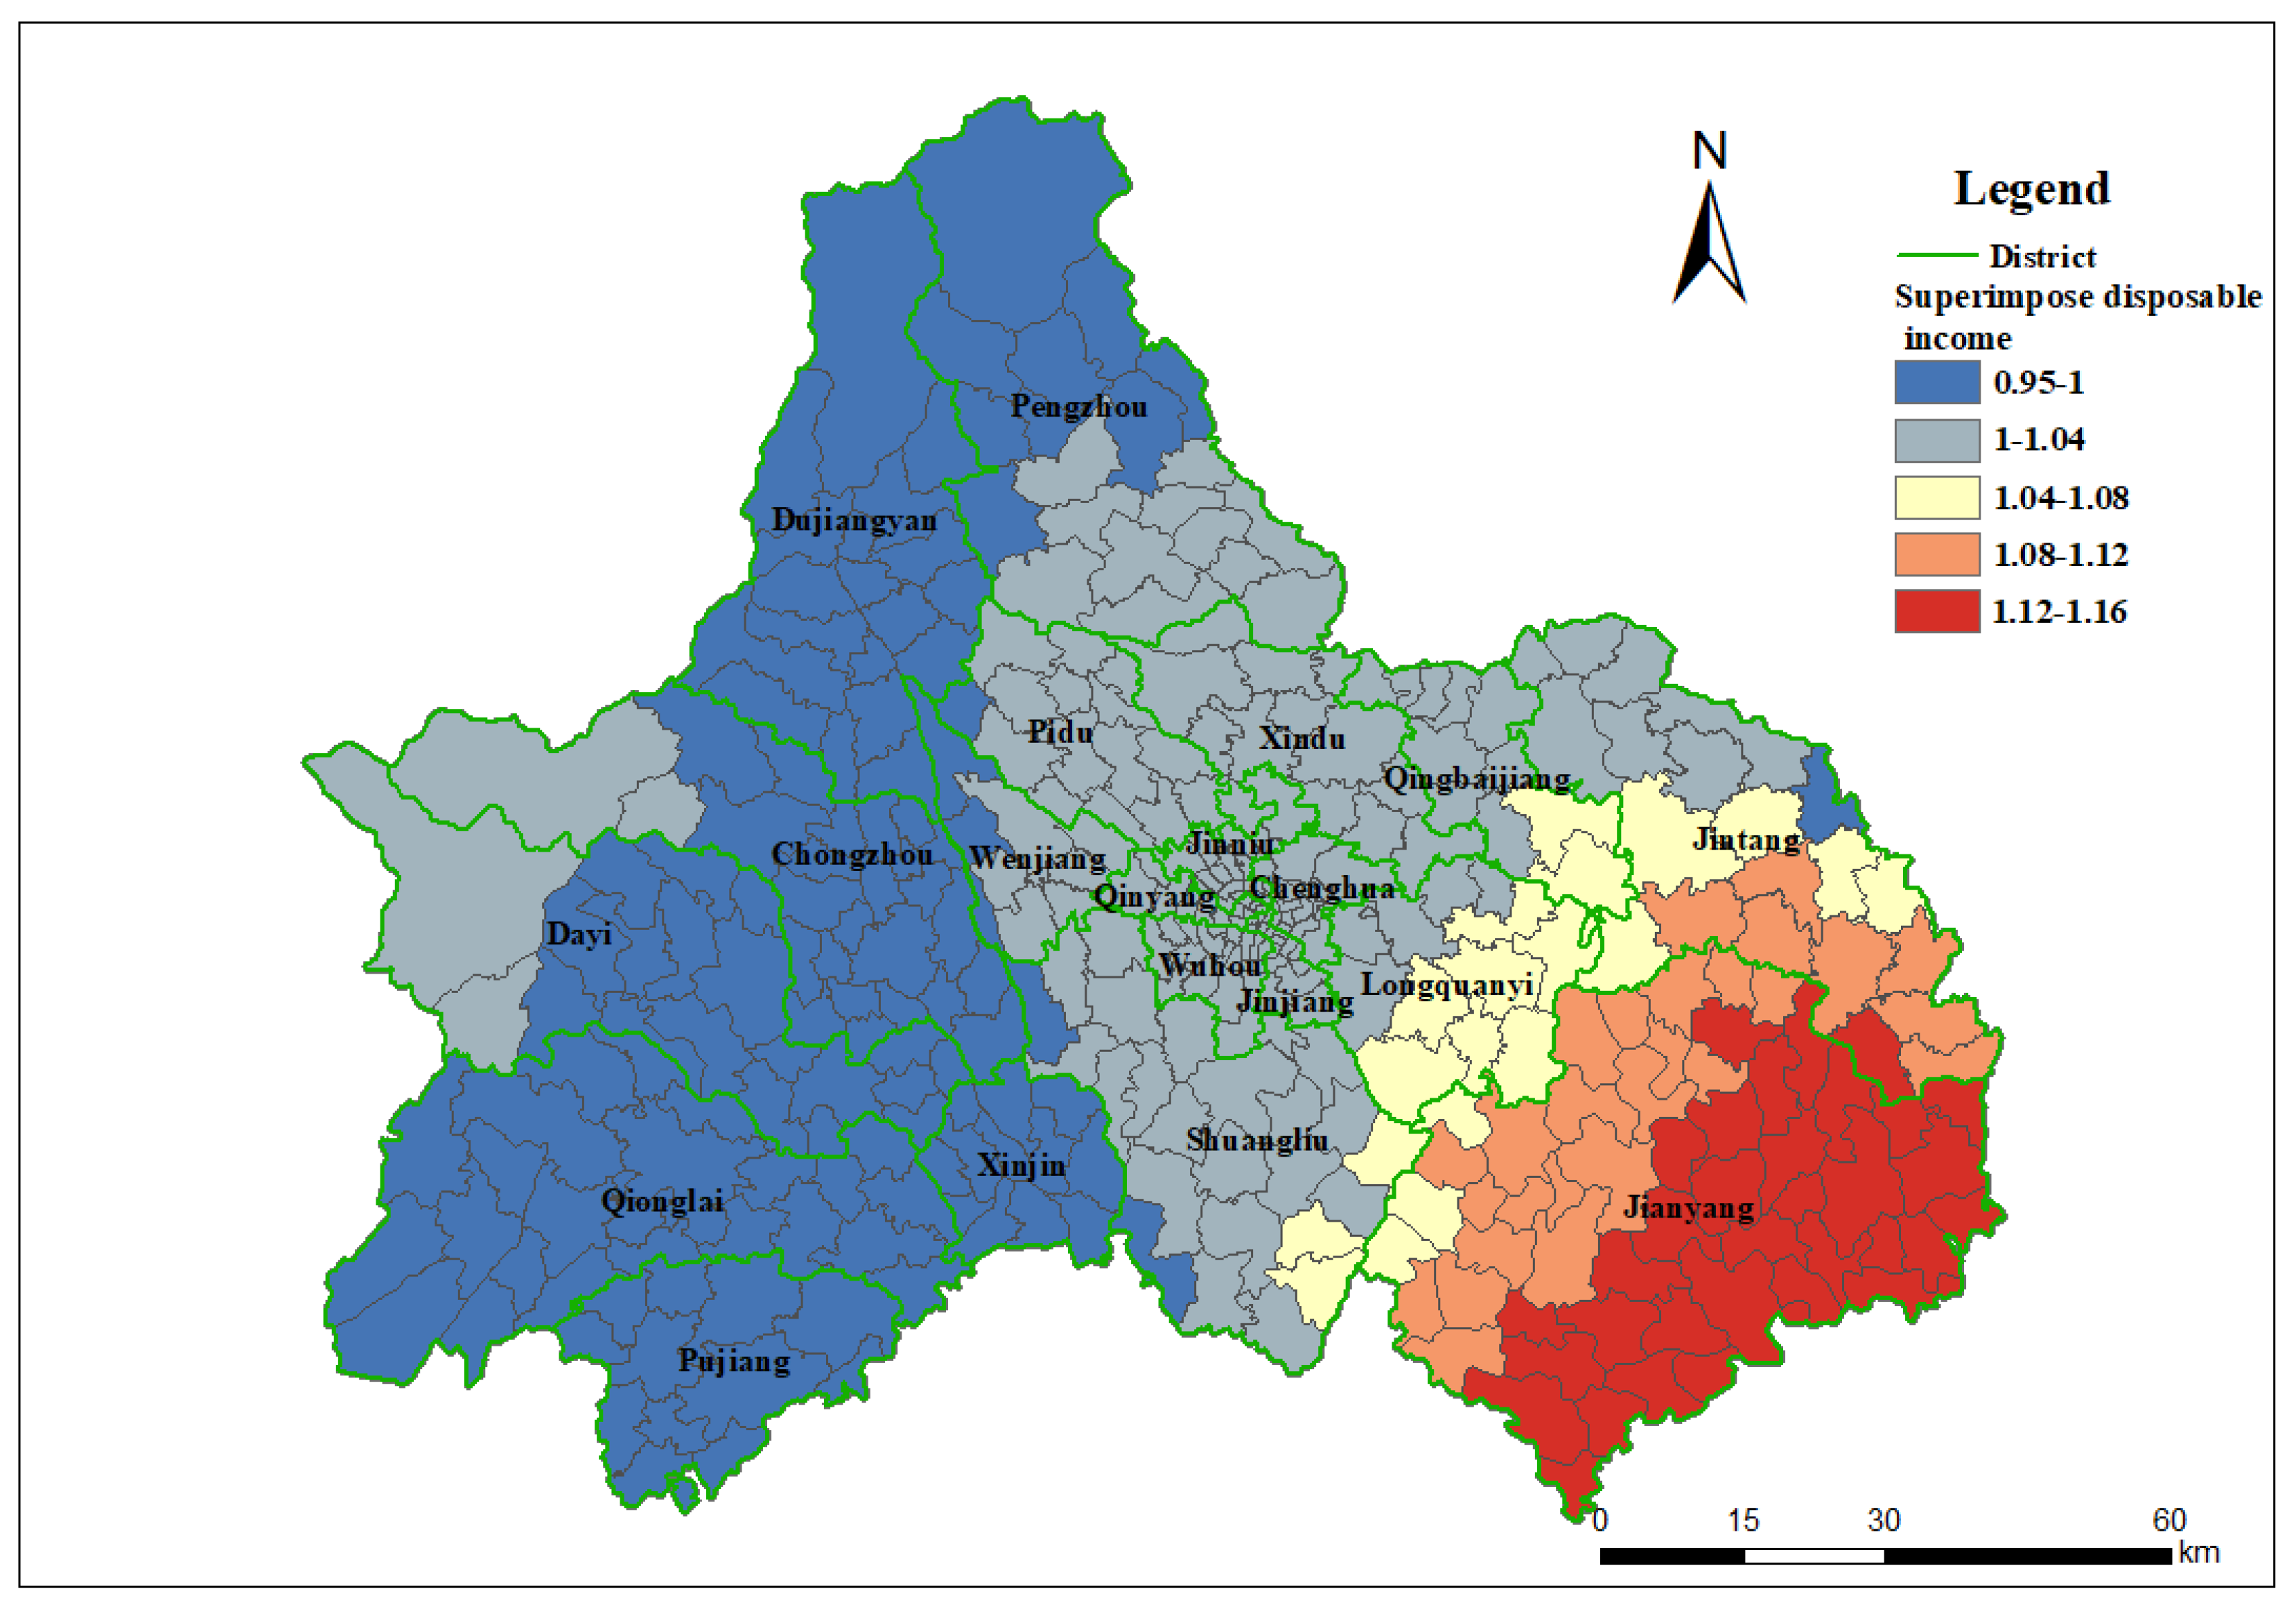
Overall, the income per capita in Chengdu by district ranged from RMB 44,318 to 58,172, with a differentiation rate of approximately 76.2%. Demand intensity by per capita income (ranging from 0.82 to 1.05) coefficient slightly changed the spatial pattern of LTSS recipients’ institutional care accessibility. Compared to the original version, the regions with the highest and second-highest accessibility expanded toward the north and east of the city. For home care, with the effect of demand intensity (income per capita), while the areas with the highest spatial accessibility have similar patterns, the areas with the second and third highest accessibility are slightly contracted in the eastern part (see Appendix B, Figure A3 and Figure A4).
There were some notable patterns when we compared the original spatial accessibility with demand intensity (Figure 5 and Figure 6). The impact of demand intensity on spatial accessibility is insignificant for the main urban areas, as income aligns with LTSS supply. However, there are different results for suburban areas, particularly in the eastern and western regions. This difference is more pronounced when institutional and home care are discussed separately. In terms of institutional care, considering demand intensity, the overall accessibility in western areas has decreased to a certain extent. In contrast, accessibility improved in the eastern counties, especially Jianyang and Jintang. Regarding home care, accessibility moderately decreased in the “first and second loops”, while accessibility improved in Pujiang, Qionglai, and Jianyang in the “third loop”.

Figure 5.
Ratio between institutional care spatial accessibility with or without demand intensity.
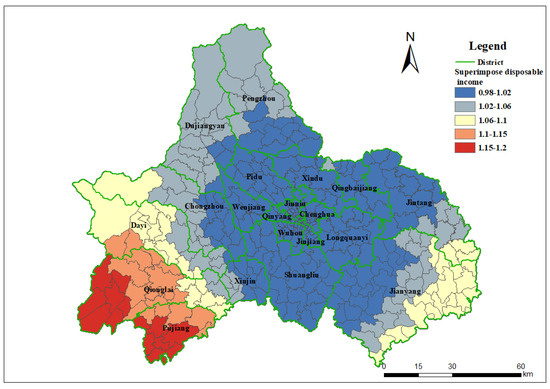
Figure 6.
Ratio between home care spatial accessibility with or without demand intensity.
4.4. Spatial Mismatch Between Different Long-Term Services and Supports Delivery
The absolute value of the spatial mismatch index (SMI) reflects the spatial dislocation intensity between the accessibility of home care and institutional care in various towns and villages. The larger the absolute value, the more significant the spatial mismatch. A positive SMI indicated that the accessibility of home care was better than that of institutional care, whereas a negative SMI indicated that the accessibility of home care was worse than that of institutional care in towns and villages.
The SMI in the study area is higher in the west and lower in the east (Figure 7). The SMI of the western region was greater than zero, indicating that the accessibility of home care was better than that of institutional care. In contrast, the SMI for most eastern areas was less than zero, indicating that the accessibility of home care was worse than that of institutional care. However, notably, the accessibility of home care in Chengdu is much lower than that of institutional care. Therefore, the spatial differentiation index, with differences between the east and west, does not necessarily indicate that the accessibility of home care is higher in the west; rather, it may be due to the relative abundance of institutional care in the eastern region.
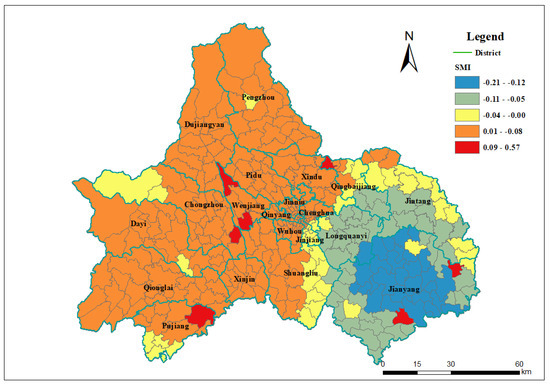
Figure 7.
Spatial mismatch index (SMI) between home care and institutional care in Chengdu.
5. Discussion
This study pioneers a comprehensive spatial accessibility analysis of long-term services and supports (LTSSs) in Chengdu, a rapidly aging megacity and a pioneer in China’s urban–rural integration policies. By integrating an enhanced two-step floating catchment area (2SFCA) method with demand intensity coefficients and a spatial mismatch index (SMI), this research addresses critical gaps in understanding how geographic and socioeconomic factors shape LTSS accessibility in a developing western Chinese metropolis. The findings not only validate the pronounced urban–suburban disparities in LTSS provision but also provide novel insights into the mechanisms driving these inequities. Below, we discuss the implications of our results in light of the study’s methodological innovations, theoretical contributions, and policy relevance, while emphasizing the proposed collaborative framework to bridge spatial accessibility gaps.
5.1. Methodological Innovations and Theoretical Contributions
The enhanced 2SFCA framework, incorporating demand intensity coefficients, revealed nuanced patterns of LTSS accessibility that traditional models might overlook. By weighting accessibility scores with per capita disposable income, we demonstrated that suburban areas with lower incomes experience compounded disadvantages: reduced financial capacity to cover out-of-pocket LTSS costs exacerbates spatial inaccessibility. This adjustment aligns with Radke and Mu’s (2000) emphasis on socioeconomic factors in accessibility modeling [11], yet extends their work by explicitly linking income disparities to utilization patterns in a rapidly urbanizing context. Notably, the demand intensity coefficient highlighted divergent trends between institutional and home care. For instance, in eastern suburban districts like Jianyang, improved institutional care accessibility under income-adjusted models reflects targeted government investments in large-scale facilities, whereas diminished home care accessibility in western suburbs underscores market-driven service shortages.
The spatial mismatch index (SMI) further advanced our understanding of LTSS delivery dynamics. By quantifying the incongruity between home care and institutional care accessibility, the SMI exposed systemic biases in resource allocation: institutional care remains concentrated in urbanized eastern zones due to centralized planning, while home care services in western suburbs rely on fragmented market initiatives. This finding resonates with Frochen’s identification of “nursing home deserts” in low-income urban neighborhoods but diverges by emphasizing rural–urban divides in a developing megacity [13]. The SMI’s application here underscores its versatility as a tool for diagnosing spatial inequities in multimodal service systems.
5.2. Structural Imbalances and Spatial Disparities in LTSS Provision
The findings highlight a dual crisis of insufficient supply and structural polarization:
- Critical Shortages: At a 60 min travel threshold, Chengdu averages only 126 beds and 19 formal caregivers per 1000 LTSS recipients, with remote areas (e.g., Pujiang, Qionglai) nearing zero accessibility. This deficit forces reliance on informal care or neglect, exacerbating vulnerabilities for rural and peri-urban older adults. Corresponding research has also indicated that, against the backdrop of rapid aging in China, the advancement of market-oriented reforms in social services and the swift decline of familial support systems have rendered the older adults in dire need of affordable and accessible LTSS [55,56].
- Polarization Between Institutional and Home Care: In the urban core (“first loop”), institutional care accessibility is four times higher than home care, expanding to tenfold in outer loops. Institutional care’s dominance stems from economies of scale (e.g., Longquanyi District’s large facilities) and government prioritization, while home care suffers from workforce shortages and market fragmentation. The SMI reveals a spatial paradox: western suburbs show relatively higher home care accessibility due to decentralized small-scale providers, yet absolute service quality and coverage lag far behind urbanized eastern zones. This finding reinforces the notion that the choice of location for these facilities is intricately linked to the demand, which encompasses both economic and demographic factors [57,58,59].
5.3. Urbanization Gradients and Demand–Supply Interactions
Chengdu’s “three-loops” functional zoning (100% urbanization in the first loop vs. 47.36–61.49% in the third loop, according to the Seventh National Census of China (2021)) encapsulates stark accessibility gradients:
- Urbanization–Accessibility Nexus A strong positive correlation exists between impervious surface ratios (urbanization proxies) and LTSS accessibility (R2 = 0.513–0.643). The first loop’s institutional and home care accessibility is 1.5–2.1 times higher than the second loop and 2.0–8.0 times higher than the third loop, reflecting historical resource concentration in urban cores and suburban infrastructure gaps.
- Income-Driven Demand Modulation: Higher-income areas exhibit intensified demand for home care [60,61], yet reimbursement policies favoring institutional care under Chengdu’s LTCI distort utilization patterns. In Chengdu, the LTCI is designed to reimburse according to the category of insurance and level of disability of each recipient, ranging from 22.5% to 37.5% of the average monthly wage of employed personnel [62,63,64]. The reimbursement disparities in Chengdu’s LTCI (Table 2) highlight systemic biases toward institutional care. For instance, urban employees with Severe Level 3 disabilities receive 3196 RMB/month for institutional care versus 1796 RMB/month for home care, incentivizing facility-based service utilization. This policy design exacerbates spatial mismatches by reinforcing institutional care concentration in urban cores while neglecting home care development in underserved suburbs.
Table 2. Long-term care insurance reimbursement policy in Chengdu.
5.4. Policy Implications and the Collaborative Framework
Chengdu’s approach to urban–rural integration is distinctive due to its comprehensive and integrated policy framework, which includes not only economic and social policies but also a focus on spatial planning and resource allocation to enhance accessibility to long-term services and supports (LTSSs). Chengdu’s model offers a transferable framework for cities seeking to reconcile urban density advantages with rural accessibility imperatives. It stands in contrast to other developing megacities, where policies may be more fragmented or focused on either urban development or rural revitalization without an integrated approach [65,66,67].
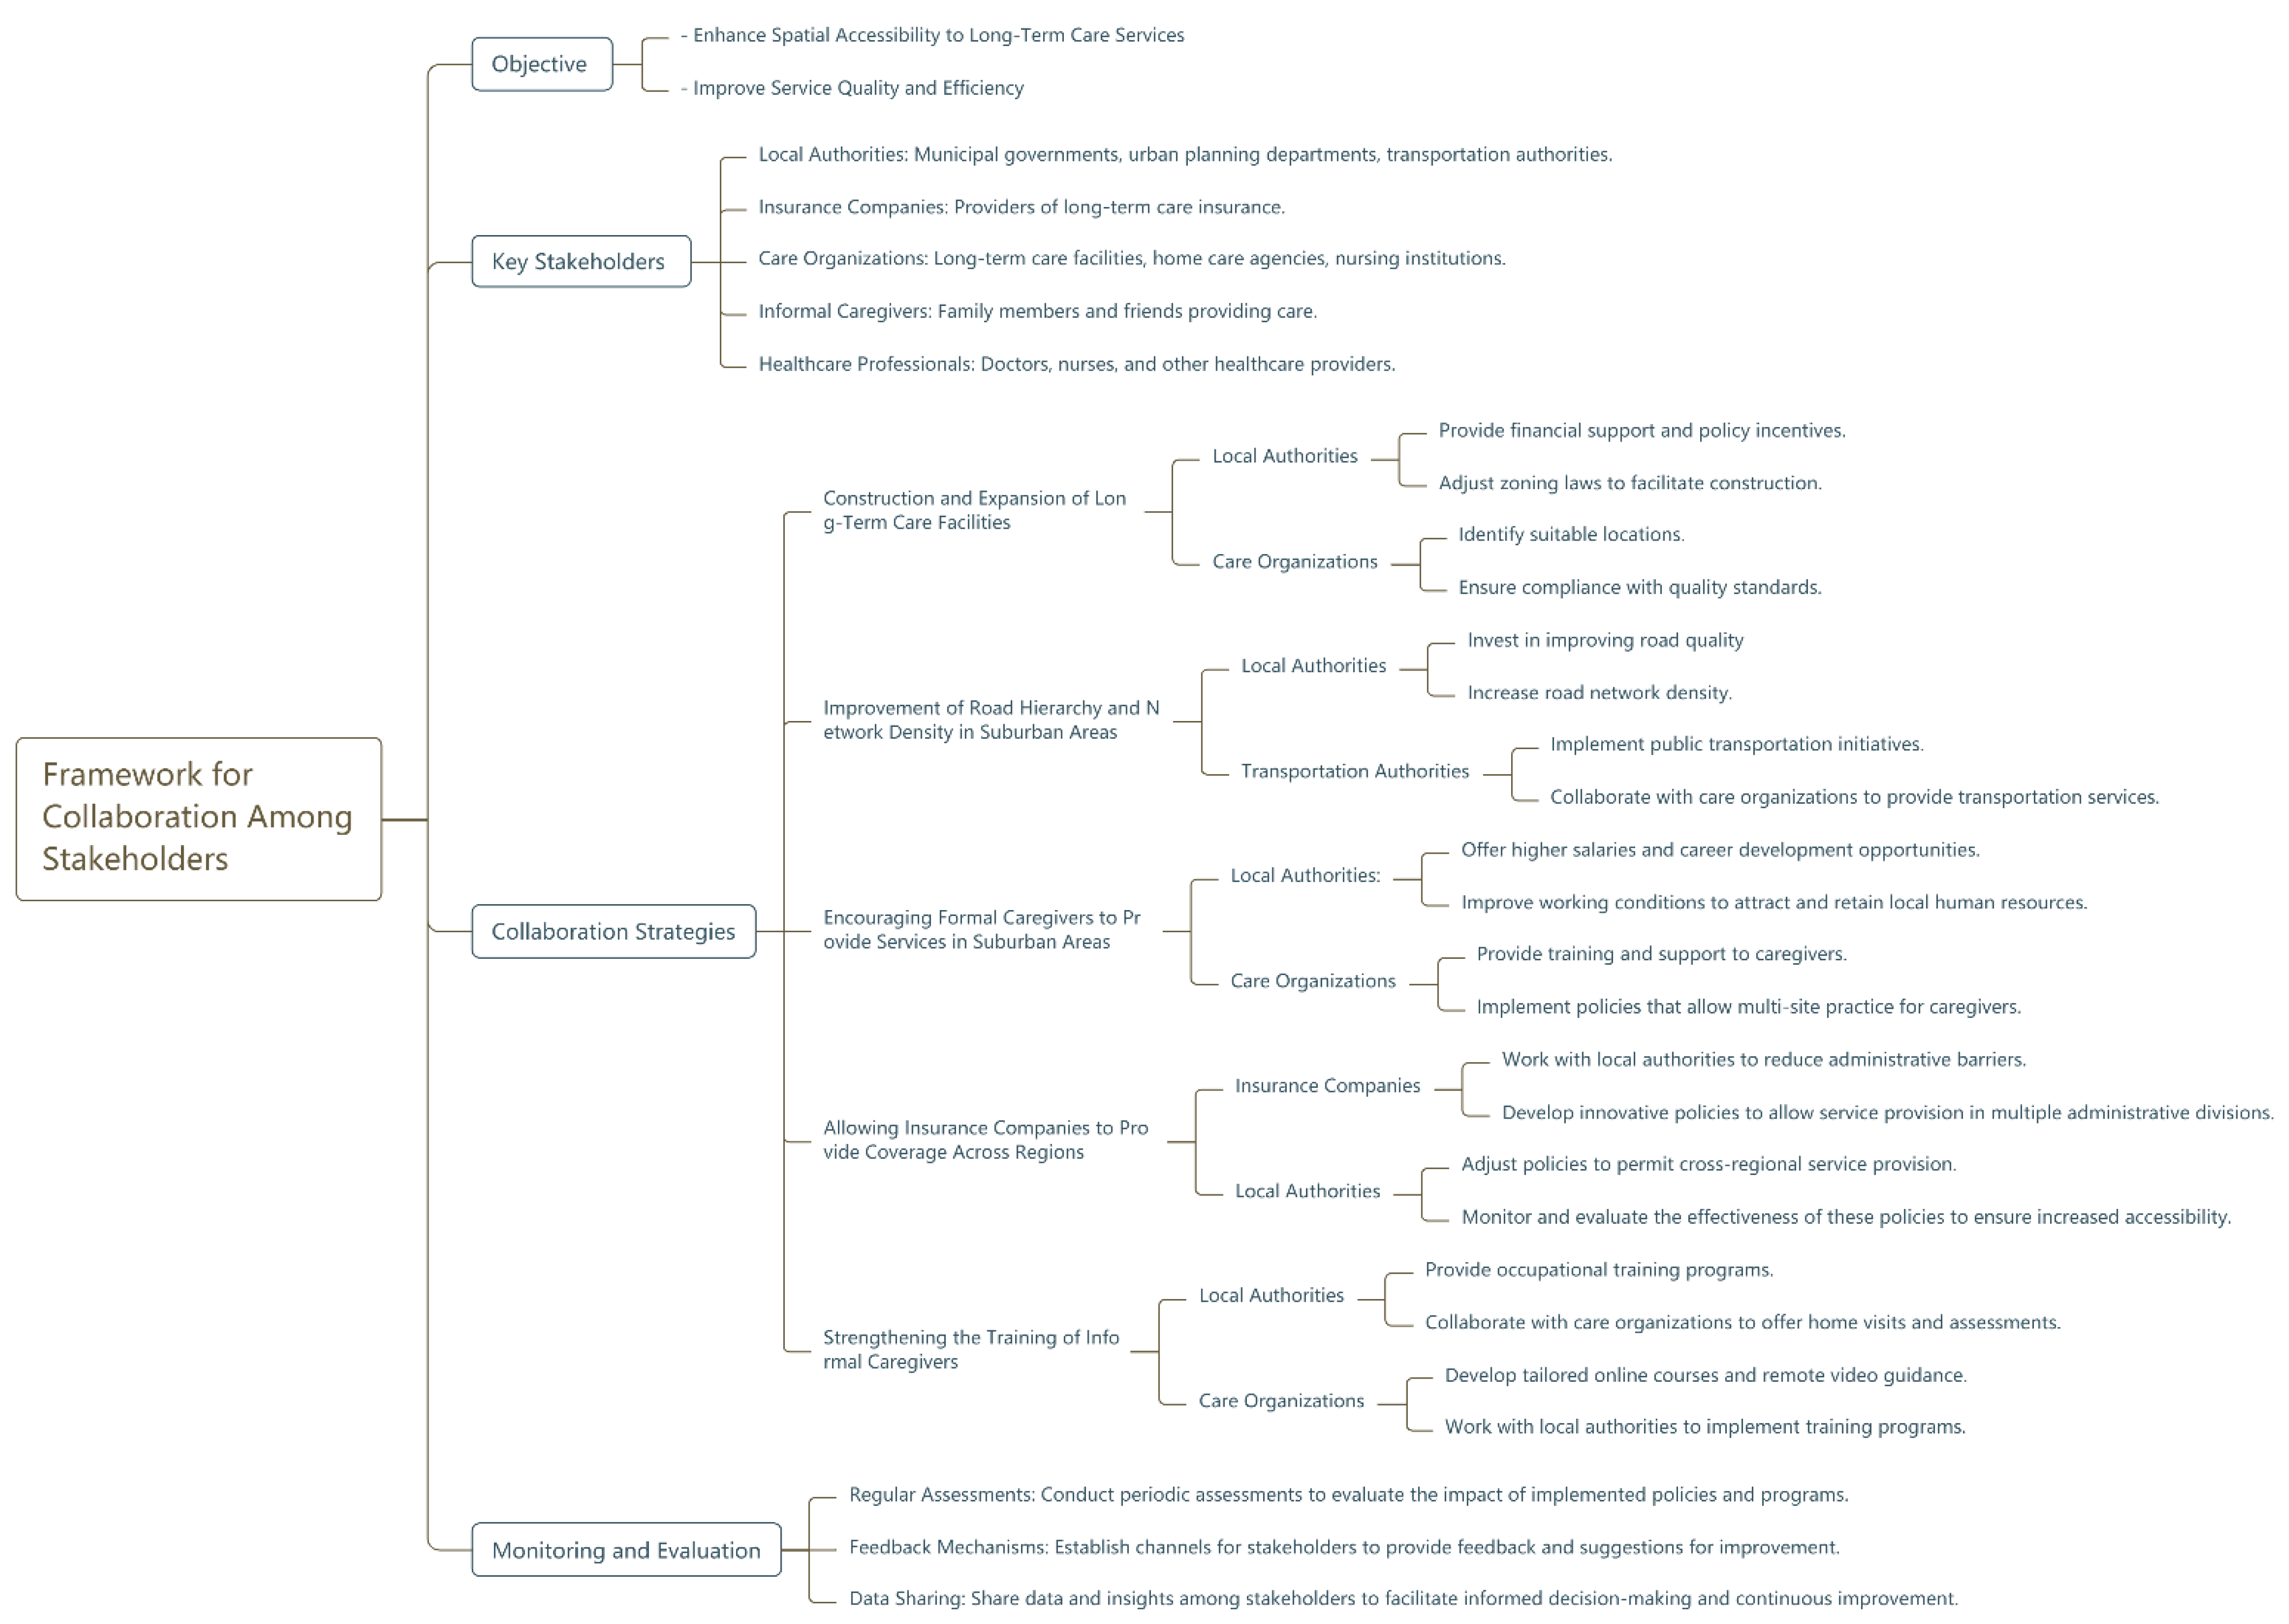
The study’s findings directly address the research questions posed in the introduction: spatial accessibility in Chengdu is not only quantifiable through advanced geospatial methods but also deeply intertwined with urbanization levels and socioeconomic stratification. To mitigate these disparities, we propose a multi-stakeholder collaborative framework (Figure 8) that integrates spatial planning, policy adjustments, and capacity-building initiatives. This framework innovatively bridges the “policy-implementation disconnect” critiqued in the earlier literature by defining actionable roles for key actors:
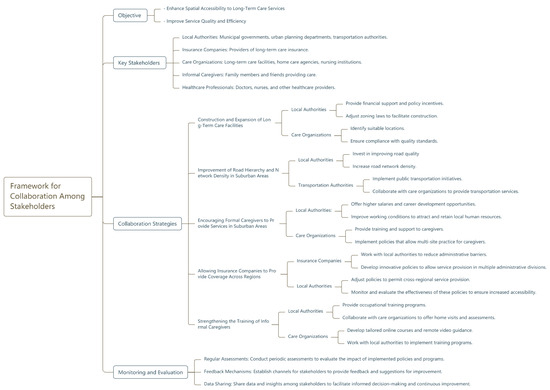
Figure 8.
Proposed framework for collaboration among stakeholders.
- Local Authorities: Strategic expansion of LTSS facilities in suburban “third loop” areas, particularly in town centers, should prioritize institutional care to address acute shortages. Spatial optimization of newly added healthcare resources would theoretically enhance both efficiency and equity substantially [68]. Concurrently, improving road network density—especially in mountainous regions—will reduce travel time barriers. Policy incentives, such as subsidies for suburban care facilities and relaxed licensing requirements for home care providers, can stimulate market participation.
- Insurance Companies: Current administrative segmentation of LTCI operations restricts cross-regional service access. Allowing insurers to operate across district boundaries would enable recipients in peripheral areas to utilize nearby facilities, even if located in adjacent jurisdictions. This aligns with Tao and Cheng’s (2019) call for flexible healthcare financing mechanisms in fragmented systems [28].
- Care Organizations: Partnerships between institutions and training agencies can enhance the quality and retention of formal caregivers in underserved areas. For example, incentivizing multi-site practice—akin to China’s physician mobility policies—would enable caregivers to serve both urban and suburban populations, improving service coverage [69].
- Informal Caregivers: Strengthening training programs for family caregivers, supported by government-funded workshops and telehealth platforms, can alleviate reliance on formal services. Integrating informal care into LTCI reimbursement structures, as proposed in the “Chengdu Model”, would further legitimize and resource this critical workforce [38,70].
- Data-Driven Governance: Real-time data sharing among stakeholders—such as updating facility locations, caregiver availability, and reimbursement claims—can enable dynamic resource allocation. This approach mirrors Liu et al.’s (2022) advocacy for high-resolution datasets in aging policy [24], but adds a governance layer to ensure interoperability.
5.5. Limitations and Future Directions
While this study advances LTSS accessibility research, limitations underscore areas for refinement. First, the automobile-centric travel model overlooks multimodal transit options (e.g., public transport for caregivers), which may alter accessibility patterns in low-income neighborhoods. Second, the exclusion of moderately disabled individuals—soon to be covered under LTCI—limits generalizability. Third, while our study leverages authoritative administrative records from the CDHSA, potential underreporting in informal caregiving data may introduce measurement biases. Unlike formal caregivers documented through institutional registries, informal caregivers (family members or unpaid volunteers) often operate outside government monitoring systems [71]. Future studies could incorporate agent-based models to simulate recipient preferences and administrative boundary effects and adopt mixed-methods approaches to triangulate administrative data, such as mobile health tracking of caregiving mobility patterns and participatory GIS mapping of informal care networks through community workshops.
6. Conclusions
By synthesizing spatial analytics with policy analysis, this study exemplifies how methodological rigor and localized data can inform equitable aging policies. Chengdu’s experience—a microcosm of China’s urban–rural integration challenges—reveals that even robust insurance systems like LTCI cannot alone rectify spatial mismatches. Strategic investments in infrastructure, workforce incentives, and adaptive governance frameworks are imperative to ensure that LTSS accessibility keeps pace with demographic and urban transitions. The ‘Chengdu Model’ demonstrates how tiered reimbursement mechanisms can incentivize suburban service expansion while maintaining urban service quality—a critical balance for megacities navigating peri-urban growth. These insights resonate globally, offering a blueprint for rapidly urbanizing regions grappling with aging populations and spatial inequities.
Supplementary Materials
The following supporting information can be downloaded at https://cdyb.chengdu.gov.cn, http://openmaptiles.org, and https://webapi.amap.com/maps (accessed on 19 December 2024).
Author Contributions
Conceptualization, S.L. and X.D.; data curation, S.Q.; formal analysis, X.D.; funding acquisition, L.P.; investigation, S.L. and X.S.; methodology, X.D.; project administration, S.L.; resources, S.L. and X.S.; software, S.Q.; supervision, L.P.; validation, L.P. and X.S.; visualization, S.Q.; writing—original draft, S.L. and X.D.; writing—review and editing, S.Q. and X.D. All authors have read and agreed to the published version of the manuscript.
Funding
This work was funded by the National Natural Science Foundation of China (grant number 42071222) and the Sichuan Science and Technology Program (grant number 2022JDJQ0015).
Institutional Review Board Statement
Not applicable.
Informed Consent Statement
Not applicable.
Data Availability Statement
The original contributions presented in this study are included in the article/Supplementary Materials. Further inquiries can be directed at the corresponding author.
Conflicts of Interest
The authors declare no conflicts of interest.
Appendix A
Table A1.
Summary of road driving speed.
Table A1.
Summary of road driving speed.
| No. | Fclass Attribute | Speed (km/h) | No. | Fclass Attribute | Speed (km/h) |
|---|---|---|---|---|---|
| 1 | tertiary | 40 | 11 | trunk | 70 |
| 2 | tertiary_link | 12 | trunk_link | ||
| 3 | residential | 30 | 13 | track | 25 |
| 4 | unclassified | 14 | track_grade1 | ||
| 5 | secondary | 50 | 15 | track_grade2 | |
| 6 | secondary_link | 16 | track_grade3 | ||
| 7 | primary | 17 | track_grade4 | ||
| 8 | primary_link | 18 | track_grade5 | ||
| 9 | motorway | 70 | 19 | living street | 20 |
| 10 | motorway_link | 20 | path |
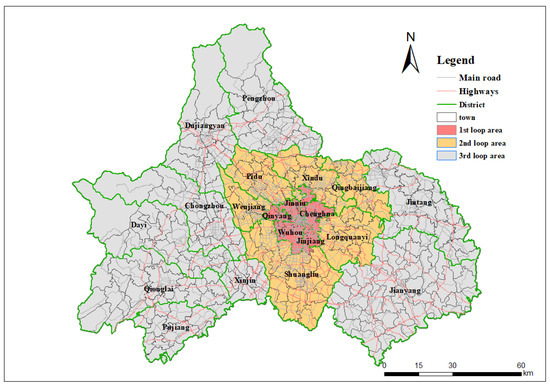
Figure A1.
Main roadmap of Chengdu.
Figure A1.
Main roadmap of Chengdu.

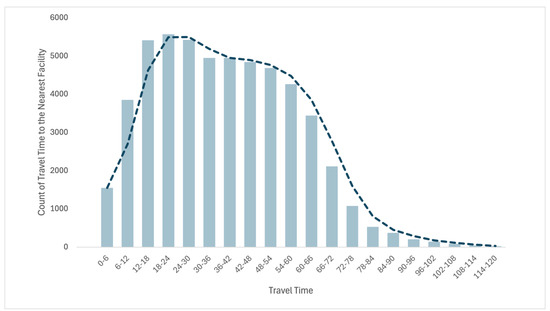
Figure A2.
Distribution of the participant’s travel time to the nearest facility.
Figure A2.
Distribution of the participant’s travel time to the nearest facility.

Appendix B

Figure A3.
Spatial accessibility of long-term services and supports recipients for institutional care with the impact of demand intensity (income per capita).
Figure A3.
Spatial accessibility of long-term services and supports recipients for institutional care with the impact of demand intensity (income per capita).
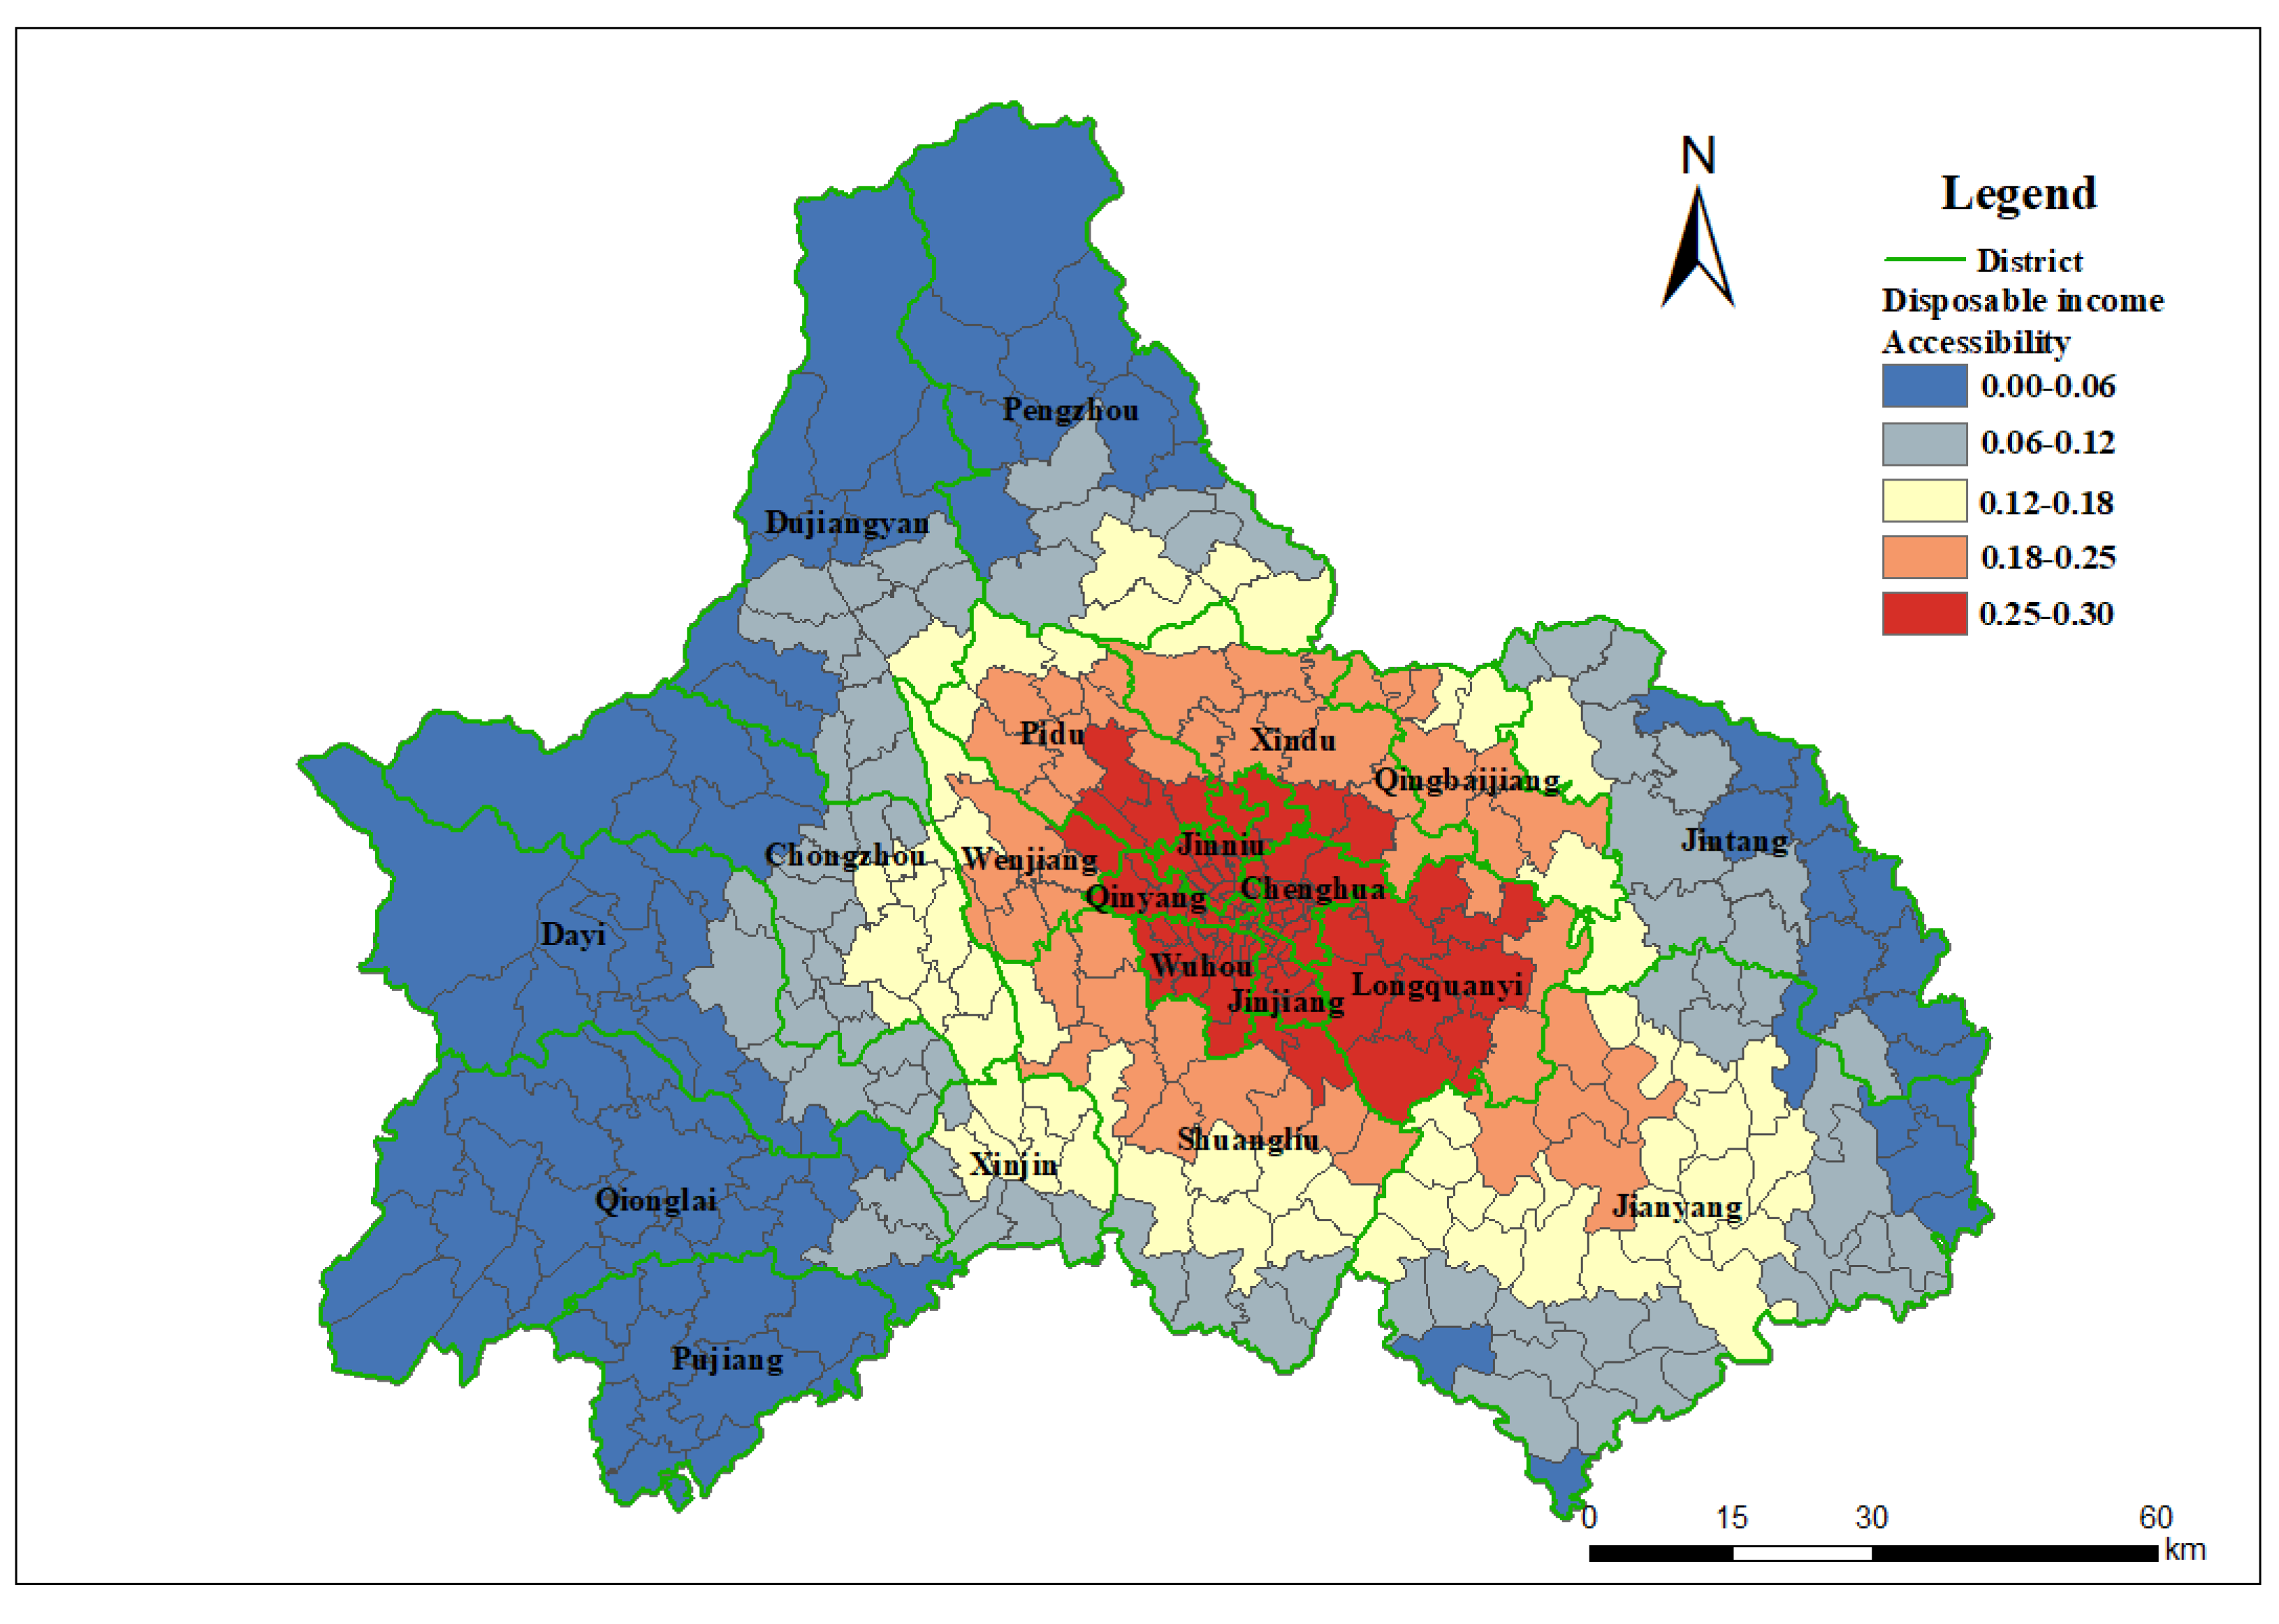
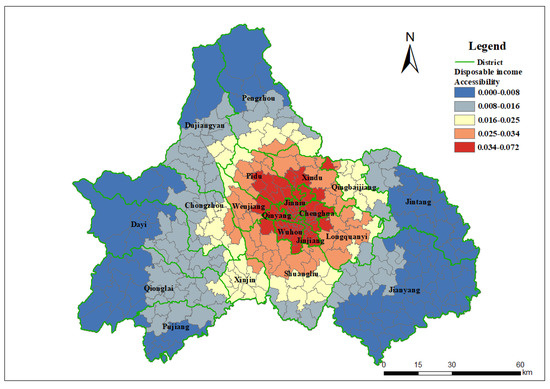
Figure A4.
Spatial accessibility of long-term services and supports recipients for home care with the impact of demand intensity (income per capita).
Figure A4.
Spatial accessibility of long-term services and supports recipients for home care with the impact of demand intensity (income per capita).
References
- Feng, Z.; Glinskaya, E.; Chen, H.; Gong, S.; Qiu, Y.; Xu, J.; Yip, W. Long-term care system for older adults in China: Policy landscape, challenges, and future prospects. Lancet 2020, 396, 1362–1372. [Google Scholar] [CrossRef] [PubMed]
- Guiding Opinions on Carrying out the Pilot Program of Long-term Care Insurance. National Health Commission of China, No.[2016(80)]. Available online: https://www.gov.cn/xinwen/2016-07/08/content_5089283.htm (accessed on 19 December 2024).
- Han, Y.; Shen, T. Long-term care insurance pilot program in China: Policy evaluation and optimization options-taking the pilot program in the northeast of China as an example. Int. J. Environ. Res. Public Health 2022, 19, 4298. [Google Scholar] [CrossRef] [PubMed]
- Huang, Y.; Zhang, Y.; Zhuang, X. Understanding China’s Long-Term Care Insurance Pilots: What is Going On? Do they Work? and Where to go Next? Technical Note (English). World Bank Group: Washington, DC, USA. Available online: http://documents.worldbank.org/curated/en/496061563801421452 (accessed on 19 December 2024).
- Qin, B. City profile: Chengdu. Cities 2015, 43, 18–27. [Google Scholar] [CrossRef]
- Chengdu Municipality Urban and Rural Residents Long-Term Care Insurance Implementation Details. CDHSA. 2020. Available online: https://cdyb.chengdu.gov.cn/ylbzj/c128998/2020-05/27/content_9777d04fac7b40f782b826b18fab05de.shtml (accessed on 19 December 2024).
- Notice on the Issuance of Service Items and Payment Standards for Urban Employee Long-Term Care Insurance. CDHSA. 2020. Available online: https://cdyb.chengdu.gov.cn/ylbzj/c128998/2020-05/27/content_ad3b2ccaecd44f058cb1fde2537fdb88.shtml (accessed on 19 December 2024).
- Notice on the Issuance of Basic Care Service Items and Standards for Long-Term Care Insurance for People with Dementia and Disability. CDHSA. 2020. Available online: https://cdyb.chengdu.gov.cn/ylbzj/c128998/2020-06/04/content_701c0537a2284dd097b88f88ebe7f98b.shtml (accessed on 19 December 2024).
- Special Report of Chengdu Healthcare Security Administration. Non-Public Report from CDHSA; Chengdu Healthcare Security Administration: Chengdu, China, 2022.
- Joseph, A.E.; Phillips, D.R. Accessibility and Utilization: Geographical Perspectives on Health Care Delivery; SAGE Publications: New York, NY, USA, 1984. [Google Scholar]
- Radke, J.; Mu, L. Spatial decompositions, modeling, and mapping service regions to predict access to social programs. Geogr. Inf. Sci. 2000, 6, 105–112. [Google Scholar] [CrossRef]
- McGrail, M.R.; Humphreys, J.S. Measuring spatial accessibility to primary health care services: Utilising dynamic catchment sizes. Appl. Geogr. 2014, 54, 182–188. [Google Scholar] [CrossRef]
- Frochen, S.; Ailshire, J.; Rodnyansky, S. Residential care in Los Angeles: Evaluating the spatial distribution of facilities and neighbourhood access to care among older adults. Local Environ. 2019, 24, 274–288. [Google Scholar] [CrossRef]
- Morioka, N.; Tomio, J.; Seto, T.; Yumoto, Y.; Ogata, Y.; Kobayashi, Y. Association between local-level resources for home care and home deaths: A nationwide spatial analysis in Japan. PLoS ONE 2018, 13, e0201649. [Google Scholar] [CrossRef]
- Guagliardo, M.F. Spatial accessibility of primary care: Concepts, methods and challenges. Int. J. Health Geogr. 2004, 3, 3. [Google Scholar] [CrossRef]
- Cromley, G.A. Measuring differential access to facilities between population groups using spatial Lorenz curves and related indices. Trans. GIS 2019, 23, 1332–1351. [Google Scholar] [CrossRef]
- Wang, X.; Yang, H.; Duan, Z.; Pan, J. Spatial accessibility of primary health care in China: A case study in Sichuan province. Soc. Sci. Med. 2018, 209, 14–24. [Google Scholar] [CrossRef]
- Shen, Y.; Sun, Z. Estimating the spatial correlation and convergence of China’s healthcare resources allocation: Evidence from the Yangtze River delta region. Arch. Public Health 2022, 80, 207. [Google Scholar] [PubMed]
- Qin, X.; Hsieh, C.R. Economic growth and the geographic maldistribution of health care resources: Evidence from China, 1949-2010. China Econ. Rev. 2014, 31, 228–246. [Google Scholar] [CrossRef]
- McGrail, M.R. Spatial accessibility of primary health care utilizing the two step floating catchment area method: An assessment of recent improvements. Int. J. Health Geogr. 2012, 11, 50. [Google Scholar] [CrossRef] [PubMed]
- Kanuganti, S.; Sarkar, A.K.; Singh, A.P. Quantifying accessibility to health care using two-step floating catchment area method (2sfca): A case study in Rajasthan. Transp. Res. Procedia 2016, 17, 391–399. [Google Scholar] [CrossRef]
- Tao, Z.; Cheng, Y.; Liu, J. The hierarchical two-step floating catchment area (2sfca) method: Measuring the spatial accessibility to hierarchical healthcare facilities in Shenzhen, China. Int. J. Equity Health 2020, 19, 164. [Google Scholar]
- Chen, L.; Chen, T.; Lan, T.; Chen, C.; Pan, J. The contributions of population distribution, healthcare resourcing, and transportation infrastructure to spatial accessibility of health care. J. Health Care Organ. Provis. Financ. 2023, 60, 00469580221146041. [Google Scholar]
- Liu, L.; Lyu, H.; Zhao, Y.; Zhou, D. An Improved Two-Step Floating Catchment Area (2SFCA) Method for Measuring Spatial Accessibility to Elderly Care Facilities in Xi’an, China. Int. J. Environ. Res. Public Health 2022, 19, 11465. [Google Scholar] [CrossRef]
- Wang, F.; Luo, W. From 2SFCA to i2SFCA: Integration, derivation, and validation. Int. J. Geo-Graph. Inf. Sci. 2015, 29, 2155–2171. [Google Scholar]
- Luo, W.; Qi, Y. An enhanced two-step floating catchment area (e2sfca) method for measuring spatial accessibility to primary care physicians. Health Place 2009, 15, 1100–1107. [Google Scholar]
- Chen, X.; Jia, P. A comparative analysis of accessibility measures by the two-step floating catchment area (2SFCA) method. Int. J. Geogr. Inf. Sci. 2019, 33, 1739–1758. [Google Scholar]
- Tao, Z.; Cheng, Y. Modeling the spatial accessibility of older adults to healthcare services in Beijing, China. Environ. Plan. B Urban Anal. City Sci. 2019, 46, 1132–1147. [Google Scholar] [CrossRef]
- Martin, R.W. Spatial mismatch and the structure of American metropolitan areas, 1970–2000. J. Reg. Sci. 2004, 44, 467–488. [Google Scholar] [CrossRef]
- Wang, E.; Song, J.; Xu, T. “Spatial bond” to “spatial mismatch”: An assessment of changing jobs–housing relationship in Beijing. Habitat Int. 2011, 35, 398–409. [Google Scholar] [CrossRef]
- Li, T.; Long, H.; Zhang, Y.; Tu, S.; Ge, D.; Li, Y.; Hu, B. Analysis of the spatial mismatch of grain production and farmland resources in China based on the potential crop rotation system. Land Use Policy 2017, 60, 26–36. [Google Scholar] [CrossRef]
- Feng, Z.; Liu, C.; Guan, X.; Mor, V. China’s rapidly aging population creates policy challenges in shaping a viable long-term care system. Health Aff. 2012, 31, 2764–2773. [Google Scholar] [CrossRef]
- Higo, M.; Khan, H.T. Global population aging: Unequal distribution of risks in later life between developed and developing countries. Glob. Soc. Policy 2014, 15, 146–166. [Google Scholar] [CrossRef]
- Wang, F. Measurement, optimization, and impact of health care accessibility: A methodological review. Ann. Assoc. Am. Geogr. 2012, 102, 1104–1112. [Google Scholar] [CrossRef]
- Li, M.; Zhang, Y.; Zhang, Z.; Zhang, Y.; Zhou, L.; Chen, K. Rural-urban differences in the long-term care of disabled older adults in China. PLoS ONE 2013, 8, 11. [Google Scholar]
- Xie, F.; Deng, A.; Chen, J.; Xiong, R. Factors associated with willingness to receive a novel community care service for older people in Foshan, China: A cross-sectional study. BMC Health Serv. Res. 2022, 22, 575. [Google Scholar] [CrossRef]
- Zhao, P.; Li, S.; Liu, D. Unequable spatial accessibility to hospitals in developing megacities: New evidence from Beijing. Health Place 2020, 65, 102406. [Google Scholar] [CrossRef]
- Ye, Y.; LeGates, R.; Qin, B. Coordinated urban-rural development planning in China: The Chengdu model. J. Am. Plan. Assoc. 2013, 79, 125–137. [Google Scholar] [CrossRef]
- Zhang, S.; Song, X.; Wei, Y.; Deng, W. Spatial equity of multilevel healthcare in the metropolis of Chengdu, China: A new assessment approach. Int. J. Environ. Res. Public Health 2019, 16, 493. [Google Scholar] [CrossRef] [PubMed]
- Li, H.; Duan, J.; Wu, Y.; Gao, S.; Li, T. Spatial patterns of service facilities based on internet big data: A case study on Chengdu. Math. Probl. Eng. 2021, 2021, 9283185. [Google Scholar]
- Zhang, Y.; Miao, F. The Cost-Benefit Analysis of the Long-Term Care Insurance: An Evaluation of the Pilot Program in Chengdu, China. 2022.
- Xie, J.; Wu, E.Q.; Wang, S.; Cheng, T.; Zhou, Z.; Zhong, J.; Liu, L. Real-world data for healthcare research in China: Call for actions. Value Health Reg. Issues 2022, 27, 72–81. [Google Scholar]
- Aljunid, S.M.; Srithamrongsawat, S.; Chen, W.; Bae, S.J.; Pwu, R.F.; Ikeda, S.; Xu, L. Health-care data collecting, sharing, and using in Thailand, China mainland, South Korea, Taiwan, Japan, and Malaysia. Value Health 2012, 15, S132–S138. [Google Scholar] [CrossRef]
- Luo, W.; Wang, F. Measures of spatial accessibility to health care in a gis environment: Synthesis and a case study in the Chicago region. Environ. Plan. B Plan. Des. 2003, 30, 865–884. [Google Scholar]
- Dai, D. Black residential segregation, disparities in spatial access to health care facilities, and late-stage breast cancer diagnosis in metropolitan Detroit. Health Place 2010, 16, 1038–1052. [Google Scholar] [CrossRef]
- Chengdu Health Commission on Aging. 2020. Available online: https://cdwjw.chengdu.gov.cn (accessed on 19 December 2024).
- Wang, F.; Xu, Y. Estimating od travel time matrix by google maps api: Implementation, advantages, and implications. Ann. GIS 2011, 17, 199–209. [Google Scholar] [CrossRef]
- Chengdu Transportation Statistics, AMap. 2021. Available online: https://report.amap.com/ (accessed on 19 December 2024).
- Gu, W.; Wang, X.; McGregor, S.E. Optimization of preventive health care facility locations. Int. J. Health Geogr. 2010, 9, 17. [Google Scholar]
- Twelfth Five-Year Plan for Healthcare. Non-Public Technical Report. Chengdu Health Commission. Available online: http://cdwjw.chengdu.gov.cn/ (accessed on 19 December 2024).
- Satisfaction White Book. CDHSA, 2020, 2021. Non-Public Technical Report. Available online: https://cdyb.chengdu.gov.cn (accessed on 19 December 2024).
- Salerno, F.; Gaetano, V.; Gianni, T. Urbanization and climate change impacts on surface water quality: Enhancing the resilience by reducing impervious surfaces. Water Res. 2018, 144, 491–502. [Google Scholar]
- Liu, C.Y.; Painter, G. Immigrant settlement and employment suburbanization in the us: Is there a spatial mismatch? Urban Stud. 2012, 49, 979–1002. [Google Scholar]
- Yang, J.; Huang, X. 30 m annual land cover dataset and its dynamics in China from 1985 to 2022. Earth Syst. Sci. Data 2023, 13, 3907–3925. [Google Scholar]
- Wu, B.; Cohen, M.A.; Cong, Z.; Kim, K.; Peng, C. Improving Care for Older Adults in China: Development of Long-Term Care Policy and System. Res. Aging 2021, 43, 123–126. [Google Scholar] [CrossRef] [PubMed]
- Wong, Y.C.; Leung, J. Long-term Care in China: Issues and Prospects. J. Gerontol. Soc. Work 2012, 55, 570–586. [Google Scholar] [PubMed]
- Harrington, C.; Swan, J.H.; Grant, L.A. Nursing home bed capacity in the states,1978–86. Health Care Financ. Rev. 1988, 9, 81–97. [Google Scholar]
- Corden, A. Geographical development of the long-term market for elderly people. Trans. Inst. Br. Geogr. 1992, 17, 80–94. [Google Scholar]
- Rivera-Hernández, M.; Yamashita, T.; Kinney, J.M. Identifying naturally occurring retirement communities: A spatial analysis. J. Gerontol. Ser. B Psychol. Sci. Soc. Sci. 2014, 70, 619–627. [Google Scholar]
- Cai, W.; Deng, Y.; Zhang, Q.; Yang, H.; Huo, X. Does income inequality impair health? Evidence from rural China. Agriculture 2021, 11, 203. [Google Scholar] [CrossRef]
- Xie, E. Income-related inequalities of health and health care utilization. Front. Econ. China 2011, 6, 131–156. [Google Scholar]
- Notice on Matters Related to the Payment Standards of Long-Term Care Insurance for Urban Employees, CDHSA. 2022. Available online: https://cdyb.chengdu.gov.cn/ylbzj/c128998/2022-06/23/content_f7c7a05d5d3144bebbd889a451c97243.shtml (accessed on 19 December 2024).
- Notice on Matters Related to the Payment Standards of Long-Term Care Insurance for Urban-Rural Residents, CDHSA. 2022. Available online: https://cdyb.chengdu.gov.cn/ylbzj/c128998/2022-06/23/content_2d1055daa3744e4ea07fb3fa0b8a2f9f.shtml (accessed on 19 December 2024).
- Notice on Adjusting the Benefit Standards for Institutional Care Under Long-Term Care Insurance, CDHSA. 2022. Available online: https://cdyb.chengdu.gov.cn/ylbzj/c128998/2022-12/23/content_23c611b982974c14b98f6ef02efd820b.shtml (accessed on 19 December 2024).
- Li, W.; Zhang, L.; Lee, I.; Gkartzios, M. Overview of Social Policies for Town and Village Development in Response to Rural Shrinkage in East Asia: The Cases of Japan, South Korea and China. Sustainability 2023, 15, 10781. [Google Scholar] [CrossRef]
- Zheng, Y.; Tan, J.; Huang, Y.; Wang, Z. The Governance Path of Urban–Rural Integration in Changing Urban–Rural Relationships in the Metropolitan Area: A Case Study of Wuhan, China. Land 2022, 11, 1334. [Google Scholar] [CrossRef]
- Zhou, Q.; He, Q.; Eggleston, K.; Liu, G.G. Urban-rural health insurance integration in China: Impact on health care utilization, financial risk protection, and health status. Appl. Econ. 2021, 54, 2491–2509. [Google Scholar] [CrossRef]
- Pan, J.; Deng, Y.; Yang, Y.; Zhang, Y. Location-allocation modelling for rational health planning: Applying a two-step optimization approach to evaluate the spatial accessibility improvement of newly added tertiary hospitals in a metropolitan city of China. Soc. Sci. Med. 2023, 338, 116296. [Google Scholar]
- Government Documents 2014[86], NHC China. Available online: https://www.gov.cn/zhengce/2016-05/22/content_5075661.htm (accessed on 19 December 2024).
- Government Documents 2019[49], NHC China. Available online: https://www.gov.cn/zhengce/zhengceku/2019-11/18/content_5453052.htm (accessed on 19 December 2024).
- Basu, R.; Steiner, A.C.; Stevens, A.B. Long-Term Care Market Trend and Patterns of Caregiving in the U.S. J. Aging Soc. Policy 2021, 34, 20–37. [Google Scholar] [PubMed]


Disclaimer/Publisher’s Note: The statements, opinions and data contained in all publications are solely those of the individual author(s) and contributor(s) and not of MDPI and/or the editor(s). MDPI and/or the editor(s) disclaim responsibility for any injury to people or property resulting from any ideas, methods, instructions or products referred to in the content. |
© 2025 by the authors. Licensee MDPI, Basel, Switzerland. This article is an open access article distributed under the terms and conditions of the Creative Commons Attribution (CC BY) license (https://creativecommons.org/licenses/by/4.0/).