
Elevator Selection Methodology for Existing Residential Buildings Oriented Toward Living Quality Improvement


Abstract
1. Introduction
2. Comprehensive Methodology for Elevator Configuration Selection in Existing Multi-Story Residential Buildings
2.1. Experimental, Investigated, and Survey Subjects
2.2. Factors Influencing Elevator Type Selection
2.3. Evaluation Process of the Comprehensive Selection Methodology
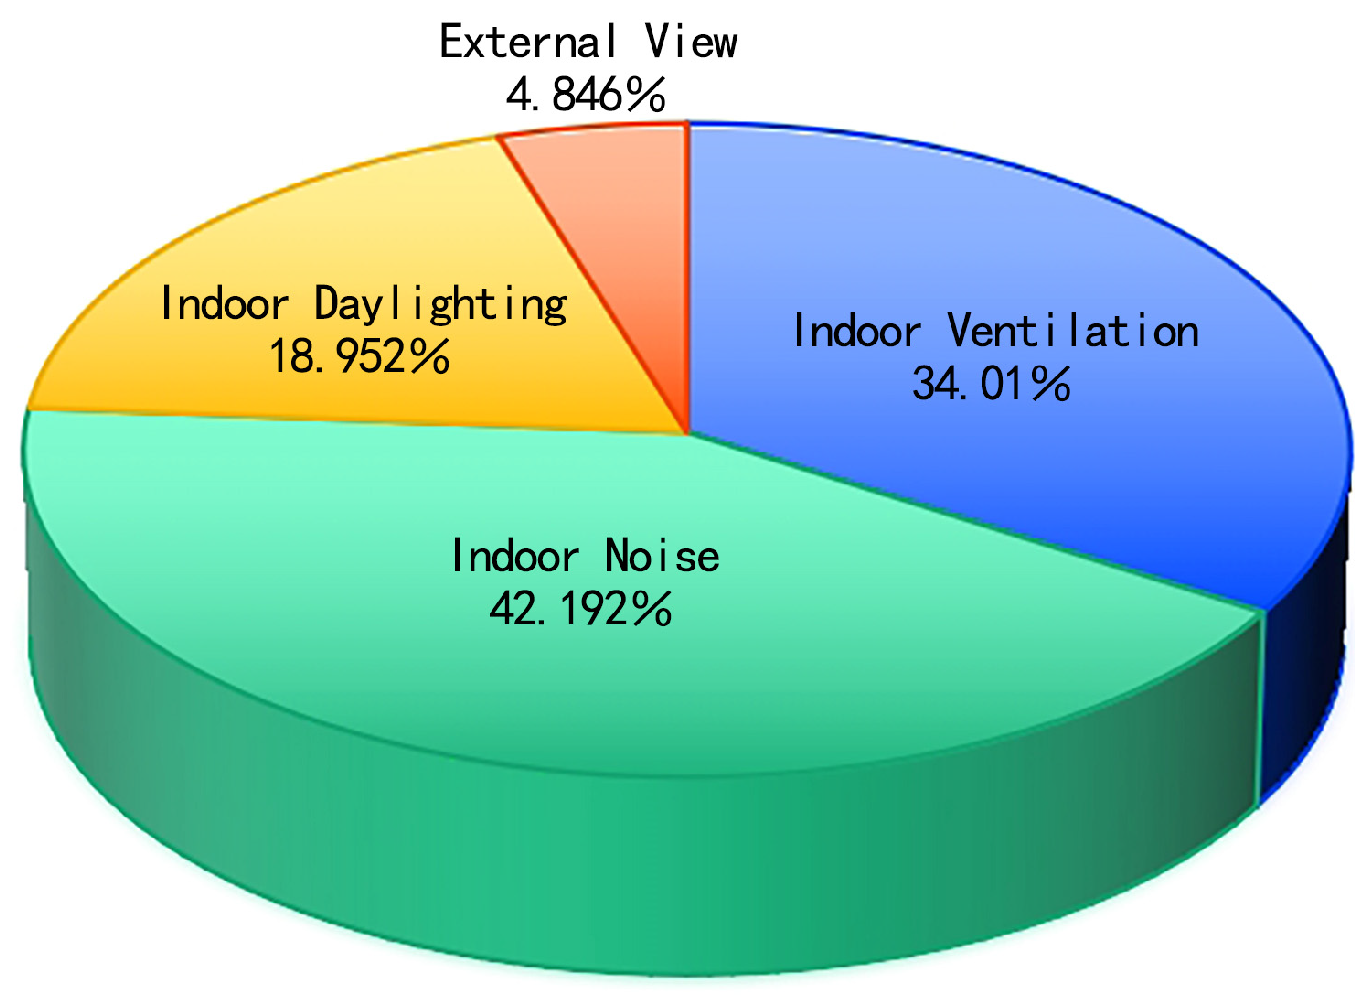
3. Weights of Factors in the Comprehensive Selection Methodology
4. Evaluation Criteria in the Comprehensive Selection Methodology
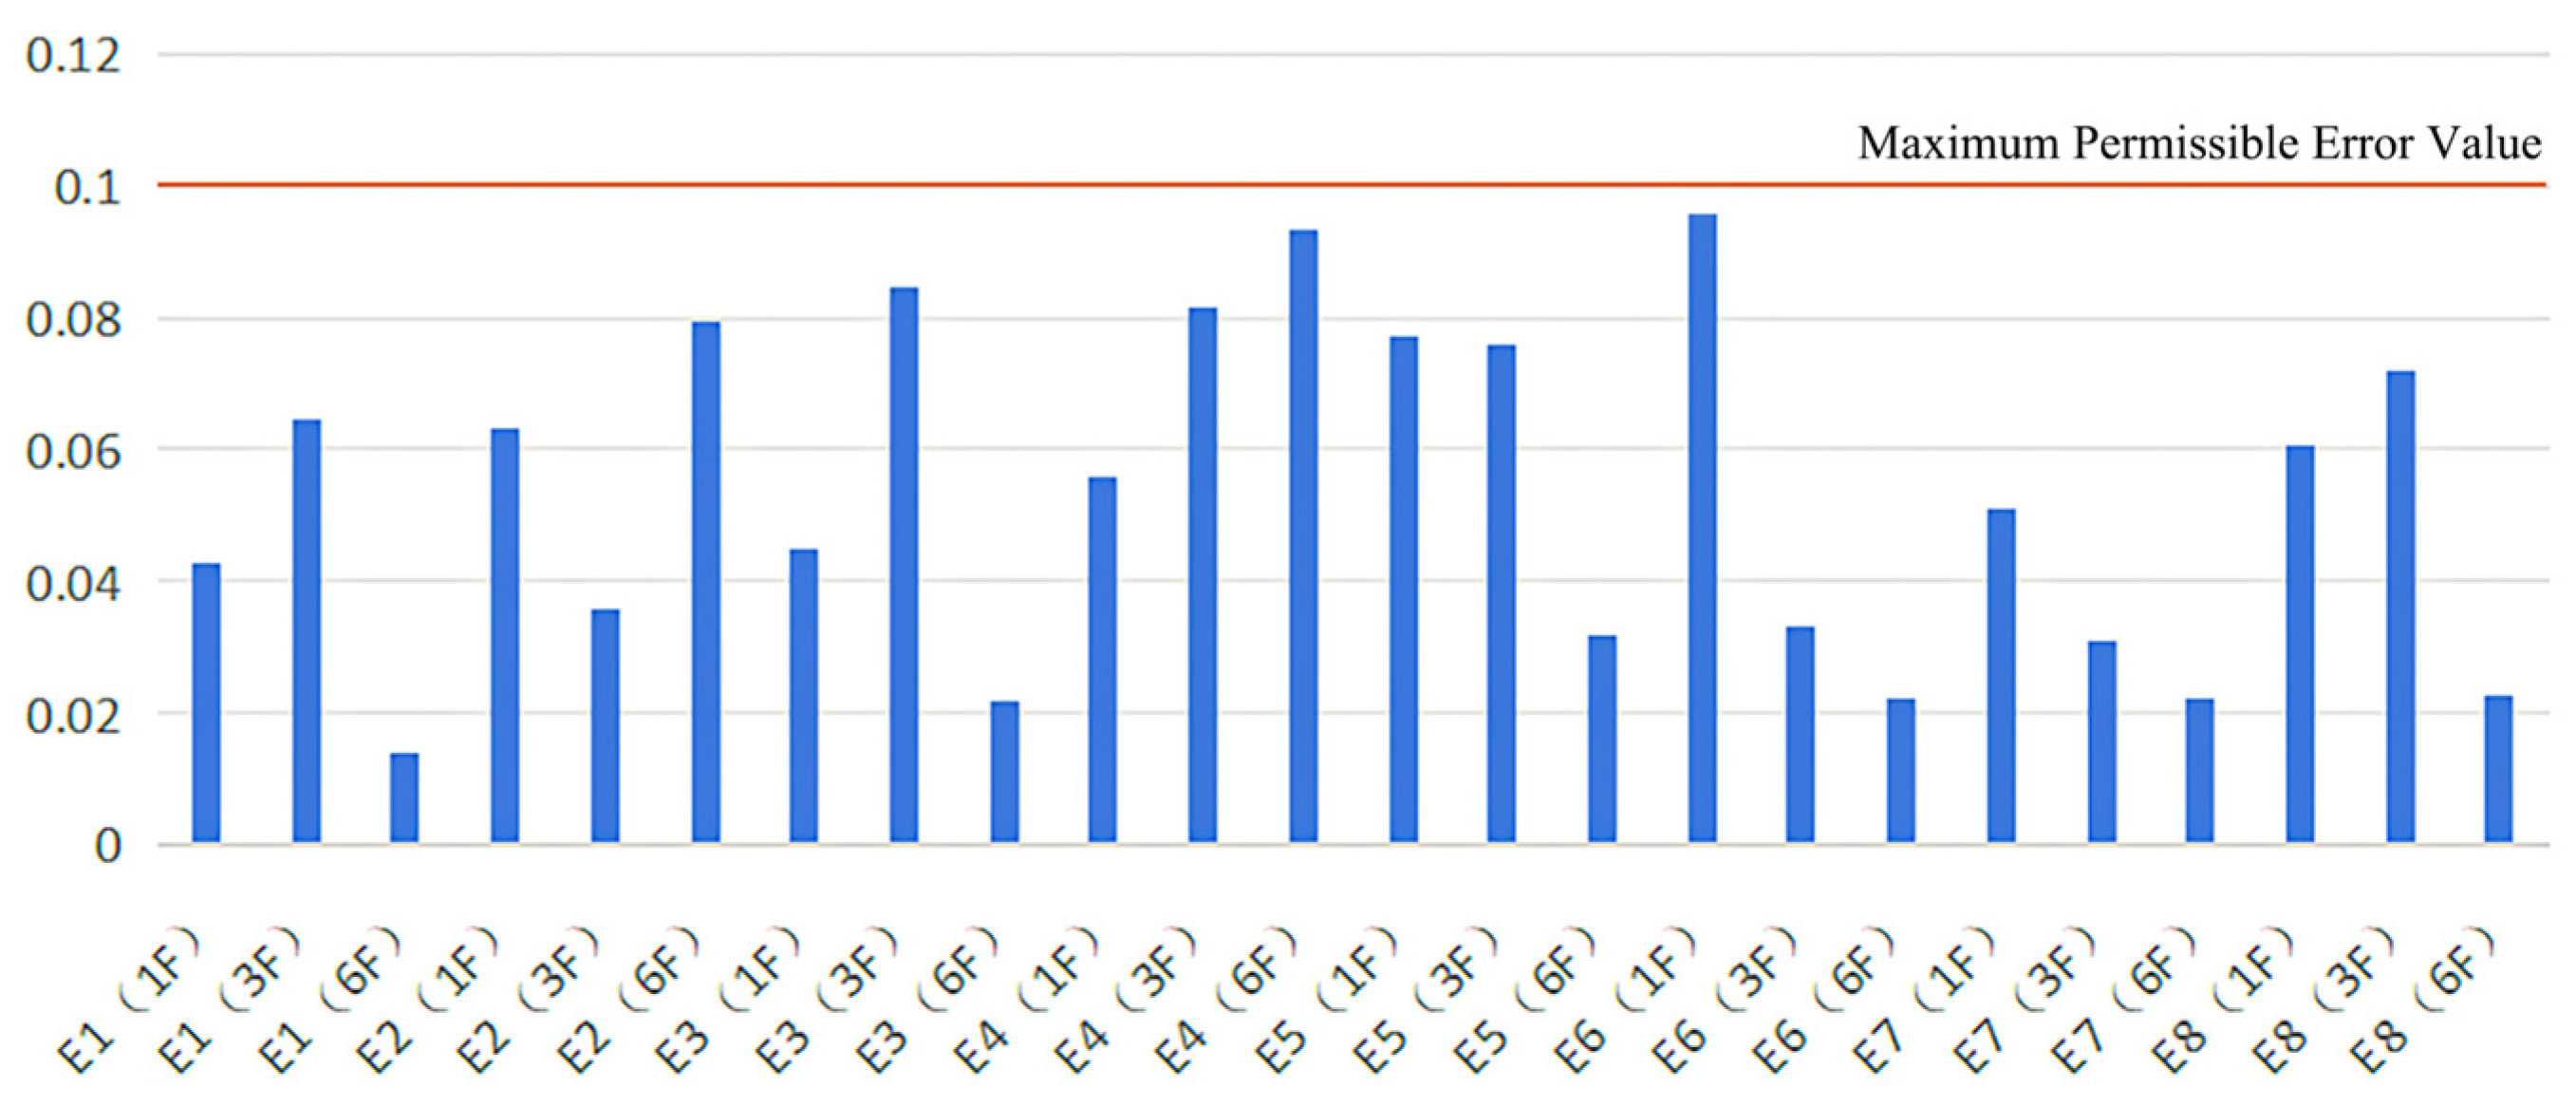
4.1. Evaluation Results of Indoor Ventilation
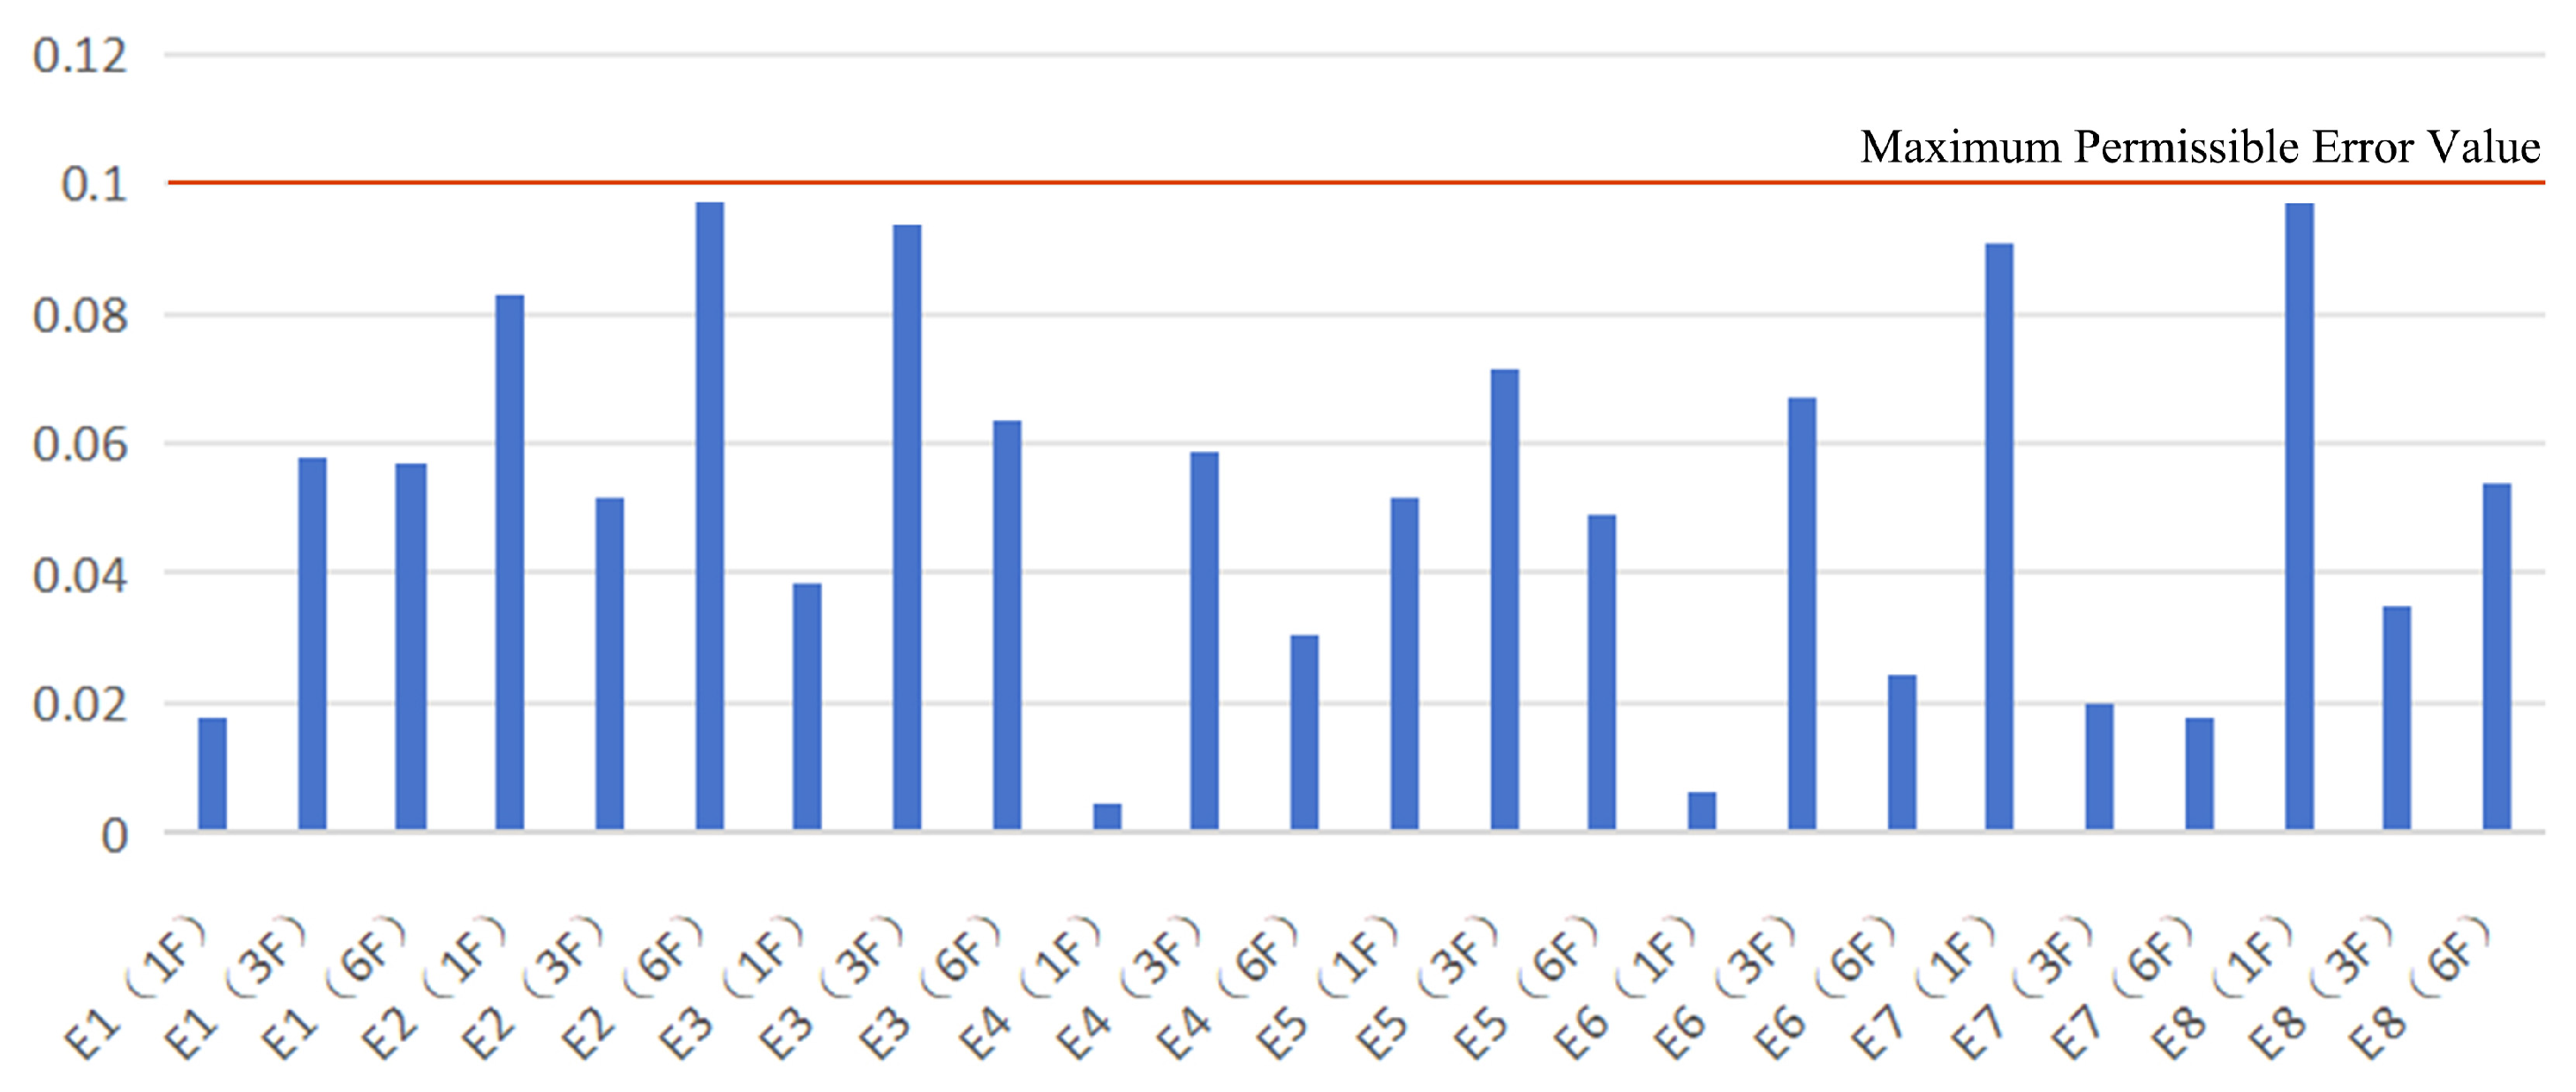
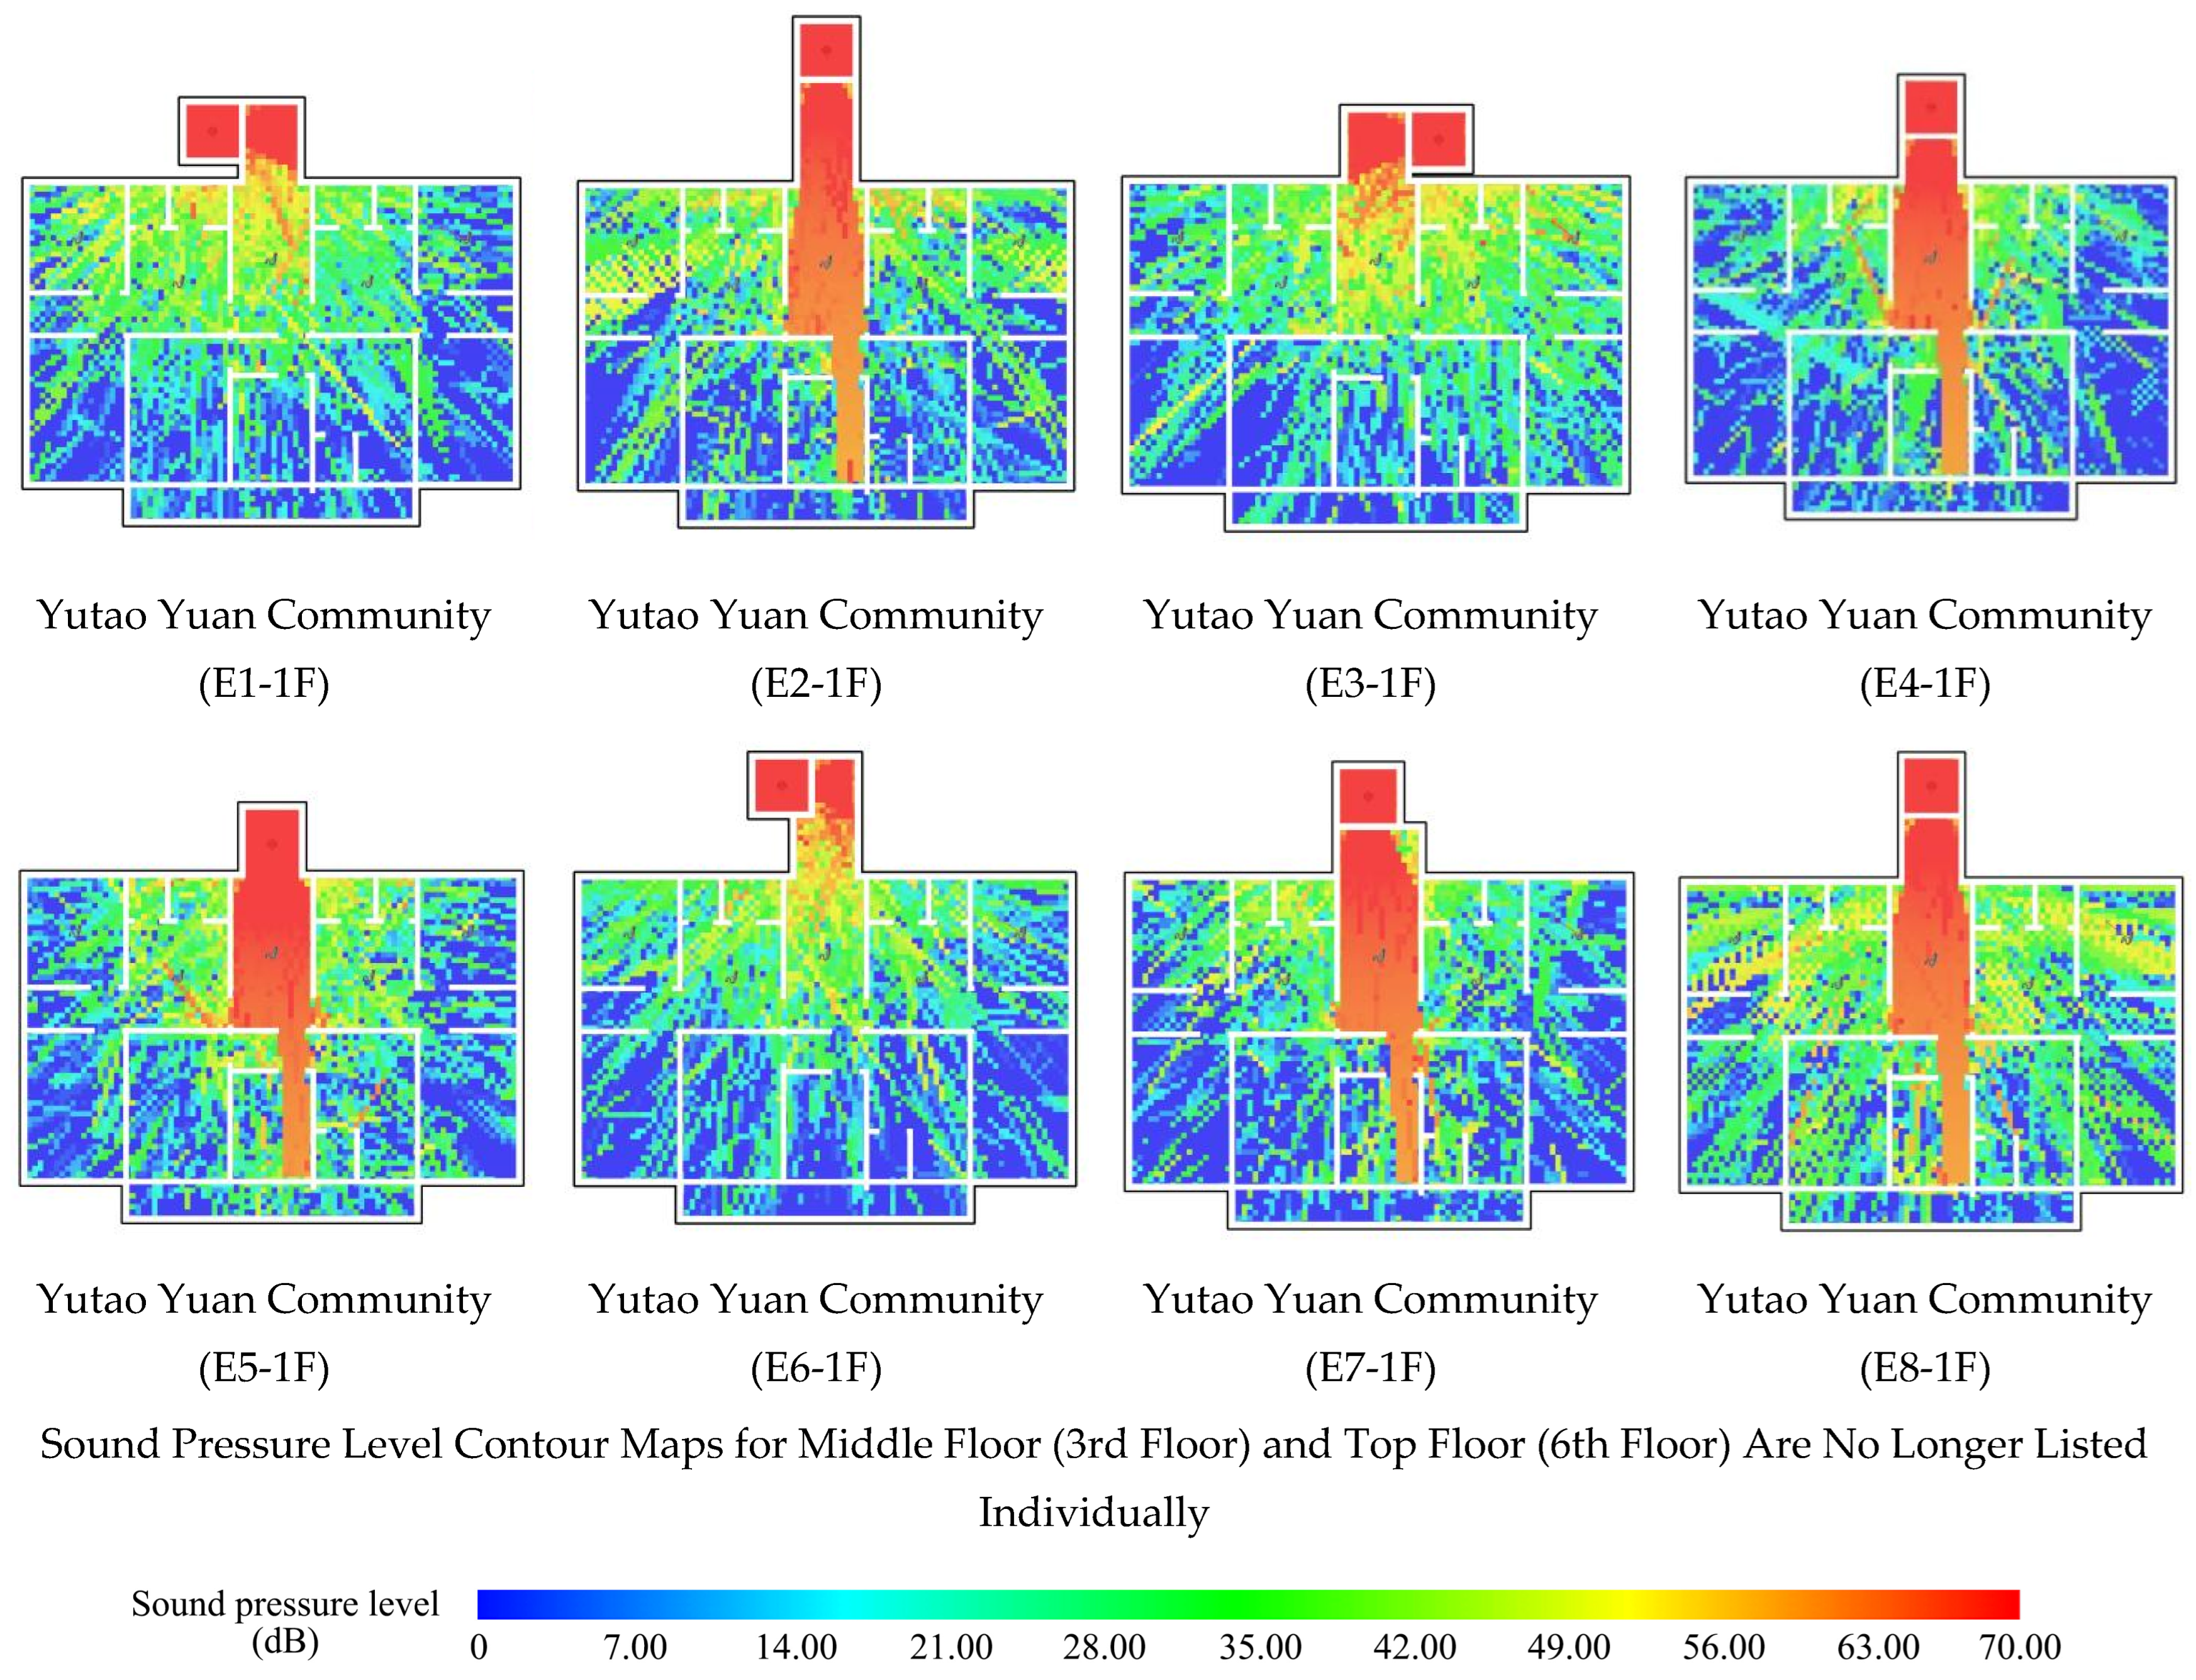
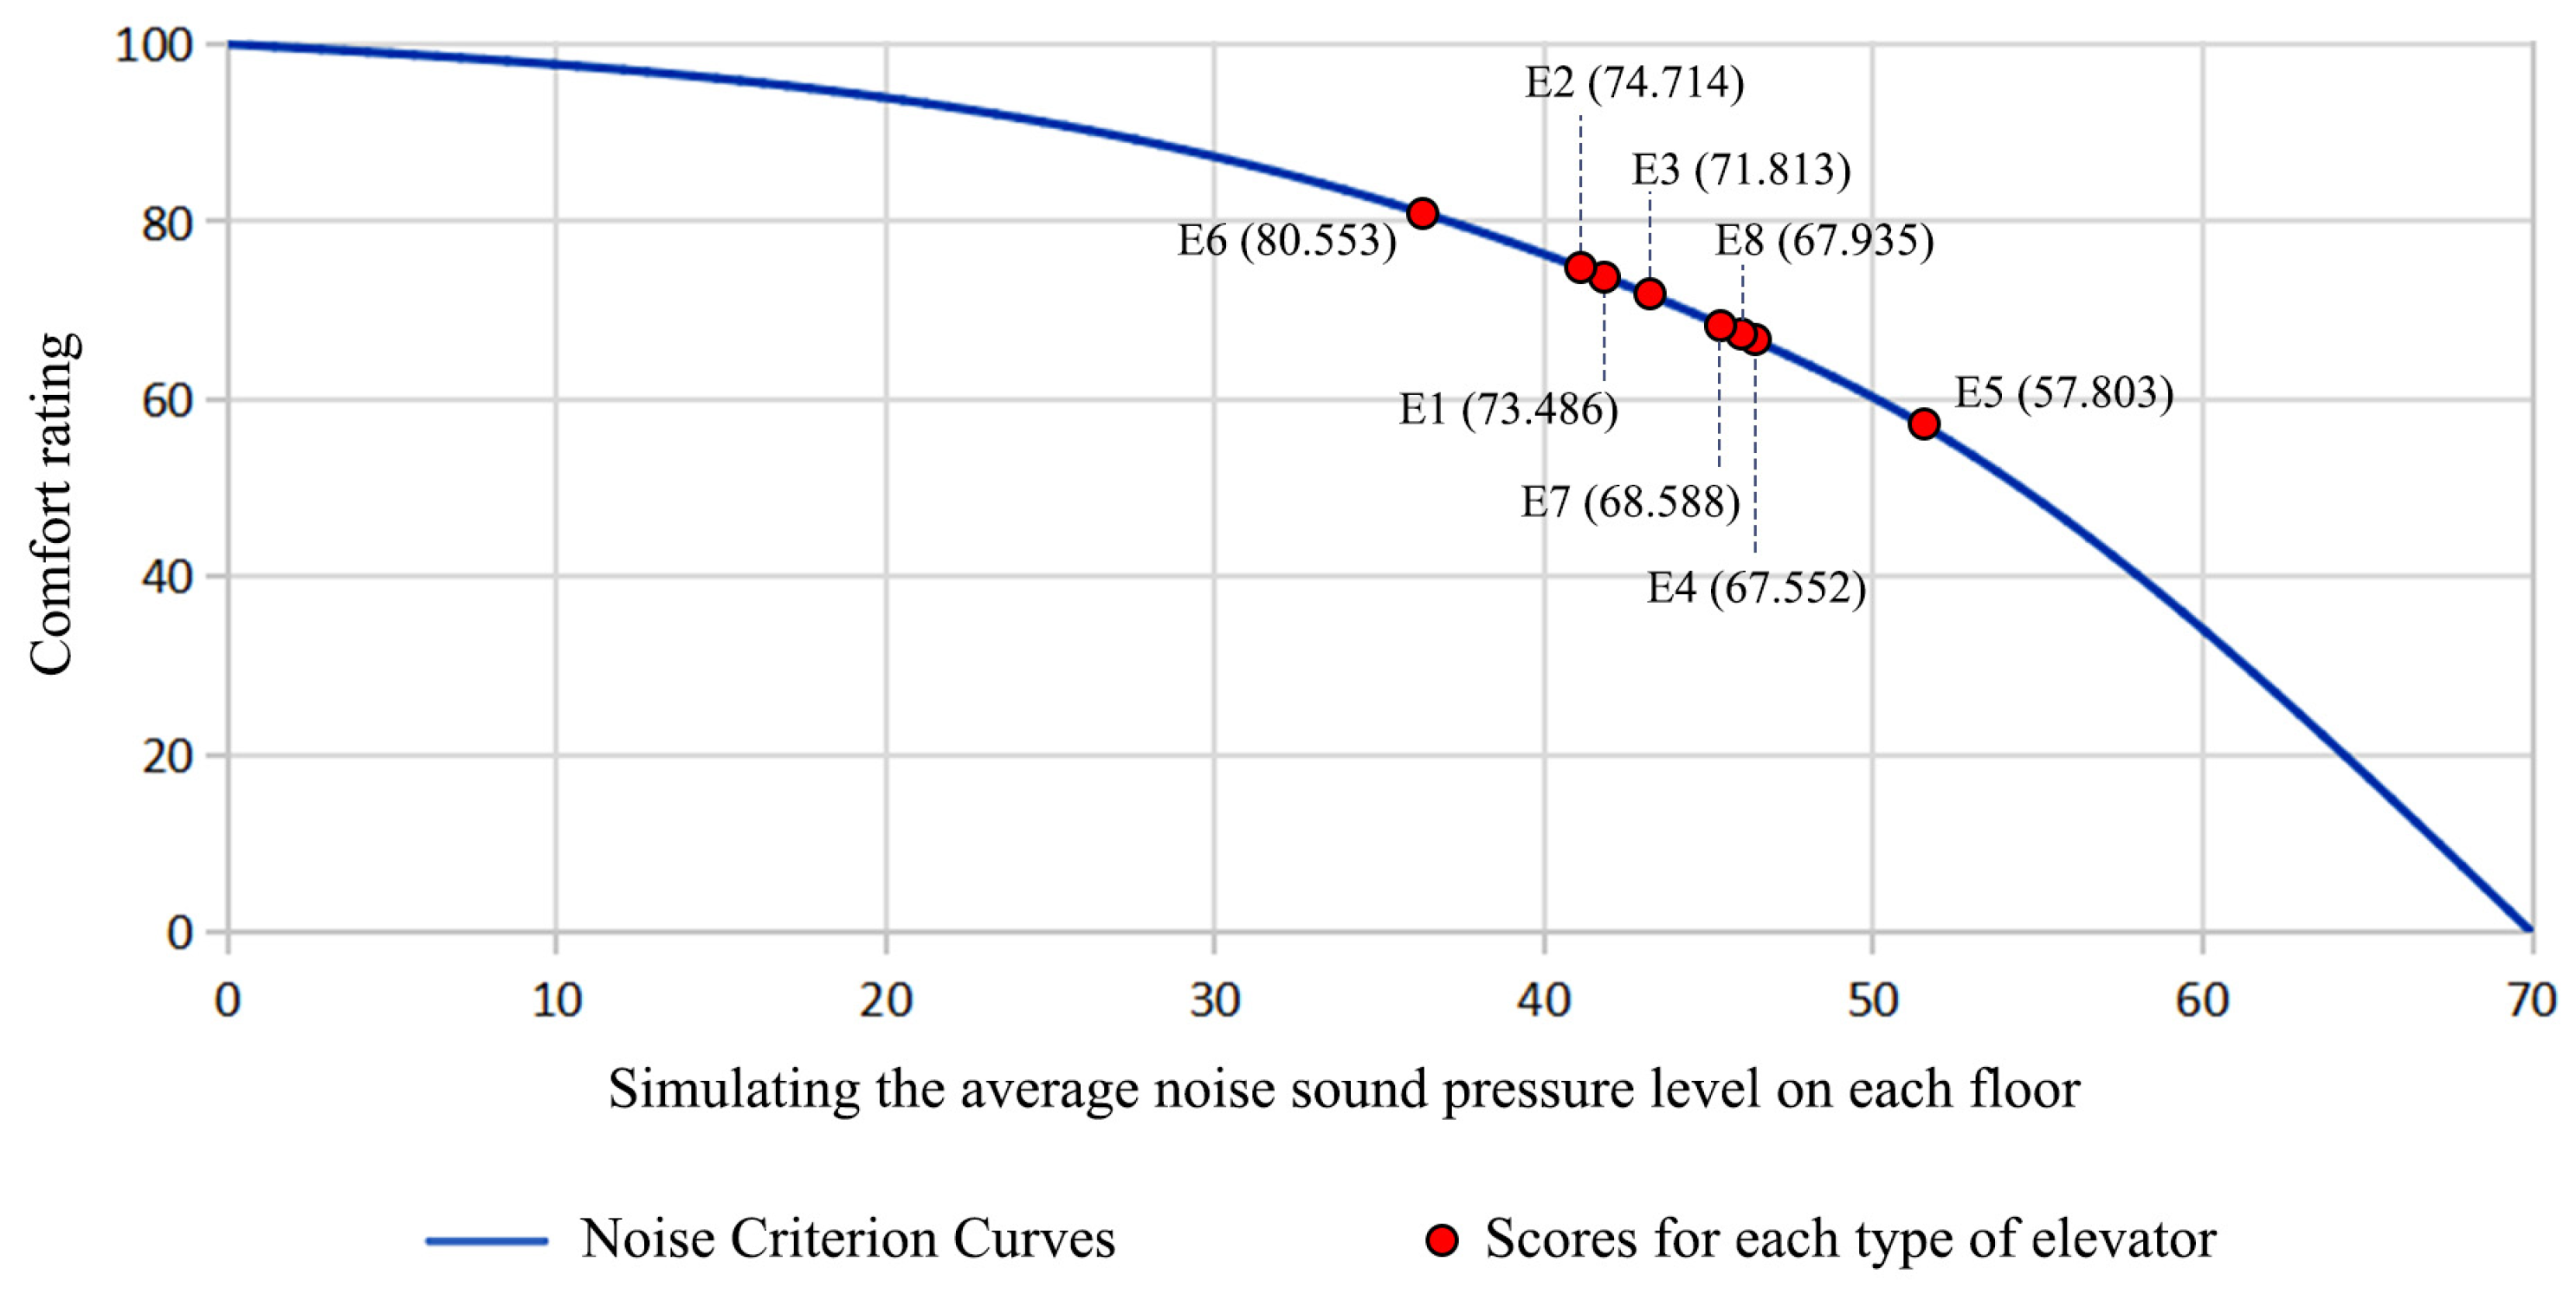
4.2. Evaluation Results of Indoor Noise
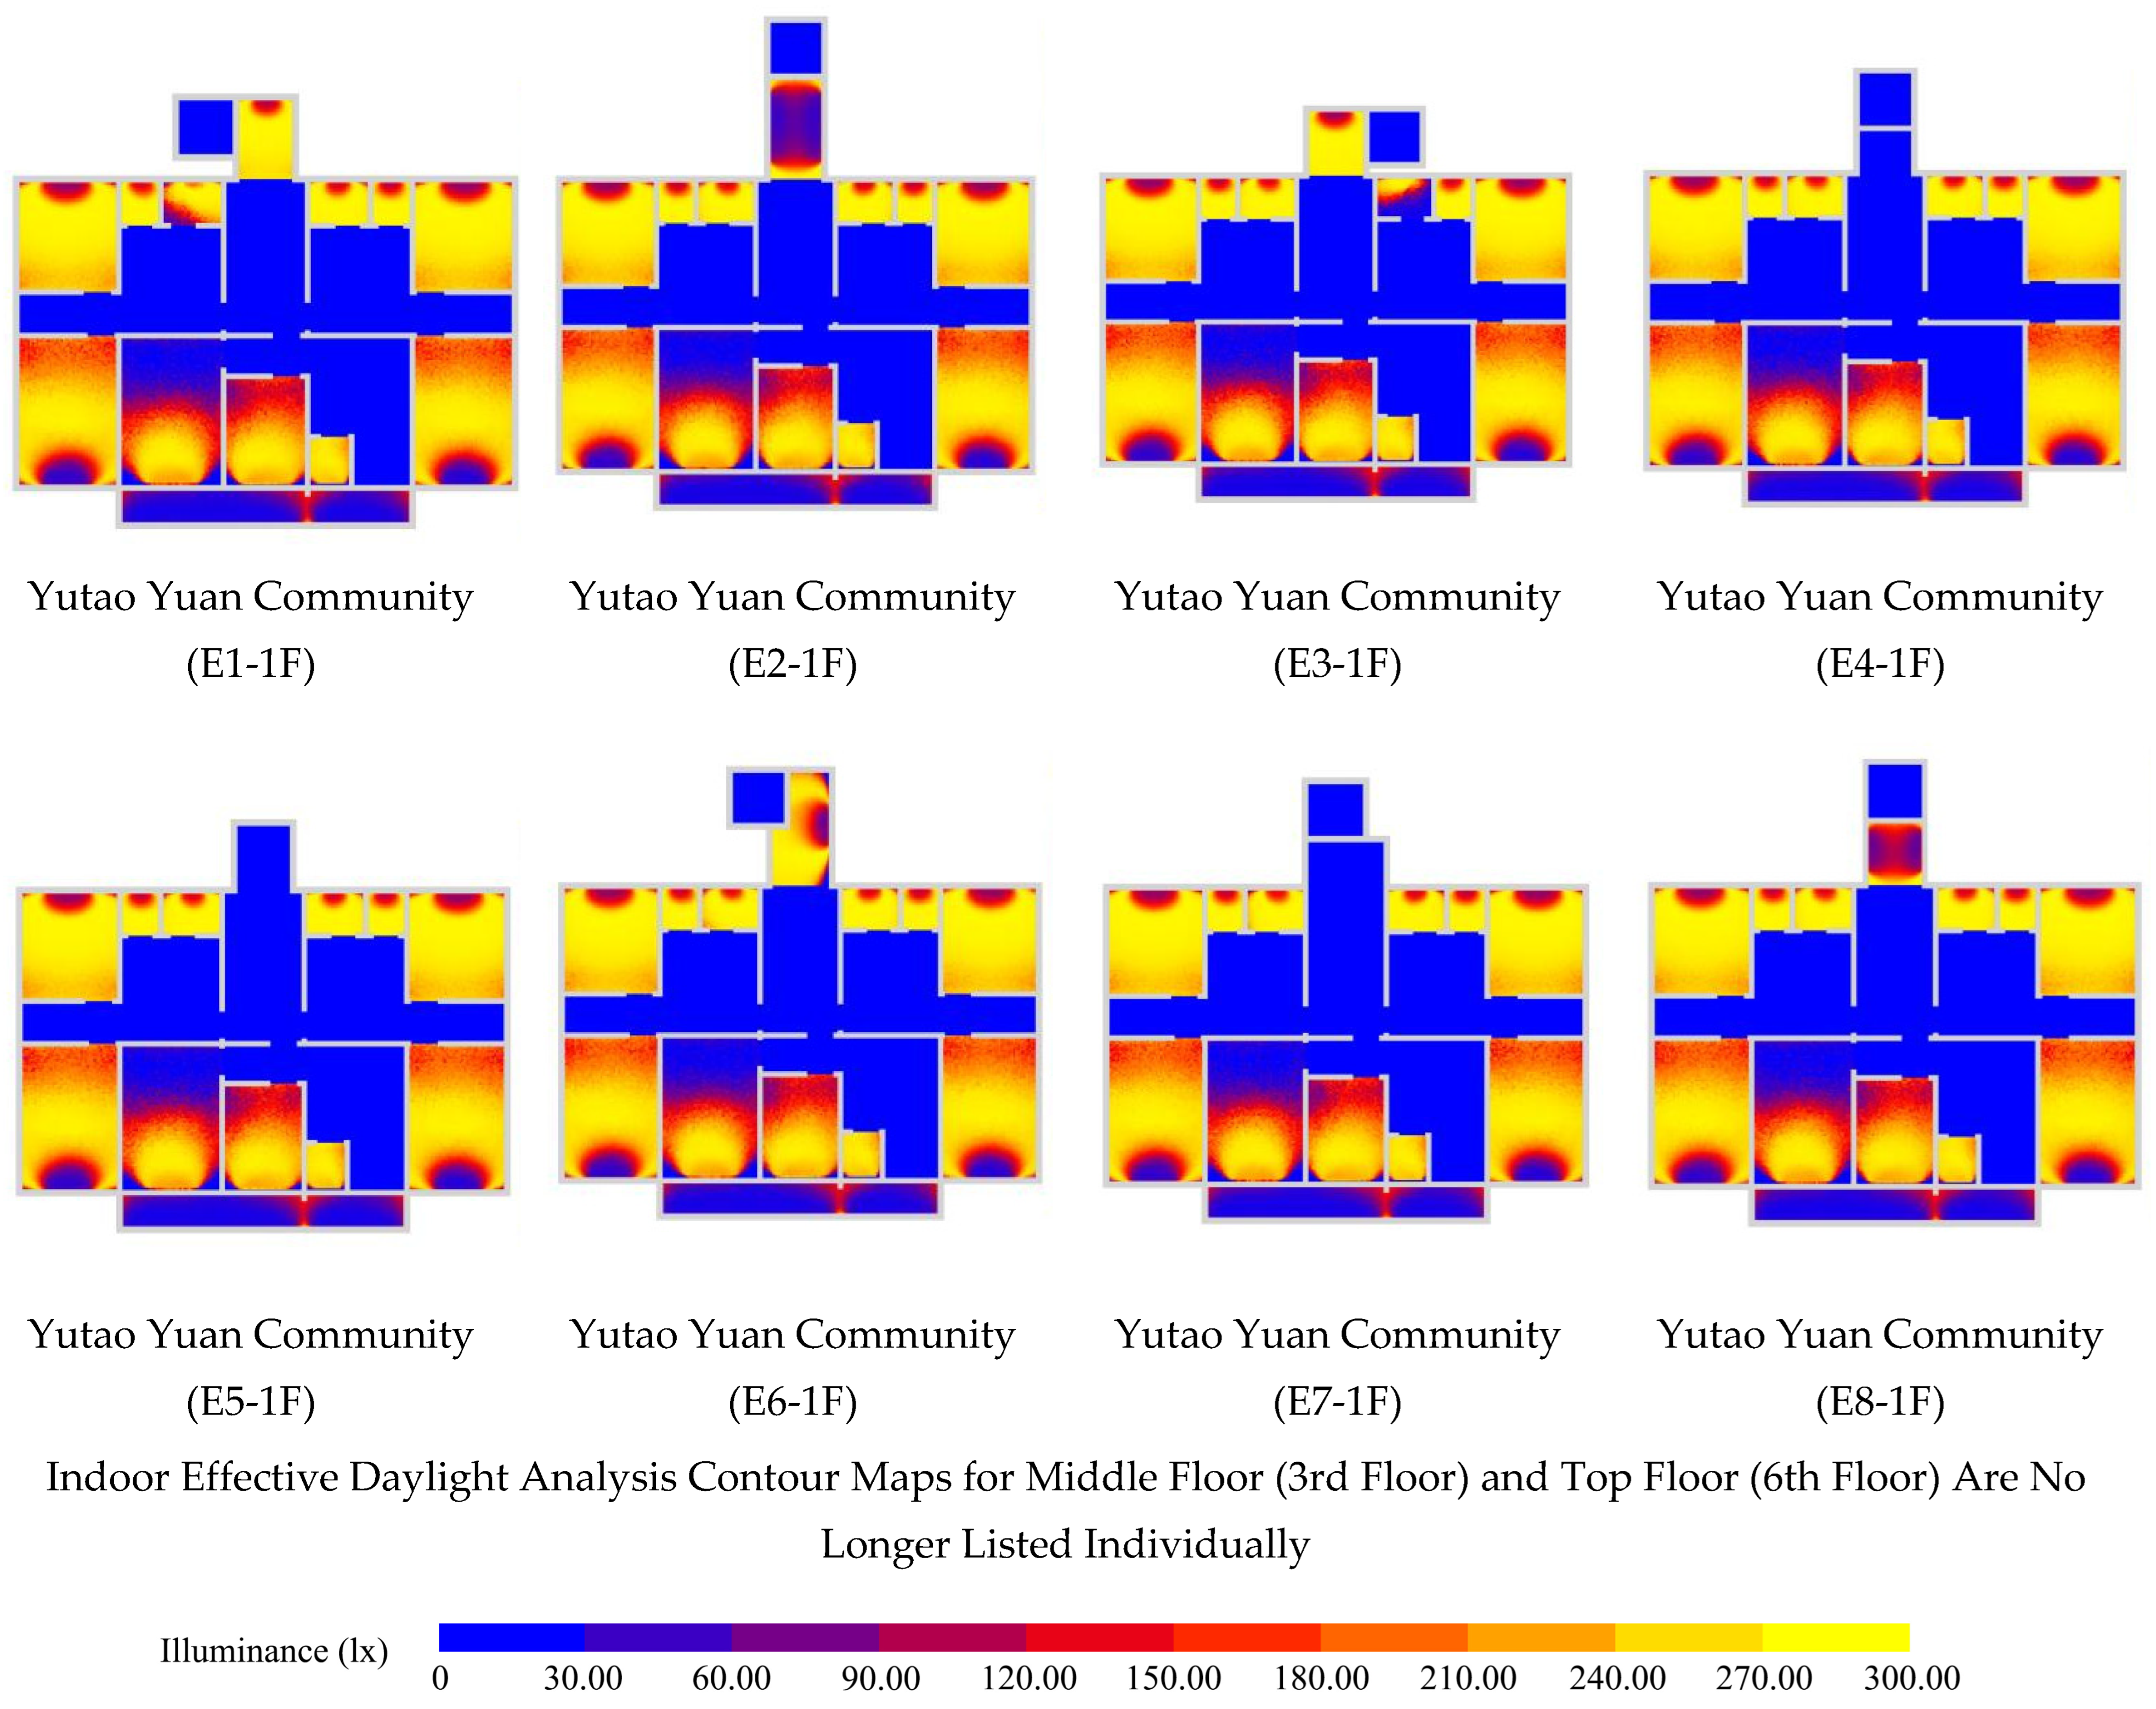
4.3. Evaluation Results of Indoor Daylighting
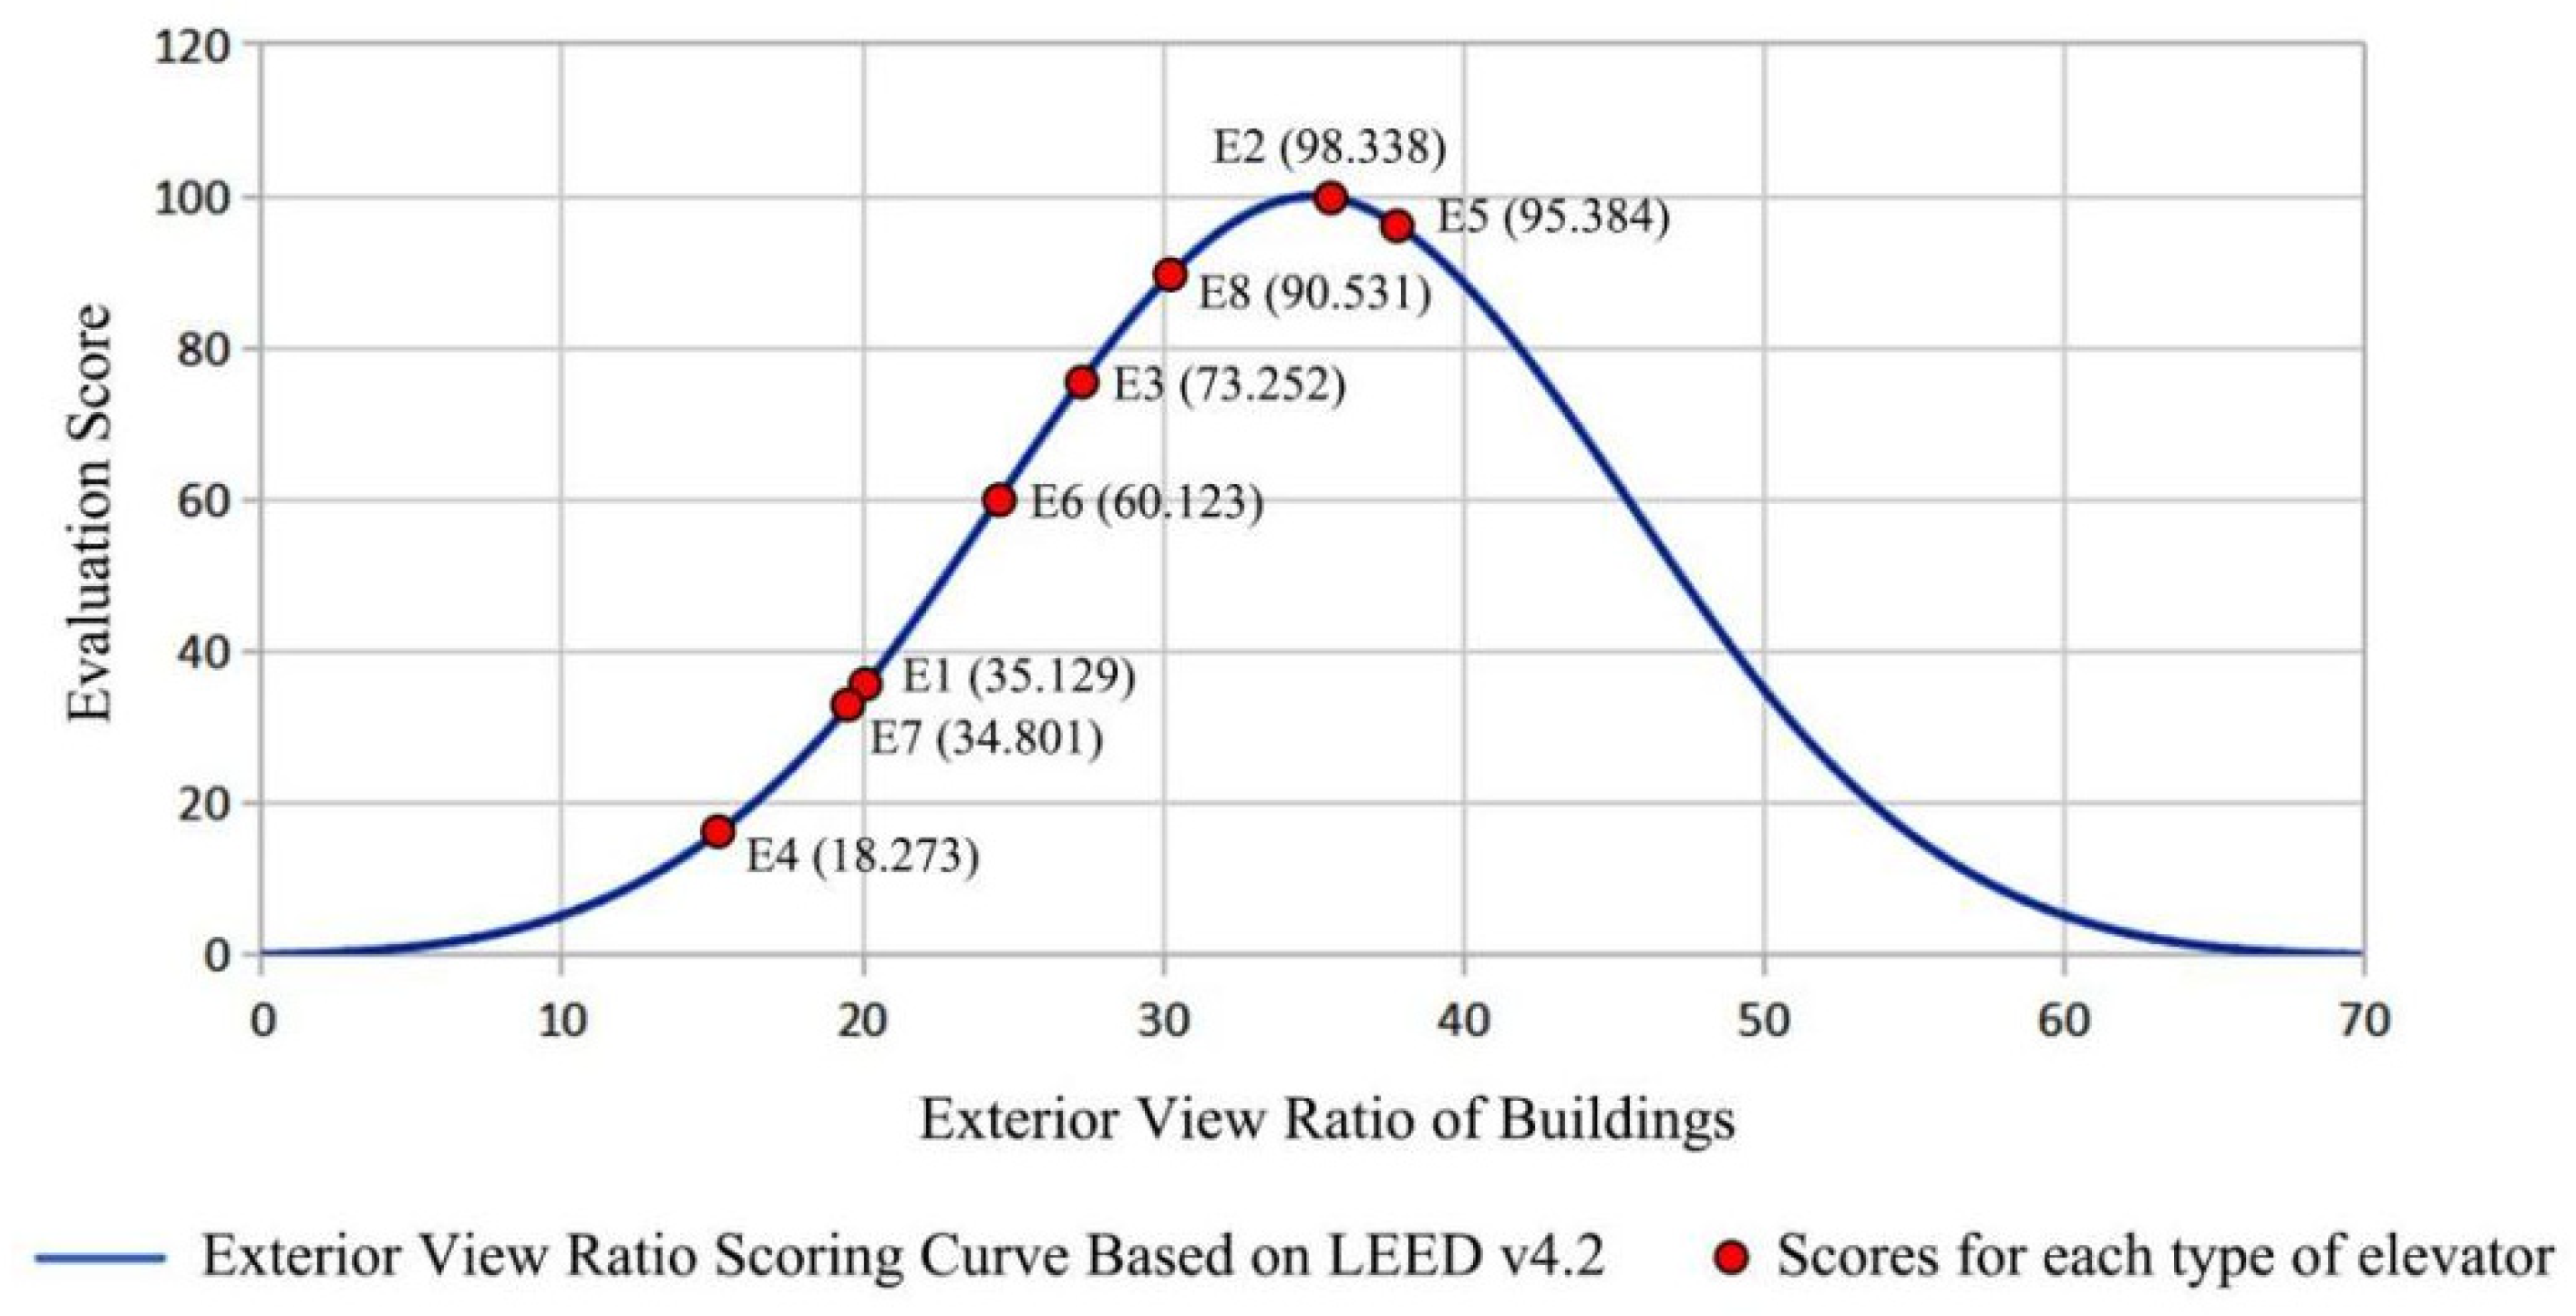
4.4. Evaluation Results of External Visual Access
4.5. Optimal Elevator Selection for the Typical Building Type in Yutao Garden Community
5. Conclusions
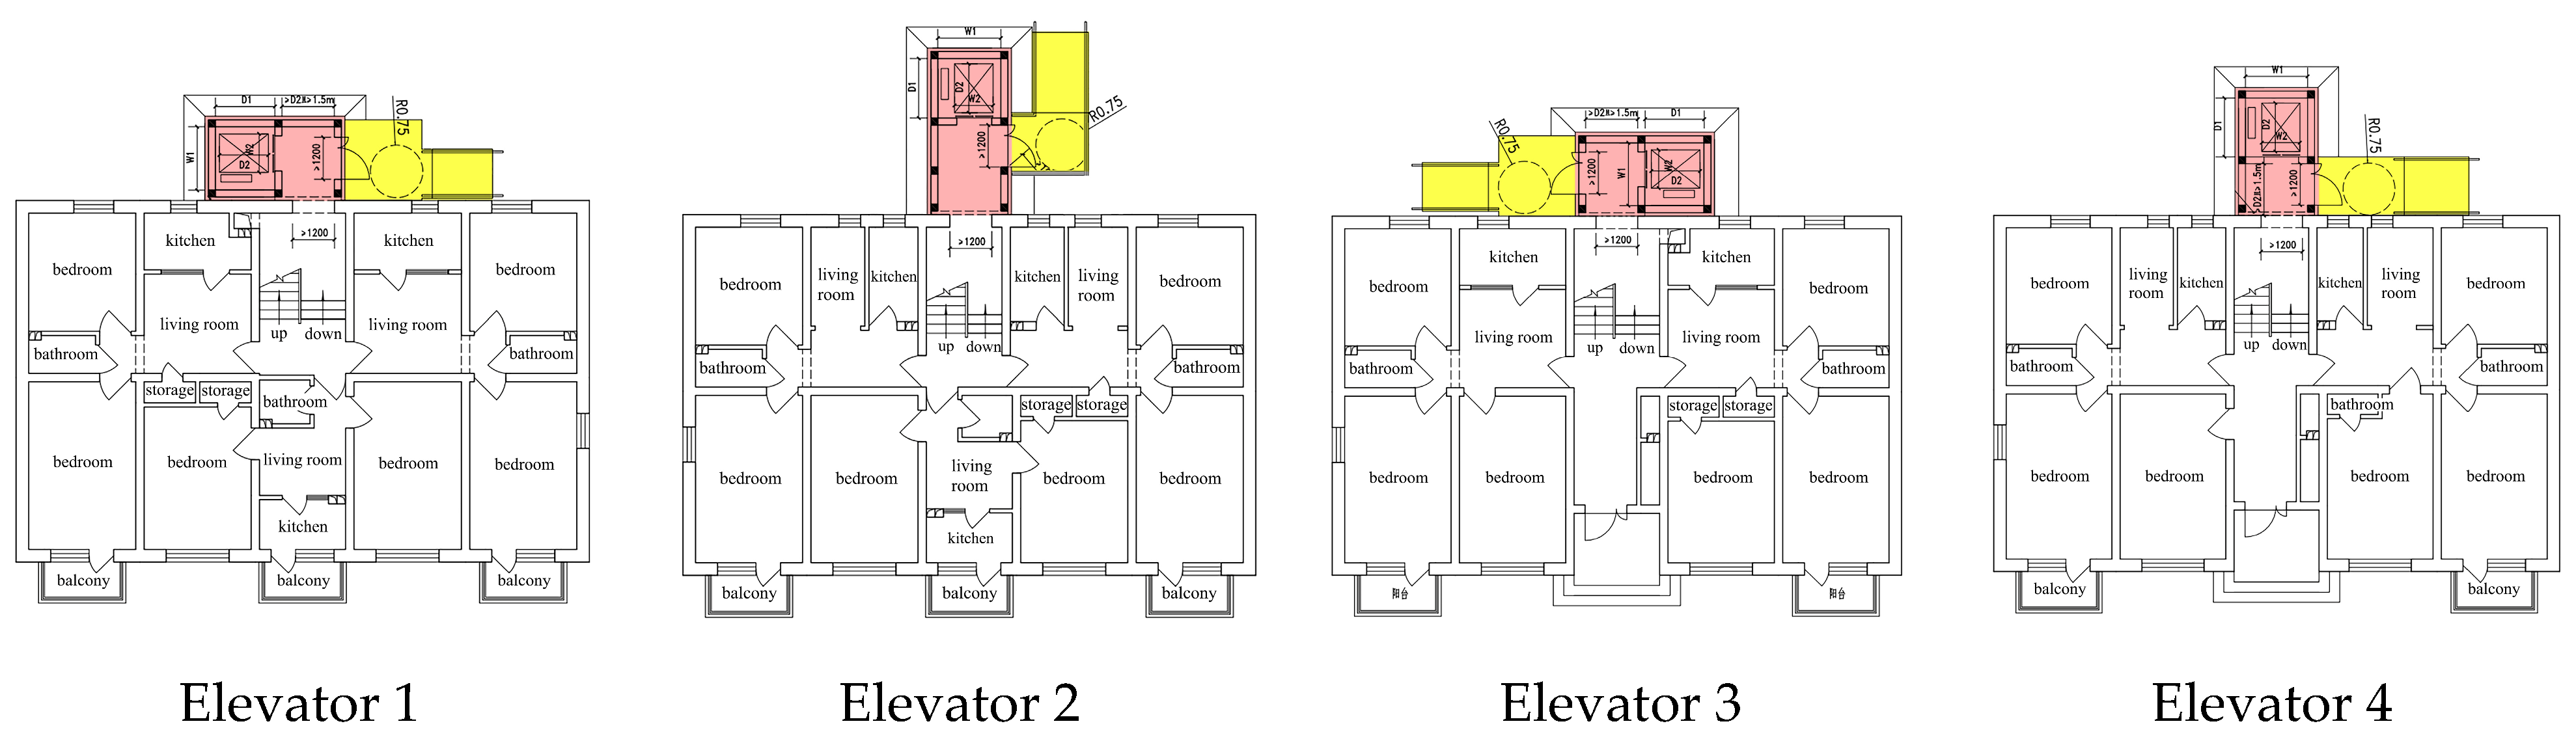
- The elevator shaft should ideally be positioned directly opposite the staircase: When the elevator shaft is aligned with the staircase, the impact on indoor ventilation is minimized, as seen in elevator models 2, 4, 5, and 8. Positioning the shaft on either side of the staircase significantly increases the impact, as observed in models 1, 3, 6, and 7.
- The length of the elevator-connecting corridor should be approximately 2.2 m: For example, in Beijing, where buildings are typically oriented north–south, a controlled variable analysis of the corridor length (ranging from 0 m to 3 m, with increments of 0.2 m, totaling 16 simulations) was conducted under the condition that the corridor faces the staircase without windows. The results showed that a corridor length of 2.2 m achieved the best ventilation, with an average indoor wind speed of 0.271 m/s. If the corridor is positioned on the sides of the building, a shorter corridor length reduces the impact on indoor ventilation.
- The elevator corridor should feature windows on both sides, preferably facing east: The corridor’s window configuration can be single-sided or double-sided, with a larger total window area favoring better indoor ventilation. For single-sided windows, a smaller angle between the window orientation and the prevailing summer wind direction of the building’s location enhances ventilation.
- The elevator shaft should ideally be detached from the building: When the elevator shaft is attached to the building, the noise generated has the greatest impact on the interior. If the elevator shaft is detached and connected via a corridor, noise transmission into the interior is more likely when the corridor is perpendicular to the building. However, a corridor parallel to the building significantly reduces noise transmission.
- The length of the elevator-connecting corridor should preferably exceed 2 m: The greater the distance between the elevator shaft and the building, the smaller the impact of generated noise on the interior, with noise decreasing exponentially as the distance increases.
- The length of the elevator-connecting corridor should be as short as possible: longer corridors are less favorable for indoor daylighting.
- The corridor material should preferably be a glass curtain wall with an increased window area: If the corridor is constructed with opaque materials and partially windowed, a larger window area enhances indoor daylighting. If the corridor is made of transparent materials, higher light transmittance of the construction materials improves indoor daylighting.
- High light transmittance materials for corridor and shaft: The higher the light transmittance of the materials used for the corridor and shaft is, the better the external visual access from the interior will be.
- Minimize corridor length and connect perpendicularly: If the elevator shaft is directly connected to the building, the impact on external visual access is minimized. If the shaft is connected via a corridor, a parallel arrangement significantly reduces external visual access for adjacent rooms, potentially blocking the view entirely. For example, in Elevator Model 1, where the shaft is positioned on the left side of the corridor, the external visual access for adjacent bathrooms and dining rooms is reduced to less than 10%. Therefore, a perpendicularly connected corridor provides better external visual access compared to a parallel arrangement.
Author Contributions
Funding
Institutional Review Board Statement
Informed Consent Statement
Data Availability Statement
Conflicts of Interest
References
- Ageing and Health in China. Available online: https://www.who.int/china/health-topics/ageing (accessed on 12 September 2024).
- China’s Demographic Outlook and Implications for 2035. Available online: https://www.eiu.com/n/chinas-demographic-outlook-and-implications-for-2035/ (accessed on 4 August 2024).
- Over One-Fifth of Chinese Population Older than 60, Says Official Report. Available online: https://english.www.gov.cn/news/202410/12/content_WS6709cb9ac6d0868f4e8ebbda.html (accessed on 4 August 2024).
- Shao, Q.H.; Yuan, J.F.; Ma, J.W.; Ding, H.X.; Huang, W. Exploring the determinants of synergetic development of social organizations participating in home-based elderly care service: An SEM method. PLoS ONE 2020, 15, e0244880. [Google Scholar]
- Wong, K.C.; Wong, F.K.Y.; Yeung, W.F.; Chang, K. The effect of complex interventions on supporting self-care among community-dwelling older adults: A systematic review and meta-analysis. Age Ageing 2018, 47, 185–193. [Google Scholar] [PubMed]
- Chu, Y.Q.; Shen, S.G. Adoption of Major Housing Adaptation Policy Innovation for Older Adults by Provincial Governments in China: The Case of Existing Multifamily Dwelling Elevator Retrofit Projects. Int. J. Environ. Res. Public Health 2022, 19, 6124. [Google Scholar] [CrossRef] [PubMed]
- Gan, C.; Chen, M.Y.; Rowe, P. Beijing’s Selected Older Neighborhoods Measurement from the Perspective of Aging. Sustainability 2020, 12, 4112. [Google Scholar] [CrossRef]
- Notice from Beijing Municipal Commission of Housing and Urban-Rural Development and Other Four Departments on the Issuance of the “Operational Guidelines for Installing Elevators in Existing Multi-Storey Residential Buildings in Beijing (Trial)”. Available online: https://www.beijing.gov.cn/zhengce/zhengcefagui/202309/t20230919_3261730.html (accessed on 15 October 2024).
- Technical Guidelines for Installing Elevators in Existing Multi-Storey Residential Buildings in Shenzhen. Available online: https://zjj.sz.gov.cn/attachment/1/1379/1379781/10970548.pdf (accessed on 10 November 2024).
- De Almeida, A.; Hirzel, S.; Patrão, C.; Fong, J.; Dütschke, E. Energy-efficient elevators and escalators in Europe: An analysis of energy efficiency potentials and policy measures. Energy Build. 2012, 47, 151–158. [Google Scholar]
- Ma, S.C.; Li, T.T.; Yang, Y.F. Housing Price Appreciation Effects of Elevator Installation in Old Residential Areas: Empirical Evidence Based on a Multiperiod DID Model. Adv. Civ. Eng. 2022, 2022, 122–156. [Google Scholar]
- Guo, B.; Zhang, L.; Li, Y. Research on the path of residents’ willingness to upgrade by installing elevators in old residential quarters based on safety precautions. Saf. Sci. 2019, 118, 389–396. [Google Scholar]
- Retolaza, I.; Zulaika, I.; Remirez, A.; Cabello, M.J.; Campos, M.A.; Ramos, A. New design for installation (DFI) methodology for large size and long life cycle products: Application to an elevator. Proc. Des. Soc. 2021, 1, 2237–2246. [Google Scholar]
- Al-Kodmany, K. Elevator technology improvements: A snapshot. Encyclopedia 2023, 3, 530–548. [Google Scholar] [CrossRef]
- Torres, J.; Garay-Martinez, R.; Oregi, X.; Torrens-Galdiz, J.I.; Uriarte-Arrien, A.; Pracucci, A.; Casadei, O.; Magnani, S.; Arroyo, N.; Cea, A.M. Plug and play modular façade construction system for renovation for residential buildings. Buildings 2021, 11, 419. [Google Scholar] [CrossRef]
- Arditi, A. Rethinking ADA signage standards for low-vision accessibility. J. Vis. 2017, 17, 20. [Google Scholar] [CrossRef] [PubMed]
- Usman, M.; Jonas, D.; Frey, G. A methodology for multi-criteria assessment of renewable integrated energy supply options and alternative HVAC systems in a household. Energy Build. 2022, 273, 112397. [Google Scholar] [CrossRef]
- McCormack, G.R.; Nesdoly, A.; Ghoneim, D.; McHugh, T.L. Realtors’ Perceptions of Social and Physical Neighborhood Characteristics Associated with Active Living: A Canadian Perspective. Int. J. Environ. Res. Public Health 2020, 17, 9150. [Google Scholar] [CrossRef]
- Jade Peach Garden. Available online: https://baike.baidu.com/item/%E7%8E%89%E6%A1%83%E5%9B%AD/10692590?fr=aladdin (accessed on 15 September 2024).
- Xinjiekou Street. Available online: https://baike.baidu.com/item/%E6%96%B0%E8%A1%97%E5%8F%A3%E8%A1%97%E9%81%93/3321085?fr=aladdin (accessed on 15 September 2024).
- Coakley, D.; Raftery, P.; Keane, M. A review of methods to match building energy simulation models to measured data. Renew. Sustain. Energy Rev. 2014, 37, 123–141. [Google Scholar] [CrossRef]
- Kellner, M.I.; Madachy, R.J.; Raffo, D.M. Software process simulation modeling: Why? what? how? J. Syst. Softw. 1999, 46, 91–105. [Google Scholar] [CrossRef]
- Jianjun, W.; Zhenzhen, X.; Dongbin, L. Feasibility study on installing elevators in existing multi story residential buildings. Build. Sci. 2020, 36, 1–6. [Google Scholar]
- Wei, L. Analysis of Typical Issues in Structural Construction Drawings for Elevator Installation in Existing Buildings. Build. Struct. 2020, 50, 852–856. [Google Scholar]
- Chen, X. Research on Problem of Installing Elevators in Old Communities. In Proceedings of the 2023 International Conference on Economic Management, Financial Innovation and Public Service (EMFIPS 2023), Cangzhou, China, 29–30 December 2023; pp. 491–501. [Google Scholar]
- Dai, X.; Li, Z.; Ma, L.; Jin, J. The Spatio-Temporal Pattern and Spatial Effect of Installation of Lifts in Old Residential Buildings: Evidence from Hangzhou in China. Land 2022, 11, 1600. [Google Scholar] [CrossRef]
- Li, Y.; Zheng, W.; Zhou, Q. Knowledge-driven urban innovation: Dynamics of elevator installation in aging residential communities. J. Knowl. Econ. 2024, 344, 1–45. [Google Scholar] [CrossRef]
- Karimian, Z.; Abolghasemi, M. Re-architecture for requirements of academic space development in the universities: Design and validitation of RASD questionnaire. Sci. Rep. 2025, 15, 19. [Google Scholar] [CrossRef]
- Liu, Y.F.; Wang, P.; Luo, X.; Zhang, M.; Zhao, T.L.; Yang, Y.Z.; Sun, Y.K.; Liu, X.D.; Liu, J.H. Analysis of flexible energy use behavior of rural residents based on two-stage questionnaire: A case study in Xi’an, China. Energy Build. 2022, 269, 112246. [Google Scholar] [CrossRef]
- Kong, Z.; Utzinger, D.M.; Freihoefer, K.; Steege, T. The impact of interior design on visual discomfort reduction: A field study integrating lighting environments with POE survey. Build. Environ. 2018, 138, 135–148. [Google Scholar]
- Shukla, V.V.; Tambe, P.P. Decision Factors in the Selection of Elevator. i-Manag. J. Mech. Eng. 2018, 8, 155–168. [Google Scholar]
- Wang, Y.; Chong, H.-Y.; Liao, P.-C.; Ren, H. Interactive mechanism of working environments and construction behaviors with cognitive work analysis: An elevator installation case study. Int. J. Occup. Saf. Ergon. 2019, 25, 362–376. [Google Scholar] [CrossRef]
- Wanrong, L.; Kun, S.; Keyu, W.; Li, C.; Lin, F. Research on post use evaluation of elevators installed in existing residential buildings in response to public concerns. J. West. Hum. Settl. Environ. 2024, 39, 122–128. [Google Scholar]
- Yang, L.; Lin, L. Research on the correlation between elevator design and living quality in multi story residential buildings. Hous. Ind. 2022, 190, 11–15. [Google Scholar]
- YiPing, C. Research on adding elevators to existing multi story residential buildings. Hous. Sci. 2015, 35, 45–47. [Google Scholar]
- Jie, L.; Xuejie, R.; Shuai, S. Research on Pricing Mechanism of PPP Project for Installing Elevators in Old Urban Residential Areas. Price Theory Pract. 2023, 12, 93–98. [Google Scholar]
- Lv, J.; Gan, T.; Ye, L. Rebuilding the ‘Nearby’: Space Production and Community Generation—Taking the Installation of Elevators in the Old Community of G Community in Shanghai as an Example. J. Shanghai Inst. Adm. 2024, 25, 68–82. [Google Scholar]
- WeiZhe, S. The dilemma, criticism, and countermeasures of installing elevators in existing residential buildings. Hebei Law 2022, 40, 159–184. [Google Scholar]
- Yang, Z.; Benxiao, Z.; Liya, Y.; Guotao, C. Analysis of Elevator Installation Strategies in Multi party Co built Old Residential Areas from the Perspective of Collective Action Theory: A Case Study of Country Garden in Hangzhou City. Urban Rural Plan. 2024, 4, 57–65. [Google Scholar]
- Lin, H.; Lin, C. Agenda setting for adding elevators in dual aging communities based on multi-source flow theory: Taking the installation of elevators in C old community in Kunshan City as an example. Technol. Ind. 2024, 24, 10–18. [Google Scholar]
- Qi, Z.; Qian, L. Research on the Multi Subject Behavioral Strategy Selection of Installing Elevators in Old Residential Areas. Proj. Manag. Technol. 2024, 22, 95–103. [Google Scholar]
- Mao, H.; Qu, Y.; Li, A. Analysis of the Challenges and Solutions Faced by Installing Elevators in Old Residential Areas. China Elev. 2024, 35, 63–65. [Google Scholar]
- Han, J.W.; Ma, H.; Wang, M.H.; Li, J.Q. Construction and improvement strategies of an age-friendly evaluation system for public spaces in affordable housing communities: A case study of Shenzhen. Front. Public Health 2024, 12, 1399852. [Google Scholar]
- Bennett, N.D.; Croke, B.F.; Guariso, G.; Guillaume, J.H.; Hamilton, S.H.; Jakeman, A.J.; Marsili-Libelli, S.; Newham, L.T.; Norton, J.P.; Perrin, C. Characterising performance of environmental models. Environ. Model. Softw. 2013, 40, 1–20. [Google Scholar]
- Podvezko, V. Application of AHP technique. J. Bus. Econ. Manag. 2009, 315, 181–189. [Google Scholar]
- Shim, J.P. Bibliographical research on the analytic hierarchy process (AHP). Socio-Econ. Plan. Sci. 1989, 23, 161–167. [Google Scholar]
- Licina, D.; Pantelic, J.; Melikov, A.; Sekhar, C.; Tham, K.W. Experimental investigation of the human convective boundary layer in a quiescent indoor environment. Build. Environ. 2014, 75, 79–91. [Google Scholar]
- Wu, J.; Weng, W.; Shen, L.; Fu, M. Transient and continuous effects of indoor human movement on nanoparticle concentrations in a sitting person’s breathing zone. Sci. Total Environ. 2022, 805, 149970. [Google Scholar]
- Zhang, T.T.; Yin, S.; Wang, S. Quantify impacted scope of human expired air under different head postures and varying exhalation rates. Build. Environ. 2011, 46, 1928–1936. [Google Scholar] [PubMed]
- Cheng, C.C.; Lee, D.; Huang, B.S. Estimated thermal sensation models by physiological parameters during wind chill stimulation in the indoor environment. Energy Build. 2018, 172, 337–348. [Google Scholar] [CrossRef]
- Kastner, P.; Dogan, T. Eddy3D: A toolkit for decoupled outdoor thermal comfort simulations in urban areas. Build. Environ. 2022, 212, 108639. [Google Scholar] [CrossRef]
- Xiao, X.; Zhou, J.L.; Yang, W. Review of calculating models of unsteady natural ventilation rate due to wind fluctuations. Indoor Built Environ. 2022, 31, 2199–2215. [Google Scholar] [CrossRef]
- Zhang, F.; Ryu, Y. Simulation study on indoor air distribution and indoor humidity distribution of three ventilation patterns using computational fluid dynamics. Sustainability 2021, 13, 3630. [Google Scholar] [CrossRef]
- Li, Y.; Tao, X.; Zhang, Y.; Li, W. Combining use of natural ventilation, external shading, cool roof and thermal mass to improve indoor thermal environment: Field measurements and simulation study. J. Build. Eng. 2024, 86, 108904. [Google Scholar] [CrossRef]
- Xu, F.; Gao, Z. Study on indoor air quality and fresh air energy consumption under different ventilation modes in 24-hour occupied bedrooms in Nanjing, using Modelica-based simulation. Energy Build. 2022, 257, 111805. [Google Scholar] [CrossRef]
- Carlucci, S.; Erba, S.; Pagliano, L.; de Dear, R. ASHRAE Likelihood of Dissatisfaction: A new right-here and right-now thermal comfort index for assessing the Likelihood of dissatisfaction according to the ASHRAE adaptive comfort model. Energy Build. 2021, 250, 111286. [Google Scholar] [CrossRef]
- Khan, J.; Hussain, T.; Javed, M.T.; Meraj, S. Effect of indoor environmental quality on human comfort and performance: A review. In Ergonomics for Improved Productivity; Springer: Berlin/Heidelberg, Germany, 2021; pp. 335–345. [Google Scholar]
- Yang, T.; Cabani, A.; Chafouk, H. A survey of recent indoor localization scenarios and methodologies. Sensors 2021, 21, 8086. [Google Scholar] [CrossRef]
- Kang, M.-W.; Oh, Y.-K. Analysis of frequency characteristics and evaluation methods of elevator noise. J. Acoust. Soc. Korea 2021, 40, 607–614. [Google Scholar]
- Kang, M.-W.; Oh, Y.-K. A study on the location of microphones in measurement considering the frequency characteristics of elevator noise in households. J. Acoust. Soc. Korea 2023, 42, 124–132. [Google Scholar]
- Pan, J.; Li, H.; Chen, W.; Wei, Y. Elevator Performance Evaluation Based on the Analysis of the Running Sound. In Proceedings of the 2021 Global Reliability and Prognostics and Health Management (PHM-Nanjing), Nanjing, China, 15–17 October 2021; pp. 1–6. [Google Scholar]
- Peng, H.; Lv, Z.; Chen, M. Research on the Impact Test and Control Countermeasures of Residential Elevator Operation Noise. E3S Web Conf. 2021, 237, 01033. [Google Scholar]
- Zaporozhets, O.; Fiks, B.; Jagniatinskis, A.; Tokarev, V.; Karpenko, S.; Mickaitis, M. Indoor noise A-level assessment related to the environmental noise spectrum on the building facade. Appl. Acoust. 2022, 185, 108380. [Google Scholar]
- Zeng, Y.; Sun, H.; Lin, B.; Zhang, Q. Non-visual effects of office light environment: Field evaluation, model comparison, and spectral analysis. Build. Environ. 2021, 197, 107859. [Google Scholar]
- Wang, Y.; Yang, W.; Wang, Q. Multi-objective parametric optimization of the composite external shading for the classroom based on lighting, energy consumption, and visual comfort. Energy Build. 2022, 275, 112441. [Google Scholar]
- Leccese, F.; Rocca, M.; Salvadori, G.; Belloni, E.; Buratti, C. Towards a holistic approach to indoor environmental quality assessment: Weighting schemes to combine effects of multiple environmental factors. Energy Build. 2021, 245, 111056. [Google Scholar]
- Lin, T.-Y.; Le, A.-V.; Chan, Y.-C. Evaluation of window view preference using quantitative and qualitative factors of window view content. Build. Environ. 2022, 213, 108886. [Google Scholar]
- Ko, W.H.; Kent, M.G.; Schiavon, S.; Levitt, B.; Betti, G. A window view quality assessment framework. Leukos 2022, 18, 268–293. [Google Scholar]
- Le, D.M.; Park, D.Y.; Baek, J.; Karunyasopon, P.; Chang, S. Multi-criteria decision making for adaptive façade optimal design in varied climates: Energy, daylight, occupants’ comfort, and outdoor view analysis. Build. Environ. 2022, 223, 109479. [Google Scholar]


| Influencing Factors | Eigenvector | Weight (%) | Maximum Eigenvalue | CI Value |
|---|---|---|---|---|
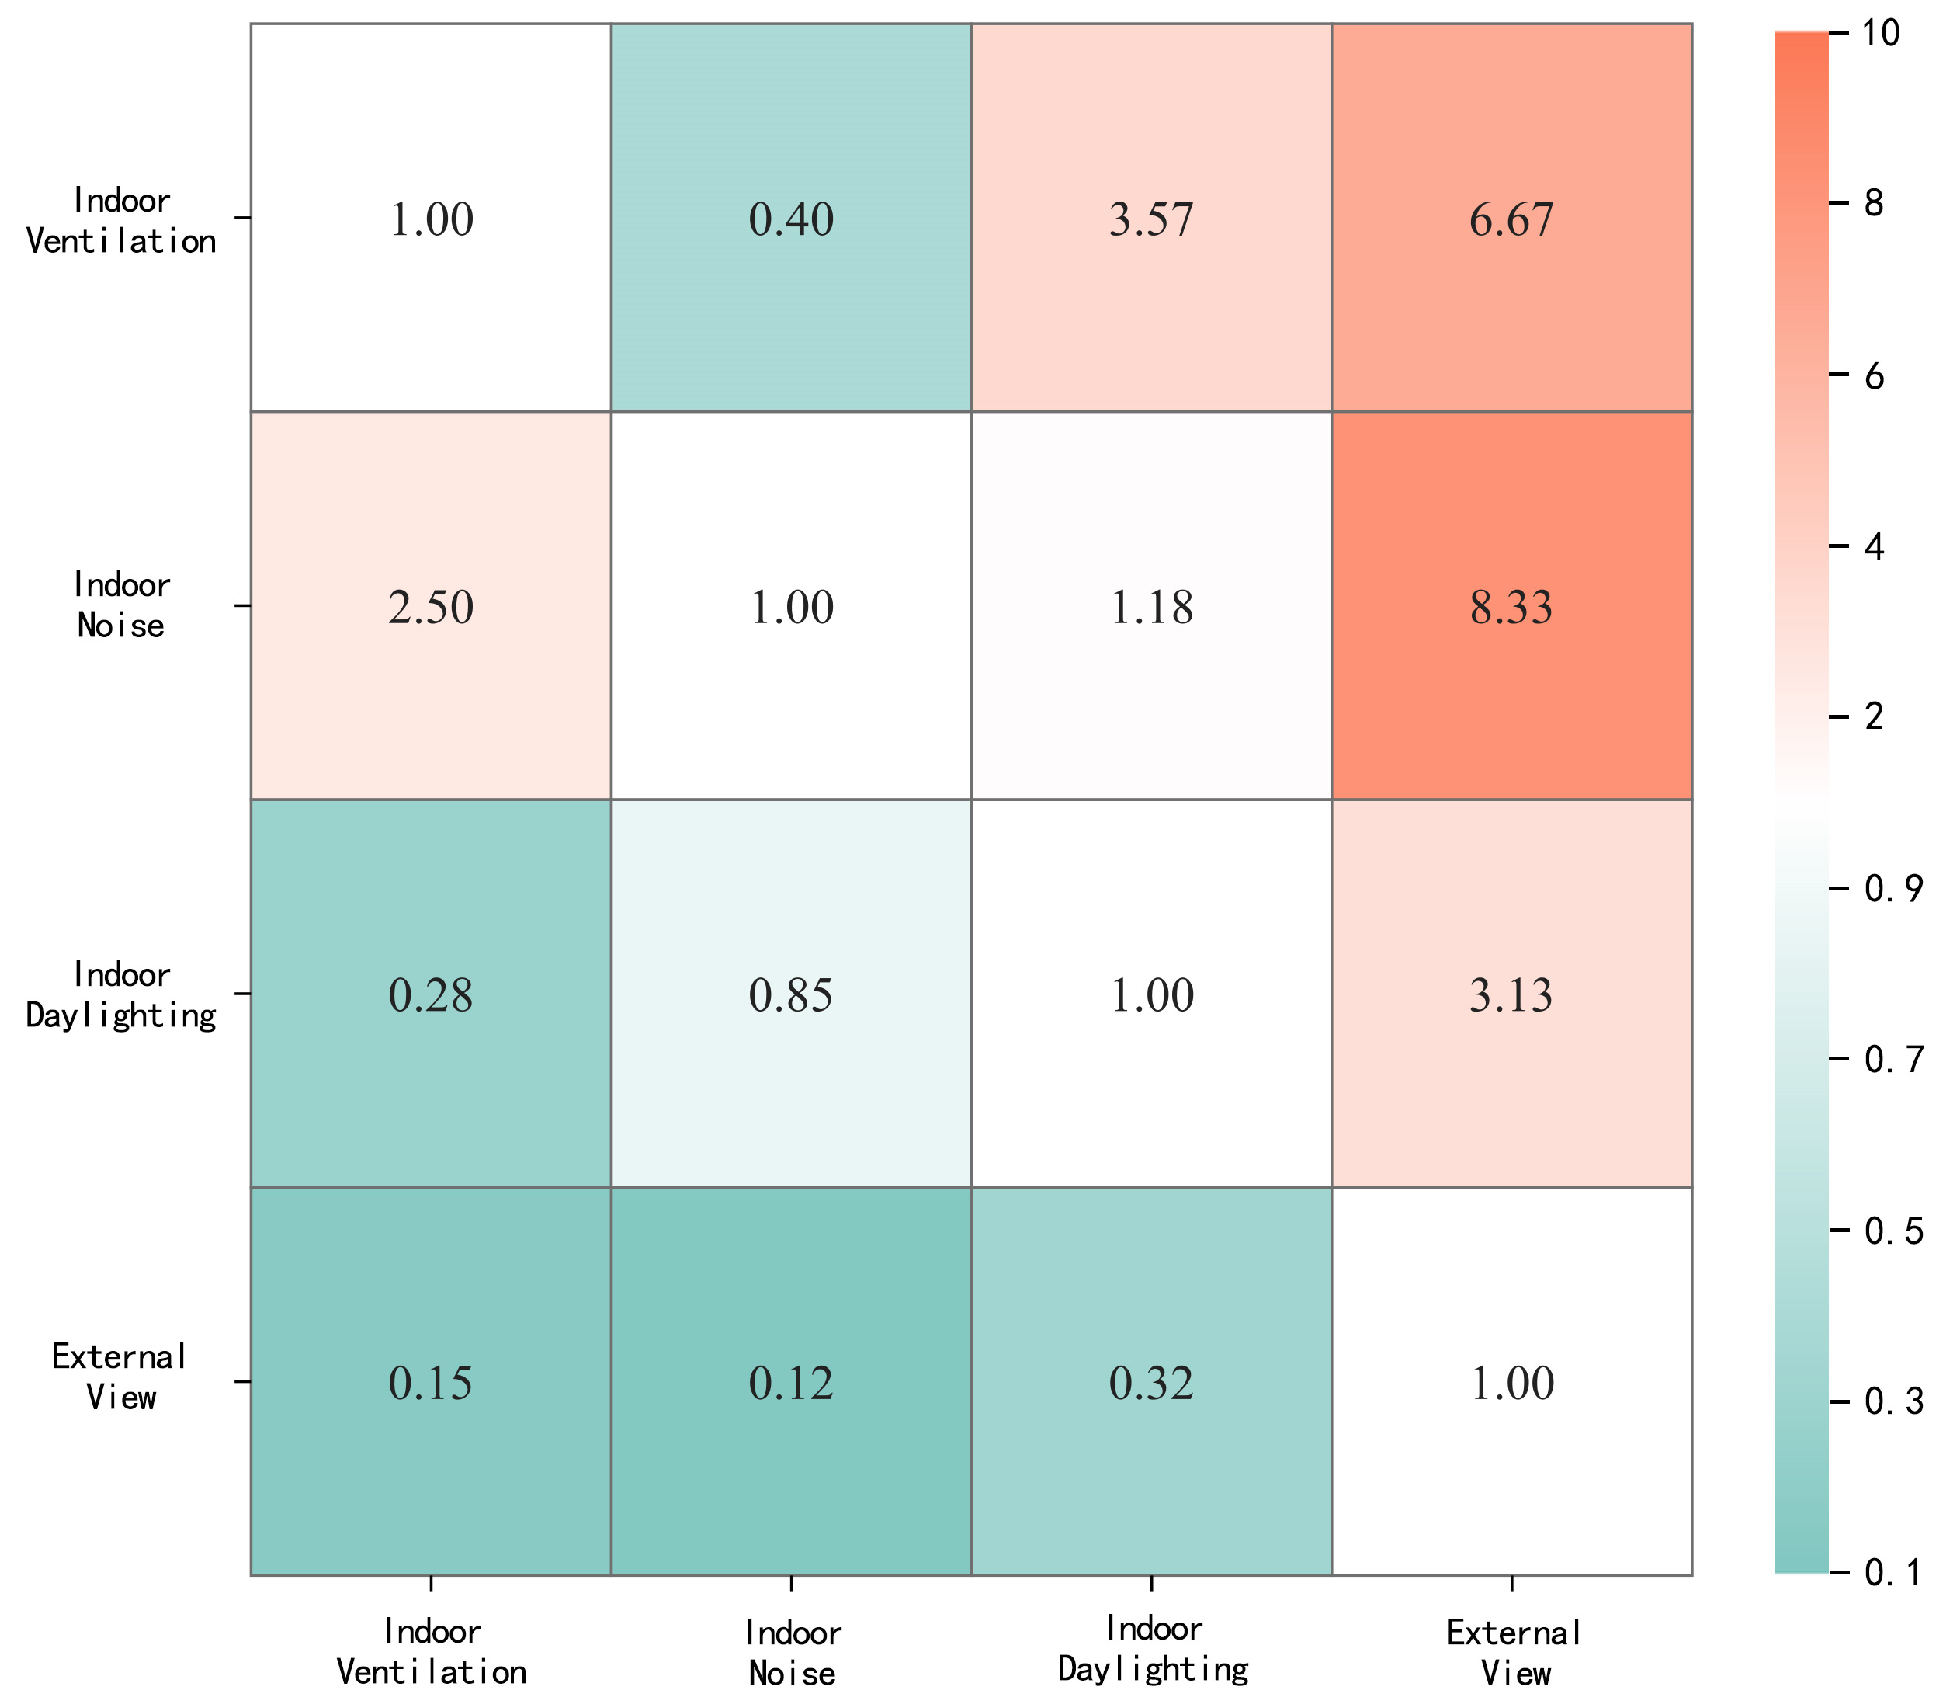
| Indoor Ventilation | 1.36 | 34.01 | 8.98 | 0.14 |
| Indoor Noise | 1.688 | 42.192 | ||
| Indoor Daylighting | 0.758 | 18.952 | ||
| External Visual Access | 0.194 | 4.846 |
| Research Object\Influencing Factors | Measured Average Wind Speed at Each Floor (m/s) | Simulated Average Wind Speed at Each Floor (m/s) | Overall Score | |||||
|---|---|---|---|---|---|---|---|---|
| Ground Floor (1F) | Middle Floor (3F) | Top Floor (6F) | Ground Floor (1F) | Middle Floor (3F) | Top Floor (6F) | |||
| Research Object | No. 45 Courtyard, South Xihuangchenggen Street (E1) | 0.187 | 0.155 | 0.214 | 0.195 | 0.165 | 0.211 | \ |
| District 1, South Xihuangchenggen Street (E2) | 0.253 | 0.223 | 0.24 | 0.269 | 0.231 | 0.259 | \ | |
| Chegongzhuang Zhongli Community (E3) | 0.2 | 0.237 | 0.181 | 0.209 | 0.217 | 0.185 | \ | |
| Xiaomachang Nanli Community (E4) | 0.251 | 0.245 | 0.225 | 0.237 | 0.265 | 0.246 | \ | |
| Huaibaishu Street Beili Community (E5) | 0.246 | 0.251 | 0.284 | 0.265 | 0.232 | 0.275 | \ | |
| Wuzi Department Courtyard (E6) | 0.193 | 0.180 | 0.226 | 0.212 | 0.174 | 0.231 | \ | |
| Honglian Zhongli Community (E7) | 0.176 | 0.227 | 0.223 | 0.185 | 0.220 | 0.228 | \ | |
| No. 1 Courtyard, Hongju South Street (E8) | 0.28 | 0.195 | 0.221 | 0.297 | 0.209 | 0.216 | \ | |
| Experimental Object | Yutao Yuan Community (Current situation) | 0.187 | 0.155 | 0.214 | 0.195 | 0.165 | 0.211 | \ |
| Yutao Yuan Community (E1) | \ | \ | \ | 0.174 | 0.189 | 0.235 | 52.120 | |
| Yutao Yuan Community (E2) | \ | \ | \ | 0.227 | 0.269 | 0.268 | 86.427 | |
| Yutao Yuan Community (E3) | \ | \ | \ | 0.142 | 0.192 | 0.224 | 43.577 | |
| Yutao Yuan Community (E4) | \ | \ | \ | 0.217 | 0.254 | 0.285 | 85.089 | |
| Yutao Yuan Community (E5) | \ | \ | \ | 0.195 | 0.229 | 0.287 | 75.659 | |
| Yutao Yuan Community (E6) | \ | \ | \ | 0.160 | 0.216 | 0.214 | 50.377 | |
| Yutao Yuan Community (E7) | \ | \ | \ | 0.192 | 0.239 | 0.277 | 76.051 | |
| Yutao Yuan Community (E8) | \ | \ | \ | 0.177 | 0.244 | 0.251 | 68.458 | |
| Research Object\Influencing Factors | Measured Average Sound Pressure Level for Each Floor (dB) | Simulated Average Sound Pressure Level for Each Floor (dB) | Overall Score | |||||
|---|---|---|---|---|---|---|---|---|
| Ground Floor (1F) | Middle Floor (3F) | Top Floor (6F) | Ground Floor (1F) | Middle Floor (3F) | Top Floor (6F) | |||
| Research Object | No. 45 Courtyard, South Xihuangchenggen Street (E1) | 39.378 | 45.828 | 46.500 | 38.674 | 42.9088 | 43.379 | \ |
| District 1, South Xihuangchenggen Street (E2) | 23.472 | 27.641 | 33.012 | 22.118 | 27.510 | 32.204 | \ | |
| Chegongzhuang Zhongli Community (E3) | 43.436 | 48.276 | 49.056 | 40.9704 | 45.448 | 53.515 | \ | |
| Xiaomachang Nanli Community (E4) | 47.371 | 62.036 | 63.376 | 43.435 | 60.150 | 62.118 | \ | |
| Huaibaishu Street Beili Community (E5) | 48.276 | 53.804 | 55.560 | 45.789 | 51.017 | 54.579 | \ | |
| Wuzi Department Courtyard (E6) | 29.798 | 36.644 | 37.811 | 26.766 | 39.267 | 41.721 | \ | |
| Honglian Zhongli Community (E7) | 43.302 | 53.803 | 55.427 | 44.974 | 51.177 | 57.351 | \ | |
| No. 1 Courtyard, Hongju South Street (E8) | 43.300 | 48.987 | 54.315 | 39.031 | 48.670 | 51.382 | \ | |
| Experimental Object | Yutao Yuan Community (E1) | \ | \ | \ | 31.887 | 45.961 | 48.238 | 73.486 |
| Yutao Yuan Community (E2) | \ | \ | \ | 29.966 | 43.571 | 49.967 | 74.714 | |
| Yutao Yuan Community (E3) | \ | \ | \ | 32.478 | 44.787 | 52.211 | 71.813 | |
| Yutao Yuan Community (E4) | \ | \ | \ | 29.876 | 51.504 | 56.160 | 67.552 | |
| Yutao Yuan Community (E5) | \ | \ | \ | 36.625 | 56.526 | 60.364 | 57.803 | |
| Yutao Yuan Community (E6) | \ | \ | \ | 31.876 | 37.379 | 40.715 | 80.552 | |
| Yutao Yuan Community (E7) | \ | \ | \ | 34.079 | 48.944 | 52.627 | 68.588 | |
| Yutao Yuan Community (E8) | \ | \ | \ | 24.126 | 55.556 | 57.164 | 67.935 | |
| Research Object\Influencing Factors | Proportion of Measured Indoor Effective Daylight Area (%) | Proportion of Simulated Indoor Effective Daylight Area (%) | Overall Score | |||||
|---|---|---|---|---|---|---|---|---|
| Ground Floor (1F) | Middle Floor (3F) | Top Floor (6F) | Ground Floor (1F) | Middle Floor (3F) | Top Floor (6F) | |||
| Research Object | No. 45 Courtyard, South Xihuangchenggen Street (E1) | 42.346 | 51.906 | 56.689 | 44.668 | 49.721 | 55.496 | \ |
| District 1, South Xihuangchenggen Street (E2) | 44.987 | 38.941 | 42.459 | 42.159 | 37.710 | 40.866 | \ | |
| Chegongzhuang Zhongli Community (E3) | 52.295 | 61.506 | 62.588 | 52.062 | 59.808 | 61.498 | \ | |
| Xiaomachang Nanli Community (E4) | 51.898 | 59.082 | 66.377 | 53.042 | 54.348 | 67.578 | \ | |
| Huaibaishu Street Beili Community (E5) | 60.298 | 63.614 | 72.117 | 58.776 | 65.060 | 68.664 | \ | |
| Wuzi Department Courtyard (E6) | 44.646 | 53.052 | 57.846 | 47.350 | 50.077 | 57.098 | \ | |
| Honglian Zhongli Community (E7) | 47.455 | 45.055 | 51.005 | 44.356 | 46.922 | 52.980 | \ | |
| No. 1 Courtyard, Hongju South Street (E8) | 39.660 | 45.077 | 49.510 | 41.874 | 46.619 | 52.417 | \ | |
| Experimental Object | Yutao Yuan Community (Current situation) | \ | \ | \ | 57.059 | 63.978 | 75.200 | \ |
| Yutao Yuan Community (E1) | \ | \ | \ | 42.264 | 48.028 | 48.713 | 46.334 | |
| Yutao Yuan Community (E2) | \ | \ | \ | 30.618 | 40.805 | 45.016 | 38.801 | |
| Yutao Yuan Community (E3) | \ | \ | \ | 47.497 | 52.946 | 58.030 | 52.824 | |
| Yutao Yuan Community (E4) | \ | \ | \ | 46.864 | 48.337 | 55.777 | 50.326 | |
| Yutao Yuan Community (E5) | \ | \ | \ | 47.230 | 56.574 | 65.110 | 56.304 | |
| Yutao Yuan Community (E6) | \ | \ | \ | 42.430 | 48.325 | 52.028 | 47.594 | |
| Yutao Yuan Community (E7) | \ | \ | \ | 34.187 | 44.394 | 47.816 | 42.132 | |
| Yutao Yuan Community (E8) | \ | \ | \ | 37.505 | 43.355 | 48.701 | 43.187 | |
| Research Object\Influencing Factors | Simulated Average Exterior View Ratio for Each Floor (%) | Overall Score | |||
|---|---|---|---|---|---|
| Ground Floor (1F) | Middle Floor (3F) | Top Floor (6F) | |||
| Experimental Object | Yutao Yuan Community (Current situation) | \ | 29.166 | \ | \ |
| Yutao Yuan Community (E1) | \ | 20.040 | \ | 35.129 | |
| Yutao Yuan Community (E2) | \ | 35.316 | \ | 98.338 | |
| Yutao Yuan Community (E3) | \ | 27.006 | \ | 73.252 | |
| Yutao Yuan Community (E4) | \ | 15.866 | \ | 18.273 | |
| Yutao Yuan Community (E5) | \ | 37.620 | \ | 95.384 | |
| Yutao Yuan Community (E6) | \ | 24.663 | \ | 60.123 | |
| Yutao Yuan Community (E7) | \ | 19.972 | \ | 34.801 | |
| Yutao Yuan Community (E8) | \ | 30.768 | \ | 90.531 | |
| Elevator Model\Evaluation Factors | Indoor Ventilation (13.978%) | Indoor Noise (13.383%) | Indoor Daylighting (10.716%) | Exterior View (5.484%) | Overall Score |
|---|---|---|---|---|---|
| E1 | 52.120 | 73.486 | 46.334 | 35.129 | 59.214 |
| E2 | 86.427 | 74.714 | 38.801 | 98.338 | 73.036 |
| E3 | 43.577 | 71.813 | 52.824 | 73.252 | 58.680 |
| E4 | 85.089 | 67.552 | 50.326 | 18.273 | 67.863 |
| E5 | 75.659 | 57.803 | 56.304 | 95.384 | 65.412 |
| E6 | 50.377 | 80.552 | 47.594 | 60.123 | 63.053 |
| E7 | 76.051 | 68.588 | 42.132 | 34.801 | 64.474 |
| E8 | 68.458 | 67.935 | 43.187 | 90.531 | 64.517 |
Disclaimer/Publisher’s Note: The statements, opinions and data contained in all publications are solely those of the individual author(s) and contributor(s) and not of MDPI and/or the editor(s). MDPI and/or the editor(s) disclaim responsibility for any injury to people or property resulting from any ideas, methods, instructions or products referred to in the content. |
© 2025 by the authors. Licensee MDPI, Basel, Switzerland. This article is an open access article distributed under the terms and conditions of the Creative Commons Attribution (CC BY) license (https://creativecommons.org/licenses/by/4.0/).
Share and Cite
Chen, D.; Li, C.; Gong, R.; Jin, E. Elevator Selection Methodology for Existing Residential Buildings Oriented Toward Living Quality Improvement. Sustainability 2025, 17, 3225. https://doi.org/10.3390/su17073225
Chen D, Li C, Gong R, Jin E. Elevator Selection Methodology for Existing Residential Buildings Oriented Toward Living Quality Improvement. Sustainability. 2025; 17(7):3225. https://doi.org/10.3390/su17073225
Chicago/Turabian StyleChen, Dongxiao, Chunqing Li, Rulong Gong, and Enlin Jin. 2025. "Elevator Selection Methodology for Existing Residential Buildings Oriented Toward Living Quality Improvement" Sustainability 17, no. 7: 3225. https://doi.org/10.3390/su17073225
APA StyleChen, D., Li, C., Gong, R., & Jin, E. (2025). Elevator Selection Methodology for Existing Residential Buildings Oriented Toward Living Quality Improvement. Sustainability, 17(7), 3225. https://doi.org/10.3390/su17073225