Article

Analysis of the Factors Influencing Grain Supply Chain Resilience in China Using Bayesian Structural Equation Modeling

1
School of Business, Hunan University of Science and Technology, Xiangtan 411201, China
2
School of Management, Hunan Institute of Engineering, Xiangtan 411100, China
*
Author to whom correspondence should be addressed.
Sustainability 2025, 17(7), 3250; https://doi.org/10.3390/su17073250
Submission received: 4 March 2025 / Revised: 26 March 2025 / Accepted: 2 April 2025 / Published: 5 April 2025
(This article belongs to the Section Economic and Business Aspects of Sustainability)

Abstract

:
As worldwide emergencies occur with growing frequency, including extreme weather, geopolitical conflicts, and pandemics, there is a crucial need to improve grain supply chain resilience to ensure food sustainability during such emergencies. This study investigates the cross-cutting effects of certain key factors potentially influencing grain supply chain resilience, namely infrastructure development, technological innovations, and government aid. It develops a structural equation model of these influencing factors based on Chinese data and applies Bayesian estimation. The results show that government aid is the most critical factor influencing the resilience of the grain supply chain, with a direct impact on grain supply chain resilience of 0.459, an indirect impact through technological innovations of 0.33, and an indirect impact through infrastructure development of 0.026. The study found that the resilience of China’s grain supply chain generally exhibits an upward trend, with a high level of government aid and deficiencies in infrastructure and technological innovation. This paper not only provides new research ideas and methods for the study of grain supply chain resilience, but it also offers policy references for reducing the risk of grain supply deficiencies and improving the sustainability of grain systems.

1. Introduction

Regional conflicts, climate change, population growth, and other environmental and social pressures have made grain supply extremely complex [1], and the sustainable development of global food systems now confronts unprecedented challenges [2]. These systemic shocks propagate through three critical pathways: (i) production collapse via agro-ecological degradation, (ii) logistics fragmentation due to export restrictions, and (iii) demand–supply mismatches amplified by speculative hoarding. According to FAO 2023 report [3], over 3.1 billion people (42% of global population) cannot afford healthy diets, while 30% of total agricultural production is lost through inefficient supply chains. Simultaneously, China’s tightening environmental constraints, the normalized inversion of domestic and international grain prices, and the persistent escalation of agricultural production costs have collectively revealed the inherent vulnerabilities within existing grain supply chains (GSCs) [4,5,6]. This context underscores the imperative to investigate the mechanisms influencing grain supply chain resilience (GSCR) and develop enhancement pathways. This will, in turn, establish a theoretical foundation for strengthening China’s supply chain infrastructure, safeguarding national food security, and advancing sustainable development agendas.
The GSC includes grain production, processing, distribution, consumption, and final disposal [7]. The interplay among these elements and the complexity of the process lead to extreme vulnerability in the supply chain [8]. Any risk factor, natural or man-made, can disturb and destroy the stability of this balance. Thus, the core connotation of GSCR lies in the ability to maintain the supply of sufficient, appropriate, and accessible grain to all when any disruption occurs [9]. Based on this, scholars have employed various methods, including conceptual models from literature reviews [10], interview and questionnaire methods [11], econometric regression models [12], and spatial Dubin models [13], to systematically analyze the influencing factors of GSCR from three aspects: GSC links [14,15,16,17], response to emergencies [18,19,20,21], and macro-drivers [22,23,24,25,26]. However, it is crucial to recognize that GSCR emerges from the complex interplay of multiple determinants. The prevailing studies predominantly concentrate on examining either the influence of individual factors or the direct effects of multiple factors in isolation, thereby overlooking the intricate interdependencies and reciprocal relationships among these factors. Existing scholarship consistently affirms that China’s government assistance plays a pivotal role in the resilience architecture of GSC [6,27]. However, the cross-scale interactions between three pivotal enablers—government assistance programs, infrastructure modernization, and technological innovation—remain underexplored in shaping supply chain resilience. While discrete studies validate the individual impacts of agricultural subsidies [28], smart logistics infrastructure [29], and blockchain traceability systems [30], their compound effects within dynamic policy ecosystems require urgent scholarly attention.
To address the above issues, this study establishes a structural equation model (SEM) of the interactions among the factors influencing GSCR based on previous literature. It focuses on three major macro-factors: government aid, technological innovations, and infrastructure. And based on China’s country-level data, a Bayesian approach is applied for parameter estimation. The reasons are as follows: First, China has always been a positive force in maintaining global food security against the backdrop of geopolitical conflicts, COVID-19, extreme weather, and other factors that have severely impacted global food security; therefore, China is taken as the object of study. Second, GSCR is a result of the intersection of multiple factors and is not directly observable; therefore, this study will use SEM to analyze the influencing factors of GSCR. SEM can deal with the relationship between multiple dependent and independent variables at the same time and consider the interactions between variables. It also has higher flexibility and applicability than traditional regression models. Finally, SEM usually uses the least squares and great likelihood methods to estimate model parameters, which require a sufficiently large sample size to obtain stable parameter estimates and standard errors. However, national macro-level data are more difficult to obtain than individual-level data. Since only the indicator data for a particular year can be found through the annual statistical yearbook, the sample size is often too small compared to micro-survey data and panel data. For small samples, Bayesian structural equation modeling (BSEM) has more reliable parameter estimation than traditional SEM [31,32].
The novelty of this work is threefold, encompassing (1) systematically analyzing the mechanisms through which infrastructure, government support, and technological innovation influence GSCR and constructing a SEM to examine these influencing factors; (2) innovatively applying Bayesian estimation methods to analyze GSCR and exploring the feasibility of BSEM under small-sample conditions in the context of GSCR research; (3) quantifying the relative weights of GSCR determinants through longitudinal analysis of China’s 1996–2022 datasets, with derived evidence-based policy implications. The structure of this paper proceeds as follows: Section 2 outlines the foundational theoretical framework, while Section 3 elaborates on the methodological approach and data collection procedures. Subsequent sections analyze the findings through distinct lenses: Section 4 examines empirical evidence and hypothesis validation; Section 5 synthesizes core findings with practical implications; and Section 6 concludes the study by identifying research constraints and proposing scholarly extensions.

2. Theoretical Framework

Toughness is often closely associated with risk and external shocks. By conceptualizing the GSC as a malleable material, its toughness can be defined as the ability to absorb energy during deformation and fracture caused by risky shocks. Building on Hosseini et al.’s (2019) characterization of resilience [19], this study defines GSCR as the system’s capacity to absorb, adapt to, and recover from external shocks (caused by climatic, societal, and economic factors) and internal disturbances. Specifically, absorptive capacity refers to the system’s ability to mitigate direct shock impacts through buffering mechanisms; adaptive capacity describes the system’s ability to proactively adjust structural parameters under stress conditions, including behaviors such as supply path modification and inventory allocation optimization; meanwhile, recovery capacity denotes the system’s ability to maintain or exceed pre-shock performance levels following disturbance. Based on this definition, the current study proposes a theoretical framework in which infrastructure, technological innovation, and government support enhance GSCR by improving absorptive, adaptive, and restorative capacities (as shown in Figure 1).

2.1. Infrastructure Development and GSCR

The level of infrastructure, serving as a critical physical foundation for both individual actors and the entire grain supply chain, is pivotal in risk identification and response, shock absorption, recovery, and learning [33]. Firstly, grain supply chains with well-developed infrastructure tend to exhibit greater resilience to risks. A well-developed grain production infrastructure can reduce the level of uncertainty that may be caused by seasonal and cyclical climate fluctuations. For example, water conservancy infrastructure can channel water flow when floods occur, release stored water when droughts occur, reduce the areas affected, and blunt the damage caused by such disasters. Secondly, a well-developed infrastructure can respond in various ways to potential disruptions [34]. In the face of emergencies, such as storms, epidemics, and natural disasters, highly adaptable transportation systems, processing facilities, supply bases, and storage equipment [35] can adjust and adapt quickly to maintain supply continuity. Thirdly, empirical analyses demonstrate that infrastructure systems with lower resilience exhibit disruption events characterized by higher frequency, greater intensity, broader spatial extent, and prolonged duration.
The COVID-19 pandemic shocked grain production and trade while also disrupting food availability. When infrastructure systems possess inadequate resilience capacity to mitigate exogenous shocks through effective temporal response mechanisms, then there will emerge phenomena such as rising hunger, food plundering, and price gouging, which may spread and lead to uncontrolled and disruptive social activities. Thus, our hypothesis is as follows:
H1. 
GSCR is significantly affected by the level of infrastructure development.

2.2. Technological Innovation and GSCR

Theoretical and empirical studies show that technological innovations are crucial for improving GSCR and security [36]. Advancements in agro-production methodologies and the implementation of emerging technologies have enhanced grain yield while optimizing product quality parameters, thereby reinforcing GSCR. In theory, the widespread application of these modern agricultural production factors, such as new grain varieties, new production technologies, and new production machinery, should transform and upgrade grain production methods, improving the intrinsic stability of the GSC as well as its flexibility in coping with shocks. For example, the cultivation and promotion of high-yield, high-quality, and multi-resistant food crop varieties have improved resilience and yield; the application of precision agriculture technology has made it possible to achieve better farmland management and has improved water efficiency as well as fertilizer use; additionally, the popularity of intelligent agricultural machinery and equipment has ameliorated operational efficiency and reduced the intensity of farm labor. Added to the above, in the face of sudden external shocks, widely developed technological innovations can address issues related to the GSC’s adaptability in responding to sudden shocks and disruptive factors. For example, after the pandemic, when food sales were hampered by traffic control, digital technologies, such as 5G cloud platforms, were used to establish online exhibitions, smart malls, and live-streaming platforms, integrating offline dispersed agricultural products and broadening sales channels. Therefore, we propose the following hypothesis:
H2. 
GSCR is significantly affected by the level of technological innovations.

2.3. The Impact of Government Aid on the GSCR

Government aid is often seen as a valid way to improve GSCR [37]. It is vital in stabilizing grain prices, promoting the transformation of the grain industry, and facilitating information sharing among stakeholders in the chain [24]. Conversely, a stable market supply with price regulation constitutes a critical policy instrument within national governance frameworks—both developed and those under development—which can help maintain food supply chain stability when responding to external shocks. When risks are foreseen, the government will promptly play its role in macro-control and take various steps that affect distribution, storage, information publicity, and production safety to ensure a sufficient supply of grain and stable prices. Conversely, in China, the government acts as a protector of farmland and a guardian of farmers’ interests. The Chinese government has a strict cultivated land protection system in place to ensure that such land is not converted to agriculture or grain, and it continues to increase subsidies to grain producers to ensure farmers’ incomes. Additionally, the government maintains close communication with stakeholders in the grain supply chain. This enables the government to promptly address the needs and challenges faced by supply chain participants, thereby enhancing the stability of the grain supply chain. Furthermore, the government facilitates collaboration among supply chain participants by improving information-sharing efficiency, which ultimately strengthens the overall efficiency and GSCR. Therefore, we propose the following hypothesis:
H3. 
GSCR is significantly affected by government aid.

2.4. Infrastructure Development, Technological Innovation, and Government Aid

The concept of GSCR is embedded in the context of multiple overlapping risks; therefore, it is insufficient to consider only the direct impacts of individual factors. Instead, the cross-cutting effects of infrastructure, technological innovation, and government aid must be analyzed. First, government aid can indirectly enhance GSCR through support for infrastructure development and investment in technological innovation. The construction of high-standard farmland and water conservancy infrastructure, as well as grain scientific research and technological innovation, requires substantial investments in capital, manpower, and time. These tasks cannot be accomplished by a single entity; thus, the government is crucial in coordinating and unifying the efforts of all stakeholders. For instance, the People’s Republic of China Act on Food Security, enacted on 1 June 2024, stipulates that ‘the State shall strengthen scientific and technological innovation capacity for food security and information technology construction, and shall support basic research, key technology R&D, and standardization in the grain sector’. Additionally, it mandates that ‘governments at all levels shall organize the construction, operation, and maintenance of farmland water conservancy infrastructure, protect and improve irrigation and drainage systems, and promote efficient water-saving agriculture based on local conditions’. These provisions underscore the government’s critical role in ensuring grain supply and national food security. Second, technological innovation directly influences infrastructure construction by improving operational efficiency, promoting the restructuring and upgrading of the GSC, and enhancing its capacity to absorb, adapt to, and recover from risks, thereby strengthening the GSCR. In summary, three testable propositions are formulated:
H4. 
Technological innovation accelerates and enhances the quality of infrastructure.
H5. 
Government aid significantly enhances infrastructure development.
H6. 
Government aid positively influences the advancement of technological innovation.

3. Methodology and Data

3.1. Materials and Methods

According to theoretical analyses, GSCR is significantly influenced by infrastructure, technological innovation, and government assistance. The scientific measurement of these four variables involves multiple dimensions, which require specific observable indicators for accurate assessment. Variables that cannot be directly observed are referred to as latent variables in statistics. General measurement methods often struggle to address the intersecting relationships among multiple latent variables. Contrastingly, SEM excels in handling complex multivariate relationships. Therefore, this study employs BSEM to analyze the factors influencing GSCR, as outlined below.
Firstly, SEM is a statistical analysis-based research method that can simultaneously estimate the values of latent variables and the parameters of complex variable models. It is particularly suitable for quantitative research on interactions among multiple variables. A crucial step in SEM is model specification. Based on the theoretical analysis framework, this study constructs a SEM incorporating four latent variables: GSCR, infrastructure, technological innovation, and government aid. The appropriate path analysis map is shown in Figure 2.
The SEM is based on the following four assumptions: First, absorptive capacity, adaptive capacity, and recovery capacity serve as observable indicators, also known as manifest variables, which are used to measure GSCR—a latent variable. Second, government aid is measured by financial support, price regulation of raw materials for grain production, and retail price regulation of grain. Technological innovation is measured by innovation inputs, basic research, and applied research. Infrastructure is measured by water facilities for grain production, technological facilities for grain production, and logistics facilities for grain. Third, all observable indicators are assumed to have positive values. Fourth, the arrows pointing to the latent variables in the figure represent random error terms, and it is assumed that these error terms are uncorrelated with the observed variables.
The basic SEM comprises two components: the measurement equation and the structural equation. The measurement equation describes the relationship between latent variables and observed indicators, while the structural equation represents the relationship between latent endogenous variables and latent exogenous variables. Based on the theoretical analysis and model specification, the measurement equation is formulated as follows:
y i = Λ ω i + ε i , i = 1 , 2 , , 12
where ω i = η i , ξ i 1 , ξ i 2 , ξ i 3 T is the latent variable, which represents the GSCR ( η i ), infrastructure ( ξ 1 ), government aid ( ξ 2 ), and technological innovation ( ξ 3 ); y i is an observable random vector, which represents the 12 apparent variables, such as innovation inputs, basic research, and so on. And Λ is the factor loading matrix, which takes the following form:
Λ T = 1 λ 2 , 1 λ 3 , 1 0 0 0 0 1 0 0 0 0 0 0 0 0 0 0 0 0 λ 5 , 2 λ 6 , 2 0 0 0 0 1 λ 8 , 3 0 0 0 0 0 0 0 0 0 0 0 0 λ 9 , 3 0 0 0 0 1 λ 11 , 4 λ 12 , 4
where λ is the structural parameter in the measurement model. Assume that ε i obeys a N 0 , Ψ ε distribution, and Ψ ε is a diagonal matrix.
The structural equation is
η i = γ 1 ξ 1 + γ 2 ξ 2 + γ 3 ξ 3 + δ
where ( γ 1 , γ 2 , γ 3 ) T is the unknown regression coefficient matrix, assuming that ( γ 1 , γ 2 , γ 3 ) T and δ are independently distributed in N 0 , Φ and N 0 , Ψ δ ; Ψ ε is a diagonal matrix.
BSEM is a Bayesian-based approach for estimating structural equation models. Compared with conventional SEM frameworks, BSEM offers three distinctive advantages: First, enhanced small-sample performance: Through systematic integration of prior distributions, BSEM effectively compensates for data sparsity limitations. They are particularly valuable when working with limited observational data. Second, flexible model specification: Utilizing weakly informative priors, BSEM enables full parameter estimation without imposing arbitrary constraints, thereby overcoming traditional identification requirements through Bayesian regularization. Third, probabilistic uncertainty characterization: BSEM provides complete posterior distributions that directly quantify parameter uncertainty through Bayesian inference, offering richer statistical information than point estimates and standard errors in frequentist approaches.
The specific steps involved in the Bayesian method are as follows:
Let the observable data be Y = y 1 , , y n and the latent variables Ω = ω 1 , , ω n , and let θ denote the vector containing the unknown parameters of Λ , Ψ ε , ( γ 1 , γ 2 , γ 3 ) T , Φ , and Ψ δ . In Bayesian estimation, based on the sampling process, with the help of the Markov chain Monte Carlo method, in the posterior analysis, the latent variables Ω are augmented by the observable data Y , and joint posterior distribution p θ , Ω Y is considered. After running a sufficiently large number ( T * ) of samples from the augmented joint posterior distribution p θ , Ω Y using Gibbs sampling, the posterior distribution is approximated by applying the empirical distribution. We implement Gibbs sampling as follows. In the ( j + 1 )th iteration, the current values are Ω ( j ) and θ ( j ) :
(1)
Extract p Ω θ ( j ) , Y from Ω ( j + 1 ) ;
(2)
Extract p θ Ω ( j + 1 ) , Y from θ ( j + 1 ) ;
(3)
Extract p Y Ω ( j + 1 ) , θ ( j + 1 ) from Y ( j + 1 ) .
Under normal conditions, the samples converge to give the expected posterior distribution, whereas in the process of determining the posterior distribution, the distributions of the parameters ( Λ , Ψ ε ) and Φ need to be given.
Let θ ( t ) , Ω ( t ) : t = 1 , , T * be the sample drawn from the joint posterior distribution of θ , Ω through Gibbs sampling, given Y . E θ Y and V a r θ Y are the posterior mean and covariance matrices, respectively. The Bayesian estimates of θ and their standard deviations are calculated using the following equation:
θ ^ = T 1 t = 1 T θ ( t )
V a r θ Y = ( T 1 ) 1 ( θ ( t ) θ ^ ) ( θ ( t ) θ ^ ) T
For any given y i , let E ω i y i and V a r ω i y i denote the posterior mean and covariance matrices, respectively, and let ω i 0 denote the true factor scores of F. The Bayesian estimate of ω i and its standard deviation can be computed using the following equation; they are the consistent estimates of E ω i y i and V a r ω i y i , respectively:
ω ^ i = T 1 t = 1 n ω i ( t )
V a r ω i Y = ( T 1 ) 1 ( ω i ( t ) ω ^ i ( t ) ) ( ω i ( t ) ω ^ i ( t ) ) T

3.2. Indicators

The selection of observable indicators for the SEM requires careful consideration of model assumptions, sample size, and data representativeness. Therefore, based on the theory framework and the conclusions of the relevant research works, and considering the limited national-level sample size as well as the complex relationships among latent variables, this study selects 12 representative observable variables to measure the four latent variables. Specifically, following the methodologies of Hosseini [19], GSCR is measured through three dimensions: absorptive, adaptive, and recovery capacity. Absorptive capacity is operationalized through yield per unit area, reflecting the supply chain’s initial risk buffering capacity by optimizing productive efficiency per cultivated land unit. Adaptive capacity is proxied by per capita grain availability, where its temporal variation coefficient captures the system’s operational adjustment efficiency. As per FAO standards, systems exceeding the 400 kg/capita availability threshold demonstrate enhanced supply–demand rebalancing capacity through strategic reserve reallocation and interregional logistics coordination. Recovery capacity is measured by the disaster-impact mitigation ratio (DIMR = Affected area/Disaster-prone area), quantifying self-organizing restoration through disaster damage transformation efficiency. Additionally, infrastructure in the grain industry is measured by the effective irrigated area, total agricultural machinery power, and national railway grain freight volume. Government policy assistance is characterized by the agricultural product production price index, commodity retail price index, and the state’s public payments for agriculture, forestry, and water. Technological innovation is represented by R&D expenditure, the number of major agricultural scientific achievements, and the number of agricultural scientific papers indexed in SCI.

3.3. Data Description

Based on availability, we use Chinese data from 1996 to 2022 in our analysis. This is because the data for China for the time period 1996–2022 cover (1) the development from grain reserve system establishment (1996) to smart agriculture initiatives (2022); (2) events including WTO integration and trade wars; (3) innovations from mechanization to blockchain applications. Moreover, Bai–Perron tests confirmed 1996 as the earliest statistically stable baseline (p < 0.01).
Data sources: The data on grain yield per unit area, per capita possession of grain, effective irrigated area, total power of agricultural machinery, and national railway grain freight volume are taken from the China Statistical Yearbooks; the disaster-prone area, the disaster-affected area, the production price index of agricultural products, and the retail sales index are taken from the China Rural Statistical Yearbooks; expenditure data on agriculture, forestry, and water affairs in the national treasury are taken from the China Financial and Economic Statistical Yearbooks; the research and experimental development spending, the number of major scientific and technological achievements in agriculture, and the number of agricultural science and technology papers included in SCI are taken from the China Science and Technology Statistical Yearbooks. Since the number of agricultural scientific papers indexed in SCI in 2022 could not be directly obtained, linear interpolation was used, with the formula x 2022 = 2 x 2021 x 2020 (where x 2022 indicates indicator data for 2022). The definition of observation indicators corresponding to each latent variable and the results of descriptive statistical analysis are shown in Table 1.

4. Analyzing and Testing the Empirical Results

4.1. Setting Up a Priori Information

Specifying prior information for the parameters is a critical step in Bayesian estimation [38]. When estimating structural equation models using Bayesian methods, the prior distributions of unknown parameters must be predefined. However, the existing studies on GSCR lack sufficient empirical tests, making it challenging to assign values to the hyperparameter prior distributions required for estimation based on historical data. Therefore, based on previous work concerning BSEM [39], this study employs the following conjugate prior distributions to conduct Bayesian analysis of the proposed SEM:
Φ 1 = D W 3 B , 10 ;   φ ε k 1 = D G a m m a 6 , 10 ; Λ k = D N 0.8 , 4 φ ω k I ; φ δ 1 = D G a m m a 6 , 10 ; Γ = D N M , φ δ I ; B = 2 1 0 1 2 1 0 1 2 ; M = 0.5 0.5 0.5
where I is the unit matrix of the corresponding dimension.

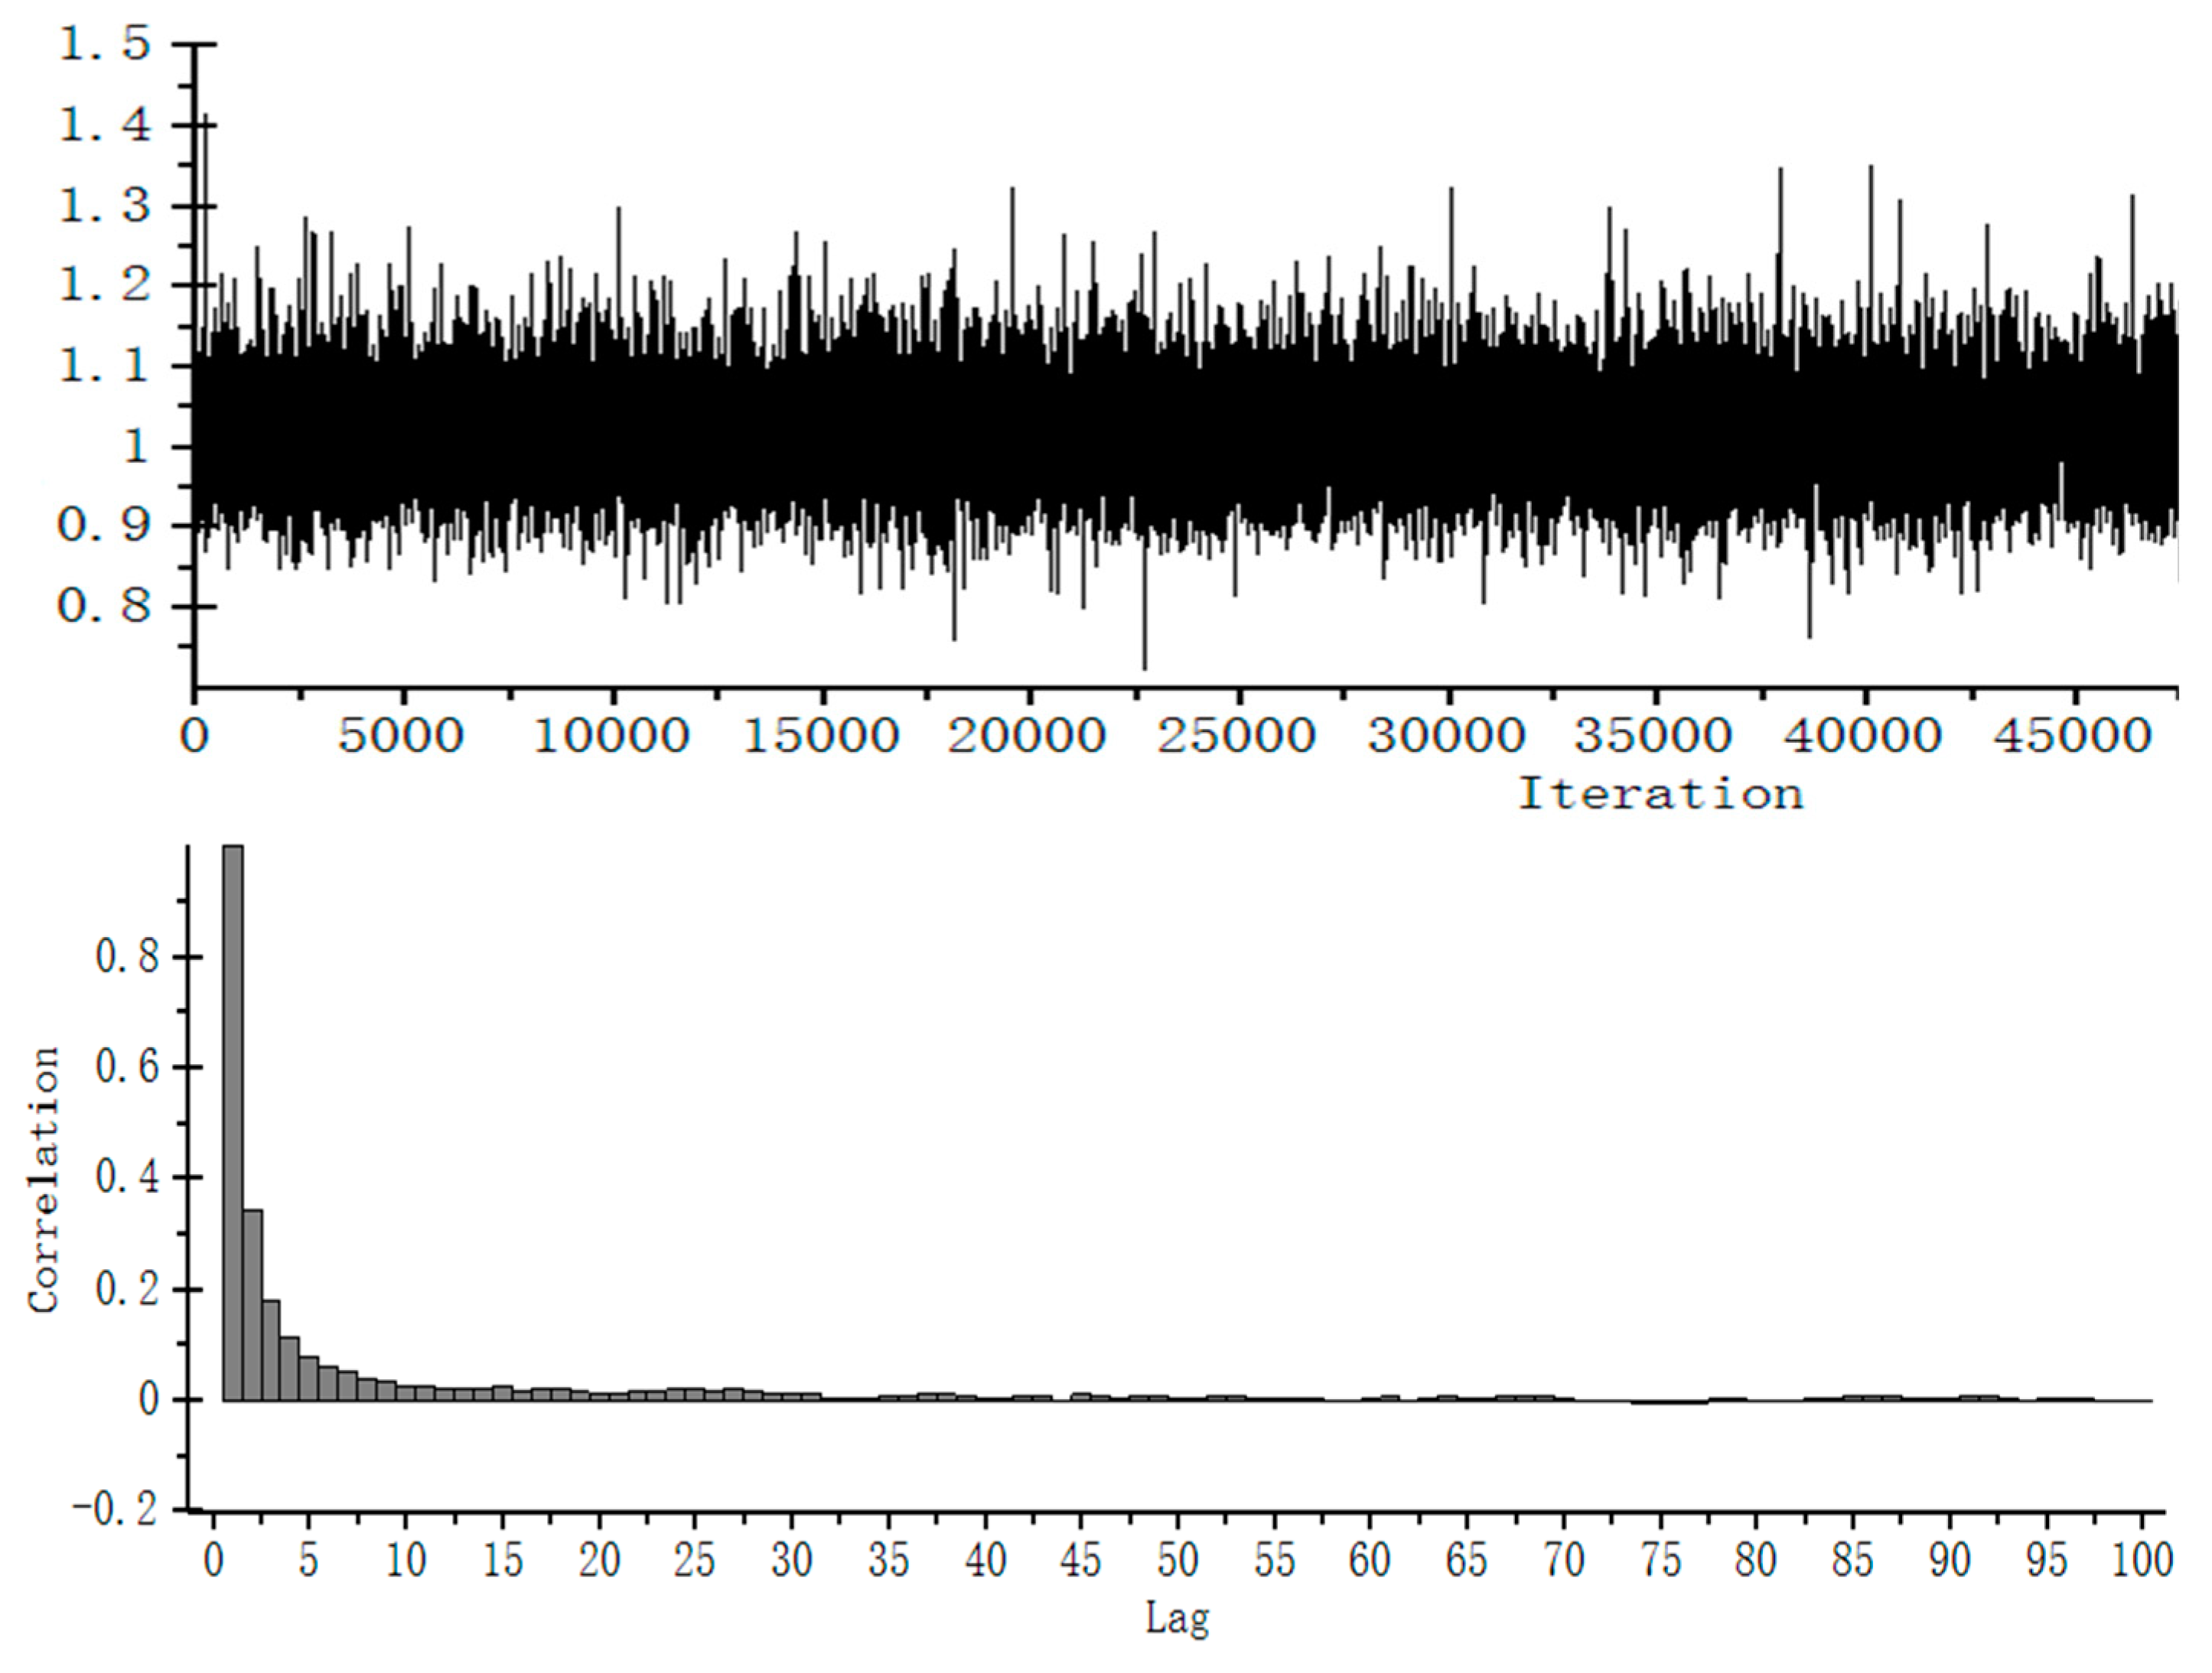
4.2. Convergence Analysis of Bayesian Structural Equation Modeling

Using Amos Graphics 24.0 software, we calculate the Bayesian estimation by substituting the normalized data into the above SEM. Figure 3 shows a randomly selected sequence of parameter plots at different initial values, as well as autocorrelation plots, to reveal the convergence. The figure illustrates that the procedure was iterated 45,000 times and converged at 5000 iterations. We collect 5000 observations after convergence to produce the estimates and their standard errors.

4.3. Parameter Estimation Results

The Bayesian estimation of the SEM for China’s GSCR is conducted using Amos Graphics. The posterior predictive p-value (PPp) of 0.463 indicates a good model fit, and detailed parameter estimation results are presented in Table 2. As shown in Table 2, all model parameters are statistically significant at the 10% level, with positive coefficients, confirming the validity of the theoretical assumptions.
In terms of direct effects, government aid has the largest direct effect on GSCR, with a coefficient of 0.459; this is followed by the level of technological innovations, with a coefficient of 0.406. Infrastructure has the smallest effect, at 0.141. This is consistent with China’s national context. The Chinese government plays a central leading role in building GSCR. Through multi-dimensional initiatives, such as policy regulation, scientific and technological innovation, and reserve guarantee, it has constructed a resilience system covering the whole industrial chain to effectively cope with domestic and international risk challenges.
In terms of indirect effects, government aid has an indirect impact on GSCR through technological innovations and infrastructure, respectively. The size of the indirect effect is measured by the product of the covariance between the latent variables and the direct effect coefficient. Therefore, the magnitude of the indirect effect of government aid on GSCR is 0.469, while the indirect effect through infrastructure development is 0.139. The indirect effect through technological innovation activities is 0.330, while the indirect effect of technological innovations on GSCR through infrastructure is 0.026. The results show that in the governance of GSCR, the government has systematically constructed a resilience enhancement framework covering technological empowerment (e.g., blockchain traceability, smart irrigation) and facility redundancy (e.g., multi-modal transport network, distributed warehousing). They did this through the implementation of a synergistic strategy of science and technology innovation drive and infrastructure resilience construction. This is consistent with the findings of Li et al. (2020) [40]. However, the current diminishing marginal benefits of investment in infrastructure development have led to weak indirect effects, contradicting the direct infrastructure dominance hypothesis in African contexts [41]. Meanwhile, the indirect effect of technological innovations through infrastructure is only 0.026, reflecting two problems: one is the lack of technological adaptability, leading to some scientific research results (such as the blockchain traceability system) not being effectively embedded in existing facilities due to high costs and complex operations; the second is the lack of supporting policies for technology diffusion, resulting in a low rate of transformation of innovative achievements.
In terms of the total effect, the direct impact and indirect impact effects are combined into a comprehensive impact effect. The calculations show that the combined effect of government aid on GSCR is 0.928; that of technological innovations is 0.432; and that of infrastructure is 0.141. The results show that, first, government aid has a significant multiplier effect on the GSCR. This effect stems from the Chinese government’s unique policy toolbox, such as the 2023 National Food Security Industrial Belt Construction Plan, which leverages social capital to participate in the construction of smart grain warehouses. It does so through the central government’s subsidized interest rate loans and achieves a financial amplification effect of 1:3.6. Second, the ‘long-tail effect’ of technological innovations has not yet been fully released. Although the total effect of technological innovation ranks second (0.432), its indirect effect through infrastructure is only 0.026, exposing the bottleneck of technological transformation. Finally, the total effect of infrastructure is the lowest, reflecting the limitations of the traditional model of ‘focusing on construction but not operation’. Taking farmland water conservancy facilities as an example, although China’s effective irrigated area has reached 730 million mu (by 2022), the utilization rate of the facilities is only 58 per cent. This phenomenon has led to a ‘high input, low elasticity’ situation in terms of the contribution of infrastructure to resilience.

4.4. Comprehensive Analysis of GSCR in China

Based on the parameter estimation results, the standardized path coefficients of each latent variable in the model are normalized to derive the corresponding weights of each indicator [42]. Using Formula ω j = i = 1 k ρ i j y i j (where ρ i represents the weight of the ith observation indicator for the jth latent variable), the levels of China’s GSCR, infrastructure, government assistance, and technological innovation from 1996 to 2022 are calculated. The results are presented in Figure 4. Regarding temporal trends, China’s GSCR declined gradually from 1996 to 2003, reaching its lowest point in 2003. From 2003 onwards, the resilience level exhibited an overall upward spiral trend, with a notable surge after 2006 and a significant jump in 2018. In 2003, China explicitly prioritized the resolution of the ‘three rural issues’ (agriculture, rural areas, and farmers) in official documents for the first time, marking it as a top priority for the Party and government. Additionally, a pilot direct subsidy policy for grain production was implemented. In 2006, the ‘No. 1 Central Document’ and the ‘Two Sessions’ introduced a series of measures, including the abolition of agricultural taxes and the provision of loan support for grain circulation to grain enterprises. These policies revitalized China’s grain production and distribution systems.

5. Conclusions and Policy Recommendations

To our knowledge, this study is the first to apply BSEM in the field of GSCR, thus breaking through the limitations of the traditional method in small-sample data, verifying the effectiveness of BSEM in analyzing the cross-influence of multiple latent variables, and providing a new methodological framework for the study of GSC complexity. Second, this study constructs a three-dimensional driving model of ‘infrastructure–technological innovation–government aid’, which systematically reveals the direct and indirect mechanisms of each factor in the GSCR, and it provides a theoretical basis for guaranteeing national food security and realizing the sustainable development of the grain industry.
The policy recommendations are structured as follows: First, optimize governmental assistance mechanisms, strengthen policy leverage effects, and establish a comprehensive resilience governance system. As the core driver of GSCR, governmental assistance should transition from ‘extensive input’ to ‘precision regulation’, focusing on systemic design optimization and capital allocation. This strategic shift will amplify policy multiplier effects by establishing robust grain market monitoring and early warning systems, thereby enhancing the authorities’ capacity for timely market regulation. Second, accelerate technological innovation transformation to address adaptability bottlenecks and create an integrated ‘R&D–application–diffusion’ ecosystem. Establishing a National Grain Technology Innovation Center could synergize academic, industrial, and entrepreneurial resources, aggregating expertise in loss-reduction technologies, equipment engineering, and digital solutions. This integration would drive full-chain mechanization and smart transformation while leveraging big data analytics to enhance emergency response capabilities against natural disasters, pandemics, and market volatility. Third, upgrade infrastructure quality and efficiency to overcome marginal diminishing returns through ‘hard–soft’ coordinated advancement. Strategic investments should prioritize the modernization of storage facilities, logistics networks, and processing infrastructure. This should be complemented by pilot projects for integrated logistics centers combining procurement, storage, and quality assurance in qualified regions. Finally, strengthen interdepartmental collaboration through dedicated information-sharing platforms that facilitate coordinated actions in financing, policy implementation, and risk mitigation among government agencies, state-owned enterprises, technology firms, and research institutions. This collaborative framework will ensure rapid response capacity and loss minimization during supply chain disruptions.

6. Limitations and Future Research

This study faces several limitations. First, the data used in this study are derived from China’s annual statistics, which limits the generalizability of the findings to countries with similar development levels. Cultural and developmental differences may also restrict the applicability of the results to other countries. Therefore, future research could apply the methodology and framework of this study to compare the effects of the same factors on GSCR across different policy environments using data from multiple countries. Second, the sample size of this study is limited due to the unavailability of data on technological innovations prior to 1996. Future studies should expand the sample size to explore the effects of additional factors on GSCR. Finally, this study did not account for spatial effects between regions on GSCR. Future research could incorporate national macro-economic data and international trade data to analyze the factors influencing GSCR.

Author Contributions

Conceptualization, J.Y., R.G. and H.L.; Methodology, J.Y.; Software, J.Y.; Validation, R.G. and X.L.; Formal analysis, J.Y., R.G. and H.L.; Investigation, H.L. and X.L.; Data curation, J.Y.; Writing—original draft, J.Y.; Writing—review & editing, J.Y. and X.L.; Visualization, R.G. and X.L.; Supervision, H.L. and X.L. All authors have read and agreed to the published version of the manuscript.

Funding

This research was supported by the earmarked fund for Major Project of the National Philosophy and Social Science Fund of China (23&ZD119).

Institutional Review Board Statement

Not applicable.

Informed Consent Statement

Not applicable.

Data Availability Statement

The data presented in this study are available on request from the corresponding author.

Conflicts of Interest

The authors declare no conflict of interest.

References

  1. Chen, Z.; Zhang, M.; Dong, R.K.; Wang, S. Building resilient food security against global crisis: New evidence from China. Food Energy Secur. 2024, 13, e70008. [Google Scholar] [CrossRef]
  2. Morkunas, M.; Labukas, P. The evaluation of negative factors of direct payments under common agricultural policy from a viewpoint of sustainability of rural regions of the new EU member states: Evidence from Lithuania. Agriculture 2020, 10, 228. [Google Scholar] [CrossRef]
  3. FAO Statistical Yearbook 2023. Available online: https://openknowledge.fao.org/server/api/core/bitstreams/6e04f2b4-82fc-4740-8cd5-9b66f5335239/content (accessed on 3 March 2025).
  4. Yu, S.; Bai, X.; Zhao, J.; Zeng, Y.; Wang, Y.; Wang, Z.; Wang, L.; Shi, Z. Mismatch between provincial grain production and consumption increased cropland soil erosion in China. Agric. Ecosyst. Environ. 2024, 367, 108999. [Google Scholar] [CrossRef]
  5. Chen, L.; Xia, X.; Zhang, J.; Zhu, Y.; Long, C.; Chen, Y.; Guo, W.; Xu, L.; Jia, J. The food security risks in the Yangtze River Delta of China associated with water scarcity, grain production, and grain trade. Sci. Total Environ. 2024, 948, 174863. [Google Scholar] [CrossRef]
  6. Huang, J.; Yang, G. Understanding recent challenges and new food policy in China. Glob. Food Secur. 2017, 12, 119–126. [Google Scholar] [CrossRef]
  7. Coluccia, B.; Agnusdei, G.P.; Miglietta, P.P.; De Leo, F. Effects of COVID-19 on the Italian agri-food supply and value chains. Food Control 2021, 123, 107839. [Google Scholar] [CrossRef]
  8. Zurek, M.; Ingram, J.; Bellamy, A.S.; Goold, C.; Lyon, C.; Alexander, P.; Barnes, A.; Bebber, D.P.; Breeze, T.D.; Bruce, A.; et al. Food system resilience: Concepts, issues, and challenges. Annu. Rev. Environ. Resour. 2022, 47, 511–534. [Google Scholar] [CrossRef]
  9. Tendall, D.; Joerin, J.; Kopainsky, B.; Edwards, P.; Shreck, A.; Le, Q.; Kruetli, P.; Grant, M.; Six, J. Food system resilience: Defining the concept. Glob. Food Secur. 2015, 6, 17–23. [Google Scholar] [CrossRef]
  10. Manning, L.; Soon, J.M. Building strategic resilience in the food supply chain. Br. Food J. 2016, 118, 1477–1493. [Google Scholar] [CrossRef]
  11. de la Peña García, A.; Zimmermann, S.A.; Eleuterio, A.A. Food supply chains, family farming, and food policies under the COVID-19 pandemic in a Brazilian city. Hum. Organ. 2020, 79, 323–332. [Google Scholar] [CrossRef]
  12. Kummu, M.; Kinnunen, P.; Lehikoinen, E.; Porkka, M.; Queiroz, C.; Röös, E.; Troell, M.; Weil, C. Interplay of trade and food system resilience: Gains on supply diversity over time at the cost of trade independency. Glob. Food Secur. 2020, 24, 100360. [Google Scholar] [CrossRef]
  13. Chang, J.; Jiang, H. Spatio-temporal differentiations and influence factors in China’s grain supply chain resilience. Sustainability 2023, 15, 8074. [Google Scholar] [CrossRef]
  14. Macfadyen, S.; Tylianakis, J.M.; Letourneau, D.K.; Benton, T.G.; Tittonell, P.; Perring, M.P.; Gómez-Creutzberg, C.; Báldi, A.; Holland, J.M.; Broadhurst, L.; et al. The role of food retailers in improving resilience in global food supply. Glob. Food Secur. 2015, 7, 1–8. [Google Scholar] [CrossRef]
  15. Zhang, Y.; Yang, K.; Hou, S.; Zhong, T.; Crush, J. Factors determining household-level food insecurity during COVID-19 epidemic: A case of Wuhan, China. Food Nutr. Res. 2021, 65, 10–29219. [Google Scholar] [CrossRef]
  16. Reardon, T.; Vos, R. How resilience innovations in food supply chains are revolutionizing logistics, wholesale trade, and farm services in developing countries. Int. Food Agribus. Manag. Rev. 2023, 26, 455–466. [Google Scholar] [CrossRef]
  17. Umar, M.; Wilson, M.M. Inherent and adaptive resilience of logistics operations in food supply chains. J. Bus. Logist. 2024, 45, e12362. [Google Scholar] [CrossRef]
  18. Hernández, J.M.; Pedroza-Gutiérrez, C. Estimating the influence of the network topology on the agility of food supply chains. PLoS ONE 2019, 14, e0218958. [Google Scholar] [CrossRef]
  19. Hosseini, S.; Ivanov, D.; Dolgui, A. Review of quantitative methods for supply chain resilience analysis. Transp. Res. Part E Logist. Transp. Rev. 2019, 125, 285–307. [Google Scholar] [CrossRef]
  20. Gomez, M.; Grady, C. A balancing act: The interplay of food supply chain resilience and environmental sustainability in American cities. Environ. Res. Lett. 2023, 18, 124022. [Google Scholar] [CrossRef]
  21. Scholten, K.; Schilder, S. The role of collaboration in supply chain resilience. Supply Chain Manag. Int. J. 2015, 20, 471–484. [Google Scholar] [CrossRef]
  22. Hassini, E.; Ben-Daya, M.; Bahroun, Z. Modeling the impact of IoT technology on food supply chain operations. Ann. Oper. Res. 2023, 1–30. [Google Scholar] [CrossRef]
  23. Charatsari, C.; Lioutas, E.D.; De Rosa, M.; Vecchio, Y. Technological innovation and agrifood systems resilience: The potential and perils of three different strategies. Front. Sustain. Food Syst. 2022, 6, 872706. [Google Scholar] [CrossRef]
  24. Zhong, J.; Cheng, H.; Jia, F. Supply chain resilience capability factors in agri-food supply chains. Oper. Manag. Res. 2024, 17, 850–868. [Google Scholar] [CrossRef]
  25. Alam, G.M.; Khatun, M.N.; Sarker, M.N.I.; Joshi, N.P.; Bhandari, H. Promoting agri-food systems resilience through ICT in developing countries amid COVID-19. Front. Sustain. Food Syst. 2023, 6, 972667. [Google Scholar] [CrossRef]
  26. Belhadi, A.; Kamble, S.; Subramanian, N.; Singh, R.K.; Venkatesh, M. Digital capabilities to manage agri-food supply chain uncertainties and build supply chain resilience during compounding geopolitical disruptions. Int. J. Oper. Prod. Manag. 2024, 44, 1914–1950. [Google Scholar] [CrossRef]
  27. Liu, Z.; Liang, H.; Pu, D.; Xie, F.; Zhang, E.; Zhou, Q. How does the control of grain purchase price affect the sustainability of the national grain industry? One empirical study from China. Sustainability 2020, 12, 2102. [Google Scholar] [CrossRef]
  28. Chen, Y.; Zhang, Z.; Mishra, A.K. A flexible and efficient hybrid agricultural subsidy design for promoting food security and safety. Humanit. Soc. Sci. Commun. 2023, 10, 372. [Google Scholar] [CrossRef]
  29. Hobbs, J.E. Food supply chain resilience and the COVID-19 pandemic: What have we learned? Can. J. Agric. Econ. 2021, 69, 189–196. [Google Scholar] [CrossRef]
  30. Beck, J.; Birkel, H.; Spieske, A.; Gebhardt, M. Will the blockchain solve the supply chain resilience challenges? Insights from a systematic literature review. Comput. Ind. Eng. 2023, 185, 109623. [Google Scholar] [CrossRef]
  31. Lee, H.L.; Padmanabhan, V.; Whang, S. The bullwhip effect in supply chains. IEEE Eng. Manag. Rev. 1997, 43, 108–117. [Google Scholar] [CrossRef]
  32. Muthén, B.; Asparouhov, T. Bayesian structural equation modeling: A more flexible representation of substantive theory. Psychol. Methods 2012, 17, 313–335. [Google Scholar] [CrossRef] [PubMed]
  33. Orengo Serra, K.L.; Sanchez-Jauregui, M. Food supply chain resilience model for critical infrastructure collapses due to natural disasters. Br. Food J. 2022, 124, 14–34. [Google Scholar] [CrossRef]
  34. Stone, J.; Rahimifard, S. Resilience in agri-food supply chains: A critical analysis of the literature and synthesis of a novel framework. Supply Chain Manag. Int. J. 2018, 23, 207–238. [Google Scholar] [CrossRef]
  35. Colicchia, C.; Strozzi, F. Supply chain risk management: A new methodology for a systematic literature review. Supply Chain Manag. Int. J. 2012, 17, 403–418. [Google Scholar] [CrossRef]
  36. McClements, D.J.; Barrangou, R.; Hill, C.; Kokini, J.L.; Lila, M.A.; Meyer, A.S.; Yu, L. Building a resilient, sustainable, and healthier food supply through innovation and technology. Annu. Rev. Food Sci. Technol. 2021, 12, 1–28. [Google Scholar] [CrossRef]
  37. Yang, Y.; Xu, X. Post-disaster grain supply chain resilience with government aid. Transp. Res. Part E Logist. Transp. Rev. 2015, 76, 139–159. [Google Scholar] [CrossRef]
  38. Qiao, X.; Feng, Y.; Pan, J. The Principle of Bayesian Structural Equation Model and Its Application in Psychology. Psychol. Tech. Appl. 2023, 11, 599–619. [Google Scholar] [CrossRef]
  39. Shi, J.Q.; Lee, S.Y. Bayesian sampling-based approach for factor analysis models with continuous and polytomous data. Br. J. Math. Stat. Psychol. 1998, 51, 233–252. [Google Scholar] [CrossRef]
  40. Li, S.; Li, Z.; Yuan, J. Examining the impact of high-speed railways on land value and government revenue: Evidence from China. China Econ. Rev. 2020, 63, 101502. [Google Scholar] [CrossRef]
  41. Banson, K.E.; Nguyen, N.C.; Bosch, O.J.H.; Nguyen, T.V. A systems thinking approach to address the complexity of agribusiness for sustainable development in Africa: A case study in Ghana. Syst. Res. Behav. Sci. 2015, 32, 672–688. [Google Scholar] [CrossRef]
  42. Li, M.; Sun, X.; Luo, J. Green responsibility of manufacturing enterprises from the perspective of industrial chain: Identification framework, measurement methods, and comparative research. Stat. Res. 2024, 41, 87–97. (In Chinese) [Google Scholar] [CrossRef]
Figure 1. Theoretical framework of factors affecting GSCR.
Sustainability 17 03250 g001
Figure 2. Path analysis chart of factors affecting GSCR.
Sustainability 17 03250 g002
Figure 3. Parameter trajectory and autocorrelation plots for γ 3 .
Sustainability 17 03250 g003
Figure 4. Trends in GSCR, infrastructure, government aid, and technological innovation in China (1996–2022).
Sustainability 17 03250 g004
Table 1. Results of descriptive statistics of variables.
Latent VariableExplicit
Variables
Indicator InterpretationSample SizeMeanMaximum ValueMinimum ValueStandard Error
GSCR
( η )
Absorptive capacity
( y 1 )
Yield per unit area (kg/ha)275021.158054261.15544.4
Adaptive capacity
( y 2 )
Per capita possession of grain (kg)27422.3486.1334.347.7
Recovery capacity
( y 3 )
Percentage of disaster-affected area to disaster-stricken area (%)270.5000.6280.3620.074
Infrastructure development
( ξ 1 )
Water facilities for grain production
( y 4 )
Effective irrigated area (thousand hectares)2760.170.450.465.6
Technological facilities for grain production
( y 5 )
Total power of agricultural machinery (10,000 kW)278.11811.1733.8552.430
Logistics facilities for grain
( y 6 )
National railway grain freight volume (ten thousand tons)278.43011.4695.5411.820
Government aid
( ξ 2 )
Financial support
( y 7 )
Expenditure on agriculture, forestry, and water affairs in the national treasury (billions of yuan)279.53423.9480.7008.524
Price regulation of raw materials for grain production
( y 8 )
Production price index of agricultural products27653.0987.1361.6206.7
Retail price regulation of grain
( y 9 )
Retail sales index27408.7498.7346.748.82
Technological innovations
( ξ 3 )
Innovation inputs
( y 10 )
Research and experimental development spending27932.53078.240.4929.5
Basic research
( y 11 )
Number of major scientific and technological achievements in agriculture272391.19000432558.8
Applied research
( y 12 )
Number of agricultural scientific papers indexed in SCI 276051.8978334531992.9
Note: To clearly present the characteristics of each variable, the data in the table represent descriptive statistics of the variables without normalization or standardization.
Table 2. Results of BSEM parameter estimation.
Path RelationBayesian Estimation Method
MeanS.E.P
GSCR Infrastructure0.1410.006*
GSCR Technological innovations0.4060.004**
GSCR Government aid0.4590.010*
Infrastructure Technological innovations0.1810.007*
Infrastructure Government aid0.9890.002**
Technological innovations Government aid0.8120.009*
Absorptive capacity GSCR1--
Adaptive capacity GSCR0.9240.001***
Recovery capacity GSCR1.0270.001***
Water facilities for grain production Infrastructure1--
Technological facilities for grain production Infrastructure1.0180.001***
Logistics facilities for grain Infrastructure0.9620.001***
Financial support Government aid1--
Price regulation of raw materials for grain production Government aid1.0140.001***
Retail price regulation of grain Government aid1.0000.002**
Innovation inputs Technological innovations1-
Basic research Technological innovations0.9630.001***
Applied research Technological innovations0.9880.000***
Note: *, **, and *** denote statistical significance at the 10%, 5%, and 1% levels, respectively.
Disclaimer/Publisher’s Note: The statements, opinions and data contained in all publications are solely those of the individual author(s) and contributor(s) and not of MDPI and/or the editor(s). MDPI and/or the editor(s) disclaim responsibility for any injury to people or property resulting from any ideas, methods, instructions or products referred to in the content.

