Article

Destination Competitiveness Through the Lens of Tourist Spending: A Case Study of the Canary Islands

by
Ana María Barrera-Martínez
1,
Agustín Santana-Talavera
2,* and
Eduardo Parra-López
3
1
Interuniversity Doctoral Programme in Tourism, Institute of Social Research and Tourism ISTUR, University of La Laguna, 38200 La Laguna, Spain
2
Department of Sociology and Anthropology, Institute of Social Research and Tourism ISTUR, University of La Laguna, 38200 La Laguna, Spain
3
Department of Business Management and Economic History, Institute of Social Research and Tourism ISTUR, University of La Laguna, 38200 La Laguna, Spain
*
Author to whom correspondence should be addressed.
Sustainability 2025, 17(7), 3262; https://doi.org/10.3390/su17073262
Submission received: 25 February 2025 / Revised: 25 March 2025 / Accepted: 28 March 2025 / Published: 7 April 2025

Abstract

:
The competitiveness of tourism destinations is a multidimensional concept encompassing natural and cultural resources, infrastructure, accessibility, and services that cater to an increasingly discerning tourism market. Business ecosystems enhance these competitive conditions by adapting to consumers seeking high-value, differentiated experiences. This study examined the relationship between accommodation supply and tourist expenditure in the Canary Islands based on a sample of 38,071 visitors from the 2024 Tourist Expenditure Survey (EGT) of the Canary Islands Statistics Institute. Using Python and R for statistical processing, the findings revealed distinct spending patterns across accommodation types, from five-star hotels to peer-to-peer rentals, demonstrating how supply diversification influences competitiveness. The results reinforce prior research on the significance of investing in infrastructure, technology, and human capital to optimise the tourist experience. Tourist expenditure serves as an indicator of competitiveness, reflecting visitor preferences and the destination’s capacity to meet them. Accommodation choice is identified as a key determinant of spending patterns and their distribution within the local economy. This study provides an analytical basis for evaluating tourism strategies, emphasising the strategic importance of accommodation heterogeneity. It advances methodological understanding of tourist spending behaviour, offering a practical framework for destination development and strategic planning.

1. Introduction

Tourism has established itself as a predominant economic activity that significantly contributes to the economic development and prosperity of numerous destinations [1,2]. This relevance is particularly evident in insular regions such as the Canary Islands, where the tourism sector represents 35% of the gross domestic product (GDP), serving as a fundamental pillar of the territory’s economic and social structure [3,4].
The economic and business environment of tourism is configured as a complex system wherein multiple variables and economic agents interact [5]. In this context, tourism development emerges as a catalyst for competitiveness, manifesting through the creation and consolidation of a specialised business fabric that responds to global market demands [6,7]. This relationship between tourism development and competitiveness is founded upon the sector’s capacity to generate added value and stimulate innovation within the destination, thereby contributing to the strengthening of the local economy.
Indeed, the competitiveness of tourist destinations has become one of the primary challenges of the contemporary global tourism industry, having garnered increasing academic attention over recent decades [8,9,10,11,12,13]. The measurement of tourism competitiveness has evolved towards more sophisticated analytical frameworks, with the Travel and Tourism Competitiveness Index (TTCI) emerging as a prominent tool for evaluating the development of the tourism business environment [14,15]. This index integrates objectively measurable variables, such as visitor numbers and tourism expenditure, alongside subjective elements, including cultural richness and the quality of the tourist experience. This duality has been explored in works such as [16,17], positioning tourist expenditure as a crucial factor in destination competitiveness. The type and quantity of expenditure manifests as a reflection of both tourist preferences and the destination’s capacity to meet their expectations [18].
The structure of tourism expenditure constitutes a central element for analysis, acting as the driving force of the tourism system, which can ensure the economic prosperity of the destination [19,20] and add value to tourist experiences. Dwyer and Kim (2003) and Mayer and Vogt (2016) [11,21] emphasise the importance of analysing the multiplier effects of tourism expenditure on the local economy, identifying the transmission mechanisms between initial spending and final economic impact. This structure is characterised by its multidimensional nature, incorporating variables such as accommodation and sustenance, which [22,23] identify as interconnected elements capable of influencing other dimensions of expenditure.
The configuration of accommodation offerings thus emerges as a fundamental element in this equation, significantly influencing tourism expenditure patterns and consequently the local economy. The analysis of these patterns enables exploration of the influence of supply heterogeneity on tourists’ consumption decisions and how these reflect visitors’ preferences across different expenditure categories [24]. Various studies [25,26] have suggested that expenditure on infrastructure, technology, and human capital is determinant in improving the tourist experience and encouraging greater spending, reinforcing the destination’s competitiveness in the global market, following the path of [27].
Within this contextual framework, the tourism system in general, and destinations in particular, must address the challenges marked by the demands of responding to the future with a perspective of sustainability (beyond environmental, socioeconomic). This raises the question of the socioeconomic contribution of the tourism system in areas where the tourist experience develops. The redistribution of wealth in insular territory materialises through tourism expenditure patterns and their capacity to generate multiplier effects in the local economy. Multiple academic investigations [28,29,30] demonstrate the importance of analysing socioeconomic variables, journey specificities, activity typology, and satisfaction levels to understand how tourism expenditure is distributed within the local economic fabric. This distribution is articulated through various fundamental categories, as proposed by [31,32], including accommodation infrastructure, mobility, acquisitions, and maintenance.
Social sustainability in tourism destinations encompasses the equitable distribution of tourism benefits among local stakeholders, the preservation of the social fabric, and the enhancement of community well-being [33,34]. Recent empirical investigations have demonstrated that these dimensions of social sustainability function not merely as ethical imperatives, but as fundamental components of long-term competitive advantage.
The redistribution of tourism revenue throughout destination economies represents a critical mechanism through which social sustainability directly influences competitiveness [35]. When tourism expenditure permeates diverse sectors of local economies rather than remaining concentrated within specific business entities or being repatriated to origin markets, it generates multidimensional competitive advantages. Destinations characterised by more equitable tourism revenue distribution exhibit enhanced service quality through broader workforce participation in tourism value creation [36]. The relationship between social sustainability and competitiveness is particularly relevant for mature destinations seeking to transition toward more sustainable development models without compromising their market position [37]. For such destinations, the diversification of accommodation supply and the resultant patterns of expenditure distribution represent strategic mechanisms through which this transition can be orchestrated.
Return visitation emerges as a crucial element in the configuration of tourism expenditure, given that recurring visitors develop differentiated consumption patterns [38,39]. This characteristic, along with the conceptualisation of tourism consumption as a multidimensional product determined by variables such as income, accommodation modalities, and length of stay [40,41], directly influences the destination’s capacity to generate and maintain sustainable competitive advantages.
This study aimed to elucidate the relationships among accommodation selection, expenditure distribution patterns, and destination competitiveness in the Canary Islands archipelago as a tourism destination. The primary objective was to conduct a comparative analysis of tourist expenditure patterns according to type of accommodation selected, considering both traditional accommodations (hotels, apartments, and villas) and more novel accommodations (peer-to-peer accommodation). To accomplish these objectives, we employed correlation and regression analyses utilising data from the Canary Islands Tourism Expenditure Survey (EGT) for the most recent complete annual cycle [42]. This methodological approach enabled a granular examination of expenditure behaviour while controlling for relevant sociodemographic and travel characteristics, thereby isolating the specific influence of accommodation selection on expenditure distribution and its consequent implications for destination competitiveness.
This analysis aims to contribute to the academic debate on tourist destination competitiveness, particularly regarding the importance of tourism expenditure as an indicator of industry success and the redistribution of its benefits as an indicator of sustainability. By contrasting expenditure behaviour as a competitiveness factor across different types of accommodation and its impact on the local economy, we aim to provide an empirical basis that can guide destination managers in planning effective policies and strategies that promote sustainable tourism that is economically beneficial for the local community.
The results reveal that the tourism commercialisation model significantly influences how tourism benefits are distributed in the destination economy through various dimensions, such as accommodation type, board basis selection, and temporal consumption patterns.

2. Materials and Methods

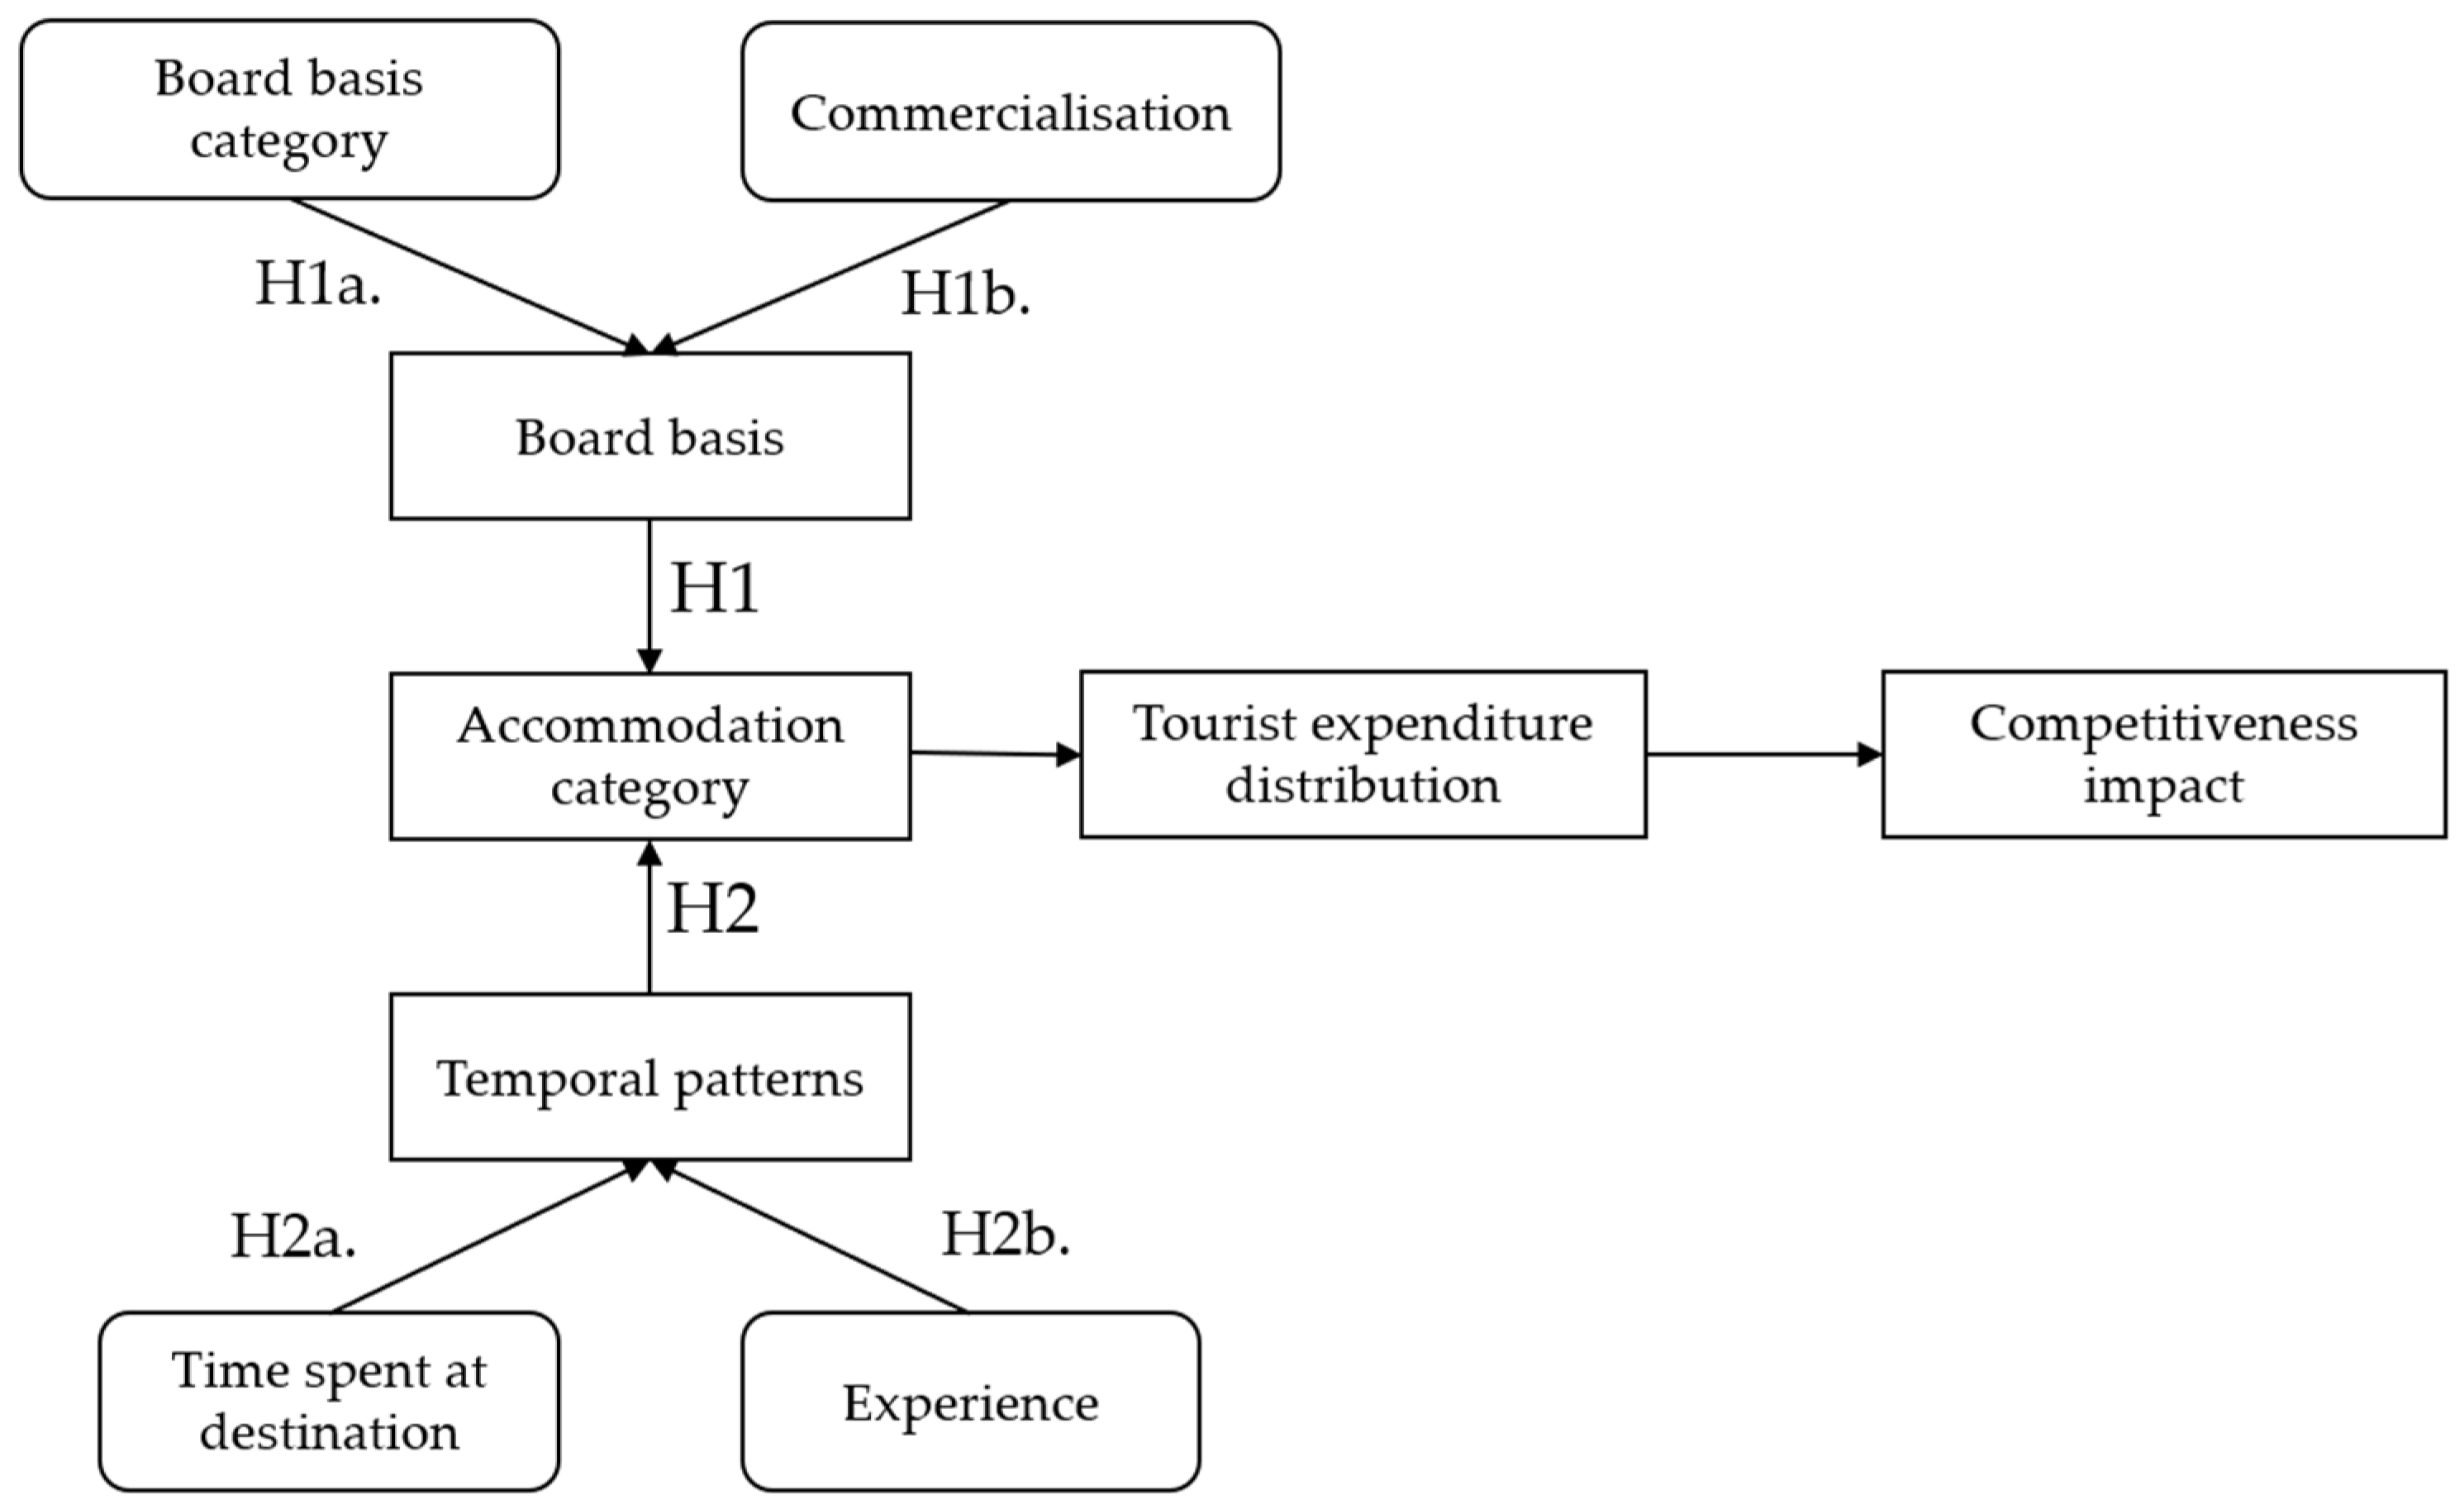
2.1. Hypotheses and Research Model
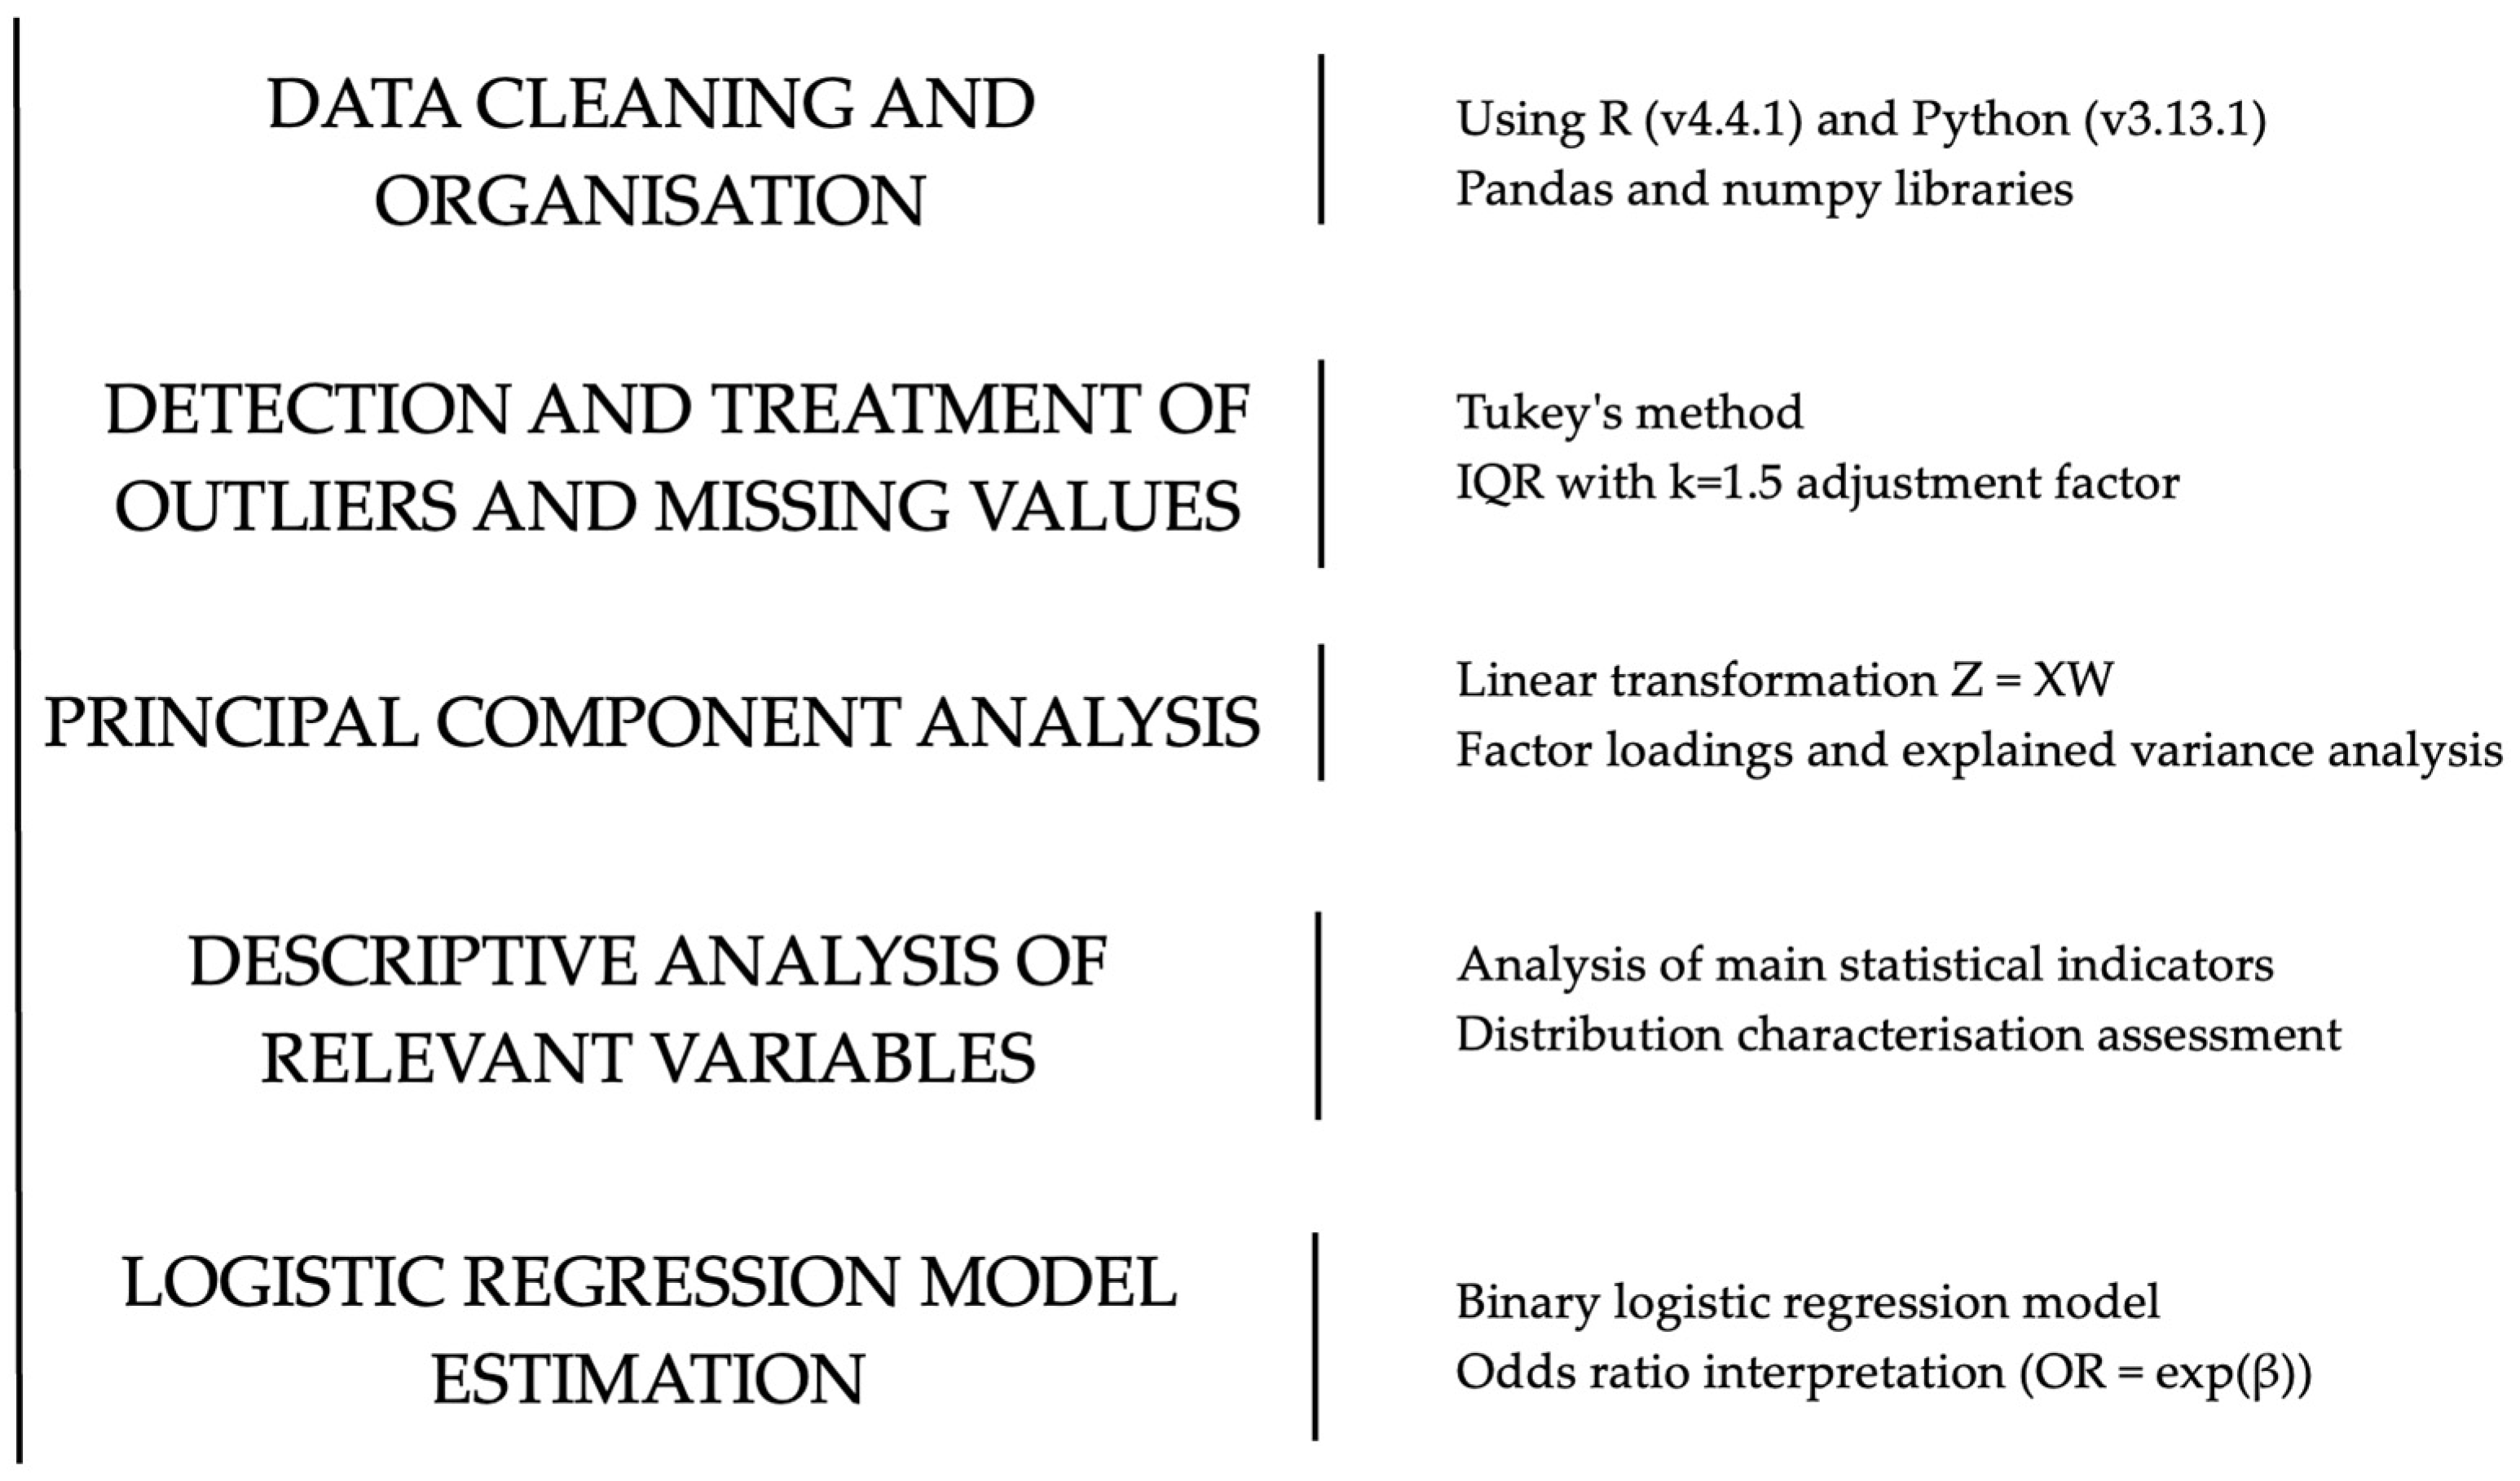
The analysis of the literature supports the development of various hypotheses that structure the research [43,44,45].
H1. 
The typology of tourist accommodation chosen and its board basis condition the structure and territorial distribution of tourism expenditure, constituting a determining factor in the Canary Islands’ competitiveness as a destination.
H1a. 
The board basis contracted at the accommodation establishes differentiated patterns of tourism expenditure that impact the territorial distribution of tourism’s economic benefits.
H1b. 
Marketing channels and the contracting of package holidays generate different accommodation selection patterns that modify the territorial structure of tourism expenditure.
H2. 
The temporal patterns of tourism consumption and the type of accommodation selected jointly determine the destination’s capacity to generate and distribute tourism expenditure across the territory.
H2a. 
The number of overnight stays and effective hours spent outside the accommodation present significant correlations with the type of accommodation selected, configuring distinct models of expenditure distribution in the destination.
H2b. 
Destination loyalty and perceptions of quality configure specific accommodation selection patterns that result in different structures of territorial expenditure distribution.
The framework deriving from these hypotheses is presented in Figure 1.

2.2. Data Analysis

The Canary archipelago constitutes one of the most relevant international tourist destinations, thanks to the combination of its subtropical climate, landscape diversity, and cultural richness. Its privileged geographical location provides stable temperatures throughout the year, favouring visitor spending in any season. This is complemented by highly developed hotel and service infrastructure capable of satisfying the demands of sun and beach, sports, gastronomic, and cultural tourism. In this context, the Canary Islands have consolidated their position as an important part of the Spanish economic engine, attracting 17.77 million tourists in 2024 and significantly contributing to the region’s socioeconomic development. The principal features of the Canary Islands archipelago are delineated in Table 1.
The Tourism Expenditure Survey (EGT) conducted by the Canary Islands Statistics Institute (ISTAC) aims to provide detailed information on the volume and composition of expenditure made by tourists who stay for at least one night in any type of accommodation within the Autonomous Community of the Canary Islands [37]. Furthermore, the survey enables the characterisation of visitors’ sociodemographic profiles and describes the main characteristics of their journey, as well as their satisfaction with it.
From a temporal perspective, the survey is designed with a quarterly periodicity, enabling the analysis of tourism expenditure evolution across different time horizons, capturing the detail of a non-seasonalised destination. In spatial terms, the geographical scope of reference is the Canary Islands, establishing as units of analysis all islands except El Hierro, La Gomera, and La Graciosa.
The study population comprises the total number of tourists aged 16 years or older who entered the Canary Islands during the reference period, in this case the year 2023. This category includes both international tourists and those from other Spanish autonomous communities, whilst internal tourism for the reference year, understood as that composed of residents of the autonomous community itself, is excluded. Table 2 synthesises the main technical aspects considered in the survey’s design and implementation.
The methodological process of survey analysis was structured into various interrelated phases that ensured the robustness and reliability of the obtained results. The methodological implementation was conducted using R (version 4.4.1) and Python (version 3.13.1) programming environments. Python, specifically through pandas and numpy libraries, was employed for data cleansing and organisation tasks, given its efficiency in handling large datasets. R was primarily utilised for econometric model estimation, following best practices established in recent literature [4,38].
Data cleansing and processing were developed following a structured protocol, whose stages are illustrated in Figure 2.
For the detection and treatment of outliers, a statistical methodology based on Tukey’s method was implemented, which defines as outliers those values that lie 1.5 times the interquartile range below or above the first or third quartile. Following the filtering of outliers and missing values, a principal component analysis (PCA) was conducted to identify the variables with the greatest weight, these being the most important for the analysis.
This multivariate technique enabled the systematic identification of components that maximise the explanation of joint variance [39]. Thus, it facilitated the determination of variables that exhibit a greater contribution to the explained variance, thereby constituting the most significant elements for subsequent statistical analysis. The identification of variables with the greatest weight is based on the analysis of factor loadings and the relative contribution of each variable to the selected principal components.
The analytical methodology continued with a detailed descriptive analysis of some of the variables identified as most relevant to the study through PCA. This analysis included the computation and evaluation of the main statistics that characterised the data distribution [40]. Finally, we proceeded with the specification and estimation of a binomial logistic regression model (x, y), where the dichotomous dependent variable is represented by the type of accommodation, whilst the set of independent variables corresponds to the predictors specified in Table 2.
The binary logistic regression model is based on the following mathematical formulation:
l o g i t P Y = 1 X = l n P Y = 1 X ( 1 P ( Y = 1 | X ) = β 0 + β 1 X 1 + β 2 X 2 + β p X p
where the interpretation of results is conducted through odds ratios, calculated as the exponential of the coefficients:
O R = e x p ( β )
The odds ratios provide a measure of association that quantifies the relative probability of the event of interest. An odds ratio greater than 1 indicates an increase in the probability of the event when the explanatory variable increases by one unit whilst holding all other variables constant, whereas a value less than 1 suggests a decrease in said probability [41]. The magnitude of the odds ratio reflects the intensity of the association between each predictor and the dependent variable, facilitating a direct and meaningful interpretation of the model results.

2.3. Variable Description

The empirical specification of the model incorporated a diverse set of explanatory variables resulting from the PCA, whose operationalisation was conducted according to the specific nature of each predictor, as detailed in Table 3. In the case of continuous variables, a standardisation process was implemented using standard deviation, thus facilitating the comparability and interpretation of marginal effects in terms of changes in standard deviation units [42].
For the treatment of categorical variables, factorisation was carried out, establishing reference categories (omitted) that act as a comparative basis in the estimation. Dichotomous variables, for their part, have been coded as dummy variables with 1–0 values, where 1 represents the presence of the attribute of interest and 0 its absence, following the methodological conventions established in the econometric literature [43].

3. Results

3.1. Principal Component Analysis

PCA was employed as a dimensional reduction technique to examine the interrelationships between variables that determine tourism expenditure, enabling the validation of the proposed hypotheses. The application of this methodology, which has been widely validated in tourism studies [22,44], allowed for the identification of two principal components that explain the variance in tourism expenditure behaviour presented in Table 4.
The contribution matrix reveals two principal components that configure tourism expenditure behaviour. The first factorial axis is determined by decisional elements, with visiting factors (0.361) and activities (0.226) showing the highest contributions. The second axis presents a dual structure characterised by the juxtaposition between individualised and packaged services, where origin expenditure (0.242) and package costs (0.129) emerge as significant contributors.
The initial results support the proposed conceptual model. The first hypothesis (H1) is substantiated by the significant contribution of factors related to the meal plan regime and their influence on expenditure distribution, aligning with the conclusions of [45] regarding the importance of accommodation type and selected board arrangements as key determinants of tourist expenditure. The second hypothesis (H2), concerning temporal patterns, is confirmed through the observed interrelationship between prior experience and length of stay, variables that [32] identified as critical determinants in shaping tourist spending behaviour.

3.2. Descriptive Analysis

The analysis of the sample distribution (n = 36.446) reveals significant patterns in the configuration of tourist accommodation, supporting the hypotheses formulated. Table 5 provides a detailed analysis of the distribution of tourists and overnight stays according to the selected type of accommodation.
The results indicate that four-star establishments concentrate the highest proportion of tourists, accounting for 39.32% of the sample and 34.77% of total overnight stays. Secondly, apartment–villages accommodate 25.76% of tourists and 28.20% of overnight stays, highlighting a clear segmentation within the destination’s accommodation structure. This preference for higher-category accommodation confirms trends previously observed by Alegre and Pou (2008) [46] in mature tourist destinations.
Regarding the length of stay, a variation is observed depending on the type of accommodation, thereby supporting Hypothesis H2a. on the relationship between accommodation models and temporal consumption patterns. More novel establishments, such as Airbnb, report an average stay of 12 nights, which is substantially higher than the 8-night average recorded in 5–5GL star hotels.
Table 6 presents the distribution of the number of tourists according to their chosen boarding regime and type of accommodation. The data reveal a pronounced polarisation in tourist preferences depending on the category of establishment. In accommodation types offering greater flexibility, such as apartment–villages and Airbnb, the “room only” regime is predominant, accounting for 65% and 95%, respectively. Conversely, the all-inclusive regime is significantly concentrated in traditional hotel establishments, reaching 50% in four-star hotels and 37% in one- to three-star hotels. These findings provide empirical support for Hypothesis H1, which posits that the typology of accommodation exerts a significant influence on the distribution of tourist expenditure.
As demonstrated in Table 7, a substantial disparity exists between expenditure at origin and destination across all accommodation categories, with origin expenditure constituting between 89% and 97% of total tourist outlay. The distribution of expenditure at destination varies considerably by accommodation type, with tourists in own apartments allocating the highest proportion (15.67%) compared to the markedly lower figure for 5-5GL hotels (2.58%). This expenditure pattern is particularly evident in food-related spending, whereby guests in own accommodations devote significantly more resources to restaurants (6.21%) than those in luxury establishments (0.87%).

3.3. Model Evaluation

The statistical modelling through binomial regression, as presented in Table 8, validated the proposed hypotheses, providing empirical evidence on the complex interrelationships amongst accommodation typology, consumption patterns, and the territorial distribution of tourism expenditure in the Canary Islands. The results transcend traditional approaches to tourism competitiveness, establishing significant links between accommodation structure and the destination’s capacity to generate and distribute economic benefits across the territory.
The analysis corroborates that tourist accommodation acts as a determining factor that shapes expenditure patterns (H1). This relationship is particularly evident in board arrangements, where odds ratios reveal that the probability of opting for full board in 5–5GL-star hotels is significantly higher (OR = 0.265, p < 0.001). In contrast, the room-only arrangement notably increases the probability of generating more distributed expenditure patterns in apartments and villas (OR = 5.892, p < 0.001), validating the existence of a gradient in the territorial distribution of expenditure according to accommodation typology (H1a.).
Tourism intermediation emerges as a crucial factor in structuring economic flows within the destination (H1b.). The results demonstrate that contracting through tour operators or travel agencies yields significant odds ratios for 5–5GL-star hotels (OR = 0.680, p < 0.001), determining specific expenditure concentration patterns that reduce their territorial dispersion.
In line with tourist behaviour theories, temporal consumption patterns prove to be determinants in the destination’s capacity to distribute economic benefits (H2). Empirical evidence indicates that the number of nights increases the probability of generating more diversified expenditure, with significantly higher odds ratios in apartments and villas (OR = 1.224, p < 0.001) compared to traditional hotel establishments.
The study also validates the importance of destination loyalty (H2b.), where recurring visits modify accommodation selection patterns and consequently expenditure distribution. The data show significant odds ratios for repeat visits, particularly in 5–5GL-star hotels (OR = 1.037, p < 0.01 for the third visit), aligning with theories maintaining that previous destination experience leads to more diversified consumption behaviours.
The results provide a new perspective on tourism competitiveness, establishing links between accommodation structure and the destination’s socioeconomic sustainability. This approach emphasises the need to consider territorial distribution of expenditure as a fundamental indicator of competitiveness, surpassing traditional metrics based solely on price and quality.
The empirical evidence also suggests that perceptions of destination quality significantly influence accommodation selection patterns and expenditure. Variables such as island cleanliness show significant odds ratios (OR = 1.154, p < 0.001 for 5–5GL-star hotels), whilst activities such as beach (OR = 1.091, p < 0.001) and leisure (OR = 1.052, p < 0.001) also emerge as determining factors in accommodation selection and associated expenditure patterns.

4. Discussion

This study provides valuable insights into the complex relationships among tourism expenditure patterns, economic benefit distribution, social sustainability, and destination competitiveness in the Canary Islands. The findings reveal that the tourism commercialisation model significantly influences how tourism benefits are distributed across the destination’s economy through various dimensions, including accommodation categories, board basis selection, and temporal consumption patterns [11,47].
The strategic significance of accommodation heterogeneity emerges as a pivotal finding in this study, with profound implications for destination competitiveness and sustainability. While prior research has established connections between accommodation diversity and economic outcomes, our analysis empirically demonstrates how this heterogeneity functions as a critical mechanism for optimising expenditure distribution throughout destination economies. The diverse accommodation portfolio in the Canary Islands—ranging from all-inclusive resorts to peer-to-peer rentals—creates differentiated expenditure channels that collectively enhance the destination’s resilience and adaptive capacity. This multifaceted accommodation structure serves as a strategic asset in facilitating the archipelago’s transition toward more sustainable tourism models by enabling policymakers to systematically calibrate the accommodation mix to achieve specific sustainability objectives. The capacity to leverage different accommodation typologies—each with distinct expenditure distribution profiles—represents a sophisticated competitive advantage for mature destinations seeking to reconfigure their tourism models toward enhanced sustainability without compromising economic performance.
Therefore, the analysis demonstrates that tourists staying in mid- to high-category hotels with all-inclusive plans tend to concentrate their spending at the origin, with limited allocation to local services outside the accommodation [48,49]. This phenomenon is particularly evident in five-star hotels, where 97% of total expenditure is allocated to accommodation and flights, substantially reducing other sectors’ participation in tourism revenue generation. This concentration effect has been documented in other mature destinations where traditional commercialisation channels capture a significant portion of tourism expenditure at origin [50].
In contrast, tourists who choose apartments, villas, and peer-to-peer accommodations exhibit more diversified expenditure patterns, allocating higher proportions to restaurants, supermarkets, and local transport [51]. This diversification suggests that alternative accommodation models can foster more distributed economic impacts within destinations [52]. The study provides empirical evidence on how these accommodation choices influence the social sustainability of tourism development, with significant odds ratios in the binomial regression model (OR = 1.832, p < 0.001) for all-inclusive packages in five-star hotels demonstrating that certain accommodation types and board bases can substantially reduce expenditure dispersion [46,53].
The research reveals that tourists staying in non-hotel accommodations spend relatively more on activities and shopping compared to those in five-star hotels (5.18% vs. 2.58%) and display more balanced spending patterns across different sectors. This finding aligns with previous research by [54,55] on how peer-to-peer accommodation can contribute to more distributed economic benefits within destinations.
The study suggests that destination competitiveness should be evaluated not only through traditional metrics but also through the lens of expenditure distribution and social sustainability [56]. The significant relationship between accommodation type and expenditure patterns indicates that tourism development strategies should consider how different accommodation models affect the destination’s capacity to distribute economic benefits. The temporal dimension of tourist consumption emerges as a crucial factor, with longer stays and more time spent outside accommodation associated with more diversified expenditure patterns [57,58,59].
These findings have important implications for destination management and planning [60,61]. They suggest the need for policies that promote a balanced accommodation mix, considering how different types influence expenditure distribution. Additionally, the results indicate that destination loyalty and repeated visits influence accommodation selection and expenditure patterns, supporting previous research by [62,63] on the relationship between destination loyalty and tourist behaviour.
The study conclusively demonstrates that accommodation type, board basis, and temporal consumption patterns significantly influence how tourism benefits are distributed within destinations. Destinations heavily dependent on all-inclusive and package tourism may experience reduced economic benefit distribution, potentially affecting their social sustainability and long-term competitiveness [64]. This finding has particular relevance for mature tourism destinations seeking to maintain their competitive edge while ensuring sustainable development.
The research also highlights the importance of considering the broader implications of tourism commercialisation models for local economies. While all-inclusive systems may create economic enclaves within destinations, alternative accommodation options can help foster more distributed economic impacts. This balance between different accommodation types and their associated expenditure patterns plays a crucial role in determining the overall sustainability and competitiveness of tourism destinations.
It is essential to acknowledge that while our binomial discrete choice model provides valuable insights into direct tourist expenditure patterns, it presents inherent limitations in capturing indirect multiplier effects through which accommodation establishments contribute to the local economy. All-inclusive resorts and luxury hotels, despite concentrating tourist expenditure, may generate significant economic benefits through taxation, employment, and supply chain relationships with regional providers that remain unaccounted for in our analytical framework. The present research should therefore be interpreted as an initial, foundational step toward understanding the complex relationships among accommodation typologies, expenditure distribution, and destination competitiveness.
Looking ahead, there are several areas that warrant further investigation. Future research endeavours should employ complementary methodological approaches, such as input–output analyses or computable general equilibrium models, to elucidate the comprehensive economic impacts of different accommodation models on destination sustainability and competitiveness. This progression would facilitate a more nuanced understanding of how tourism commercialisation models influence the holistic distribution of benefits within destination economies.
In addition, future research could explore how emerging accommodation models and changing tourist preferences might influence expenditure patterns and benefit distribution in other destinations. Additionally, investigating the role of digital platforms in reshaping tourism commercialisation and their impact on local economies could provide valuable insights for destination management organisations. One essential task that would provide greater clarity on expenditure distribution would be the analysis of tourism employment and other expenditures in the destination by accommodation businesses that concentrate the majority of travel-related spending.
The study’s findings contribute significantly to both theoretical understanding and practical application in tourism management.
They enhance our knowledge of tourism expenditure patterns and their relationship with destination sustainability and competitiveness while providing practical insights for destination managers seeking to optimise the distribution of tourism benefits. This research underscores the importance of maintaining a balanced approach to tourism development that considers both economic efficiency and social sustainability, ultimately contributing to the long-term success and resilience of tourism destinations.

5. Conclusions

The results of the quantitative statistical study have corroborated the proposed hypotheses, offering a detailed perspective on the relationships among accommodation typology, tourist consumption patterns, and expenditure distribution in the Canary Islands. These findings have both theoretical and practical implications for tourism management in the archipelago, particularly concerning destination competitiveness and the sector’s economic sustainability.
In this regard, the results confirm that tourist accommodation typology and board basis directly affect the structure and distribution of tourism expenditure (H1). This reinforces the theory that accommodation is not a passive element within the tourist experience, but rather a determining factor that shapes visitors’ expenditure patterns.
The board basis chosen by guests demonstrates an inverse relationship with the distribution of their expenditure across a greater diversity of non-accommodation local establishments.
A gradient is established, with differentiated expenditure patterns (H1a.) that position hotel accommodation with all-inclusive arrangements at the pole of least distribution and holiday rentals at the pole of greatest distribution. This suggests that the accommodation model influences the tourism system’s capacity to foster the local economy, as tourists with more flexible board arrangements generate greater economic impact on transport, activities, commerce, and dining outside hotel complexes.
Furthermore, the study has demonstrated that commercialisation channels and tourism package arrangements generate differences in accommodation selection and consequently in expenditure distribution (H1b.). This validates theories highlighting the role of tourism intermediation in structuring economic flows within the destination. Direct sales and non-package accommodation bookings tend to favour greater expenditure dispersion, whilst package tourism aimed at mass markets concentrates investment in specific areas, reducing economic redistribution across the territory.
Moreover, the results confirm that temporal consumption patterns and selected accommodation type jointly determine the destination’s capacity to generate and distribute tourism expenditure (H2). This validates the importance of length of stay and tourist behaviour in the destination’s economic structure, emphasising that not only how much visitors spend matters, but when and where they do so.
Within this hypothesis, a significant correlation has been identified between the number of overnight stays, effective hours spent outside accommodation, and the type of establishment selected (H2a.). This finding supports expenditure distribution models based on tourist behaviour, suggesting that those with longer stays and more time outside their accommodation diversify their spending to a greater extent, benefiting a wider range of local businesses.
Finally, the study has demonstrated that destination loyalty and perceptions of quality influence accommodation selection and consequently expenditure distribution (H2b.). This reinforces the theory that repeat tourists exhibit differentiated spending behaviours, prioritising accommodations with greater consumption flexibility and contributing to increased economic injection into the destination.
The study provides an innovative perspective on tourism destination competitiveness, transcending traditional approaches. The results establish a strategic connection between accommodation structure and the destination’s overall competitive capacity, highlighting the importance of optimising temporal consumption patterns. Beyond conventional indicators such as price and quality, the research introduces social sustainability linkage with competitiveness as a fundamental dimension. Critical mechanisms for the equitable distribution of tourism benefits in local communities are identified, representing an integral approach to tourism development. This approach broadens the traditional understanding of competitiveness, positioning benefit distribution and social impact as central elements in the evaluation and development strategy of tourism destinations.
From a practical perspective, seeking to optimise expenditure distribution in the destination, the results suggest the need to establish improvements in destination governance (tourist municipalities), with the participation of different value-chain actors, including local agents and administrations not directly benefiting from tourism flows.
Strategies to promote a more diversified and inclusive tourism model require concrete actions that incentivise expenditure outside traditional hotel establishments. These measures include supporting and promoting small and medium-sized tourism enterprises operating beyond the all-inclusive circuit, aiming to invigorate less saturated areas and distribute economic benefits more equitably.
An effective option could be developing reward programmes offering discounts in local shops and restaurants, thus promoting tourist interaction with the local business fabric. The study’s findings reveal a significant correlation between length of stay, accommodation modality, and expenditure patterns, suggesting that initiatives aimed at extending average stay could have a positive impact on economic distribution.
The implementation of these policies would not only contribute to strengthening destination competitiveness (development of competitive advantages and sustainability aspects) but would also ensure a fairer distribution of economic benefits among the local population.
These conclusions suggest that strategic destination management must consider the configuration of its accommodation supply and commercialisation channels, as these elements significantly condition the territorial distribution of tourism’s economic benefits. Understanding these relationships enables the development of more effective policies to optimise tourism’s economic impact in different areas beyond destination accommodation. Future research should deepen the analysis of how new accommodation models and changes in tourist consumption patterns may affect the territorial distribution of expenditure.

Author Contributions

Conceptualization, A.S.-T.; Methodology, A.M.B.-M. and E.P.-L.; Validation, A.M.B.-M., A.S.-T. and E.P.-L.; Formal analysis, A.M.B.-M.; Writing—original draft, A.M.B.-M.; Writing—review & editing, A.S.-T. and E.P.-L.; Supervision, A.S.-T. All authors have read and agreed to the published version of the manuscript.

Funding

This research received no external funding.

Institutional Review Board Statement

Ethical review and approval were waived for this study, due to the exclusive use of anonymized public data from the Tourism Expenditure Survey conducted by the Instituto Canario de Estadística (ISTAC). No human participants were directly involved in this research.

Informed Consent Statement

Not applicable.

Data Availability Statement

The data presented in this study are openly available from the Instituto Canario de Estadística (ISTAC) Tourism Expenditure Survey at https://www.gobiernodecanarias.org/istac/estadisticas/sectorservicios/hosteleriayturismo/demanda/C00028A.html, accessed on 7 January 2025.

Conflicts of Interest

The authors declare no conflicts of interest.

References

  1. Tsai, H.; Song, H.; Wong, K.F. Tourism and Hotel Competitiveness Research. J. Travel Tour. Mark. 2009, 26, 522–546. [Google Scholar] [CrossRef]
  2. Li, K.X.; Jin, M.; Shi, W. Tourism as an important impetus to promoting economic growth: A critical review. Tour. Manag. Perspect. 2018, 26, 135–142. [Google Scholar] [CrossRef]
  3. Santana-Jiménez, Y.; Sun, Y.-Y.; Hernández, J.M.; Suárez-Vega, R. The influence of remoteness and isolation in the rural accommodation rental price among Eastern and Western destinations. Travel Res. 2014, 54, 380–395. [Google Scholar] [CrossRef]
  4. Pérez-Rodríguez, J.V.; Ledesma-Rodríguez, F. Unconditional quantile regression and tourism expenditure: The case of the Canary Islands. Tour. Econ. 2021, 27, 626–648. [Google Scholar] [CrossRef]
  5. Pablo-Romero, M.d.P.; Gómez-Calero, P.; Sánchez-Rivas, J. Tourism, Competitiveness and Economic Growth: A New Analytical Model; InTech: Houston TX, USA, 2016. [Google Scholar] [CrossRef]
  6. Heath, E. Towards a Model to Enhance Africa’s Sustainable Tourism Competitiveness; Department of Tourism Management, University of Pretoria: Pretoria, South Africa, 2003. [Google Scholar]
  7. Crouch, G. Destination Competitiveness: An Analysis of Determinant Attributes. J. Travel Res. 2010, 50, 27–45. [Google Scholar] [CrossRef]
  8. Monica, F.; Olimpia, B. Theoretical Framework About Tourism Destination Competitiveness; Annals of Faculty of Economics; University of Oradea, Faculty of Economics: Oradea, Romania, 2020; Volume 1, pp. 32–38. [Google Scholar]
  9. Buhalis, D. Marketing the competitive destination of the future. Tour. Manag. Spec. Issue El Destin. Competitivo. 2000, 21, 97–116. [Google Scholar] [CrossRef]
  10. Crouch, G.I.; Ritchie, B.J.R. Tourism, competitiveness, and societal prosperity. J. Bus. Res. 1999, 44, 137–152. [Google Scholar] [CrossRef]
  11. Dwyer, L.; Kim, C. Destination Competitiveness: Determinants and Indicators. Curr. Issues Tour. 2003, 6, 369–414. [Google Scholar] [CrossRef]
  12. Hassan, S. Determinants of Market Competitiveness in an Environmentally Sustainable Tourism Industry. J. Travel Res. 2000, 38, 239–245. [Google Scholar] [CrossRef]
  13. Croes, R. Measuring and Explaining Competitiveness in the Context of Small Island Destinations. J. Travel Res. 2011, 50, 431–442. [Google Scholar] [CrossRef]
  14. World Economic Forum. The Travel & Tourism Competitiveness Report 2019: Travel and Tourism at a Tipping Point; World Economic Forum: Geneva, Switzerland, 2019; Available online: https://www3.weforum.org/docs/WEF_TTCR_2019.pdf (accessed on 25 January 2025).
  15. Mendola, D.; Volo, S. Building composite indicators in tourism studies: Measurements and applications in tourism destination competitiveness. Tour. Manag. 2017, 59, 541–553. [Google Scholar] [CrossRef]
  16. Ritchie, J.R.B.; Crouch, G.I. The Competitive Destination: A Sustainable Tourism Perspective. Tour. Manag. 2003, 21, 1–7. [Google Scholar] [CrossRef]
  17. Assaker, G.; Hallak, R.; Vinzi, V.E.; O’connor, P. An Empirical Operationalization of Countries’ Destination Competitiveness Using Partial Least Squares Modeling. J. Travel Res. 2013, 53, 26–43. [Google Scholar] [CrossRef]
  18. Croes, R.; Kubickova, M. From potential to ability to compete: Towards a performance-based tourism competitiveness index. J. Destin. Mark. Manag. 2013, 2, 146–154. [Google Scholar] [CrossRef]
  19. Massidda, C.; Piras, R.; Seetaram, N. Analysing the drivers of itemised tourism expenditure from the UK using survey data. Ann. Tour. Res. Empir. Insights 2022, 3, 100037. [Google Scholar] [CrossRef]
  20. Song, H.; Dwyer, L.; Li, G.; Cao, Z. Tourism economics research: A review and assessment. Ann. Tour. Res. 2012, 39, 1653–1682. [Google Scholar] [CrossRef]
  21. Mayer, M.; Vogt, L. Economic effects of tourism and its influencing factors. An overview focusing on the spending determinants of visitors. Z. Für Tour. 2016, 8, 169–198. [Google Scholar] [CrossRef]
  22. Disegna, M.; Osti, L. Tourists’ Expenditure Behaviour: The Influence of Satisfaction and the Dependence of Spending Categories. Tour. Econ. 2016, 22, 5–30. [Google Scholar] [CrossRef]
  23. Divisekera, S.; Nguyen, V.K. Drivers of innovation in tourism: An econometric study. Tour. Econ. 2018, 24, 998–1014. [Google Scholar] [CrossRef]
  24. Souza, J.; Mendes-Filho, L.; Buhalis, D. Evaluating the effectiveness of tourist advertising to improve the competitiveness of destinations. Tour. Econ. 2020, 26, 1001–1020. [Google Scholar] [CrossRef]
  25. El Archi, Y.; Benbba, B.; Nizamatdinova, Z.; Issakov, Y.; Vargáné, G.I.; Dávid, L.D. Systematic Literature Review Analysing Smart Tourism Destinations in Context of Sustainable Development: Current Applications and Future Directions. Sustainability 2023, 15, 5086. [Google Scholar] [CrossRef]
  26. Alsharif, A.; Isa, S.; Alqudah, M. Smart Tourism, Hospitality, and Destination: A Systematic Review and Future Directions. J. Tour. Serv. 2024, 15, 72–110. [Google Scholar] [CrossRef]
  27. Lasisi, T.T.; Odei, S.A.; Eluwole, K.K. Smart destination competitiveness: Underscoring its impact on economic growth. J. Tour. Futur. 2023, 9, 266–282. [Google Scholar] [CrossRef]
  28. Schubert, S.; Brida, J.G.; Risso, W. The impacts of international tourism demand on economic growth of small economies dependent on tourism. Tour. Manag. 2011, 32, 377–385. [Google Scholar] [CrossRef]
  29. Fauzel, S.; Seetanah, B.; Sannassee, R. Analysing the impact of tourism foreign direct investment on economic growth: Evidence from a small island developing state. Tour. Econ. 2016, 23, 1042–1055. [Google Scholar] [CrossRef]
  30. Brida, J.G.; Scuderi, R. Determinants of Tourist Expenditure: A Review of Microeconometric Models. Tour. Manag. Perspect. 2012, 6, 28–40. [Google Scholar] [CrossRef]
  31. Shang, J.-K.; Wang, F.-C. Another Look at the Determinants of Tourism Expenditure. Ann. Tour. Res. 2012, 39, 495–498. [Google Scholar] [CrossRef]
  32. Wang, Y.; Davidson, M. A Review of Micro-analyses of Tourist Expenditure. Curr. Issues Tour. 2010, 13, 507–524. [Google Scholar] [CrossRef]
  33. Wu, C.; Tan, Z.; Lee, L.; Hoa, S.; Fordham, G. Corporate Social Responsibility in Sustainable Tourism Development towards Local Culture. J. Sos. Sains, Ter. Dan Ris. 2023, 11, 67–82. [Google Scholar] [CrossRef]
  34. Cavalcante, W.Q.d.F.; Coelho, A.; Bairrada, C.M. Sustainability and Tourism Marketing: A Bibliometric Analysis of Publications between 1997 and 2020 Using VOSviewer Software. Sustainability 2021, 13, 4987. [Google Scholar] [CrossRef]
  35. Cucculelli, M.; Goffi, G. Does sustainability enhance tourism destination competitiveness? Evidence from Italian Destinations of Excellence. J. Clean. Prod. 2016, 111, 370–382. [Google Scholar] [CrossRef]
  36. Gao, J.; Shao, C.; Chen, S.; Wei, Z. Evaluation of Sustainable Development of Tourism Cities Based on SDGs and Tourism Competitiveness Index: Analysis of 221 Prefecture-Level Cities in China. Sustainability 2021, 13, 12338. [Google Scholar] [CrossRef]
  37. Corte, V.; Aria, M. Coopetition and sustainable competitive advantage. The case of tourist destinations. Tour. Manag. 2016, 54, 524–540. [Google Scholar] [CrossRef]
  38. Lv, X.; Li, C.; McCabe, S. Expanding theory of tourists’ destination loyalty: The role of sensory impressions. Tour. Manag. 2020, 77, 104026. [Google Scholar] [CrossRef]
  39. Nilplub, C.; Khang, D.B.; Krairit, D. Determinants of Destination Loyalty and the Mediating Role of Tourist Satisfaction. Tour. Anal. 2016, 21, 221–236. [Google Scholar] [CrossRef]
  40. Jurdana, D.S.; Frleta, D.S. Satisfaction as a determinant of tourist expenditure. Curr. Issues Tour. Taylor Fr. J. 2017, 20, 691–704. [Google Scholar] [CrossRef]
  41. Borrego-Domínguez, S.; Castillo, F.; Rodríguez-Fernández, M. Determinants of Tourism Demand in Spain: A European Perspective from 2000–2020. Economies 2022, 10, 276. [Google Scholar] [CrossRef]
  42. Instituto Canario de Estadística (ISTAC). Tourism Expenditure Methodology. 2018. Available online: https://www.gobiernodecanarias.org/istac/descargas/C00028A/2018/EGT-2018-metodologia.pdf (accessed on 20 November 2024).
  43. Tanana, A.; Caruso, M.J.; Rodríguez, C. Determinants of The Expenditure of Tourist Demand in Coastal Destinations. Adv. Hosp. Tour. Res. (AHTR) 2022, 10, 206–231. [Google Scholar] [CrossRef]
  44. Anderson, W. Determinants of all-inclusive travel expenditure. Tour. Rev. 2010, 65, 4–15. [Google Scholar] [CrossRef]
  45. Rheeders, T. A review of the determinants of tourism destination competitiveness. J. Contemp. Manag. 2022, 19, 238–268. [Google Scholar] [CrossRef]
  46. Alegre, J.; Pou, L. Research Note: Tourism Expenditure and all-Inclusive Packages—The case of a Mature Mediterranean Destination. Tour. Econ. 2008, 14, 645–655. [Google Scholar] [CrossRef]
  47. Assaker, G.; Esposito Vinzi, V.; O’Connor, P. Modelling a Causality Network for Tourism Development: An Empirical Analysis. J. Model. Manag. 2011, 6, 258–278. [Google Scholar] [CrossRef]
  48. Jolliffe, I.T.; Cadima, J. Principal component analysis: A review and recent developments. Philos. Trans. R. Soc. A Math. Phys. Eng. Sci. 2016, 374, 20150202. [Google Scholar] [CrossRef]
  49. Montgomery, D.C.; Runger, G.C. Applied Statistics and Probability for Engineers, 7th ed.; Wiley: Hoboken, NJ, USA, 2018. [Google Scholar]
  50. Hosmer, D.; Lemeshow, S.; Sturdivant, R. The Multiple Logistic Regression Model. In Applied Logistic Regression, 3rd ed.; John Wiley & Sons, Inc.: Hoboken, NJ, USA, 2013. [Google Scholar] [CrossRef]
  51. Gelman, A.; Hill, J. Data Analysis Using Regression and Multilevel/Hierarchical Models; Cambridge University Press: Cambridge, UK, 2006. [Google Scholar] [CrossRef]
  52. Wooldridge, J.M. Two-Way Fixed Effects, the Two-Way Mundlak Regression, and Difference-in-Differences Estimators. SSRN Electron. J. 2021, 2021, 1–52. [Google Scholar] [CrossRef]
  53. Masiero, L.; Nicolau, J.L. Choice behaviour in online hotel booking. Tour. Econ. 2016, 22, 671–678. [Google Scholar] [CrossRef]
  54. Marrocu, E.; Paci, R.; Zara, A. Micro-economic determinants of tourist expenditure: A quantile regression approach. Tour. Manag. 2015, 50, 13–30. [Google Scholar] [CrossRef]
  55. Debenedetti, A.; Philippe, D.; Dion, D. Balancing exclusivity and inclusivity through the strategic domestication of the luxury retail experience. Int. J. Res. Mark. 2024, in press. [CrossRef]
  56. Issa, J.J.; Jayawardena, C. The all-inclusive concept in the Caribbean. Int. J. Contemp. Hosp. Manag. 2003, 15, 167–171. [Google Scholar] [CrossRef]
  57. Inchausti-Sintes, F.; Voltes-Dorta, A.; Suau-Sánchez, P. The income elasticity gap and its implications for economic growth and tourism development: The Balearic vs the Canary Islands. Curr. Issues Tour. 2020, 24, 98–116. [Google Scholar] [CrossRef]
  58. Guttentag, D.; Smith, S.; Potwarka, L.; Havitz, M. Why tourists choose Airbnb: A motivation-based segmentation study. J. Travel Res. 2018, 57, 342–359. [Google Scholar] [CrossRef]
  59. Fang, B.; Ye, Q.; Law, R. Effect of sharing economy on tourism industry employment. Ann. Tour. Res. 2016, 57, 264–267. [Google Scholar] [CrossRef]
  60. Saarinen, J. Critical sustainability: Setting the limits to growth and responsibility in tourism. Sustainability 2014, 6, 1–17. [Google Scholar] [CrossRef]
  61. Liu, Z. Sustainable tourism development: A critique. J. Sustain. Tour. 2003, 11, 459–475. [Google Scholar] [CrossRef]
  62. Zervas, G.; Proserpio, D.; Byers, J.W. The rise of the sharing economy: Estimating the impact of Airbnb on the hotel industry. J. Mark. Res. 2017, 54, 687–705. [Google Scholar] [CrossRef]
  63. Dolnicar, S.; Zare, S. COVID19 and Airbnb—Disrupting the Disruptor. Ann. Tour. Res. 2020, 83, 102961. [Google Scholar] [CrossRef]
  64. Pulido-Fernández, J.I.; Cárdenas-García, P.J.; Espinosa-Pulido, J.A. Does environmental sustainability contribute to tourism growth? An analysis at the country level. J. Clean. Prod. 2019, 213, 309–319. [Google Scholar] [CrossRef]
Figure 1. Research model.
Sustainability 17 03262 g001
Figure 2. Methodological steps.
Sustainability 17 03262 g002
Table 1. Canary Islands archipelago data in 2024.
CharacteristicsResults
Number of islands8 islands (GC, TF, LZ, LP, FV, LG, EH; LR)
Total surface area7447 km2
Protected natural areas (PNAs)47.8% of the land
Aggregate population2,258,219 million inhabitants
Demographic density295 inhabitants per km2
(GC 546.96; TF 458.04; LZ 184, 53; LP 117.85; FV 72.30; LG 58.91; EH 42.46; LR 25,4)
Number of tourists17,767,834 tourists
Occupancy rate83.94%
Median length of stay7.15 days
Tourism revenuesEUR 22,887,000,000
Gross domestic productEUR 54,194,000,000
Rate of unemployment11.9%
Populace at risk of social marginalisation25.8%
Source: Authors’ own, based on the Canary Islands Institute of Statistics and the National Institute of Statistics.
Table 2. Technical data.
CharacteristicsResults
Year2024
Type of samplingTri-stage and non-probability sampling
Confidence index95%
Sampling error < 1%
Total sample38.071
Islands

Tenerife
Gran Canaria
Lanzarote
Fuerteventura
La Palma
Number of tourists Sample EGT
20232024
6,449,35940%14,00737%
4,235,14126%11,22129%
3,049,18819%611016%
2,274,85914%534914%
148,7201%13844%
Source: Authors’ own. URL data: https://goo.su/tzT0u9 (accessed on 7 January 2025). Methodological note: The territorial distribution of the sample is highly representative, as evidenced by the correspondence between the territorial distribution of tourists by islands in 2023 and the structure of the sample in 2024, thus guaranteeing the validity of the inferences made for Canary Islands as a multi-tourist destination.
Table 3. Variables measured in the study.
Variables Measured in the Study
Dependent variable
Accommodation typeType of accommodation where the tourist stayed.
-
5-star and 5GL hotels
-
4-star hotels
-
1-, 2-, and 3-star hotels
-
Apartment/tourist villa
-
P2P
-
Own apartment
Independent variables
Board basisSpecifies the type of meal and beverage services contracted.
-
Room only
-
Bed and breakfast
-
Half board
-
Full board
-
All inclusive
Package holidaySpecifies whether a package holiday including both flight and accommodation was purchased.
-
Yes
-
No, paid for separately
-
No, some services were free
Flight purchaseSpecifies where the flight was purchased.
-
Directly from the airline/accommodation
-
Through a tour operator or travel agency
Number of overnight staysTotal number of nights spent in the Canary Islands.
-
Continuous variable
Time spent outside accommodationNumber of hours spent outside the accommodation.
-
Continuous variable
ExpenditureTotal travel expenditure in euros across different categories.
-
Flights
-
Accommodation
-
Car rental
-
Taxi
-
Organised excursions
-
Food and supermarkets
-
Restaurants
-
Theme parks
-
Museums
-
Cultural activities
MotivationPrimary motivation for the holiday.
-
Rest
-
Explore or discover the islands
-
Leisure and entertainment
-
Family time
-
Pursue hobbies
PerceptionsEvaluation of different aspects related to sustainability during the stay in the Canary Islands.
-
Quality of life
-
Tourism tolerance
-
Cleanliness of the island
-
Air quality
-
Water quality
-
Renewable energy
-
Recycling
-
Local products
ActivitiesSpecifies whether the tourist engaged in the activities at right during their stay in the Canary Islands.
-
Beach
-
Swimming pool
-
Sightseeing
-
Island hopping
-
Organised excursions
-
Astronomy
-
Museums
-
Theme parks
-
Leisure activities
-
Hiking
Travel companionsSpecifies whether the tourist travelled alone or accompanied, and the type of company.
-
Solo
-
Couple
-
Children
-
Family members
-
Friends
-
Work or study colleagues
VisitsSpecifies the number of visits to key sites of interest on the islands.
-
Continuous variable
Information sourcesSpecifies the information channels used to plan the trip.
-
Previous visits
-
Friends or family
-
Internet and social media
-
Media
-
Guidebooks or magazines
-
Blogs or forums
-
TV channels
-
Tour operators or travel agencies
ServicesSpecifies whether the package holiday included transfers or excursions.
-
Transfers
-
Excursions
Source: Own elaboration using EGT data.
Table 4. Variables’ contributions.
Dimension 1ContributionDimension 2Contribution
Number of visits0.361Origin expenditure0.242
Activities0.226Package cost0.129
Destination expenditure0.070Type of company0.087
Motivation0.039Number of visits0.049
Purchase channel0.038Activities0.022
Age0.020Hours away accommodation0.010
Hours away accommodation0.012Board type0.008
Type of company0.010Total expenditure0.005
Transfer service0.007Age0.002
Source: Own elaboration using EGT data.
Table 5. Distribution of the number of tourists and overnight stays by type of accommodation.
Type of Accommodation5–5GL-Star4-Star1- to 3-StarApartment–VillageP2POwn ApartmentTotal
Number of tourists surveyed3.18614.6084.1317.0264.4563.03936.446
Number of overnights24.507115.18633.84766.26244.19335.880319.875
Mean number of overnights7.697.888.199.439.9111.809.15
Median number of overnights7777777
Source: Own elaboration using EGT data.
Table 6. Distribution of the number of tourists according to the boarding regime and type of accommodation.
Board Basis (%)5–5GL-Star4-Star1- to 3-StarApartment–VillageP2POwn Apartment
Room only5626659597
Bed and breakfast2913161242
Half board332614700
Full board344100
All inclusive2850371200
Total111111
Source: Own elaboration using EGT data.
Table 7. Distribution of total tourism expenditure by category and type of accommodation.
Type of Accommodation (%)5–5GL-Star4-Star1- to 3-StarApartment–VillageP2POwn Apartment
Flights (national and international)333637394182
Accommodation (main + extras)63605856521
Total 1. Expenditure at origin979695959389
Local transport (inter-island flights, taxis, car rentals, and public transport)0.811.381.431.081.311.92
Food and supermarket0.230.300.540.881.294.04
Restaurants0.870.791.211.772.026.21
Leisure0.300.500.590.560.621.41
Goods0.270.380.420.350.331.63
Other expenses0.090.100.100.080.080.46
Total 2. Expenditure at destination2.583.464.294.725.6515.67
Total expenditure100100100100100100
Source: Own elaboration using EGT data.
Table 8. Binomial regression model.
Dependent VariableAccommodation Category
Independent Variable5- and 5GL-Star Hotel4-Star Hotel1-, 2-, and 3-Star HotelApartment–VillageP2P
  • Board basis
1.1.
Bed and breakfast
1.164 ***4.449 ***-0.196 ***0.412 ***
1.2.
Half board
6.712 ***11.786 ***0.810 *0.067 ***0.575 ***
1.3.
Full board
2.896 ***11.567 ***1.570 ***0.076 ***-
1.4.
All inclusive
1.832 **13.376 ***1.525 ***0.089 ***0.537 ***
2.
Tourism package
2.1.
Complete package
--1.597 ***1.417 ***0.148 ***
2.2.
Free services
1.952 **0.518 ***0.381 ***0.404 ***0.094 ***
3.
Flight booking
3.1.
Tour operator/travel agency
0.680 ***1.342 ***1.603-0.563 ***
4.
Nights and hours
4.1.
Nights
5.179 ***-1.253 ***1.346 ***1.440 ***
4.2.
Hours outside accommodation
7.245 ***-1.074 **1.177 ***1.451 ***
5.
Expenditure
5.1.
Accommodation
1.928 ***-0.717 ***0.704 ***0.502 ***
5.2.
Extra accommodation
---0.930 *-
5.3.
Flights
----1.352 *
5.4.
Taxis
---0.898 *-
5.5.
Vehicle rental
----1.450 ***
5.6.
Public transport
--1.079 *** -
5.7.
Food and supermarkets
0.961 ***-1.083 *1.144 ***2.007 ***
5.8.
Restaurants
----1.985 ***
5.9.
Leisure and parks
---1.061 *-
5.10.
Organised excursions
9.170 *1.043 *---
5.11.
Health
---0.883 **-
6.
Motivation
6.1.
Leisure
1.832 **----
6.2.
Practise hobbies
--2.139 ***--
6.3.
Family enjoyment
7.678 **--1.194 *-
6.4.
Explore the destination
7.197 ***----
7.
Activities
7.1.
Beach
1.046 ***-0.954 ***--
7.2.
Pool
9.602 **1.971 ***1.069 ***-1.214 ***
7.3.
Island
1.040 **----
7.4.
Gastronomy
----0.904 ***
7.5.
Leisure
--0.988 **1.019 *-
7.6.
Beauty
9.061 ***----
7.7.
Diving
9.177 *----
7.8.
Sport
--0.939 **--
7.9.
Hiking
---0.967 *-
8.
Company
8.1.
Children
1.080 ***1.043 ***0.939 ***0.914 ***0.899 **
8.2.
Other family members
1.094 ***-0.964 *0.921 ***-
8.3.
Friends
1.117 ***-0.952 *--
8.4.
Colleagues
--0.815 *--
8.5.
Organised trip
--0.864 **--
9.
Number of visits
9.1.
Visits: 1
--0.969 *1.029 *-
9.2.
Visits: 3
-0.953 ***1.047 ***--
9.3.
Visits: 4
9.363 ***1.058 ***-0.971 *-
9.4.
Visits: 6
-0.963 *---
9.5.
Visits: 7
-1.033 **0.962 **--
10.
Booking channel
10.1.
Previous visits
---0.974 *1.033 **
10.2.
Friends or relatives
9.607 **1.025 **---
10.3.
TV channels
-----
10.4.
Tour operator/travel agency
-0.984 *---
10.5.
Travel guides/magazines
---0.961 *-
11.
Services
-
11.1.
Excursion
1.002 **--1.090 **-
11.2.
Transfer
-0.979 *--1.237 ***
Source: Own elaboration using EGT data. Significance: *** p < 0.001; ** p < 0.01; * p < 0.05.
Disclaimer/Publisher’s Note: The statements, opinions and data contained in all publications are solely those of the individual author(s) and contributor(s) and not of MDPI and/or the editor(s). MDPI and/or the editor(s) disclaim responsibility for any injury to people or property resulting from any ideas, methods, instructions or products referred to in the content.

