Abstract
Climate change and global warming have increased the frequency and intensity of natural hazards such as floods, landslides, and avalanches. These hazards not only have significant individual impacts but are also interconnected, often amplifying their destructive effects. Therefore, it is crucial to manage their consequences and ensure that communities and infrastructure are resilient enough to withstand these challenges. Given the limited research assessing the collective impact of natural hazards, particularly in Pakistan, this study investigates the effects of floods and landslides in the Kohistan District of northern Pakistan, an area which is highly vulnerable to such hazards yet minimally studied. Machine learning techniques, including the Analytical Hierarchy Process (AHP) and weighted overlay, along with geographic information systems (GISs) and remote sensing (RS), were employed to analyze the causative factors of these hazards. The resulting flood risk and landslide risk maps were then superimposed to produce an integrated dual-hazard risk assessment. The research findings serve as a foundation for policy-making, offering strategies to reduce risks for all stakeholders, implement adaptive measures for communities, and ensure that future developments are both resilient and sustainable.
1. Introduction
Climate change and human activities such as urbanization, deforestation, the increase in population, and industrialization have been leading to exacerbations of natural hazard effects around the world [1]. Natural hazards occur everywhere, but in developing countries they result in extreme losses in the economy because of infrastructure damage and agricultural and industrial losses and make populations more vulnerable [2].
Vulnerability is the human dimension of disasters. Poverty, inequality, and discrimination make a population vulnerable, as well as environmental degradation [3]. It is the result of decisions we make and have been making in the past. To know how vulnerable a regional community or individual is to a disaster, efforts should be made to identify the areas most prone to disasters and to take measures to reduce the impact of crises, which requires leadership, foresight, and thorough research [4].
Pakistan is exposed to natural hazards such as landslides, glacial lake outbursts, and floods, etc. In recent decades, these natural hazards have increased their impact and have led to a lot of deaths and infrastructure and economic losses [5]. In the country, the most destructive and disruptive hazards are landslides and floods. Continuously varying weather patterns and the fragile geology of the land, along with the presence of steep mountain slopes, triggers such hazards [6]. There is little to no planning of communities, which leads to poor settlement patterns, with most of the population being concentrated in one region, leading to the resources of that area being used up and depleted due to excessive use, putting a strain on the natural ecosystem and leading to an increase in the effects of natural hazards [7].
The devastating floods that hit the country in 2010 were some of the deadliest in Pakistan’s history, leaving more than 2000 people dead [8]. In 2022, more than a third of the country was completely submerged by the heaviest recorded monsoon rains in a decade [9]. North Khyber Pakhtunkhwa and the southern districts of Balochistan and Sindh were affected badly [10,11]. Flash floods and landslides along the Indus and Kabul rivers left more than 1000 dead and 1600 injured, as well as 325,000 houses destroyed and 733,000 houses damaged [12]. According to UN estimates, around 33 million Pakistanis—one in seven people—were affected by this flooding [13]. Merciless flood waters also swept away over 700,000 livestock animals and damaged more than 3.6 million acres of crops, wiping out cotton, wheat, vegetable, and fruit harvests in the country [14]. The devastation persisted in 2023, resulting in the deaths of 159 individuals because of flooding [15].
According to the Global Climate Risk Index, Pakistan is now ranked as the fifth most vulnerable country to climate change [16]. Global warming has led to rainfall events becoming far more intense. Pakistan has the largest number of glaciers outside of the polar regions. Higher temperatures have led to more water flowing down from melting ice in the Himalayas, Karakoram, and Hindu Kush. The combination of topography, rainfall, and seismicity makes Pakistan immensely prone to landslides. But there are other factors at play here which have contributed to the large-scale devastation, such as deforestation, excessive urbanization, and the careless, unsustainable use of natural resources [17].
In the most disaster-prone areas, one hazard leads to the triggering or magnification of the effects of another. One such example is the Attabad Lake incident in 2010, where a landslide caused flooding in various villages, immersing them underwater and making a lake [18,19]. The occurrence of natural hazards has become more frequent, especially during monsoon season, because of heavy rainfalls leading to flooding as well as triggering landslides. The Kohistan District in Khyber Pakhtunkhwa is one of the regions adversely affected by them [20].
Hazard mapping is a crucial tool used to identify areas that are susceptible to various types of hazards. This involves the collection, analysis, and visualization of data to create maps to highlight regions at risk. These maps are essential for planning, preparedness, and mitigation efforts. Hazard mapping plays a vital role in disaster risk management. By identifying areas at risk, measures to reduce the impact of potential hazards can be taken and we can have a better approach to disaster preparedness, response, and recovery after disastrous events. Such maps are incorporated into policy-making, disaster preparedness actions, and resource allocation [21]. Natural hazards are complex and have a sort of domino effect, so mitigation plans for such hazards require the comprehensive treatment of different hazards and their interactions, otherwise known as multi-hazard risk assessment and management. However, most of the research performed in Pakistan so far has focused on a single natural hazard, which restricts the determination of areas which are affected by multiple hazards in order to take initiative and manage and help mitigate the risks [22]. Multi-hazard risk assessment is a far more effective tool for disaster reduction and management. The multi-hazard disaster risk reduction approach involves assessing the composite risk from all hazards to conduct integrated planning. When hazards are viewed in isolation, mitigation measures proposed as a solution for one risk may create vulnerability to another. The interdependence between different types of hazards is considered in a multi-hazard approach [23]. This integrated assessment of risks not only strengthens disaster preparedness but also greatly helps with advancing sustainability. Disaster risk management considers the long-term socio-economic and environmental impacts of hazards in a manner that ensures that mitigation efforts build resilience rather than create unanticipated impacts. By incorporating sustainability principles into hazard analysis, adaptive measures are developed to reduce economic losses, safeguard natural systems, and render infrastructure more resilient. The integration of disaster risk assessment in policy-making ensures that mitigation efforts address not only immediate threats but also promote sustainable development by constraining long-term vulnerability and enhancing the resilience of communities [24,25].
This research conducts an integrated hazard assessment, i.e., an assessment of floods and landslides, for the Kohistan District using twelve datasets, namely slope, curvature, land-use land cover (LULC), elevation, distance from streams, lithology, soil, Normalized Difference Vegetation Index (NDVI), rainfall, aspect, Topographical Wetness Index (TWI) and earthquakes, which are weighted with an AHP and integrated with a GIS. The AHP method enhances decision-making by providing clearer visualization and improved mapping capabilities, facilitating the development of hazard maps. The study aims to identify areas vulnerable to both single- and multi-hazard risks, contributing to hazard risk reduction and disaster management.
Related Works
Machine learning techniques are used in hazard assessments [26]. Multi-criteria decision analysis (MCDA) approaches such as the Analytical Hierarchy Process (AHP), weighted overlay methods, and various other statistical and probabilistic methods are employed in hazard risk assessment [27]. The Analytic Hierarchy Process (AHP) is a decision-making framework that helps prioritize and select the best option by breaking down a complex decision into a hierarchy of goals, criteria, and alternatives [28]. It involves pair-wise comparisons to establish priorities and calculate weights for each element. The AHP is widely used for its structured approach, flexibility, and ability to combine quantitative and qualitative factors, though it is a subjective approach dependent on human judgment and can sometimes be complex [29]. In addition to these methods, recent advancements have introduced Graph Neural Networks (GNNs) for travel distance estimation and route optimization under probabilistic hazards, improving emergency response planning by modeling transportation networks in hazard-prone areas. Surrogate models have also been explored in order to assess the resilience of critical infrastructure, offering computationally efficient alternatives for evaluating risks to roads and bridges under multiple-hazard conditions. When combined with GIS-based multi-hazard risk mapping, these approaches can enhance disaster resilience by ensuring efficient planning for emergency response and resource allocation [30,31].
This research performs integrated hazard risk assessment for the Kohistan District using the AHP method integrated with a geographical information system (GIS) [32]. This study will help to identify areas susceptible to single- and multi-hazard risks for hazard risk reduction and disaster management, and serve as a guide for policy-makers to make informed decisions about the region for its safety and resilience [33].
2. Study Area
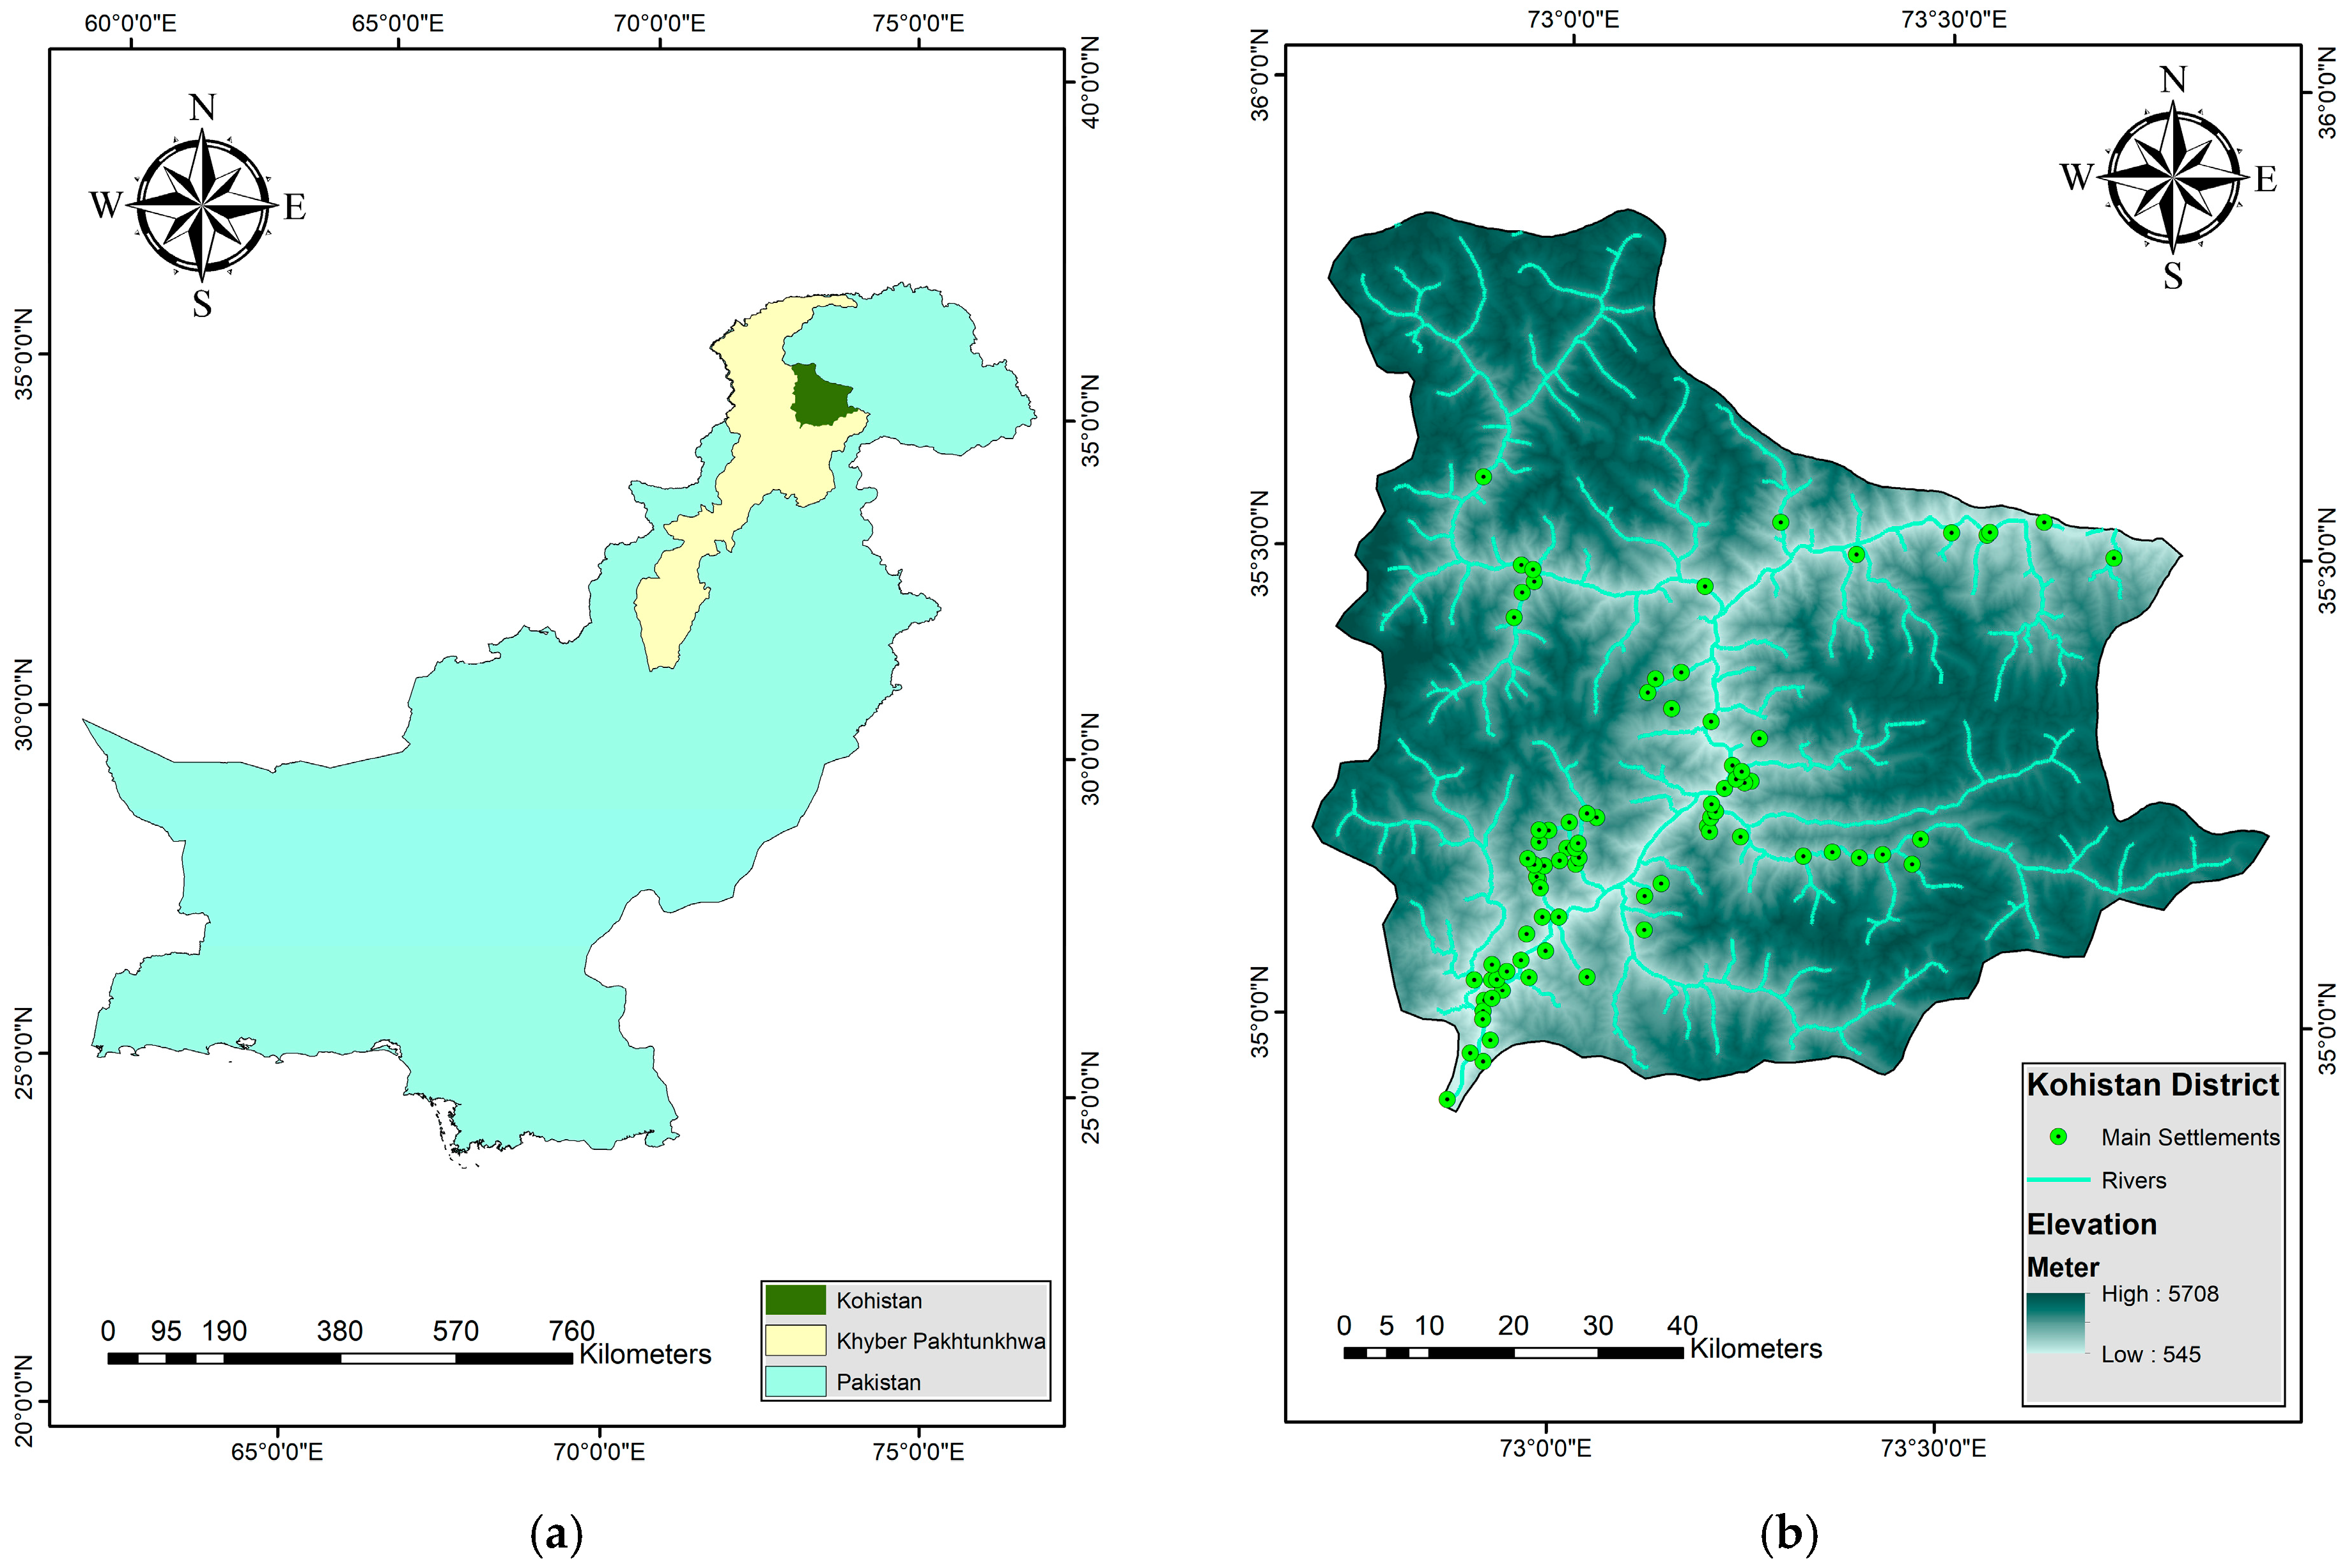
The Kohistan District is located in the Hazara division in northern Khyber Pakhtunkhwa, Pakistan. It lies in south of Gilgit Baltistan and east of Swat, between 34°54′–35°52′ north latitude and 72°43′–73°57′ east longitude. Figure 1 shows the location of Kohistan in Pakistan and shows the major settlements, rivers, and elevation of the district. It consists of Upper Kohistan, Lower Kohistan, and Kolai Palas. Its total area is 7492 km2 and population is 784,711 (according to the 2017 census). Kohistan literally means “the land of mountains”. It is situated at the intersection of the mountain ranges of the Himalayas, Karakoram, and Hindukush, which makes it one of the most unique mountain ecosystems of the world. This has made the area rich in flora and fauna, home to a large variety of animal and bird species such as snow leopards and tragopan pheasants. The district is also home to alpine pastures, dry temperate conifer forests, deodar, shrub oaks, and sub-tropical pine forests. The River Indus flows from northeast to southwest, dividing the district into approximately equal halves. Some of the main locations in the area are Dasu, Kandia, the Palas Valley, the Dubair Valley and Patan. Its people depend mostly on agriculture and livestock breeding. The district belongs to the Wet Mountains Agro-Ecological Zone of Pakistan and the soil is generally clayey, a silty loam, or silty clays, being non-calcareous at altitudes above 2100 m. Annual precipitation ranges between 1290 mm and 2110 mm, with rainfall being a major contributing factor to floods and landslides in the region. The lower areas receive heavy monsoon rains, while the higher elevations are influenced by snowfall from western disturbances. These climatic conditions contribute to seasonal flooding and landslide activity. The climate is strongly affected by topography, with rugged terrain, high rangelands and river valleys, monsoonal influence, and westerly snowfalls and rains, making it a Highland and Semi-Arid region. It is warmer in the summer and very cold in the winter, mostly with heavy snowfalls. Monsoon rains heavily affect the district, especially the lower parts of Kohistan. Landslides in the region are primarily triggered by intense rainfall, snowmelt, and seismic activity. The combination of steep slopes, loose soil, and excessive water infiltration leads to slope failures. Kohistan lies in zone 3 in terms of seismicity and experiences moderate to high earthquakes often [34]. These earthquakes not only pose direct risks but also destabilize slopes, increasing the likelihood of landslides. Kohistan mostly has low-type roads, but Karakoram Highway (KKH) (N-35), connecting Gilgit Baltistan to the rest of the country, also passes through it. Hydropower projects such as the Dasu Dam are underway in the area [35]. While natural factors dominate hazard susceptibility in Kohistan, deforestation, infrastructure development, and other such human activities may further contribute to instability in some areas.

Figure 1.
(a) Location of study area in Pakistan. (b) Map showing major settlements, streams, and elevation in study area.
3. Materials and Methods
3.1. Hazard Inventory Mapping
To map dual hazards in Kohistan, the first step was individually mapping each hazard. This approach is important, as it allows us to understand and assess the specific risks posed by floods and landslides. Thus, we can enhance the resilience of communities, helping them prepare for and respond to such events sustainably. The mapping for this study was carried out using various data sources, including USGS maps, Google Earth, different research units, and literature reviews. All spatial analysis was conducted using ArcMap version 10.7.1.
3.2. Factors Affecting Multi-Hazards
The data sources and types used for hazardous mapping are outlined in Table 1, which provides details on where each dataset was obtained. Table 2 presents the specific factors that were mapped for each hazard. The significance, role, and justification for each of the factors listed in Table 2 in hazard assessment are detailed in Section 3.2.1, Section 3.2.2, Section 3.2.3, Section 3.2.4, Section 3.2.5, Section 3.2.6, Section 3.2.7, Section 3.2.8, Section 3.2.9, Section 3.2.10, Section 3.2.11 and Section 3.2.12. For our study, we assigned a rating scale from 1 to 5 for each factor, where 1 indicated being the least susceptible to and most stable during a hazard event while 5 represented the highest susceptibility and the greatest risk of hazard occurrence.

Table 1.
Datasets and sources for risk assessment data.
Table 2.
Factors for flood and landslide hazard assessment.
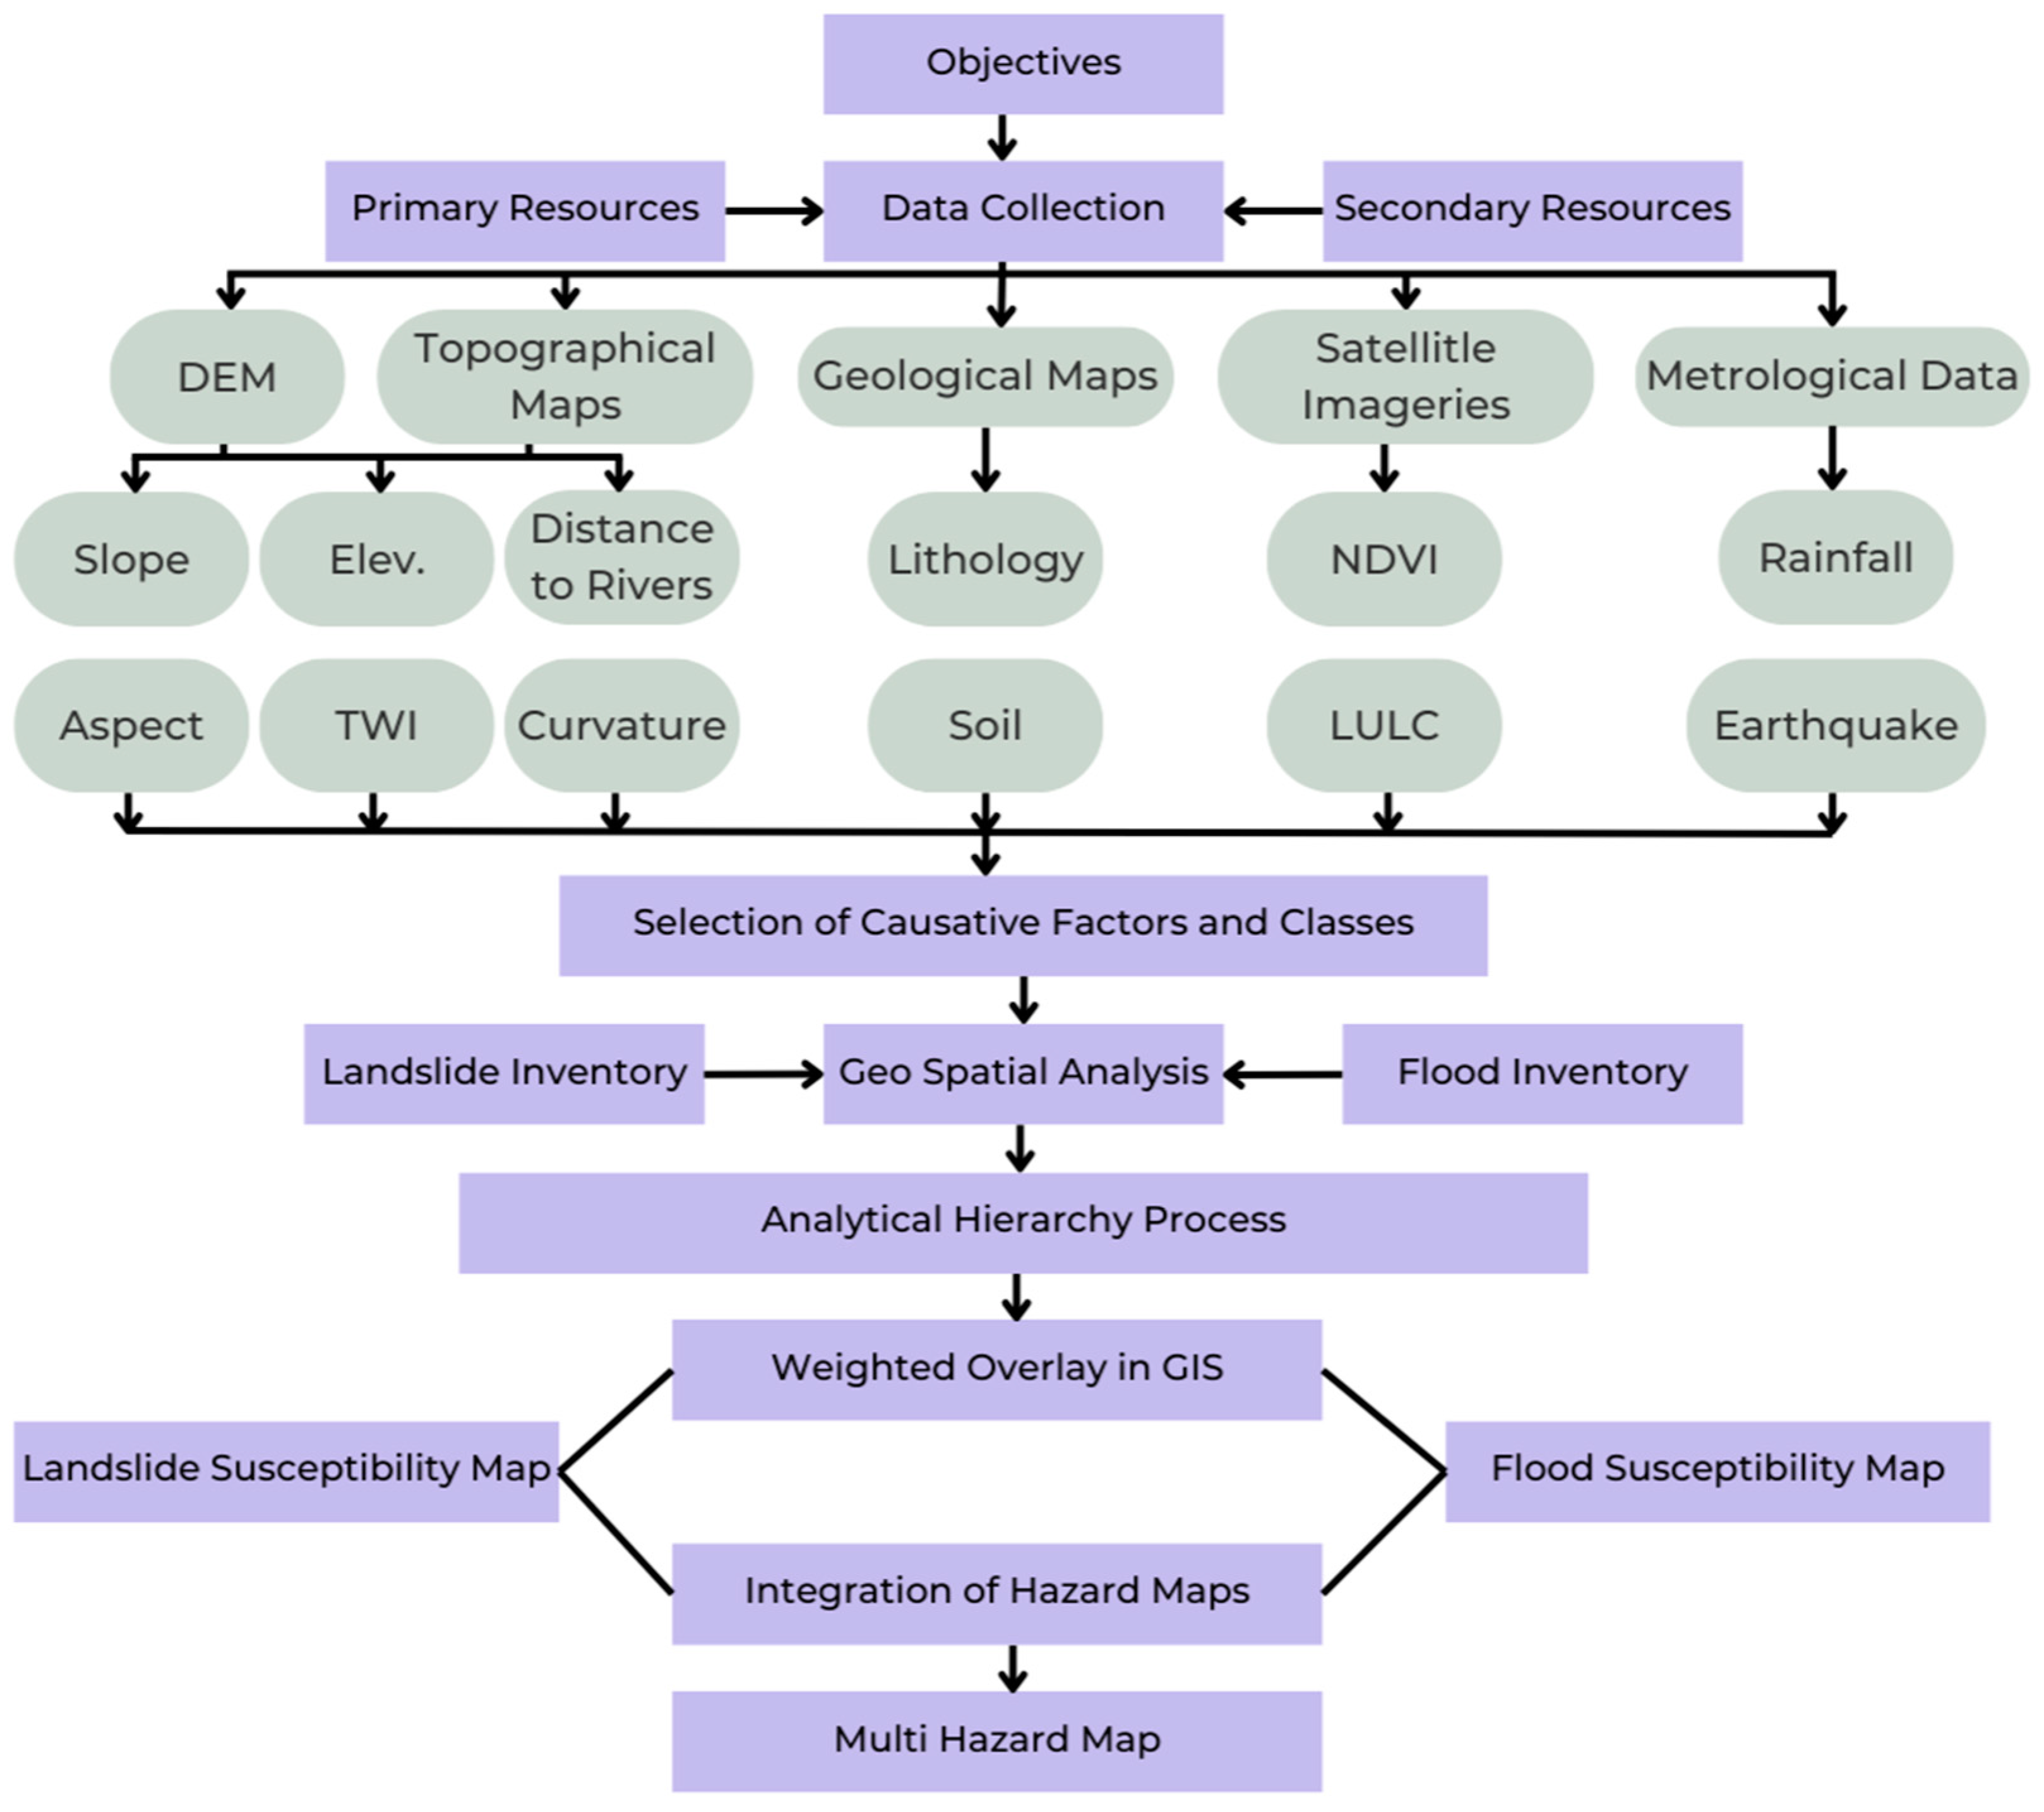
Figure 2 illustrates the methodological framework of our research, showing the process we followed. We analyzed the influencing factors and their respective classes and criteria and assigned corresponding ratings for both the flood and landslide assessments. Additionally, we generated thematic maps for each factor involved in the assessment, offering a visual representation of the hazard risk levels.
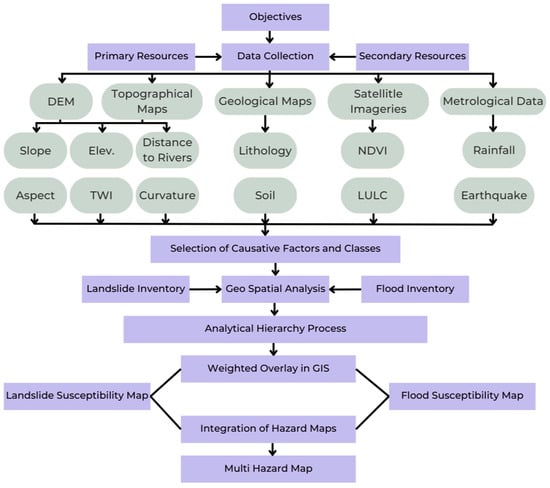
Figure 2.
Methodological framework of the research.
3.2.1. Slope
Flood and landslide risks are greatly influenced by slope, which is the steepness or angle of the land surface. Slope maps for Kohistan and its corresponding landslide and flood risk maps are displayed in Figure 3a–c, respectively. Fast-moving water on steep slopes causes less infiltration and more runoff, which can cause flash floods and serious soil erosion that worsens river sedimentation and raises flood levels downstream. On the other hand, milder slopes permit greater infiltration but might cause water to collect, which can lead to localized floods, especially in areas with impervious surfaces [36]. Gravitational forces acting on unstable soil make steep slopes more vulnerable to landslides, particularly during periods of excessive rainfall when water weakens soil cohesiveness and causes slope failure. Gentle slopes, while less susceptible to major landslides, can experience soil creep or smaller-scale failures if saturated or disturbed by human activities [37].


Figure 3.
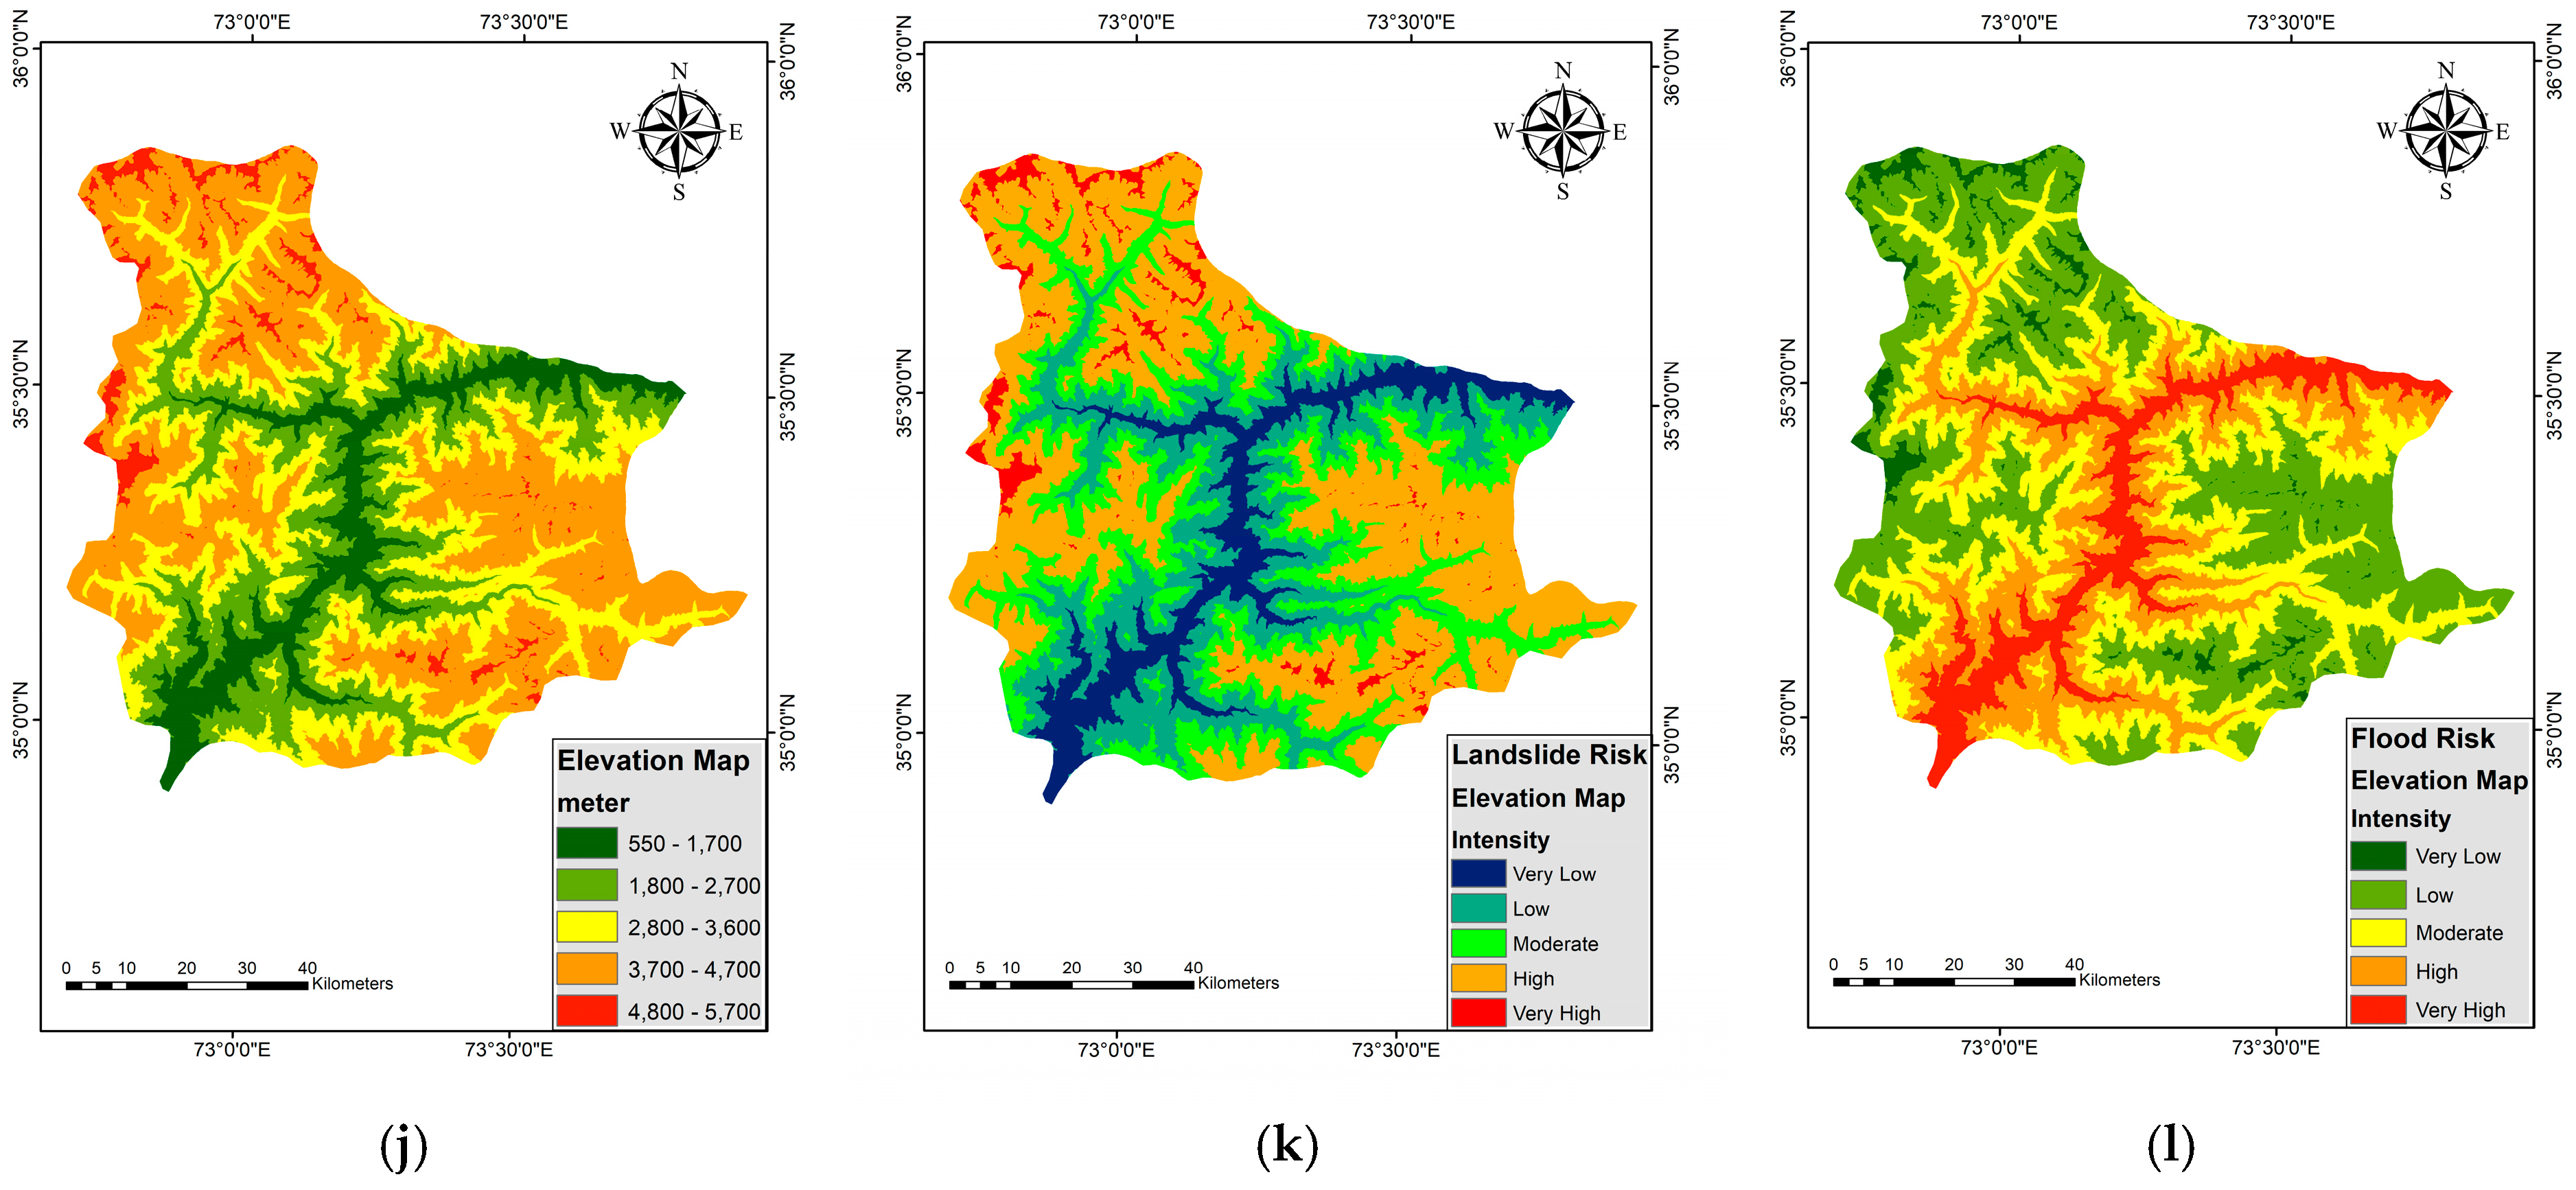
(a) Slope map, (b) reclassed slope landslide hazard map, (c) reclassed slope flood hazard map. (d) Curvature map, (e) reclassed curvature landslide hazard map, (f) reclassed curvature flood hazard map. (g) LULC map, (h) reclassed LULC landslide hazard map, (i) reclassed LULC flood hazard map. (j) Elevation map, (k) reclassed elevation landslide hazard map, (l) reclassed elevation flood hazard map.
3.2.2. Curvature
Curvature refers to the shape or bending of the land surface and is commonly categorized as concave, convex, or flat. The results of the curvature function and their corresponding landslide and flood risk maps are displayed in Figure 3d–f, respectively. Due to decreased soil shear strength, concave slopes have a tendency to retain water and silt, increasing saturation and the risk of landslides and floods. Convex slopes, on the other hand, encourage water distribution and are less likely to flood, but they are more likely to undergo shallow landslides as a result of soil thinning and erosion. Water flow and sediment distribution on planar slopes are influenced by a number of factors, including slope steepness [38,39].
3.2.3. Land-Use Land Cover (LULC)
The physical and human activities on the ground surface, such as forests, agriculture, urban areas, and water bodies, are referred to as land-use and land cover. These activities have a major influence on the hazards of flooding and landslides. Deforestation, urbanization, and agricultural growth are examples of changes in LULC that can worsen these hazards by changing runoff, soil stability, and natural water infiltration. By improving infiltration, stabilizing soils, and lowering surface runoff through vegetation cover, forested regions lower the danger of flooding and landslides. On the other hand, urbanization with impermeable surfaces causes soil instability on slopes, increases runoff, strains drainage systems, and exacerbates flooding [40]. Vulnerability to landslides increases as a result of agricultural methods that cause soil erosion and decreased cohesiveness, particularly on steep slopes. To lessen these risks, land management must be performed effectively. [41]. In this study, the land-use and land cover were classed into water, snow/ice, rangelands, forests, crops, built area, and bare ground, as shown in Figure 3g for Kohistan. The corresponding landslide and flood risk maps are displayed in Figure 3h,i, respectively.
3.2.4. Elevation
A key factor in assessing the danger of flooding and landslides is elevation, which is the height of a land surface above a reference point, typically sea level. Because they are closer to bodies of water and have poorer drainage, low-elevation locations are more likely to flood during periods of intense rainfall or storm surges. On the other hand, because of their steep slopes, unstable soils, and gravitational pull, high-elevation regions are prone to landslides and frequently experience rapid water runoff, which can cause flooding downstream. Elevation variations affect soil saturation, sediment transport, and water flow—all of which are important variables for the vulnerability of landslides and floods. Better infrastructure and land-use planning is made possible by elevation data, which is essential for hazard mapping and risk reduction techniques [42,43]. Figure 3j–l present the elevation map and its reclassified landslide and flood risk maps for the Kohistan District.
3.2.5. Distance from the Rivers
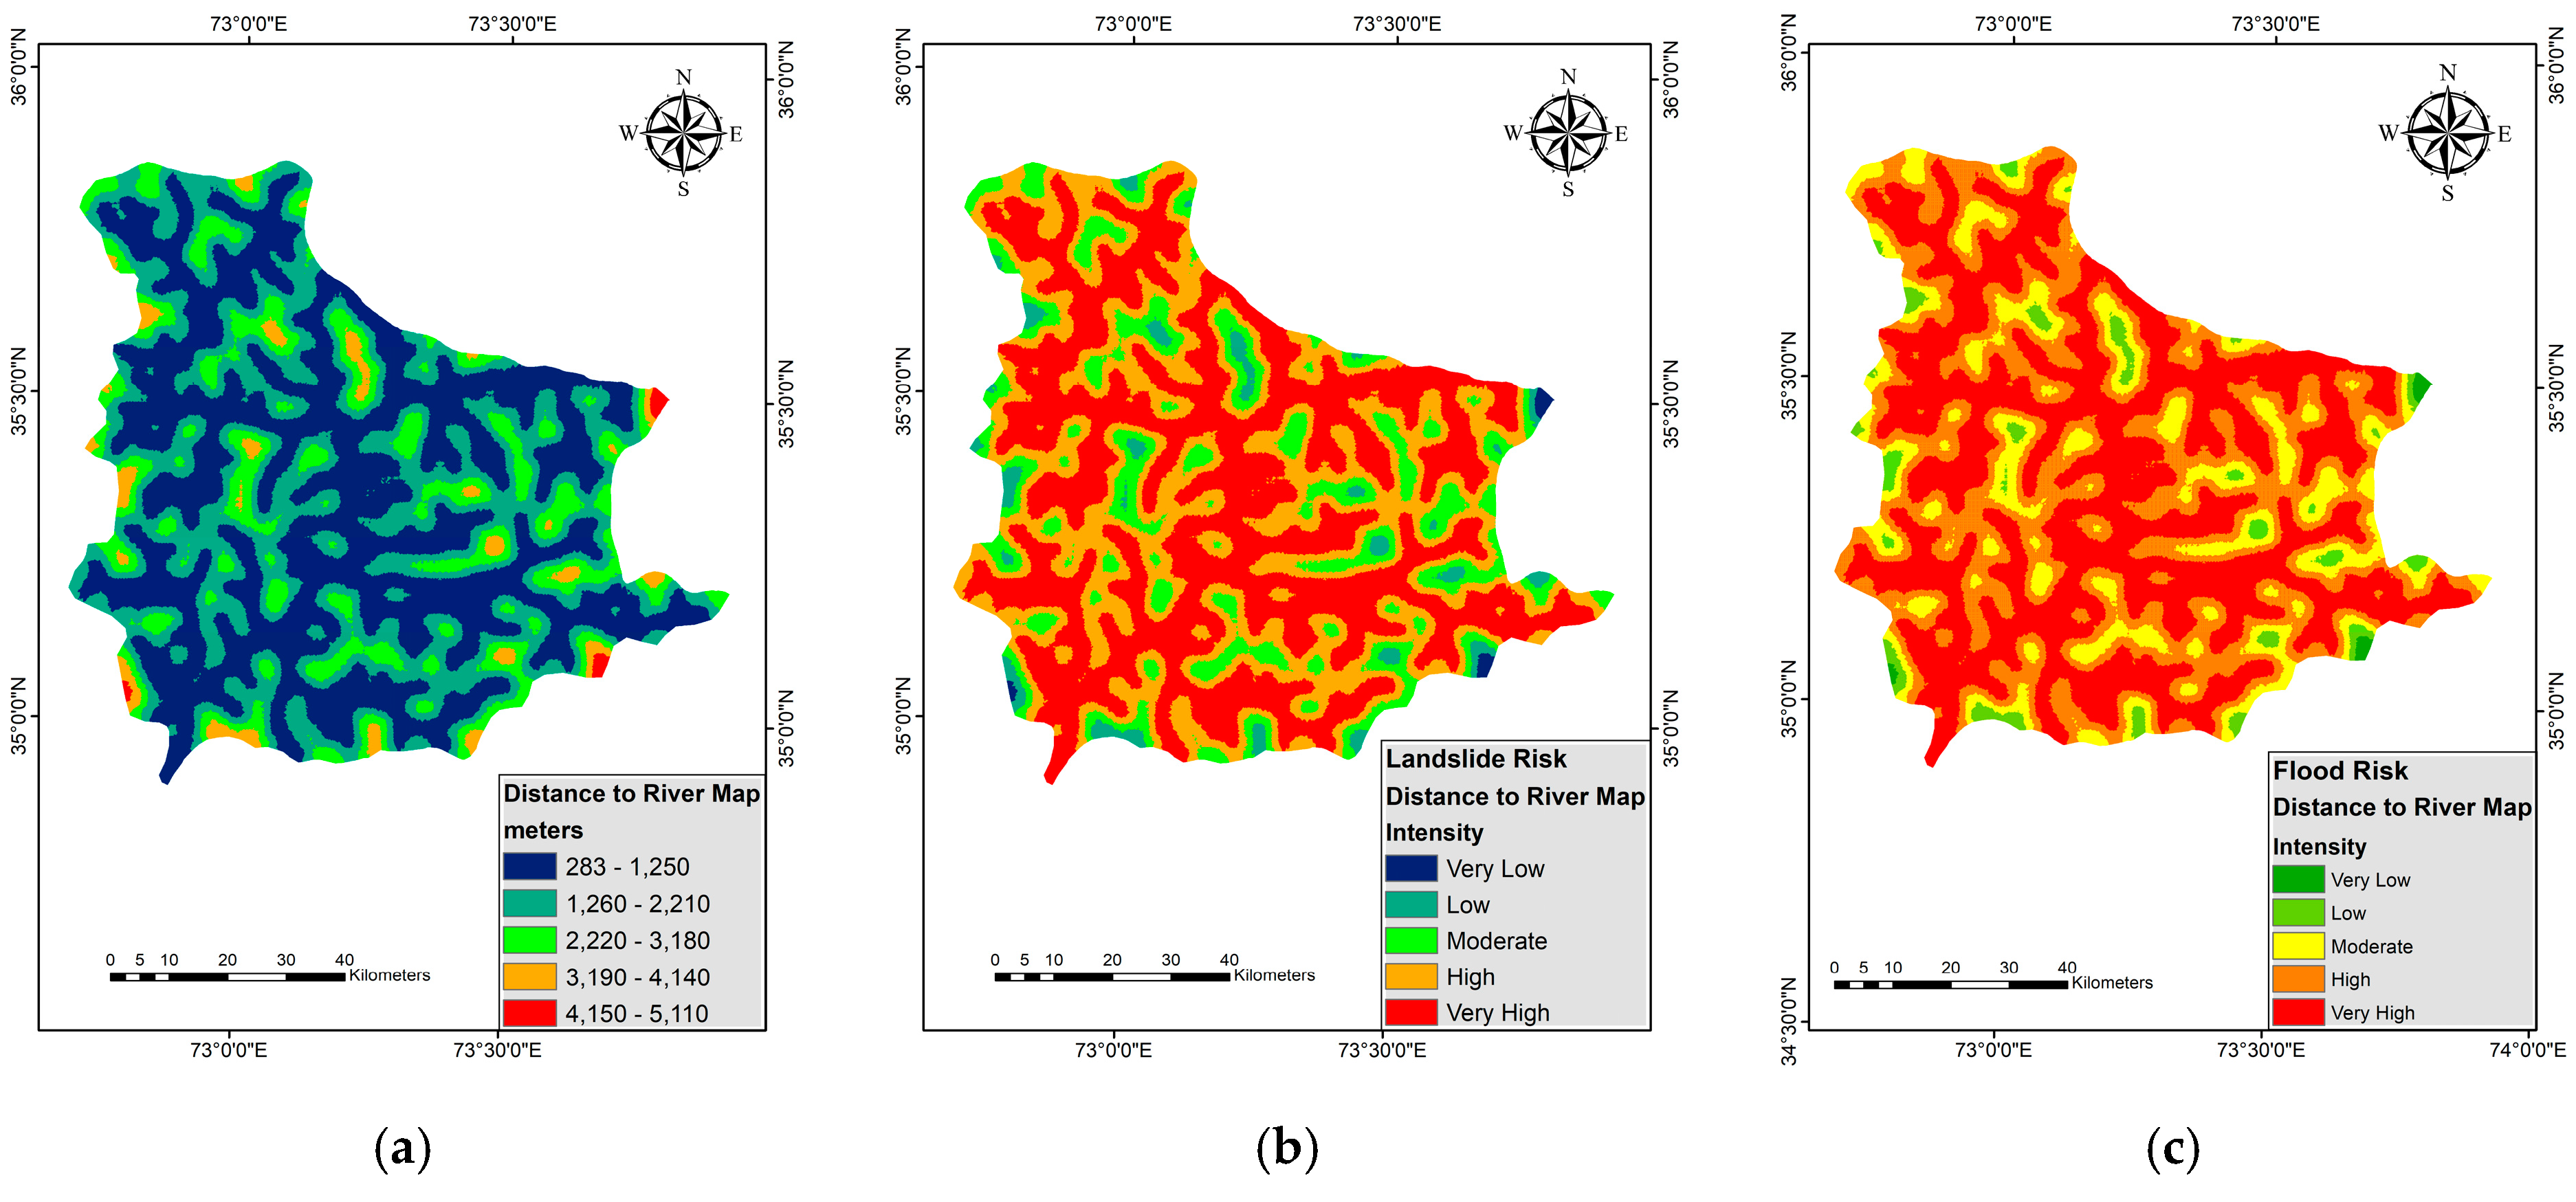
Areas near rivers are typically more vulnerable to flooding during periods of heavy precipitation, snowmelt, or dam collapses, making distance from rivers a crucial factor in determining the danger of floods and landslides. Figure 4a–c show the closeness to rivers map for Kohistan and its corresponding reclassed landslide and flood risk maps, respectively. Due to the possibility of riverbanks overflowing, particularly in low-lying areas, being close to rivers increases the risk of flooding [44]. Furthermore, because river erosion can destabilize the base of slopes and cause mass movements, areas close to rivers with steep adjacent slopes are particularly vulnerable to landslides. On the other hand, places further away from rivers usually have lower flood risks, but if additional factors like steep terrain and soil saturation are present, runoff-induced landslides could still occur. Designing efficient flood barriers and slope stabilization techniques requires an understanding of how terrain, hydrology, and river proximity interact [45].

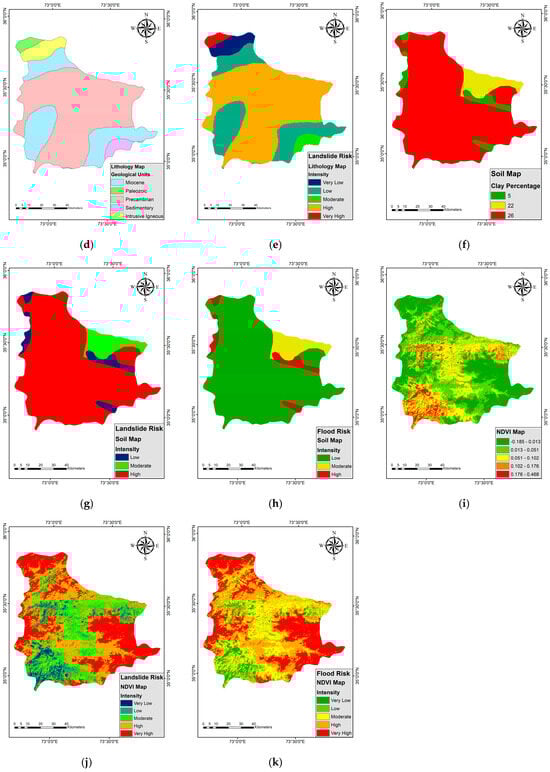
Figure 4.
(a) Distance to streams map, (b) reclassed distance to streams landslide hazard map, (c) reclassed distance to streams flood hazard map. (d) Lithology map, (e) reclassed lithology landslide hazard map. (f) Soil map, (g) reclassed soil landslide hazard map, (h) reclassed soil flood hazard map. (i) NDVI map, (j) reclassed NDVI landslide hazard map, (k) reclassed NDVI flood hazard map.
3.2.6. Lithology
Lithology refers to the physical and mineralogical characteristics of rocks, including their composition, texture, and permeability, and it significantly influences flood and landslide risks [46]. Permeable lithologies, such as those of sandstone and fractured rocks, allow water infiltration, reducing surface runoff and lowering flood risk, whereas impermeable lithologies, like claystone or shale, limit infiltration and increase runoff, exacerbating flood hazards [47]. For landslides, weak or weathered lithologies, such as clay-rich or poorly consolidated rocks, are more susceptible to slope failures due to their reduced shear strength and water retention, which can lead to soil saturation and instability. In contrast, harder and more cohesive lithologies, like granites, are generally more resistant to landslides but can still fail under extreme weathering or seismic activity. Understanding lithological characteristics is essential for assessing terrain stability and hydrological behavior, enabling more effective hazard management [48]. Kohistan’s lithology map and its corresponding landslide map are given in Figure 4d,e, respectively.
3.2.7. Soil Data
Understanding and reducing the dangers of floods and landslides requires knowledge of the type, texture, structure, permeability, and moisture-holding capacity of the soil. Figure 4f–h show the soil map and corresponding reclassed landslide and flood risk maps, respectively, for Kohistan District. While clayey or compacted soils with poor permeability increase runoff and flood vulnerability, high-permeability soils, such as sandy soils, permit higher infiltration, lowering surface runoff and flood risk [49]. Shear strength, cohesiveness, and water retention capacity are important soil properties for landslides; loose, unconsolidated, or water-saturated soils are more likely to fail on slopes, particularly in steep terrain [50]. Knowing soil data makes it easier to pinpoint regions at risk, maximize land usage, and provide practical solutions like drainage systems and slope stabilization methods [51].
3.2.8. Normalized Difference Vegetation Index (NDVI)
Comparing the difference between red light, which plants absorb, and near-infrared light, which vegetation strongly reflects, the NDVI is a remote sensing statistic used to assess the density and health of vegetation. By identifying vegetation cover, which is essential for stabilizing soil and controlling hydrological processes, NDVI affects the risk of floods and landslides. Dense vegetation with high NDVI values lowers the risk of flooding by improving water penetration and reducing surface runoff, and it also lowers the risk of landslides by stabilizing slopes via root reinforcement [52,53]. On the other hand, low NDVI levels, which are a sign of sparse or damaged vegetation, make a slope less stable, which increases the risk of landslides, and make a place more vulnerable to floods because of increased runoff. To reduce these risks, reforestation or land management plans can be guided by NDVI monitoring, which can also help with hazard assessment [54]. Kohistan’s NDVI map and its corresponding landslide and flood risk maps are shown in Figure 4i–k, respectively.
3.2.9. Rainfall
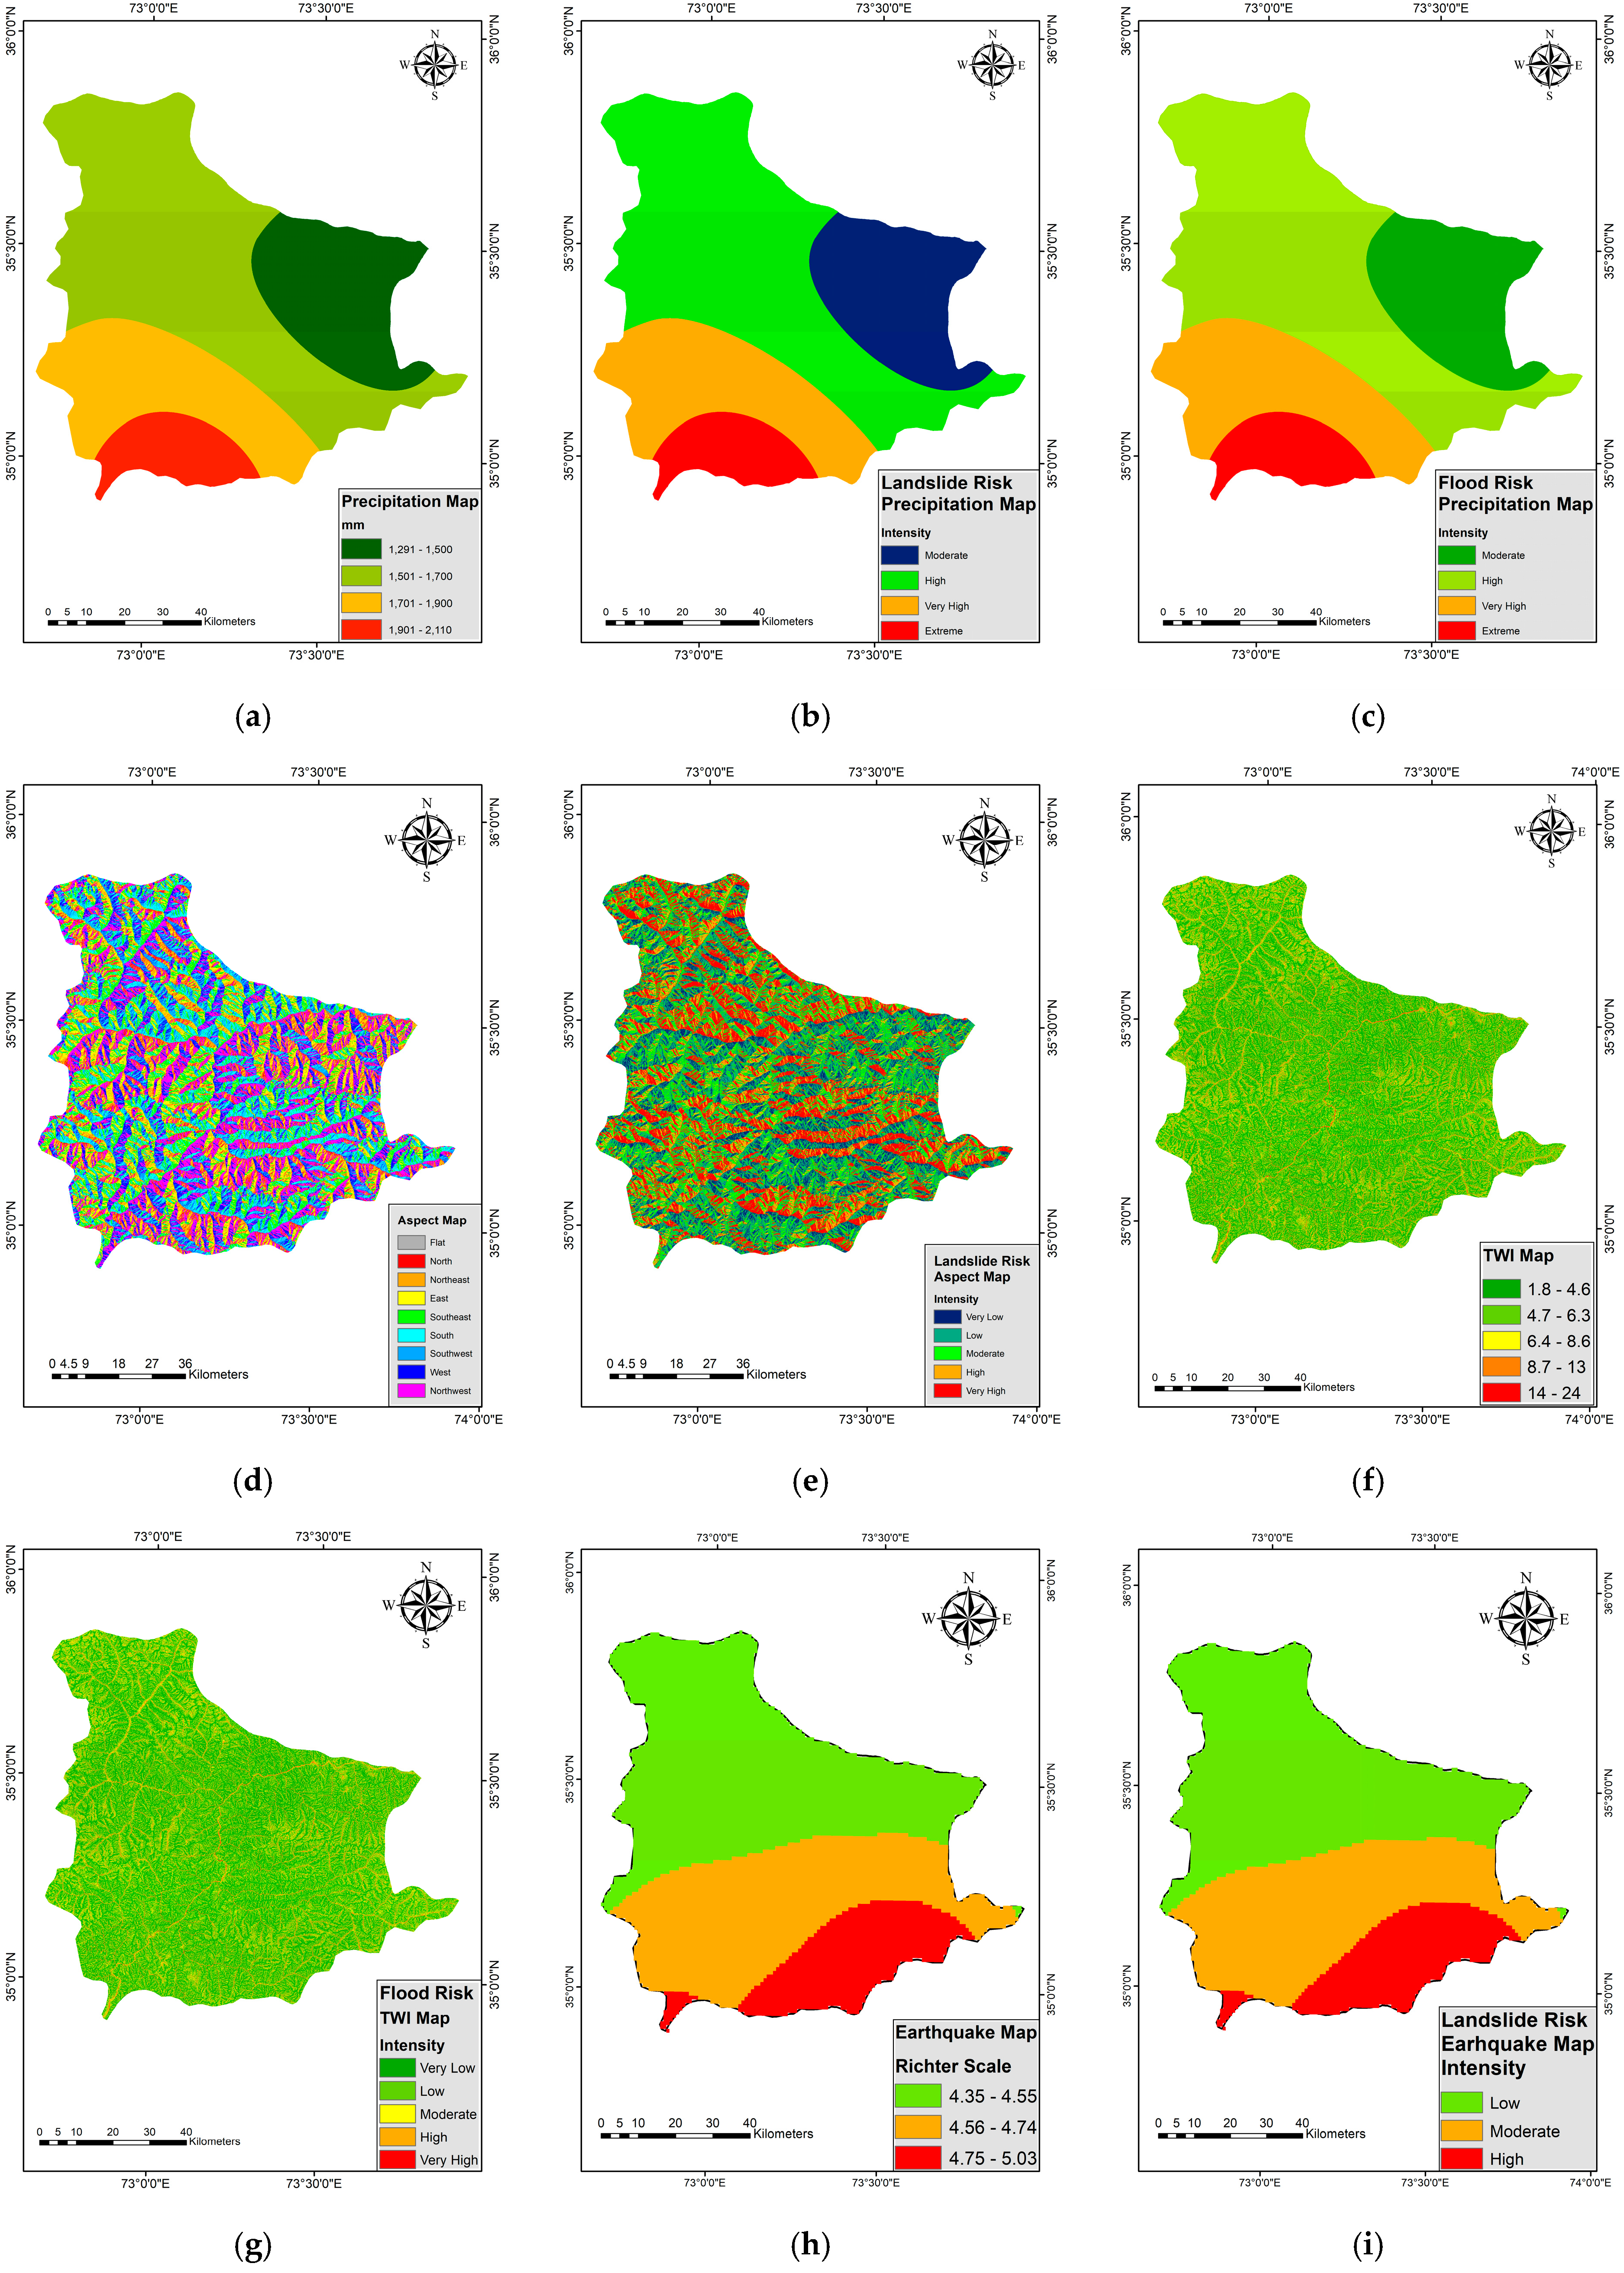
The amount of precipitation that falls on the Earth’s surface is referred to as rainfall, and it has a big influence on the likelihood of landslides and floods. By overburdening drainage systems and raising the possibility of riverine or flash floods, heavy or continuous rainfall increases surface runoff, decreases infiltration, and increases water accumulation, all of which enhance the danger of flooding [55,56]. The rainfall map for Kohistan District and its corresponding landslide and flood hazard maps are displayed in Figure 5a–c, respectively. Heavy rains can saturate soils, decreasing their stability and cohesiveness and increasing the likelihood of slope sliding and failure in landslides. Because saturated soils and increased water flow exacerbate instability, areas with steep slopes and heavy rainfall are especially susceptible to landslides and floods [57].
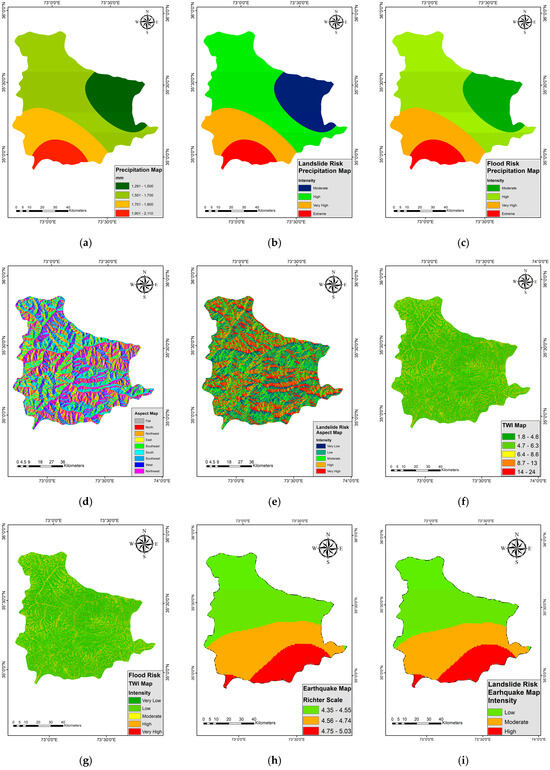
Figure 5.
(a) Rainfall map, (b) reclassed rainfall landslide hazard map, (c) reclassed rainfall flood hazard map. (d) Aspect map, (e) reclassed aspect landslide hazard map. (f) TWI map, (g) reclassed TWI flood hazard map. (h) Earthquake map, (i) reclassed earthquake landslide hazard map.
3.2.10. Aspect
A slope’s aspect is the direction it faces, and it can be broadly divided into four orientations: north, south, east, and west. The aspect map and its corresponding landslide risk map are given in Figure 5d,e for Kohistan. Because aspect affects the amount of precipitation and sun radiation received, it has a substantial impact on the dangers of floods and landslides. Due to increased evaporation rates, drier soils, and decreased infiltration, slopes that face south and west are more likely to experience flooding and surface runoff during periods of intense precipitation. On the other hand, north-facing slopes receive less sunshine, which results in cooler, wetter weather. This can make the soil more saturated and more vulnerable to landslides, particularly during periods of heavy precipitation. Aspect also affects vegetation growth, which lessens erosion and stabilizes slopes. Assessing terrain stability and creating land management strategies to reduce these risks require a thorough understanding of this component [58,59].
3.2.11. Topographical Wetness Index (TWI)
A hydrological model called the Topographic Wetness Index (TWI) measures a land surface’s tendency to retain water based on its slope and upstream contributing area. Areas with a higher TWI value have a lower slope and a higher capacity for water accumulation, making them more vulnerable to surface runoff during rainy seasons and raising the danger of flooding. On the other hand, regions with lower TWI values are less likely to have protracted waterlogging since they have steeper slopes and quicker water drainage. A high TWI may be a sign of saturated soils and decreased slope stability, which increases the likelihood of shallow and deep-seated landslides during periods of intense precipitation. TWI is a useful method for evaluating terrain stability and hydrological concerns [60,61]. The TWI map and corresponding reclassed flood risk map can be seen in Figure 5f,g for Kohistan District.
3.2.12. Earthquakes
Earthquakes significantly influence the occurrence of landslides, as seismic events can trigger slope failures by generating ground shaking. The intensity, duration, and frequency of the earthquake determine the level of instability it introduces to the terrain. In regions with steep slopes, seismic vibrations can dislodge rocks, soil, and debris, initiating landslides. The sudden release of stress during an earthquake can lead to a rapid decrease in soil cohesion, especially in areas with loose or weathered material. Additionally, the shaking can destabilize previously stable slopes by causing fractures or cracks that allow water to infiltrate, further weakening the soil. The earthquake map and its corresponding landslide risk map for Kohistan are shown in Figure 5h,i, respectively. The risk of landslides is particularly heightened in areas with fragile geological formations, like Kohistan, and they are more susceptible to failure when subjected to seismic forces [62,63].
3.3. Determination of Layer Weights
The Analytical Hierarchy Process was applied to weigh layer factors. The AHP is a semi-quantitative method which makes the process of complicated decision-making simpler by dividing it into feasible steps and by minimizing inconsistency in judgments [64]. This method is quite useful and efficient for multi-criteria problems, allowing the systematic comparison of different factors. The following are the most important steps:
- Breaking down the problem into factors: The decision-making problem is broken down into key elements or criteria that influence the overall outcome.
- Structuring these factors into a hierarchy: In this case, the criteria are structured in a hierarchical manner, with the most prominent goal at the top and then criteria followed by sub-criteria at each subsequent level. This way, no critical factor is missed.
- Assigning a number to each factor on a scale of 1 to 9: This scale represents how important factors are to one another, ranging from 1 for equal importance to 9 for extreme importance. The intermediate values between these are 2, 4, 6, and 8 for more intermediate comparisons.
- Comparison matrix: A pair-wise comparison of factors is performed and the results are presented in a matrix that displays their relative importance.
- Normalized principal eigenvectors: This is a mathematical process that calculates the weights to accurately represent the relative importance of each factor.
The AHP also includes a mechanism to ensure the consistency of judgments, measured through the Consistency Index (CI), calculated using Equation (1):
Here, λmax is the largest eigenvalue and n is the matrix size. To verify the logical coherence of these comparisons, the Consistency Ratio (CR) is calculated using Equation (2):
The value of RI (random index) depends on the matrix size. If CR < 0.1, the comparisons are considered consistent; otherwise, the matrix requires adjustments to improve reliability [65]. The AHP was applied in this study to evaluate and assign weights to two matrices corresponding to flood and landslide risks. Our CRs were 0.033 and 0.09 for the AHP calculations of flood and landslide risks, respectively.
3.4. Hazard Assessment
For hazard assessment, we first conducted individual hazard mapping for floods and for landslides. Then, the two hazard maps were overlaid to generate an integrated hazard map for Kohistan.
3.4.1. Flood Hazard Assessment
Flood mapping can be performed using probabilistic methods, GIS-based analysis, and hydrological modeling like HEC-HMS, HEC-RAS, SWAT analysis, etc. Hydrological modeling is a very efficient way to simulate rainfall and runoff processes and predict flooding. However, there is a lack of large-scale and detailed hydrological and meteorological data, especially for developing countries like Pakistan, so GIS-based flood modeling was implemented for our study in Kohistan. Factors like elevation, slope, proximity to streams, land-use/land cover, and rainfall intensity, etc., were integrated in ArcGIS. Rainfall, proximity to streams, and elevation were identified to be the most critical factors in our study area. Then, the Analytical Hierarchy Process (AHP) was applied to assign weights to the factors based on their relative importance. These weights were used to overlay the factor maps in ArcGIS using a weighted overlay to obtain a flood risk map. The Consistency Ratio (CR) was calculated as 0.033, which was less than 0.1. This confirmed that our decision matrix was reliable and consistent.
3.4.2. Landslide Hazard Assessment
Landslide hazard assessment can be performed by deterministic models or probabilistic approaches that require detailed geotechnical and slope stability data. Here, too, we applied a GIS-based landslide risk analysis because of its feasibility, practical nature, and the easily available spatial data. Factors such as slope, aspect, curvature, geology, seismology, and land use, etc., were considered, with slope identified as the most influential factor. Pedology and rainfall were also two important factors after slope. After that, weights were assigned to each factor based on their importance in causing landslides using the AHP. The Consistency Ratio (CR) for the AHP model was 0.09, which was less than 0.1.
3.4.3. Multi-Hazard Risk Assessment
For the multi-hazard risk assessment, the flood and landslide hazard maps were assigned equal weights and integrated using the weighted overlay tool in ArcGIS to obtain one map highlighting the possibility of both hazards. This was performed because both hazards pose significant risks in the study area, and there is not sufficient historical evidence to justify prioritizing one hazard over the other. By assigning the two hazards equal weights, the resulting multi-hazard map provided a balanced representation of susceptibility to both hazards.
4. Results and Discussion
4.1. Flood Hazard Map
The flood map characterizes Kohistan with respect to flood risk, as shown in Figure 6. Main settlements such as the Dubair Valley, Palas Valley, Besham, and Pattan are at a high risk of flooding. This is mainly because of the fact that most of Kohistan, especially the lower parts of the district, receive extreme rainfall during the monsoon months as well as in winter, overwhelming the natural drainage systems. Also, most of the settlements in Kohistan lie close to the Indus River, the main river that cuts across the whole district. The effects of sediment deposition, the narrowing of the streams caused by human activities such as commercial exploitation, and the unplanned expansion of communities near water bodies also increase the area’s flood vulnerability. Urban areas, particularly in the highly flood-prone zones, are densely populated, which limits natural water infiltration and exacerbates flooding.
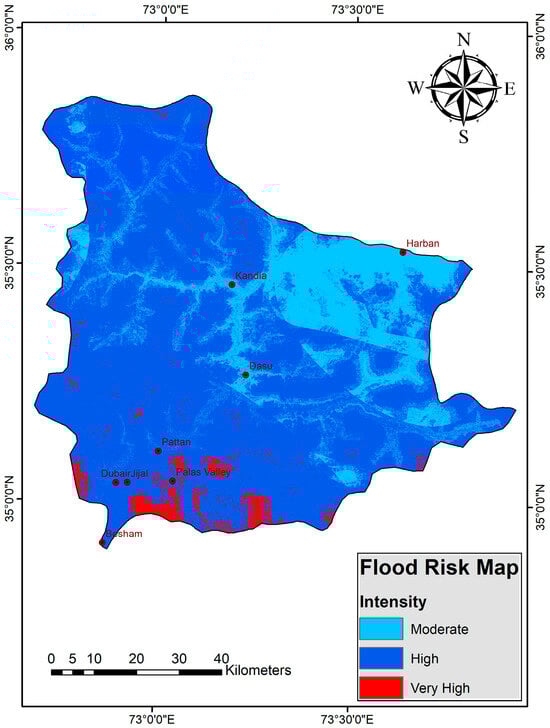
Figure 6.
Flood hazard map for Kohistan District.
According to our research, 20 percent of Kohistan is at a moderate risk, 77 percent is at a high risk, and 3 percent is at a very high risk of flooding. Agricultural and crop lands are notably vulnerable to flooding as their proximity to streams and lower elevations increases their susceptibility. Along with that, the increased cutting of forests for industrial purposes increases the vulnerability of the area due to soil destabilization and reduced water infiltration. The Indus River significantly contributes to increased runoff during periods of heavy rainfall. While the Dasu Dam, currently under construction on the Indus River, is expected to play a role in regulating water flow and mitigating flood risks in the future, this study focuses on the current flood risk scenario. The dam’s full impact on flood risk reduction will remain uncertain until its completion and operationalization. Our findings emphasize the importance of sustainable land-use practices and improved water management systems to address flood risks effectively in the region.
4.2. Landslide Hazard Map
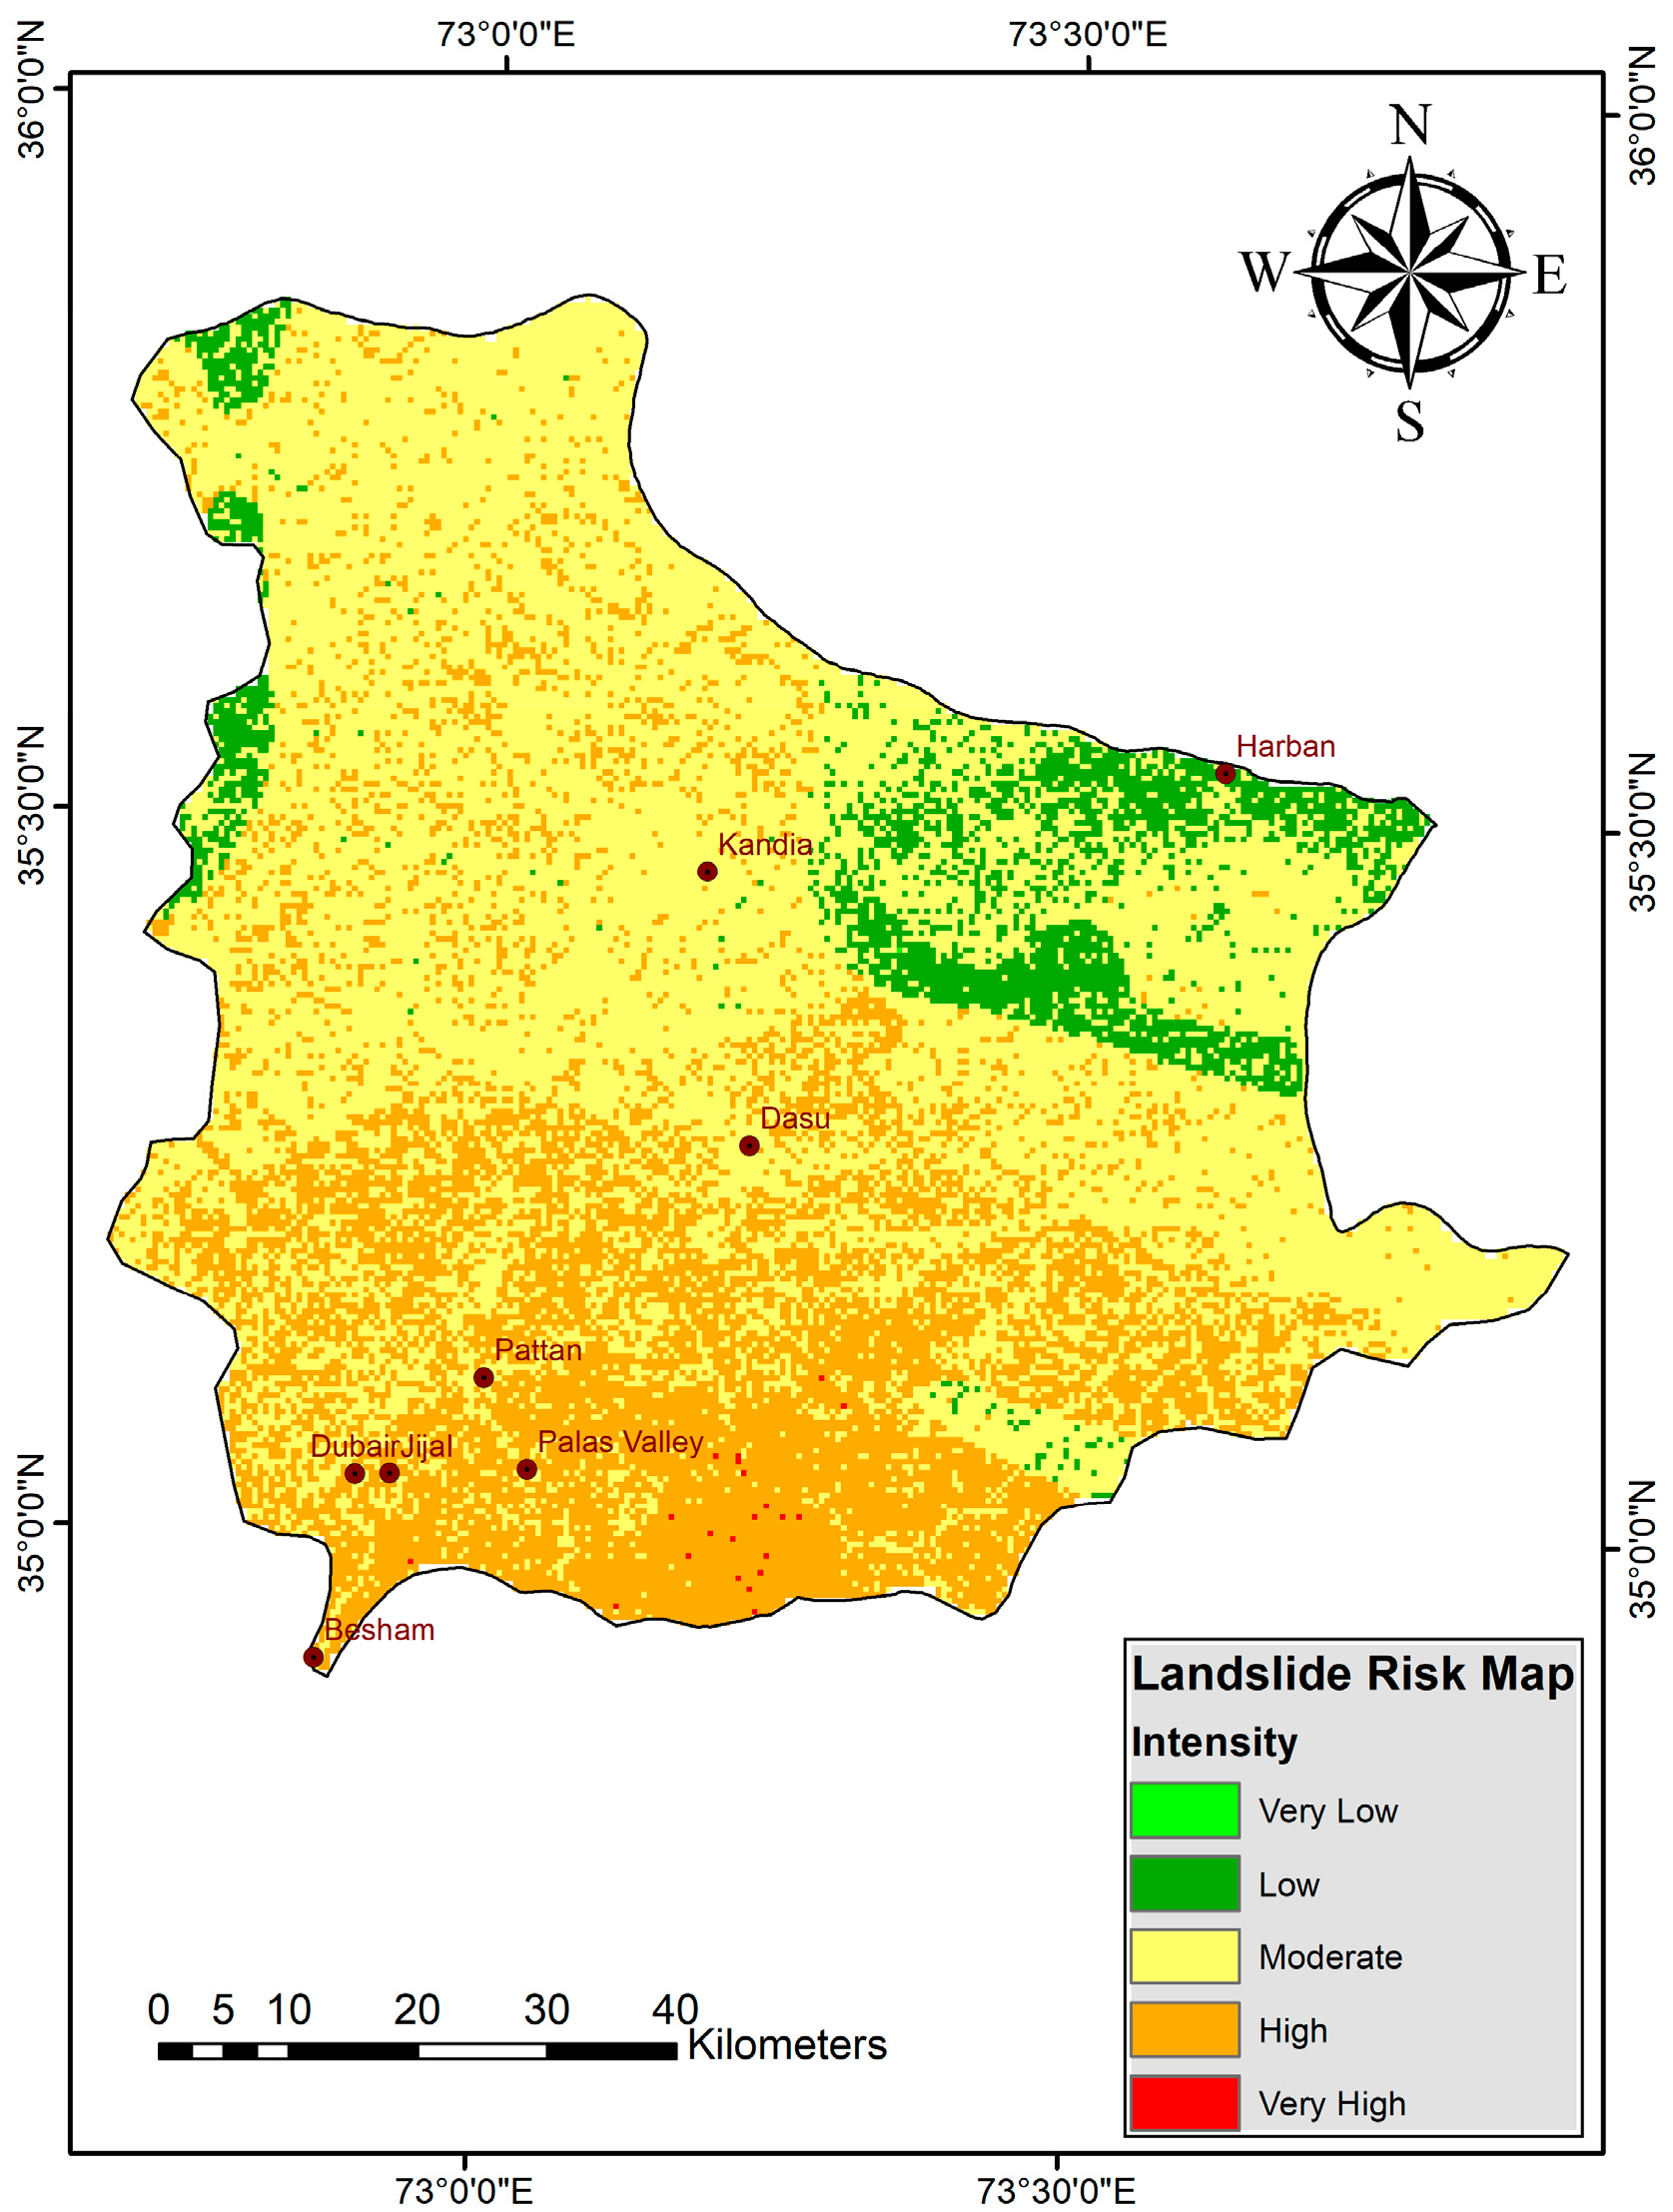
The landslide map shows the distribution of landslide risk across the study area. Most of the areas are at moderate and high landslide risk, as shown in Figure 7. Palas, Jijal, and the Dubair Valley are at a high landslide risk, while Dasu and Pattan are among the areas at moderate risk. These areas exhibit high landslide risks due to the combination of various factors, such as steep slopes, unstable soils, and sensitive geology, as well as high rainfalls and the presence of fault lines or seismic activity. The upper eastern region is at a somewhat low risk of landslides because of its lower rainfall exposure compared to the rest of the district.
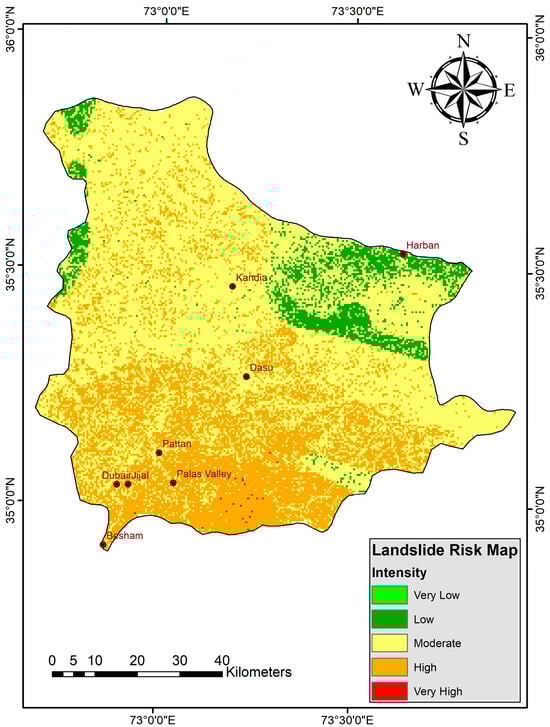
Figure 7.
Landslide hazard map for Kohistan District.
Terrain orientation also influences landslide risk, with specifically the south- and east-facing slopes being more prone to failure due to variations in slope stability, rainfall, and sunlight exposure. The research findings suggest that nearly 7 percent are at a low, 62.5 percent at a moderate and 30.5 percent at a high risk of failure. Very low- and very high-risk areas comprise less than 0.1 percent of the district. Areas with unstable slopes are particularly at risk, especially where land-use practices like deforestation and unregulated construction near vulnerable slopes further destabilize the terrain and lead to more landslide occurrences. Kohistan also experiences frequent earthquakes, which further destabilize slopes. These research results focus on the importance of identifying high-risk areas and implementing targeted adaptation strategies to reduce the effects of landslides in the region.
4.3. Integrated Hazard Map
The integrated hazard risk map, shown in Figure 8a,b, was created by integrating the flood and landslide risk maps using a weighted overlay method. More weight was assigned to flooding (0.6) as the region has become increasingly prone to floods in recent years, causing significant damage to the economy and loss of life. Landslides, however, were also assigned a substantial weightage (0.4) due to their frequent occurrence, leading to the blockage of the Karakoram Highway and other critical roads, resulting in fatalities and disruptions. While both hazards were considered nearly equally important due to their severe impacts on the region, the integration process provides us with valuable insights. However, some uncertainties may arise due to the subjective nature of weightage assessment and variations in data resolutions for both hazards that can influence the accuracy of the hazard maps. The integration process did not reassess the individual factors used in the separate flood and landslide maps. Instead, the already developed hazard maps were merged. The analysis revealed that areas closer to rivers were highly influenced by flooding, while steeper slopes were more vulnerable to landslides. The final integrated dual-hazard map provides a comprehensive understanding of risk distribution, helping to prioritize mitigation efforts in Kohistan. By considering these two impactful hazards together, this study provides critical information for the sustainable planning of disaster mitigation programs in Kohistan. The identification of areas of increased risk can allow policy-makers to implement measures that reduce long-term economic and environmental losses. The implementation of sustainable land management practices—for instance, managing urban growth and reforestation in risk areas—can significantly reduce hazard vulnerabilities. The results highlight the importance of including hazard assessments in regional development plans to avoid uncontrolled growth in risk areas. By allowing infrastructure projects to consider risks from multiple hazards, this study contributes to the goals of sustainability, making communities more secure and more resilient. As climate change intensifies in the future, the region is expected to experience more extreme rainfall events, accelerated glacial melt, and an increased frequency of floods and landslides. Unregulated urban expansion, deforestation, and infrastructure development along unstable slopes and riverbanks will further exacerbate hazard risks, making the district more vulnerable. Integrating hazard assessments into disaster preparedness policies and infrastructure development plans will help mitigate future risks. Additionally, effective land-use planning, such as controlled urban growth, reforestation in high-risk zones, and the enforcement of construction regulations, is crucial to minimizing long-term damage. If these challenges are not addressed, the increasing impact of natural hazards could lead to greater economic and life losses, as well as environmental degradation.
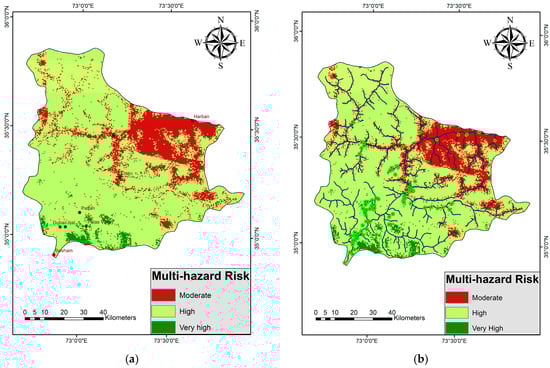
Figure 8.
(a) Integrated hazard map for Kohistan District with major settlements highlighted. (b) Integrated hazard map of Kohistan with most settlements and rivers shown.
4.4. Validation of Hazard Maps
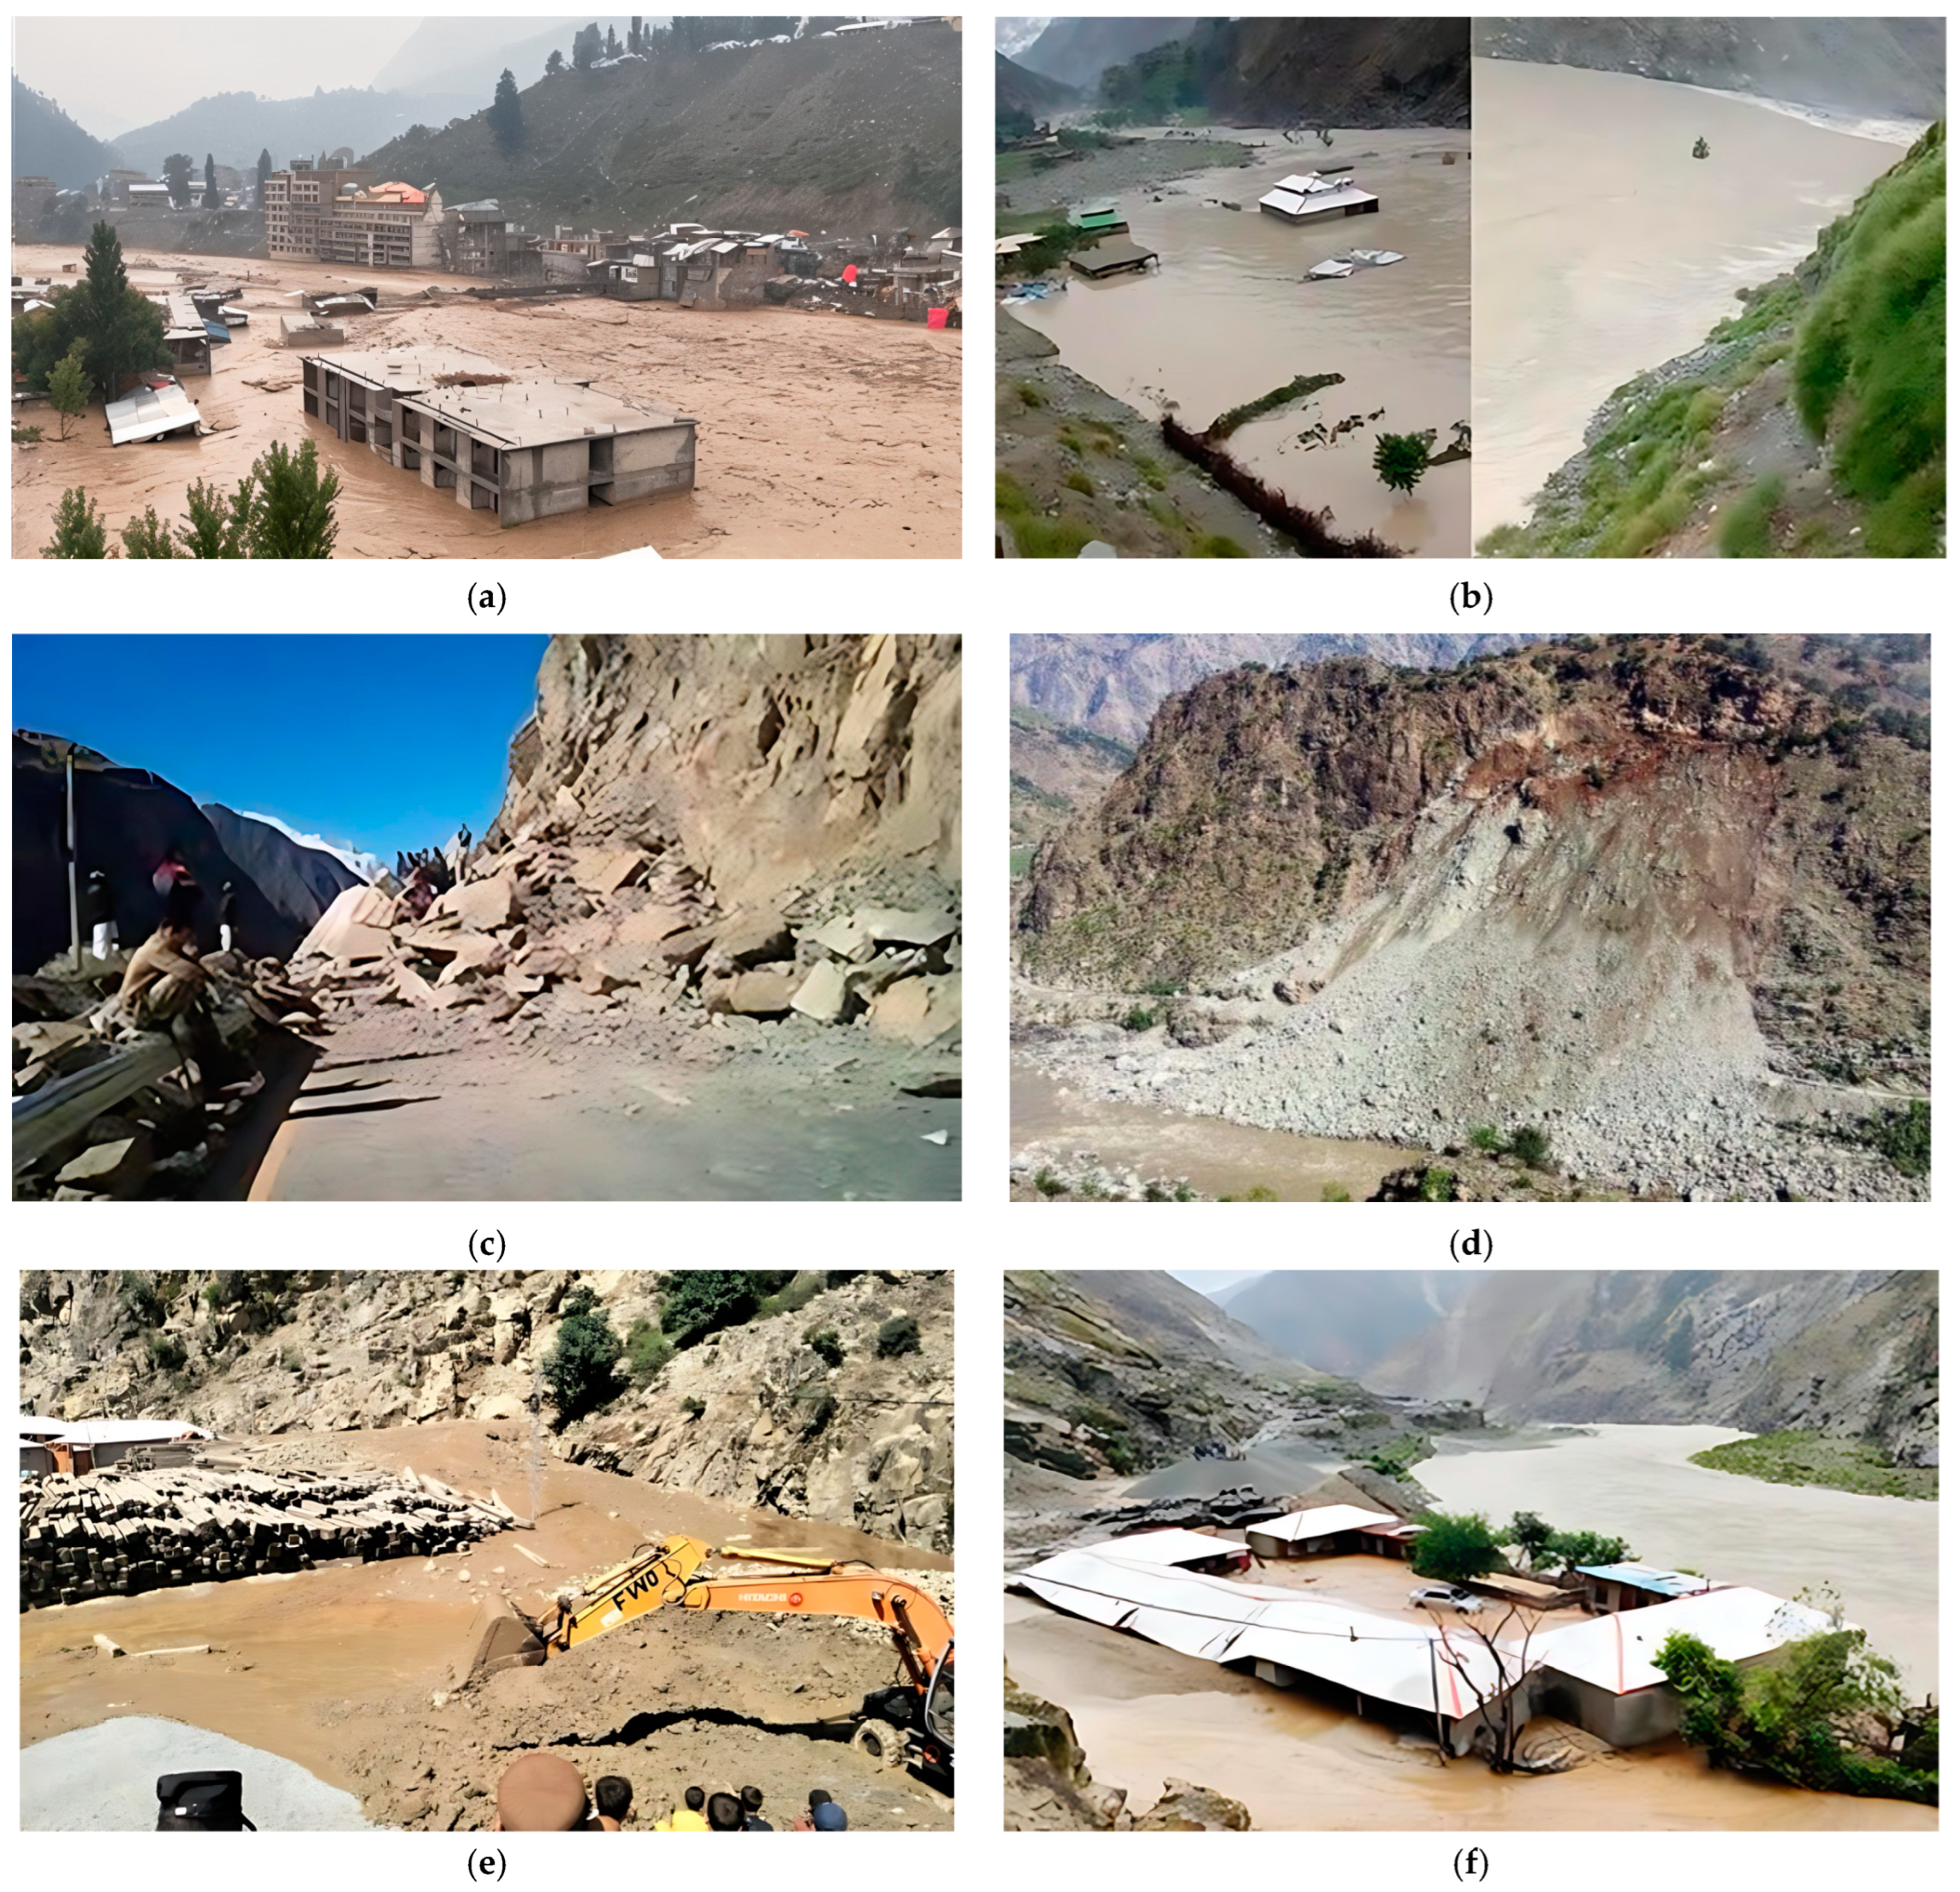
The validation of the hazard maps for floods and landslides in Kohistan was carried out by comparing the mapped hazard zones with historical flood and landslide events in the region. Major events, such as the devastating floods of 2010, 2022, and 2023 and landslides in 2016, were critical in validating the flood and landslide hazard zones [66,67]. In 2007, floods badly affected Pattan and surrounding villages like Martung, Dogabala, and Mini Chal. About 13 people were killed, over 200 houses were destroyed, and 40 commercial shops and mosques were also destroyed by flood water. In 2016, floods and many landslides were triggered by heavy rainfall in Kohistan. This led to a lot of destruction, the most destructive incident happening at Otharnala in Kandia where a large landslide destroyed houses, with 14 people reported dead and nearly 50 others injured/missing. Major landslides like the one at Chachun near Dasu-Komila and the one at Kiyal blocked the Karakoram Highway for two weeks. In 2022, as in most of Pakistan, heavy floods affected the main settlements in the district like the Dasu, Kandia, Dubair, Pattan, and Harban Valleys. The increased levels of water in the Indus River affected a significant portion of the district, with approximately 30% of the settlements being along the riverbanks. The 2023 floods displaced over 2000 people, with substantial damage to infrastructure including bridges, homes, and roads [68]. In February 2024, Karakoram Highway was blocked again because of landslide debris near Harban in Upper Kohistan [69]. In the previous year, too, KKH had remained blocked for almost a week in February. Furthermore, in September, widespread landslides, particularly in the Loter area, blocked the Karakoram Highway, resulting in the complete disruption of transportation for over a week and three fatalities [70]. The validation process also involved cross-referencing media reports, the provincial disaster management authority, and local news outlets on information about the occurrence and severity of the floods and landslides. For example, in 2023, media reports confirmed that settlements near the Indus River, particularly in the towns of Dubair, Jijal, and parts of Lower Kohistan, were the most vulnerable to flood damage. These areas are also highly prone to flooding on the hazard map. Satellite data from sources like Sentinel-1 provided additional insights into the scale and extent of the flood events, especially in remote regions. Though technical limitations restricted the full use of satellite imagery, it was utilized to confirm the damage in previously impacted areas and validate flood and landslide predictions for hard-to-reach locations. These events were cross-referenced with the hazard maps to confirm the high-risk areas, especially those near the Indus River and Lower Kohistan. The images shown in Figure 9a,b,f show the destruction caused by floods in the Dubair and Kandia regions, which are at a moderate to high risk of flooding. Figure 9c–e show landslides in the Dasu region and Chuchang, which are at a moderate to high risk of landslides. Most of the settlements in Kohistan are close to rivers and at high risk for both flooding and landslides. The hazard maps developed align with the actual impacts of floods and landslides and highlight the need for targeted disaster management in Kohistan. This reinforces their reliability for risk assessment in the area. However, to further refine these assessments, future research should incorporate real-time satellite data and higher-resolution terrain models. Analyzing long-term climate trends will be essential in understanding how shifting rainfall patterns and glacier-melt will impact future hazard risks. Additionally, working out local adaptation strategies could provide insights into resilience-building measures for the district. Strengthening these aspects will enhance the accuracy of hazard assessments and ensure that they remain effective tools for disaster planning and risk mitigation.

Figure 9.
(a) Houses flooded in Dubair (August 2022). (b) Flooding in Kandia Tehsil of Upper Kohistan (July 2022). (c) KKH blocked due to landslide in Upper Kohistan. (d) Landslide at Chuchang on Karakoram Highway (August 2019). (e) Landslide in Kaigah, Dasu, Upper Kohistan (July 2023). (f) Landslide and flooding in Pani Bah village on banks of Indus River (July 2023).
5. Conclusions
The growing threat of multi-hazard risks in the Kohistan District, particularly the combined dangers of flooding and landslides, is a pressing concern. The analysis performed in this study demonstrates that these hazards do not occur in isolation; rather, they interact with each other, amplifying their impacts on local communities and infrastructure. This interaction underscores the importance of considering integrated hazard scenarios rather than assessing each hazard separately. By employing machine learning techniques such as the Analytical Hierarchy Process (AHP) alongside a GIS, we identified vulnerable areas within Kohistan and developed hazard maps that are pivotal for informed policy-making and disaster preparedness. The results highlight the urgent need for integrated disaster management strategies that account for both flooding and landslides. Understanding where the risks overlap allows for the better prioritization of resources and interventions, especially in areas with high vulnerabilities. Furthermore, the study stresses the importance of sustainable land-use planning, resilient infrastructure, and adaptive measures to enhance the region’s resilience to these hazards. While natural hazards such as floods and landslides are inevitable, proactive risk management based on integrated hazard assessments like the one presented in this study can help manage the destruction they cause. In response to the validation and implications discussed in this study, the findings reaffirm the alignment of hazard maps with past disaster events, further reinforcing their reliability. By addressing the implications of these hazards for sustainable development, environmental management, and planning policies, this research provides a foundation for future assessments that incorporate real-time data and long-term climate trends. This research serves as a crucial step in fostering collaboration among policy-makers, local authorities, and communities to reduce disaster risks and ensure the long-term sustainability of the Kohistan District.
Author Contributions
Conceptualization, T.S., S.K.M., S.A., M.W., J.T., G.A.P., H.H. and C.S.; methodology, T.S. and S.K.M.; software, T.S. and S.K.M.; validation, M.A.K., T.S., S.K.M., S.A., M.W., M.A.K. and G.A.P.; formal analysis, T.S. and S.K.M.; investigation, T.S., S.K.M., S.A. and G.A.P.; resources, J.T., G.A.P., H.H. and C.S.; data curation, T.S. and S.K.M.; writing—original draft preparation, T.S. and S.K.M.; writing—review and editing, S.A., M.W., J.T., G.A.P., H.H. and C.S.; visualization, T.S. and S.K.M.; supervision, S.A., M.W., J.T. and G.A.P.; project administration, J.T. and G.A.P. All authors have read and agreed to the published version of the manuscript.
Funding
This study is not supported by any external funding.
Institutional Review Board Statement
Not applicable.
Informed Consent Statement
Not applicable.
Data Availability Statement
The datasets generated and analyzed in this study are not publicly available due to privacy considerations. However, they can be provided upon reasonable request.
Acknowledgments
The authors are grateful to ESRI and USGS for providing land-use land cover data and DEM for this research.
Conflicts of Interest
The authors declare no competing interests.
References
- Sukumaran, K. Impact of Human Activities Inducing and Triggering of Natural Disasters. In A System Engineering Approach to Disaster Resilience: Select Proceedings of VCDRR 2021; Springer Nature: Singapore, 2022; pp. 17–31. [Google Scholar] [CrossRef]
- Fiala, O. Natural Disasters in Developing Countries; Springer: Cham, Switzerland, 2017; pp. 5–41. [Google Scholar] [CrossRef]
- Lanlan, J.; Sarker, N.I.; Ali, I.; Firdaus, R.B.R.; Hossin, A. Vulnerability and resilience in the context of natural hazards: A critical conceptual analysis. Environ. Dev. Sustain. 2023, 26, 19069–19092. [Google Scholar] [CrossRef]
- Paron, P. Natural Hazards in Developing Countries. Nat. Hazards 2013, 13, 229–252. [Google Scholar] [CrossRef]
- Hussain, M.A.; Shuai, Z.; Moawwez, M.A.; Umar, T.; Iqbal, M.R.; Kamran, M.; Muneer, M. A Review of Spatial Variations of Multiple Natural Hazards and Risk Management Strategies in Pakistan. Water 2023, 15, 407. [Google Scholar] [CrossRef]
- Banholzer, S.; Kossin, J.P.; Donner, S.D. The Impact of Climate Change on Natural Disasters. In Reducing Disaster: Early Warning Systems for Climate Change; Springer: Dordrecht, The Netherlands, 2014; pp. 21–49. [Google Scholar] [CrossRef]
- Nel, J.L.; Le Maitre, D.C.; Nel, D.C.; Reyers, B.; Archibald, S.; van Wilgen, B.W.; Forsyth, G.G.; Theron, A.K.; O’farrell, P.J.; Kahinda, J.-M.M.; et al. Natural Hazards in a Changing World: A Case for Ecosystem-Based Management. PLoS ONE 2014, 9, e95942. [Google Scholar] [CrossRef]
- Hashmi, H.N.; Siddiqui, Q.T.M.; Ghumman, A.R.; Kamal, M.A.; Mughal, H.U.R. A critical analysis of 2010 floods in Pakistan. Afr. J. Agric. Res. 2012, 7, 1054–1067. [Google Scholar]
- Wang, J.; Li, K.; Hao, L.; Xu, C.; Liu, J.; Qu, Z.; Yan, X.; Sajjad, M.M.; Sun, Y. Disaster mapping and assessment of Pakistan’s 2022 mega-flood based on multi-source data-driven approach. Nat. Hazards 2023, 120, 3447–3466. [Google Scholar] [CrossRef]
- Nanditha, J.S.; Kushwaha, A.P.; Singh, R.; Malik, I.; Solanki, H.; Chuphal, D.S.; Dangar, S.; Mahto, S.S.; Vegad, U.; Mishra, V. The Pakistan Flood of August 2022: Causes and Implications. Earth’s Future 2023, 11, e2022EF003230. [Google Scholar] [CrossRef]
- Ma, Y.; Hu, X.; Chen, Y.; Hu, Z.; Feng, T.; Feng, G. Different Characteristics and Drivers of the Extraordinary Pakistan Rainfall in July and August 2022. Remote Sens. 2023, 15, 2311. [Google Scholar] [CrossRef]
- Cui, L.; Meng, J.; Li, Y.; An, J.; Zou, Z.; Zhong, L.; Mao, Y.; Wu, G. Spatiotemporal Evolution Characteristics of 2022 Pakistan Severe Flood Event Based on Multi-Source Satellite Gravity Observations. Remote Sens. 2024, 16, 1601. [Google Scholar] [CrossRef]
- Harvey, P.; Stoddard, A.; Sida, L.; Timmins, N.; Munir Ahmed, S.; Breckenridge, M.-J.; Jilliani, S. Floods in Pakistan: Rethinking the Humanitarian Role; Humanitarian Outcomes: London, UK, 2022. [Google Scholar]
- Manzoor, Z.; Ehsan, M.; Khan, M.B.; Manzoor, A.; Akhter, M.M.; Sohail, M.T.; Hussain, A.; Shafi, A.; Abu-Alam, T.; Abioui, M. Floods and flood management and its socio-economic impact on Pakistan: A review of the empirical literature. Front. Environ. Sci. 2022, 10, 1021862. [Google Scholar] [CrossRef]
- Chen, H.; Xiong, J.; Cui, P.; Chen, X.; Ge, Y.; Fang, C.; Zhang, B.; Yang, T.; Khan, I. Causes and dynamic change characteristics of the 2022 devastating floods in Pakistan. Nat. Hazards 2024, 120, 9691–9711. [Google Scholar] [CrossRef]
- UN-Habitat. Pakistan Country Report. 2023. Available online: https://unhabitat.org.pk/un-habitat-pakistan-country-report-2023/ (accessed on 1 January 2024).
- Qureshi, J.A.; Khan, G.; Ali, N.; Ali, S.; Rehman, S.U.; Bano, R.; Saeed, S.; Ehsan, M.A. Spatio-temporal Change of Glacier Surging and Glacier-dammed Lake Formation in Karakoram Pakistan. Earth Syst. Environ. 2022, 6, 249–262. [Google Scholar] [CrossRef]
- Gardezi, H.; Bilal, M.; Cheng, Q.; Xing, A.; Zhuang, Y.; Masood, T. A comparative analysis of attabad landslide on january 4, 2010, using two numerical models. Nat. Hazards 2021, 107, 519–538. [Google Scholar] [CrossRef]
- Hayat, T.; Khan, I.; Shah, H.; Qureshi, M.U.; Karamat, S.; Towhata, I. Attabad Landslide-Dam disaster in Pakistan. Bull. Int. Soc. Soil Mech. Geotech. Eng. 2010, 4, 21–31. [Google Scholar]
- Khan, F. Pre and Post Disaster Evaluation: A Case Study of 2010 Floods in Pakistan. 2013, pp. 2–7. Available online: http://www.diva-portal.org/smash/get/diva2:632108/FULLTEXT01.pdf (accessed on 6 April 2025).
- Siddique, M.S.; Schwarz, J. Elaboration of Multi-Hazard Zoning and Qualitative Risk Maps of Pakistan. Earthq. Spectra 2015, 31, 1371–1395. [Google Scholar] [CrossRef]
- Khatakho, R.; Gautam, D.; Aryal, K.R.; Pandey, V.P.; Rupakhety, R.; Lamichhane, S.; Liu, Y.-C.; Abdouli, K.; Talchabhadel, R.; Thapa, B.R.; et al. Multi-Hazard Risk Assessment of Kathmandu Valley, Nepal. Sustainability 2021, 13, 5369. [Google Scholar] [CrossRef]
- Shah, S.K.A.; Khan, G.; Ali, S.; Qureshi, J.A.; Habib, N.; Khan, A. Multi-hazard risk assessment of Qurumbar valley, Ghizer, Gilgit Baltistan, Pakistan. J. Mt. Area Res. 2019, 4, 24–31. [Google Scholar] [CrossRef]
- Khan, M.T.I.; Anwar, S.; Sarkodie, S.A.; Yaseen, M.R.; Nadeem, A.M.; Ali, Q. Natural disasters, resilience-building, and risk: Achieving sustainable cities and human settlements. Nat. Hazards 2023, 118, 611–640. [Google Scholar] [CrossRef]
- Bang, H.N. Sustainable development goals, disaster risk management, and indigenous knowledge: A critical assessment of the interlinkages. Sustain. Earth 2024, 7, 29. [Google Scholar] [CrossRef]
- Mohanty, S.; Acharya, A.A.; Sahu, L.; Mohapatra, S.K. Hazard Identification and detection using machine learning approach. In Proceedings of the 2020 4th International Conference on Intelligent Computing and Control Systems (ICICCS), Madurai, India, 13–15 May 2020; pp. 1239–1244. [Google Scholar]
- Yadollahi, M.; Rosli, M.Z. Development of the Analytical Hierarchy Process (AHP) method for rehabilitation project ranking before disasters. WIT Trans. Built Environ. 2011, 119, 209–220. [Google Scholar] [CrossRef]
- Mokhtari, E.; Mezali, F.; Abdelkebir, B.; Engel, B. Flood risk assessment using analytical hierarchy process: A case study from the Cheliff-Ghrib watershed, Algeria. J. Water Clim. Change. 2023, 14, 694–711. [Google Scholar] [CrossRef]
- Hu, X.; Safety and Resilience Research Unit. Using Analytic Hierarchy Process (AHP) to Conduct a Safety Risk Analysis. Safety and Resilience Research Unit. Available online: https://cde.nus.edu.sg/dbe/2020/08/using-analytic-hierarchy-process-ahp-to-conduct-a-safety-risk-analysis/ (accessed on 5 August 2024).
- Liu, T.; Meidani, H. Graph neural networks for travel distance estimation and route recommendation under probabilistic hazards. Int. J. Transp. Sci. Technol. 2025, in press. [Google Scholar] [CrossRef]
- Liu, T.; Meidani, H. Graph Neural Network Surrogate for Seismic Reliability Analysis of Highway Bridge Systems. J. Infrastruct. Syst. 2024, 30, 05024004. [Google Scholar] [CrossRef]
- Rehman, A.; Song, J.; Haq, F.; Mahmood, S.; Ahamad, M.I.; Basharat, M.; Sajid, M.; Mehmood, M.S. Multi-Hazard Susceptibility Assessment Using the Analytical Hierarchy Process and Frequency Ratio Techniques in the Northwest Himalayas, Pakistan. Remote Sens. 2022, 14, 554. [Google Scholar] [CrossRef]
- Rocchi, A.; Chiozzi, A.; Nale, M.; Nikolic, Z.; Riguzzi, F.; Mantovan, L.; Gilli, A.; Benvenuti, E. A Machine Learning Framework for Multi-Hazard Risk Assessment at the Regional Scale in Earthquake and Flood-Prone Areas. Appl. Sci. 2022, 12, 583. [Google Scholar] [CrossRef]
- Lisa, M.; Khwaja, A.A.; Jan, M.Q.; Yeats, R.S.; Hussain, A.; Khan, S.A. New data on the Indus Kohistan seismic zone and its extension into the Hazara–Kashmir Syntaxis, NW Himalayas of Pakistan. J. Seism. 2009, 13, 339–361. [Google Scholar] [CrossRef]
- DRU–Kohistan. KOHISTAN KOHISTAN Earthquake Reconstruction & Rehabilitation Authority Government of Pakistan Provincial Earthquake Reconstruction & Rehabilitation Agency Government of NWFP. 2007. Available online: https://www.ndma.gov.pk/storage/publications/January2021/seh8cjNqkXWh9qmRlU6K.pdf (accessed on 6 April 2025).
- Sui, H.; Su, T.; Hu, R.; Wang, D.; Zheng, Z. Study on the Risk Assessment Method of Rainfall Landslide. Water 2022, 14, 3678. [Google Scholar] [CrossRef]
- Thakur, V.; Depina, I.; Degago, S.A.; Alene, G.H.; Oguz, E.A.; Singh, M.; Chandel, A. Landslide Mitigation of Urbanized Slopes for Sustainable Growth: A Summary of Recent Developments in Structural and Non-structural Countermeasures to Manage Water-Triggered Landslides. Indian Geotech. J. 2024, 54, 1751–1766. [Google Scholar] [CrossRef]
- Sarda, V.K.; Pandey, D.D. Landslide Susceptibility Mapping Using Information Value Method. 2019. Available online: https://www.researchgate.net/publication/332320566 (accessed on 2 February 2024).
- Meten, M.; PrakashBhandary, N.; Yatabe, R. Effect of Landslide Factor Combinations on the Prediction Accuracy of Landslide Susceptibility Maps in the Blue Nile Gorge of Central Ethiopia. Geoenviron. Disasters 2015, 2, 9. [Google Scholar] [CrossRef]
- Quevedo, R.P.; Velastegui-Montoya, A.; Montalván-Burbano, N.; Morante-Carballo, F.; Korup, O.; Rennó, C.D. Land use and land cover as a conditioning factor in landslide susceptibility: A literature review. Landslides 2023, 20, 967–982. [Google Scholar] [CrossRef]
- Borrelli, P.; Robinson, D.A.; Panagos, P.; Lugato, E.; Yang, J.E.; Alewell, C.; Wuepper, D.; Montanarella, L.; Ballabio, C. Land use and climate change impacts on global soil erosion by water (2015–2070). Proc. Natl. Acad. Sci. USA 2020, 117, 21994–22001. [Google Scholar] [CrossRef] [PubMed]
- Alemu, W.; Belachew, L.D. Flood hazard and risk assessment using GIS and remote sensing in Fogera Woreda, Northwest Ethiopia. In Proceedings of the 3rd International Conference on Water Resources and Arid Environments, Valparaíso, Chile, 13–16 December 2011; pp. 1–7. [Google Scholar] [CrossRef]
- Saleem, N.; Huq, M.E.; Twumasi, N.Y.D.; Javed, A.; Sajjad, A. Parameters Derived from and/or Used with Digital Elevation Models (DEMs) for Landslide Susceptibility Mapping and Landslide Risk Assessment: A Review. ISPRS Int. J. Geo Inf. 2019, 8, 545. [Google Scholar] [CrossRef]
- Deepak, S.; Rajan, G.; Jairaj, P.G. Geospatial approach for assessment of vulnerability to flood in local self governments. Geoenviron. Disasters 2020, 7, 35. [Google Scholar] [CrossRef]
- Ridolfi, E.; Mondino, E.; Di Baldassarre, G. Hydrological risk: Modeling flood memory and human proximity to rivers. Hydrol. Res. 2021, 52, 241–252. [Google Scholar] [CrossRef]
- Wu, C.; Qiao, J. Relationship between landslides and lithology in the Three Gorges Reservoir area based on GIS and information value model. Front. For. China 2009, 4, 165–170. [Google Scholar] [CrossRef]
- Ali, U.; Ali, S.A. Investigation of Drainage for Structures, Lithology and Priority (Flood and Landslide) Assessment Using Geospatial Technology, J&K, NW Himalaya. In Hydrologic Modeling: Select Proceedings of ICWEES-2016; Springer: Singapore, 2018; pp. 135–160. [Google Scholar] [CrossRef]
- Crosta, G.B.; Frattini, P. Rainfall-induced landslides and debris flows. Hydrol. Process. 2008, 22, 473–477. [Google Scholar] [CrossRef]
- Guan, S.; Shi, Z.; Zheng, H.; Shen, D.; Hanley, K.J.; Yang, J.; Xia, C. Effects of soil properties and geomorphic parameters on the breach mechanisms of landslide dams and prediction of peak discharge. Acta Geotech. 2023, 18, 5485–5502. [Google Scholar] [CrossRef]
- Zhang, Y.; Miao, C.; Zhu, J.; Gao, T.; Sun, Y.; Zhang, J.; Xu, S.; Yang, K. The impact of landslides on chemical and microbial properties of soil in a temperate secondary forest ecosystem. J. For. Res. 2022, 33, 1913–1923. [Google Scholar] [CrossRef]
- Sidle, R.C.; Pearce, A.J.; O’Loughlin, C.L. Hillslope Stability and Land Use. Water Resources Monograph Series no. 11. viii + 140 pp. Washington: American Geophysical Union. Price US $16.00 (30% discount for AGU members). ISBN 0 87590 315 0 (hard covers). Geol. Mag. 1986, 123, 716. [Google Scholar] [CrossRef]
- Huang, S.; Tang, L.; Hupy, J.P.; Wang, Y.; Shao, G.F. A commentary review on the use of normalized difference vegetation index (NDVI) in the era of popular remote sensing. J. For. Res. 2021, 32, 1–6. [Google Scholar] [CrossRef]
- Niraj, K.C.; Singh, A.; Shukla, D.P. Effect of the Normalized Difference Vegetation Index (NDVI) on GIS-Enabled Bivariate and Multivariate Statistical Models for Landslide Susceptibility Mapping. J. Indian Soc. Remote Sens. 2023, 51, 1739–1756. [Google Scholar] [CrossRef]
- Ullah, Y.; Shafique, M.; Yu, L.; Shah, N.A. Landslides hazard, vulnerability and risk mapping in the data-poor region of northern Pakistan. Environ. Earth Sci. 2024, 83, 1–20. [Google Scholar] [CrossRef]
- Maragaño-Carmona, G.; Toribio, I.J.F.; Descote, P.-Y.; Robledo, L.F.; Villalobos, D.; Gatica, G. Rainfall-Induced Landslide Assessment under Different Precipitation Thresholds Using Remote Sensing Data: A Central Andes Case. Water 2023, 15, 2514. [Google Scholar] [CrossRef]
- Amarasinghe, M.P.; Kulathilaka, S.A.S.; Robert, D.J.; Zhou, A.; Jayathissa, H.A.G. Risk assessment and management of rainfall-induced landslides in tropical regions: A review. Nat. Hazards 2024, 120, 2179–2231. [Google Scholar] [CrossRef]
- Iverson, R.M. Landslide triggering by rain infiltration. Water Resour. Res. 2000, 36, 1897–1910. [Google Scholar] [CrossRef]
- Uitto, J.I. The geography of disaster vulnerability in megacities. Appl. Geogr. 1998, 18, 7–16. [Google Scholar] [CrossRef]
- Moazzam, M.F.U.; Vansarochana, A.; Boonyanuphap, J.; Choosumrong, S.; Rahman, G.; Djueyep, G.P. Spatio-statistical comparative approaches for landslide susceptibility modeling: Case of Mae Phun, Uttaradit Province, Thailand. SN Appl. Sci. 2020, 2, 384. [Google Scholar] [CrossRef]
- Beven, K.J.; Kirkby, M.J. A physically based, variable contributing area model of basin hydrology. Hydrol. Sci. J. 1979, 24, 43–69. [Google Scholar] [CrossRef]
- Pourali, S.H.; Arrowsmith, C.; Chrisman, N.; Matkan, A.A.; Mitchell, D. Topography Wetness Index Application in Flood-Risk-Based Land Use Planning. Appl. Spat. Anal. Policy 2016, 9, 39–54. [Google Scholar] [CrossRef]
- Basharat, M.; Riaz, M.T.; Jan, M.Q.; Xu, C.; Riaz, S. A review of landslides related to the 2005 Kashmir Earthquake: Implication and future challenges. Nat. Hazards 2021, 108, 1–30. [Google Scholar] [CrossRef]
- Khattak, G.A.; Owen, L.A.; Kamp, U.; Harp, E.L. Evolution of earthquake-triggered landslides in the Kashmir Himalaya, northern Pakistan. Geomorphology 2010, 115, 102–108. [Google Scholar] [CrossRef]
- Saaty, R.W. The analytic hierarchy process—What it is and how it is used. Math. Model. 1987, 9, 161–176. [Google Scholar] [CrossRef]
- Danumah, J.H.; Odai, S.N.; Saley, B.M.; Szarzynski, J.; Thiel, M.; Kwaku, A.; Kouame, F.K.; Akpa, L.Y. Flood risk assessment and mapping in Abidjan district using multi-criteria analysis (AHP) model and geoinformation techniques, (cote d’ivoire). Geoenviron. Disasters 2016, 3, 1. [Google Scholar] [CrossRef]
- Dawn. Passengers Stranded as Sections of Karakoram Highway Blocked Due to Landslide. July 2023. Available online: https://www.dawn.com/news/1766576 (accessed on 25 January 2025).
- The Friday Times. How the Devastating 2022 Flood Still Impacts Lower Kohistan. February 2023. Available online: https://thefridaytimes.com/16-Feb-2023/how-the-devastating-2022-flood-still-impacts-lower-kohistan (accessed on 25 January 2025).
- Dawn. Flood Damages Houses, Roads, Crops in Kohistan. March 2023. Available online: https://www.dawn.com/news/1740232 (accessed on 25 January 2025).
- The Nation. KKH Closed Due to Landslide in Upper Kohistan. February 2024. Available online: https://www.nation.com.pk/23-Feb-2024/kkh-closed-due-to-landslide-in-upper-kohistan (accessed on 25 January 2025).
- Dawn. Landslide Kills Three People in Upper Kohistan. September 2024. Available online: https://www.dawn.com/news/1856564 (accessed on 25 January 2025).


Disclaimer/Publisher’s Note: The statements, opinions and data contained in all publications are solely those of the individual author(s) and contributor(s) and not of MDPI and/or the editor(s). MDPI and/or the editor(s) disclaim responsibility for any injury to people or property resulting from any ideas, methods, instructions or products referred to in the content. |
© 2025 by the authors. Licensee MDPI, Basel, Switzerland. This article is an open access article distributed under the terms and conditions of the Creative Commons Attribution (CC BY) license (https://creativecommons.org/licenses/by/4.0/).