

Empowered or Negative? Research on the Impact of Industrial Agglomeration on the Development of Agricultural New Quality Productive Forces: Evidence from Shandong Province, China

Abstract
1. Introduction
2. Research Hypotheses and Model Construction
2.1. Research Hypotheses
2.2. Model Construction
2.2.1. Entropy Value Method Model
2.2.2. Spatial Autocorrelation Test Model
2.2.3. Spatial Econometric Model
3. Empirical Analysis
3.1. Data Sources
3.2. Analysis of Spatiotemporal Evolution Characteristics
3.2.1. Analysis of the Temporal and Spatial Evolution Characteristics of Agricultural Industrial Agglomeration in Shandong Province
3.2.2. Analysis of the Spatiotemporal Evolution Characteristics of the New Quality Productive Forces in Shandong Province
3.3. Analysis of the Impact of Industrial Agglomeration in the Agricultural Sector of Shandong Province on Agricultural New Quality Productive Forces
3.3.1. Spatial Autocorrelation Test
3.3.2. Spatial Durbin Model Test
3.3.3. Benchmark Regression Analysis
3.3.4. Spatial Effect Decomposition
3.3.5. Robustness Test
3.3.6. Regional Heterogeneity Analysis
4. Discussion and Conclusions
- (1)
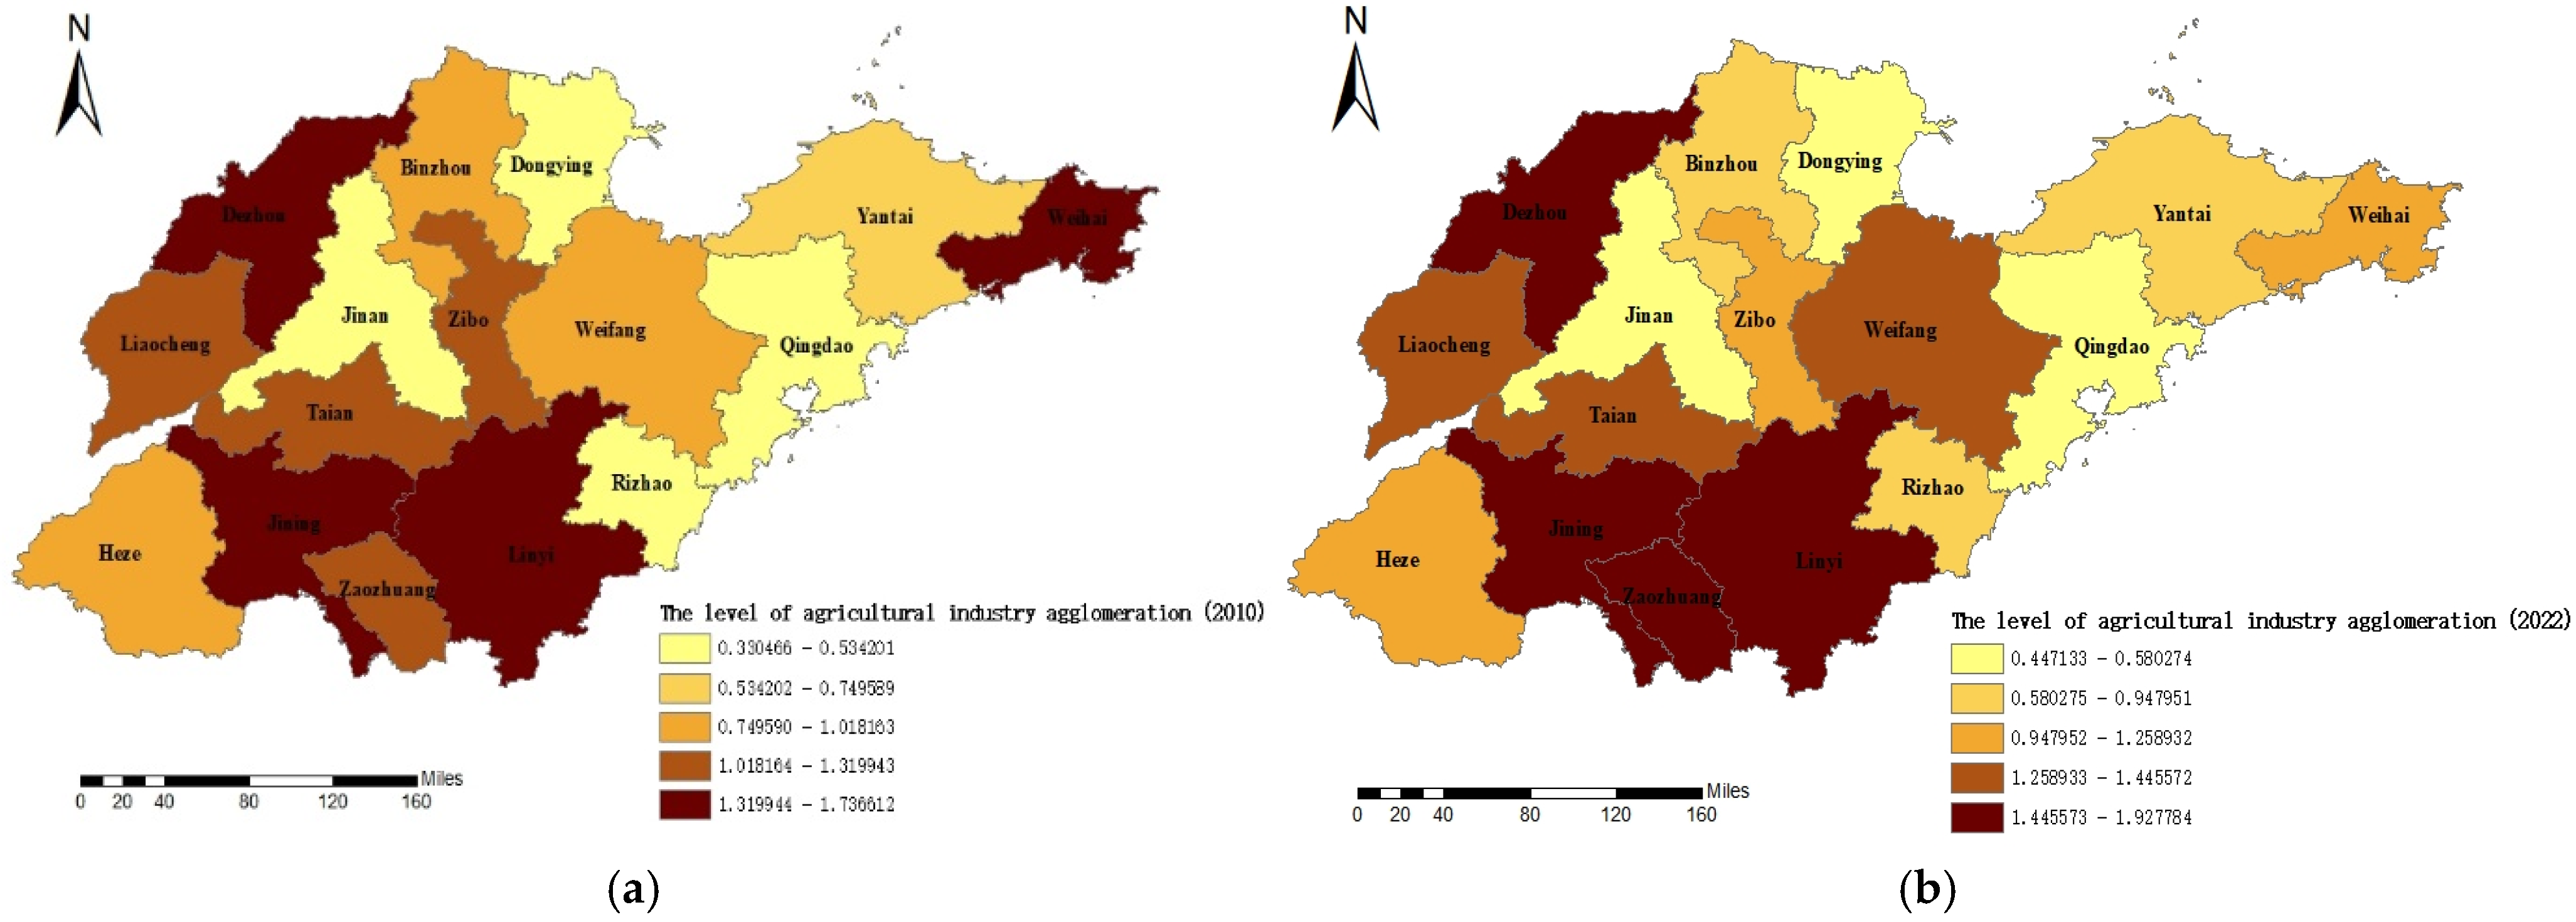
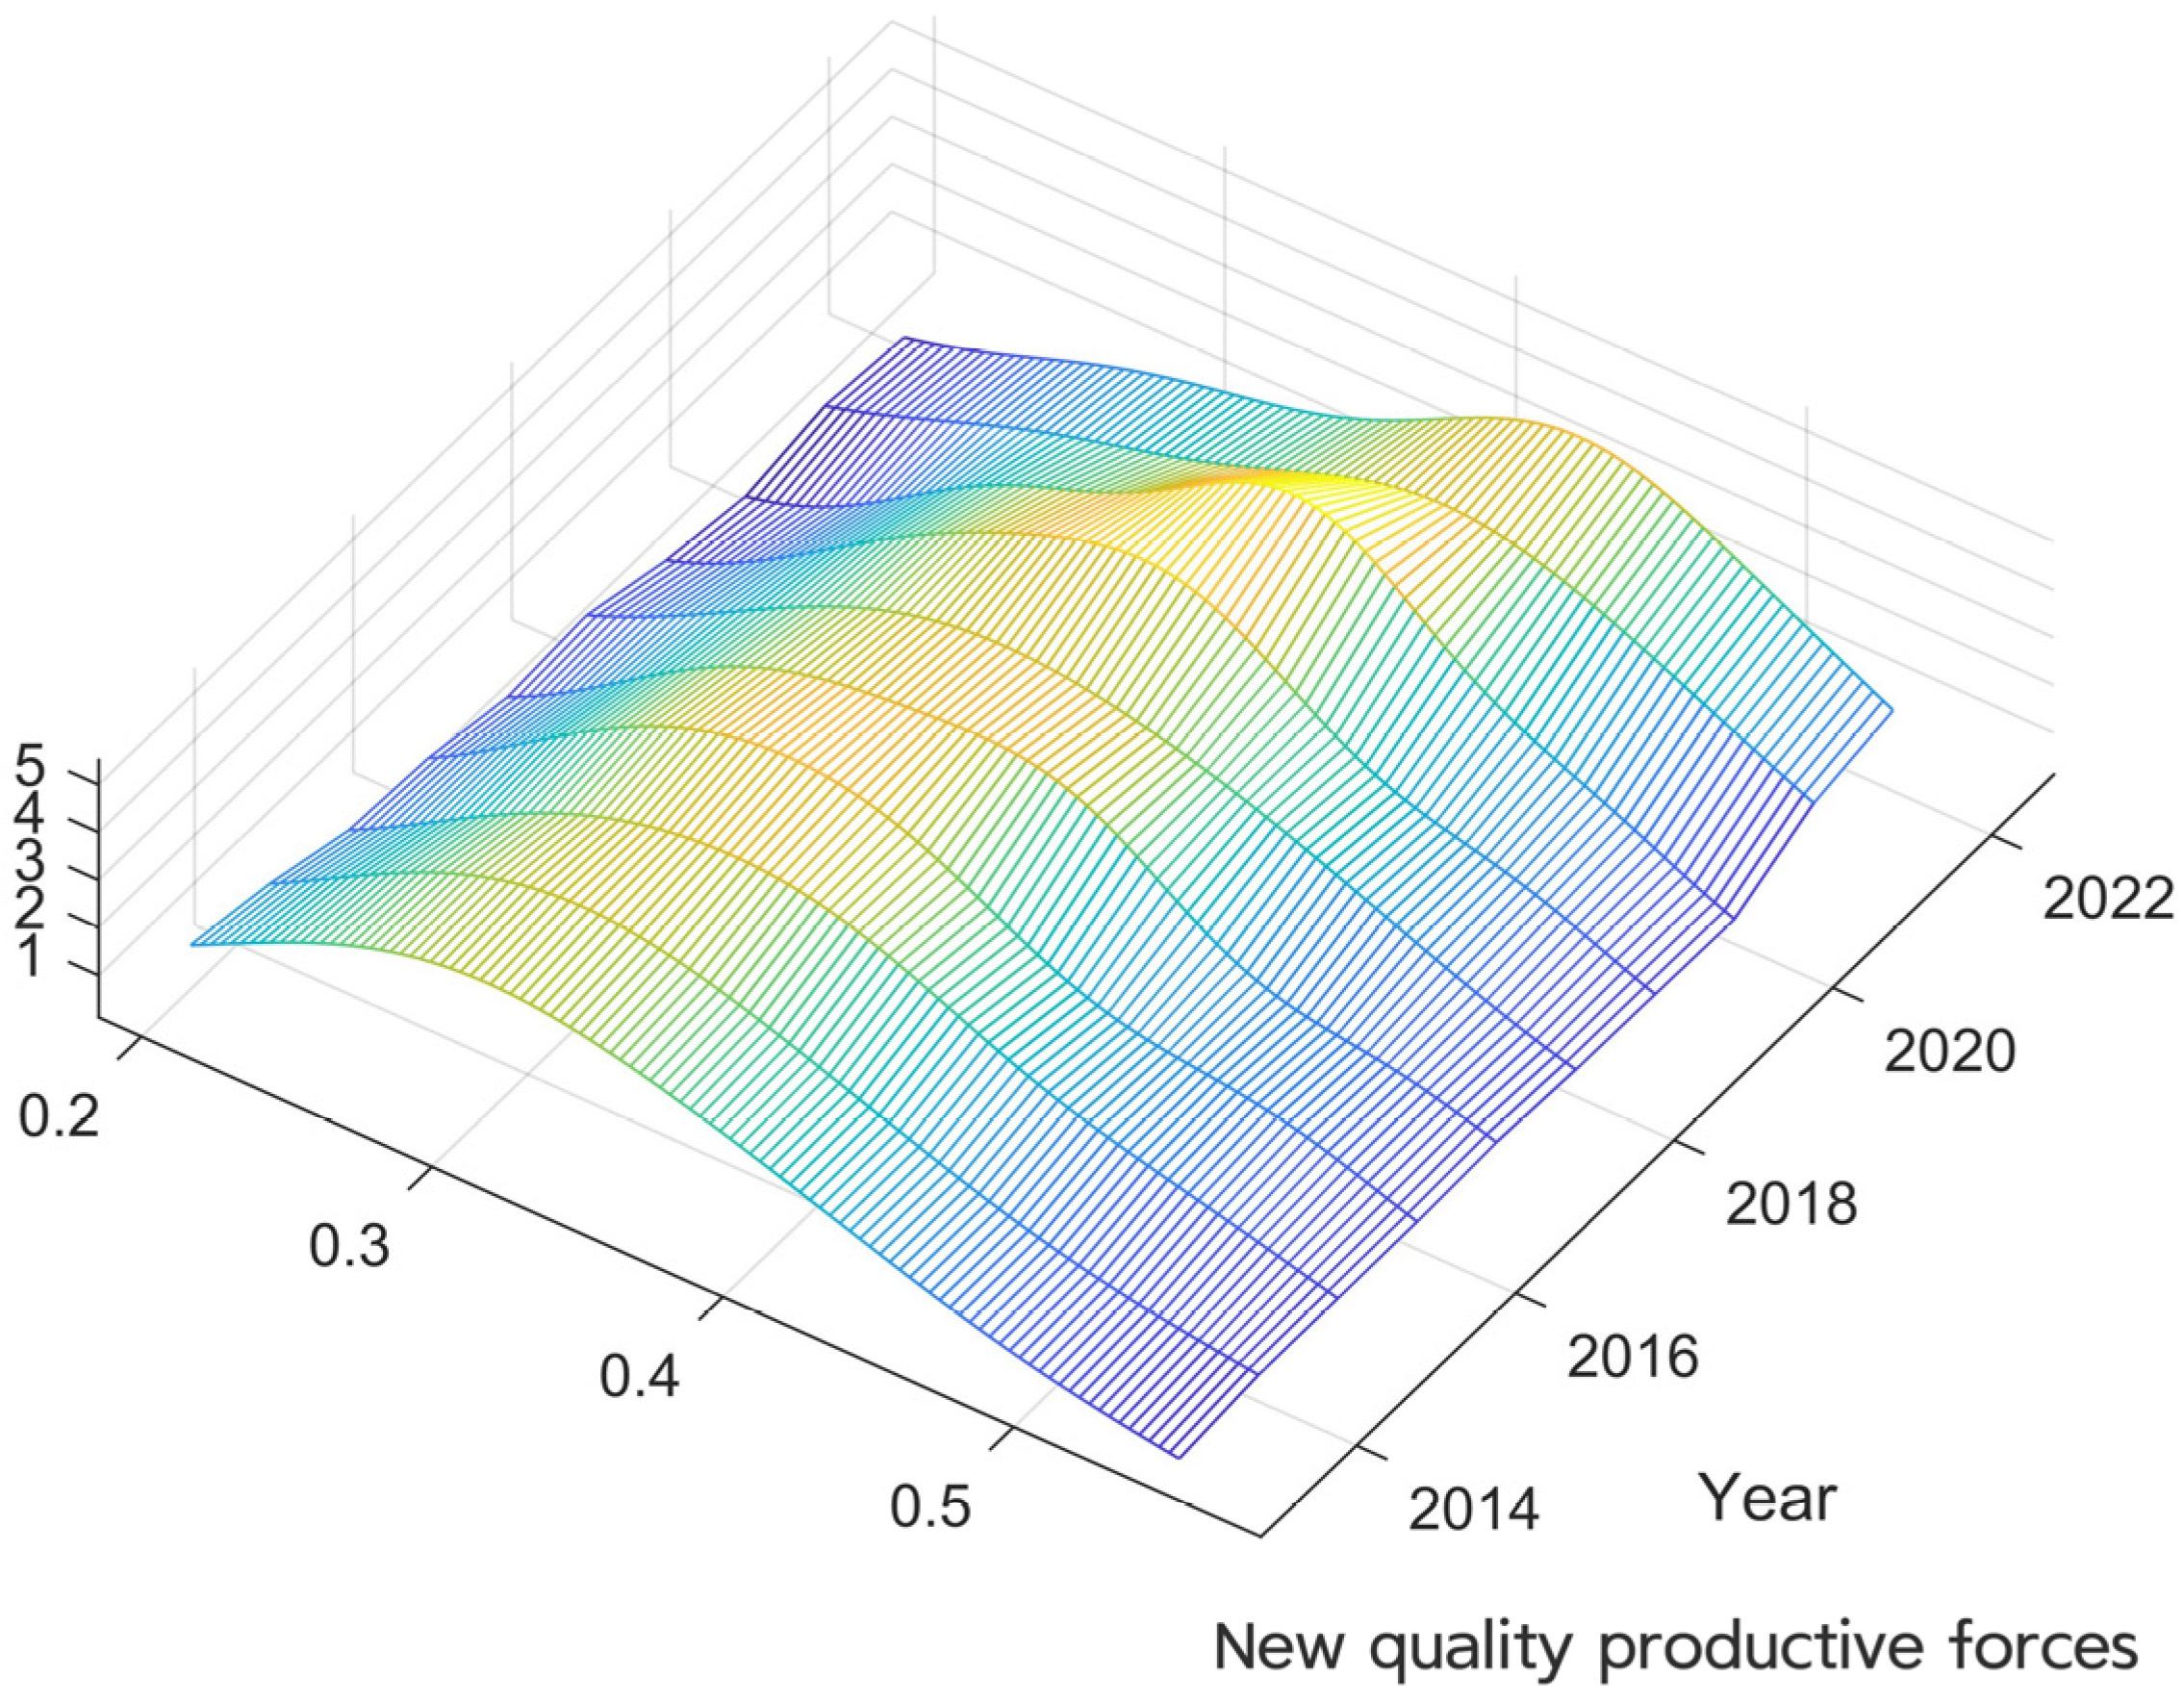
- By plotting the three-dimensional kernel density estimation over the sample period, this paper finds that agricultural industrial agglomeration shows a dynamic evolutionary trend of a slight decline in the overall level and a narrowing of the gap between prefecture-level cities. Agricultural new quality productive forces show a dynamic evolutionary trend of a continuous increase in the overall level and a narrowing of the gap between prefecture-level cities. Subsequently, this paper visually analyzed and studied the levels of agricultural industrial agglomeration and agricultural new quality productive forces in 2010 and 2022. It is found that the level of agricultural industrial agglomeration in Shandong Province showed a spatial pattern of “high in the south and low in the north”. The level of agricultural new quality productive forces showed a spatial pattern of “high in the north and low in the south”.
- (2)
- The global Moran’s index test showed that the Moran’s index values of agricultural industrial agglomeration and agricultural new quality productive forces were significantly positive from 2013 to 2022 and from 2011 to 2022, respectively, which confirms that the two are spatially correlated. The local Moran’s index further showed that the agricultural industrial agglomeration and agricultural new quality productive forces in 2010, 2014, 2018, and 2022 showed spatial clustering characteristics. Secondly, the regression result of the SDM showed that the regression coefficient of agricultural industrial agglomeration on agricultural new quality productive forces was −0.775, which indicates that excessive agglomeration will have an inhibitory effect. In addition, after decomposing the model effects, it was found that the direct and indirect effects of agricultural industrial agglomeration were negative. The direct and indirect effects of population density were positive. The indirect effects of industrial structure and urbanization were significantly negative. And government intervention had no significant effect. Finally, the paper also conducts robustness tests to strengthen the credibility of the conclusions.
- (3)
- In different economic zones, the impact effects of agricultural industry agglomeration are different. In the eastern economic belt, both the direct and indirect effects are significantly negative, indicating that agricultural industrial agglomeration inhibited the development process of agricultural new quality productive forces in the region and neighboring areas. In the central economic belt, both its direct and indirect effects show significant positive effects. This suggests that agricultural industrial agglomeration in the region promotes the development of agricultural new quality productive forces. However, in the western economic belt, which has the highest degree of agglomeration, the direct effect is significantly negative, suggesting that local agricultural industrial agglomeration can have a negative effect. And the indirect effect is not significant. Thus, it can be seen that agricultural industrial agglomeration can have positive or negative effects in different regions, i.e., its impact is nonlinear.
5. Policy Recommendations and Research Outlook
Author Contributions
Funding
Institutional Review Board Statement
Informed Consent Statement
Data Availability Statement
Conflicts of Interest
References
- Xu, Y.; Chen, X.; Lu, X.; Pan, Y.; Huang, X. Climate-smart agriculture under the SDGs: Conceptual discernment, basic issues and insights from Chinese practice. Geogr. Res. 2023, 42, 2018–2035. [Google Scholar]
- Jin, S.; Zhang, J.; Gu, B. China from the world’s perspective: Effectiveness, gaps and prospects for the implementation of the United Nations Sustainable Development Goals. China Popul. Resour. Environ. 2023, 33, 1–10. [Google Scholar]
- Yuan, Y. The Elemental Guarantee and Implementation Path for Empowering Rural Revitalization with New quality productive forces. Soc. Sci. 2024, 39, 116–122. [Google Scholar]
- Leal Filho, W.; Vidal, D.G.; Chen, C.; Petrova, M.; Dinis, M.A.P.; Yang, P.; Rogers, S.; Álvarez-Castañón, L.; Djekic, I.; Sharifi, A.; et al. An assessment of requirements in investments, new technologies, and infrastructures to achieve the SDGs. Environ. Sci. Eur. 2022, 34, 58. [Google Scholar]
- Wei, J. The Logical Basis, Mechanism of Action, and Promotion Direction for Empowering Agricultural Power Construction with New quality productive forces. Contemp. Econ. Manag. 2025, 47, 53–60. [Google Scholar]
- Wang, H.; Liu, C.; Xiong, L.; Wang, F. The spatial spillover effect and impact paths of agricultural agricultural industry agglomeration non-point source pollution: A case study in the Yangtze River Delta, China. J. Clean. Prod. 2023, 401, 136600. [Google Scholar]
- Lv, C.; Zhou, Y. An empirical study on agricultural industrial agglomeration and agricultural economic growth in China—Based on the examination and analysis of the vegetable industry. J. Nanjing Agric. Univ. Soc. Sci. Ed. 2011, 11, 72–78. [Google Scholar]
- Wang, Y.; Liu, Y. Research on the impact effect of agricultural industrial agglomeration on farmers’ income. J. Agrotech. Econ. 2011, 30, 50–57. [Google Scholar]
- Yang, L. Discussion on the Impact of Agricultural Industrial Agglomeration on Farmers’ Income. Hubei Agric. Sci. 2013, 52, 2708–2712, 2716. [Google Scholar]
- Ding, Y. The impact of agricultural industrial agglomeration on farmers’ income: An influence mechanism test based on a spatial panel model. PLoS ONE 2023, 18, e0291188. [Google Scholar]
- Xu, C.; Xue, L. Agricultural Industrial Agglomeration and Agricultural Non-Point Source Pollution—Based on the Perspective of Spatial Heterogeneity. Financ. Econ. 2019, 63, 82–96. [Google Scholar]
- Li, H.; Wang, X.; Zhao, D. Does Agricultural Co-Agglomeration Help Reduce Livestock and Poultry Pollution? From the Perspective of Planting and Breeding Combination in China. Heliyon 2023, 9, e17821. [Google Scholar] [PubMed]
- Zhang, H.; Zhang, J.; Song, J. Analysis of the threshold effect of agricultural industrial agglomeration and industrial structure upgrading on sustainable agricultural development in China. J. Clean. Prod. 2022, 341, 130818. [Google Scholar]
- Yu, Y.; Lin, Z.; Liu, D.; Hou, Y. Exploring the spatially heterogeneous impacts of industrial agglomeration on regional sustainable development capability: Evidence from new energy industries. Environ. Dev. Sustain. 2024, 26, 16657–16682. [Google Scholar]
- Xu, Y.; Wang, R.; Zhang, S. Digital Economy, Green Innovation Efficiency, and New Quality Productive Forces: Empirical Evidence from Chinese Provincial Panel Data. Sustainability 2025, 17, 633. [Google Scholar] [CrossRef]
- Chang, X. Accelerating the Formation of New Quality Agricultural Productive Forces: Theoretical Framework, Realistic Dilemmas, and Practical Approaches. Econ. Probl. 2024, 46, 20–28. [Google Scholar]
- Zhu, D.; Ye, L. New quality productive forces in Chinese Agriculture: Level Measurement and Dynamic Evolution. Stat. Decis. 2024, 40, 24–30. [Google Scholar]
- Huang, Q.; Guo, W.; Wang, Y. A Study of the Impact of New Quality Productive Forces on Agricultural Modernization: Empirical Evidence from China. Agriculture 2024, 14, 1935. [Google Scholar] [CrossRef]
- Lin, L.; Gu, T.; Shi, Y. The influence of new quality productive forces on high-quality agricultural development in China: Mechanisms and empirical testing. Agriculture 2024, 14, 1022. [Google Scholar] [CrossRef]
- Wang, Q.; Chen, X. Can new quality productive forces promote inclusive green growth: Evidence from China. Front. Environ. Sci. 2024, 12, 1499756. [Google Scholar]
- Xu, S.; Wang, J.; Peng, Z. Study on the Promotional Effect and Mechanism of New Quality Productive Forces on Green Development. Sustainability 2024, 16, 8818. [Google Scholar] [CrossRef]
- Wang, X.; Zhou, W.; Zhou, F. The Effect of Agricultural Industrial Agglomeration on the Efficiency of Agricultural Green Development: Empirical Evidence from China. Pol. J. Environ. Stud. 2023, 32, 5825–5836. [Google Scholar] [CrossRef]
- Yao, R.; Ma, Z.; Wu, H.; Xie, Y. Mechanism and measurement of the effects of industrial agglomeration on agricultural economic resilience. Agriculture 2024, 14, 337. [Google Scholar] [CrossRef]
- Dong, Y.; Qi, C.; Gu, Y.; Gui, C.; Fang, G. Citrus Industrial agglomeration and Citrus Green Total Factor Productivity in China: An Empirical Analysis Utilizing a Dynamic Spatial Durbin Model. Agriculture 2024, 14, 2059. [Google Scholar] [CrossRef]
- Wang, J.; Long, F. Grain industrial agglomeration and grain green total factor productivity in China: A dynamic spatial Durbin econometric analysis. Heliyon 2024, 10, e26761. [Google Scholar] [CrossRef]
- Hua, C.; Miao, J.; Liu, W.; Du, G.; Wang, X. The impact mechanism of industrial agglomeration on energy efficiency-Evidence from the producer service industry in China. Energy Sources Part B Econ. Plan. Policy 2021, 16, 740–758. [Google Scholar] [CrossRef]
- Pan, K.; Liu, R.; Chen, X.; Huang, Y. How Does Industrial Agglomeration Affect Exports? Evidence from Chinese Province-Industry Panel Data. Sustainability 2023, 15, 9902. [Google Scholar] [CrossRef]
- Zeng, Q.; Fan, B.; Wang, F. Spatial and Temporal Evolution of the Coupling of Industrial Agglomeration and Carbon Emission Efficiency—Evidence from China’s Animal Husbandry Industry. Sustainability 2024, 16, 10291. [Google Scholar] [CrossRef]
- Wang, S.; Xu, Y.; Wang, L.; Lv, J. A study on the impact of agricultural industry agglomeration on the resilience of agricultural industry--Based on the dual perspectives of horizontal agglomeration and vertical agglomeration. Econ. Surv. 2024, 41, 71–82. [Google Scholar]
- Wu, J.; Ge, Z.; Han, S.; Xing, L.; Zhu, M.; Zhang, J.; Liu, J. Impacts of agricultural industrial agglomeration on China’s agricultural energy efficiency: A spatial econometrics analysis. J. Clean. Prod. 2020, 260, 121011. [Google Scholar] [CrossRef]
- Wang, X.; Wang, Q. Research on the impact of industrial collaborative agglomeration on regional economic growth—Based on the perspectives of scale effect and congestion effect. Econ. Rev. 2023, 34, 43–58. [Google Scholar]
- Wang, Y.; Gao, Q. The impact of digital economy industrial agglomeration on green technology innovation—Based on the analysis of the moderating effect of environmental regulation. J. Technol. Econ. 2023, 42, 20–30. [Google Scholar]
- Lu, H.; Li, Q.; Liu, B.; Chi, Z.; Ye, Y. Research on the dynamic changes of China’s agro-processing industrial agglomeration and spatial impact of production factors on agglomeration. PLoS ONE 2023, 18, e0292870. [Google Scholar]
- Li, C.; Liu, Q.; Li, Q.; Wang, H. Does innovative industrial agglomeration promote environmentally-friendly development? Evidence from Chinese prefecture-level cities. Sustainability 2022, 14, 13571. [Google Scholar] [CrossRef]
- Cerina, F.; Mureddu, F. Is agglomeration really good for growth? Global efficiency, interregional equity and uneven growth. J. Urban Econ. 2014, 84, 9–22. [Google Scholar]
- Bao, J.; Li, Y. Has high-tech cluster improved regional innovation capacity? Evidence from Wuhan metropolitan area in China. Front. Environ. Sci. 2023, 11, 1180781. [Google Scholar]
- Jiang, H.; Chen, Z.; Zhao, W.; Wang, F.; Xia, J.; Chen, Z. Toward carbon neutrality: The impact of manufacturing agglomeration on total factor energy efficiency. Front. Environ. Sci. 2023, 11, 1132294. [Google Scholar] [CrossRef]
- Zhou, X.; Li, X. Analysis of the spatial heterogeneity of green agricultural production levels: Based on empirical data from Shandong Province from 2010 to 2019. Rev. Econ. Manag. 2021, 37, 152–164. [Google Scholar]
- Wang, W.; Xu, X. Thoughts on the Regional Division of Shandong’s Economy. East China Econ. Manag. 2001, 16, 9–10. [Google Scholar]
- Guo, H.; Yao, H.; Yang, L.; Sun, X.; Yang, P.; Wang, Y.; Zhang, W. Research on the Agricultural Functional Zoning of Shandong Province. Chin. J. Agric. Resour. Reg. Plan. 2010, 31, 81–86. [Google Scholar]
- Guo, H.; Gai, L. Evaluation of green and low-carbon transformation of agriculture in Shandong Province and analysis of driving factors. Chin. J. Eco-Agric. 2024, 32, 240–251. [Google Scholar]
- You, L.; Tian, X. Agricultural new quality productive forces: Realistic Logic, Connotation Analysis, and Generation Mechanism. Econ. Probl. 2024, 46, 27–35. [Google Scholar]
- Jiang, Y.; Qiao, Z. Construction of Evaluation Index System for New quality productive forces Development. Reform Econ. Syst. 2024, 42, 5–15. [Google Scholar]
- Cao, D.; Cai, Y. Research on the Construction of New Quality Productive Forces Indicator System. Teach. Res. 2024, 72, 50–62. [Google Scholar]
- Zhang, Z.; Li, J.; Tang, N. Measurement of the Development Level of New Quality Productive Forces in China and Its Spatiotemporal Evolution. Stat. Decis. 2024, 40, 18–23. [Google Scholar]
- Qin, S.; Han, Z.; Chen, H.; Wang, H.; Guo, C. High-quality Development of Chinese Agriculture under Factor Misallocation. Int. J. Environ. Res. Public Health 2022, 19, 9804. [Google Scholar] [CrossRef]
- Leng, Y.; Liu, X.; Wang, X. Environmental regulation and high-quality agricultural development. PLoS ONE 2023, 18, e0285687. [Google Scholar]
- Li, S.; Ai, J.; Yuan, W.; Zhu, S. Agricultural industrial agglomeration and carbon footprint of farmland ecosystems: Mechanisms of influence and spatial spillover effects. World Surv. Res. 2023, 31, 25–34. [Google Scholar]
- Li, C.; Wu, K.; Gao, X. Manufacturing industrial agglomeration and spatial clustering: Evidence from Hebei Province, China. Environ. Dev. Sustain. 2020, 22, 2941–2965. [Google Scholar]
- Ma, F.; Fu, R. Research on the impact of agricultural industrial agglomeration on high-quality agricultural development in Heilongjiang Province. Agric. Econ. 2024, 41, 26–28. [Google Scholar]
- Yin, X.; Jia, X.; Li, D. The impact of agricultural agricultural industry agglomeration green total factor productivity: Based on the perspective of spatial spillover effects. Chin. J. Agric. Resour. Reg. Plan. 2022, 43, 110–119. [Google Scholar]
- Huang, D.; Zhu, Y.; Yu, Q. Spatial spillover effects of agricultural agglomeration on agricultural non-point source pollution in the Yangtze River Basin. Sustainability 2022, 14, 16390. [Google Scholar] [CrossRef]
- Xu, P.; Jin, Z.; Tang, H. Influence paths and spillover effects of agricultural agglomeration on agricultural green development. Sustainability 2022, 14, 6185. [Google Scholar] [CrossRef]
- Liu, J.; Feng, X.; Liu, J.; Yamaka, W. Digital Economy and Industrial Structure Transformation: Mechanisms for High-Quality Development in China’s Agriculture and Rural Areas. Agriculture 2024, 14, 1769. [Google Scholar] [CrossRef]
- Liu, S.; Wu, P. The impact of high-tech industrial agglomeration on China’s green innovation efficiency: A spatial econometric analysis. Front. Environ. Sci. 2023, 11, 1167918. [Google Scholar]
- Hao, H.; Liu, C.; Xin, L. Measurement and Dynamic Trend Research on the Development Level of Rural Industry Integration in China. Agriculture 2023, 13, 2245. [Google Scholar] [CrossRef]
- Sun, H.; Li, E.; Zhang, S.; Cai, J. The spatiotemporal pattern and influencing factors of agricultural industrial agglomeration in Henan Province. J. Henan Univ. Nat. Sci. 2024, 54, 404–418. [Google Scholar]
- Liu, W.; Yang, X.; Zhang, J.; Wu, X.; Wan, L. The spatiotemporal evolution of the effect of industrial agglomeration on industrial green economic efficiency: Empirical evidence from pollution-intensive industries in China. Environ. Dev. Sustain. 2024, 26, 9945–9972. [Google Scholar]
- Zhao, X.; Xiong, C. Spatial and temporal characteristics, evolution law and improvement path of China’s animal husbandry production pattern. Sustainability 2022, 14, 15794. [Google Scholar] [CrossRef]
- Li, J.; Tan, Q.; Bai, J. Spatial Measurement Analysis of Regional Innovation Production in China—An Empirical Study Based on Static and Dynamic Spatial Panel Models. J. Manag. World 2010, 26, 43–55, 65. [Google Scholar]
- Yang, F. Impact of agricultural modernization on agricultural carbon emissions in China: A study based on the spatial spillover effect. Environ. Sci. Pollut. Res. 2023, 30, 91300–91314. [Google Scholar] [CrossRef] [PubMed]
- Han, H.; Yang, D. Research on the Spatial Spillover Effect of Agricultural Industrial Agglomeration on the Growth of Agricultural Green Total Factor Productivity. J. Arid Land Resour. Environ. 2023, 37, 29–37. [Google Scholar]
- LeSage, J.; Pace, K.R. Introduction to spatial econometrics; Taylor & Francis: Boca Raton, FL, USA; CRC Press: Boca Raton, FL, USA, 2010. [Google Scholar]
- Lee, L.; Yu, J. Estimation of spatial autoregressive panel data models with fixed effects. J. Econom. 2010, 154, 165–185. [Google Scholar] [CrossRef]
- Yang, W.; Feng, L.; Wang, Z.; Fan, X. Carbon emissions and national sustainable development goals coupling coordination degree study from a global perspective: Characteristics, heterogeneity, and spatial effects. Sustainability 2023, 15, 9070. [Google Scholar] [CrossRef]


| Criteria Layer | Primary Indicator | Secondary Indicator | Measurement Method | Attribute |
|---|---|---|---|---|
| New Quality Agriculture Workers | Quality of workers | Education level | Education expenditure in the local general public budget expenditure | Positive |
| Number of higher education talents | Number of students in regular higher education institutions | Positive | ||
| Labor productivity | Per capita output of the primary industry | Output of the primary industry/number of employees in the primary industry | Positive | |
| Per capita income of rural residents | Per capita disposable income of rural residents | Positive | ||
| Employment concept of workers | Rural employment rate | Rural workforce/rural population | Positive | |
| New Quality Agriculture Labor Objects | Ecological environment | Green environmental protection | Greening coverage rate Energy-saving and environmental protection fiscal expenditure/government public fiscal expenditure | Positive Positive |
| Green development | Pure fertilizer consumption per unit area/crop total sown area Pesticide application per unit area/crop total sown area | Negative Negative | ||
| New quality industry | Innovation status | Number of patents obtained by research institutions | Positive | |
| Level of mechanization in agricultural operations | Comprehensive mechanization level of major crops’ planting and harvesting | Positive | ||
| New Quality Agriculture Labor Materials | Tangible labor materials | Intelligent agricultural machinery | Rural electricity consumption/total agricultural, forestry, animal husbandry, and fishery output value Total agricultural machinery power/rural population | Positive Positive |
| Digital labor tools | Number of computers per hundred rural households | Positive | ||
| Number of mobile phones per hundred rural households | Positive | |||
| Intangible labor resources | Agricultural technology innovation | Scientific and technological expenditure/government public financial expenditure × (agricultural, forestry, animal husbandry, and fishery total output value/regional GDP) | Positive | |
| Agricultural R&D funding input intensity | R&D expenditure×(agricultural, forestry, animal husbandry, and fishery total output value/regional GDP) | Positive |
| Variant | Description of Variables | Measurement Method |
|---|---|---|
| Level of government intervention | Gov | General public budget expenditure/gross regional product |
| Level of economic development | Eco | GDP per capita |
| Urbanization level | Urb | Urbanization rate |
| Industrial structure | Ind | Tertiary sector output/secondary sector output |
| Population density level | Pop | Total population/land area of the region |
| Variable | Variable Description | Sample Size | Max | Min | Avg. | S.D. |
|---|---|---|---|---|---|---|
| Dependent Variable | NQPF | 208 | 0.551 | 0.175 | 0.359 | 0.084 |
| Explanatory Variable | LQ | 208 | 1.928 | 0.330 | 1.097 | 0.413 |
| Control Variable | Gov | 208 | 0.199 | 0.079 | 0.133 | 0.027 |
| Eco | 208 | 12.01 | 9.641 | 10.93 | 0.493 | |
| Urb | 208 | 0.763 | 0.367 | 0.580 | 0.096 | |
| Ind | 208 | 1.779 | 0.404 | 1.024 | 0.305 | |
| Pop | 208 | 0.093 | 0.025 | 0.063 | 0.017 |
| Year | Agricultural Industry Clustering | Agricultural New Quality Productive Forces | ||
|---|---|---|---|---|
| 2010 | 0.167 | 1.328 | 0.090 | 1.554 |
| 2011 | 0.167 | 1.349 | 0.137 ** | 2.046 |
| 2012 | 0.200 | 1.521 | 0.136 ** | 2.063 |
| 2013 | 0.251 * | 1.814 | 0.139 ** | 2.116 |
| 2014 | 0.268 * | 1.920 | 0.131 ** | 2.060 |
| 2015 | 0.285 ** | 2.015 | 0.147 ** | 2.168 |
| 2016 | 0.312 ** | 2.181 | 0.180 ** | 2.510 |
| 2017 | 0.306 ** | 2.151 | 0.142 ** | 2.121 |
| 2018 | 0.310 ** | 2.168 | 0.164 ** | 2.324 |
| 2019 | 0.323 ** | 2.254 | 0.153 ** | 2.234 |
| 2020 | 0.315 ** | 2.196 | 0.119 ** | 1.882 |
| 2021 | 0.339 ** | 2.315 | 0.159 ** | 2.270 |
| 2022 | 0.342 ** | 2.327 | 0.100 ** | 1.687 |
| Test Name | Coefficient | Test Name | Coefficient |
|---|---|---|---|
| LM-lag | 17.991 *** | LM-error | 4.680 *** |
| Robust LM-lag | 36.193 *** | Robust LM-error | 22.882 *** |
| LR_Spatial_lag | 34.32 *** | LR_Spatial_error | 34.65 *** |
| Wald_Spatial_lag | 37.51 *** | Wald_Spatial_error | 39.17 *** |
| Time LR test | 384.93 *** | Hausman | 54.87 *** |
| Spatial LR test | 15.97 ** |
| Variable | Coefficient | Variable | Coefficient |
|---|---|---|---|
| LQ | −0.061 ** | W × LQ | −0.127 * |
| Gov | 0.128 | W × Gov | −0.538 |
| Eco | −0.072 ** | W × Eco | 0.168 ** |
| Urb | −0.378 | W × Urb | −0.803 ** |
| Ind | −0.010 | W × Ind | −0.265 ** |
| Pop | 5.046 ** | W × Pop | 12.339 ** |
| ρ | −0.775 *** | R2 | 0.001 *** |
| Variable | Direct Effect | Indirect Effect | Total Effect | |||
|---|---|---|---|---|---|---|
| Coefficient | Z Value | Coefficient | Z Value | Coefficient | Z Value | |
| LQ | −0.056 ** | −2.28 | −0.052 ** | −1.08 | −0.104 ** | −2.11 |
| Gov | 0.138 | 1.05 | −0.112 | −0.46 | 0.027 | 0.10 |
| Eco | −0.091 ** | −3.24 | 0.150 ** | 2.76 | 0.059 | 1.18 |
| Urb | 0.033 | 0.37 | −0.509 ** | −2.00 | −0.477 * | −1.86 |
| Ind | 0.014 | 0.52 | −0.170 ** | −2.38 | −0.155 ** | −2.09 |
| Pop | 4.284 ** | 2.58 | 5.635 * | 1.85 | 9.919 ** | 2.77 |
| Variable | Replacement of Agricultural Industrial Agglomeration Measurement Method | Replacement of Spatial Weight Matrix | ||||
|---|---|---|---|---|---|---|
| Direct Effect | Indirect Effect | Total Effect | Direct Effect | Indirect Effect | Total Effect | |
| LQ | −0.004 ** | −0.007 ** | −0.011 ** | −0.051 ** | −0.058 ** | −0.109 ** |
| Gov | 0.109 | −0.121 | −0.013 | 0.125 | −0.216 | −0.092 |
| Eco | −0.059 ** | 0.190 ** | 0.131 ** | −0.096 ** | 0.218 ** | 0.122 ** |
| Urb | 0.018 | −0.637 ** | −0.619 ** | 0.003 | −0.491 ** | −0.488 ** |
| Ind | −0.019 | −0.184 ** | −0.186 ** | 0.014 | −0.145 ** | −0.131 * |
| Pop | 5.308 ** | 5.534 ** | 10.84 ** | 4.176 ** | 6.465 * | 10.64 ** |
| Variable | Eastern Economic Belt | Central Economic Belt | Western Economic Belt | ||||||
|---|---|---|---|---|---|---|---|---|---|
| Direct Effect | Indirect Effect | Total Effect | Direct Effect | Indirect Effect | Total Effect | Direct Effect | Indirect Effect | Total Effect | |
| LQ | −0.011 ** | −0.173 ** | −0.183 ** | 0.216 *** | 0.095 * | 0.311 ** | −0.111 *** | −0.002 | −0.114 ** |
| Gov | 0.593 ** | −1.960 *** | −1.367 ** | 0.412 *** | −0.267 | 0.145 | 0.402 | −1.526 ** | −1.123 ** |
| Eco | 0.106 ** | 0.020 | 0.126 | 0.293 *** | 0.538 *** | 0.832 *** | −0.095 | −1.148 | −0.243 * |
| Urb | −0.706 ** | −0.020 | −0.727 | −0.216 ** | 0.912 *** | 0.696 ** | 0.658 *** | 0.654 *** | 1.311 *** |
| Ind | 0.023 | 0.083 | 0.106 ** | 0.102 ** | −0.061 | 0.041 | 0.105 ** | 0.164 ** | 0.268 ** |
| Pop | 9.102 ** | −22.84 *** | −13.73 ** | 12.00 *** | 11.69 ** | 23.69 *** | −5.154 | 36.95 *** | 31.80 *** |
Disclaimer/Publisher’s Note: The statements, opinions and data contained in all publications are solely those of the individual author(s) and contributor(s) and not of MDPI and/or the editor(s). MDPI and/or the editor(s) disclaim responsibility for any injury to people or property resulting from any ideas, methods, instructions or products referred to in the content. |
© 2025 by the authors. Licensee MDPI, Basel, Switzerland. This article is an open access article distributed under the terms and conditions of the Creative Commons Attribution (CC BY) license (https://creativecommons.org/licenses/by/4.0/).
Share and Cite
Li, S.; Liu, J.; Guo, W. Empowered or Negative? Research on the Impact of Industrial Agglomeration on the Development of Agricultural New Quality Productive Forces: Evidence from Shandong Province, China. Sustainability 2025, 17, 3348. https://doi.org/10.3390/su17083348
Li S, Liu J, Guo W. Empowered or Negative? Research on the Impact of Industrial Agglomeration on the Development of Agricultural New Quality Productive Forces: Evidence from Shandong Province, China. Sustainability. 2025; 17(8):3348. https://doi.org/10.3390/su17083348
Chicago/Turabian StyleLi, Shoulin, Jianing Liu, and Weiya Guo. 2025. "Empowered or Negative? Research on the Impact of Industrial Agglomeration on the Development of Agricultural New Quality Productive Forces: Evidence from Shandong Province, China" Sustainability 17, no. 8: 3348. https://doi.org/10.3390/su17083348
APA StyleLi, S., Liu, J., & Guo, W. (2025). Empowered or Negative? Research on the Impact of Industrial Agglomeration on the Development of Agricultural New Quality Productive Forces: Evidence from Shandong Province, China. Sustainability, 17(8), 3348. https://doi.org/10.3390/su17083348